growth strategies for gold producers: greg robinson, newcrest mining at mines and money 2013
TRANSCRIPT

Presented at:
www.minesandmoney.com/hongkong

Strategies for Evolving Market ConditionsMines and Money Conference & Exhibition20-22 March 2013, Hong Kong
Greg RobinsonManaging Director and Chief Executive Officer

3
Disclaimer
Forward Looking Statements
These materials include forward looking statements. Often, but not always, forward looking statements can generally be identified by the use of forward looking words such as “may”, “will”, “expect”, “intend”, “plan”, “estimate”, “anticipate”, “continue”, and “guidance”, or other similar words and may include, without limitation, statements regarding plans, strategies and objectives of management, anticipated production or construction commencement dates and expected costs or production outputs.
Forward looking statements inherently involve known and unknown risks, uncertainties and other factors that may cause the company’s actual results, performance and achievements to differ materially from any future results, performance or achievements. Relevant factors may include, but are not limited to, changes in commodity prices, foreign exchange fluctuations and general economic conditions, increased costs and demand for production inputs, the speculative nature of exploration and project development, including the risks of obtaining necessary licenses and permits and diminishing quantities or grades of reserves, political and social risks, changes to the regulatory framework within which the company operates or may in the future operate, environmental conditions including extreme weather conditions, recruitment and retention of personnel, industrial relations issues and litigation.
Forward looking statements are based on the company and its management’s good faith assumptions relating to the financial, market, regulatory and other relevant environments that will exist and affect the company’s business and operations in the future. The company does not give any assurance that the assumptions on which forward looking statements are based will prove to be correct, or that the company’s business or operations will not be affected in any material manner by these or other factors not foreseen or foreseeable by the company or management or beyond the company’s control.
Although the company attempts and has attempted to identify factors that would cause actual actions, events or results to differ materially from those disclosed in forward looking statements, there may be other factors that could cause actual results, performance, achievements or events not to be as anticipated, estimated or intended, and many events are beyond the reasonable control of the company. Accordingly, readers are cautioned not to place undue reliance on forward looking statements. Forward looking statements in these materials speak only at the date of issue. Subject to any continuing obligations under applicable law or any relevant stock exchange listing rules, in providing this information the company does not undertake any obligation to publicly update or revise any of the forward looking statements or to advise of any change in events, conditions or circumstances on which any such statement is based.
Ore Reserves and Mineral Resources Reporting Requirements
As an Australian company with securities listed on the Australian Securities Exchange (“ASX”), Newcrest is subject to Australian disclosure requirements and standards, including the requirements of the Corporations Act and the ASX. Investors should note that it is a requirement of the ASX listing rules that the reporting of ore reserves and mineral resources in Australia comply with the 2004 Edition of the Australasian Code for Reporting of Exploration Results, Mineral Resources and Ore Reserves (the “JORC Code”) and that Newcrest’s ore reserve and mineral resource estimates comply with the JORC Code. As a company listed on the Toronto Stock Exchange (“TSX”), Newcrest is subject to certain Canadian disclosure requirements and standards, including the requirements of National Instrument 43-101 - Standards of Disclosure for Mineral Projects of the Canadian Securities Administrators (“NI 43-101”). In accordance with NI 43-101, Newcrest reports its ore reserves and mineral resources estimates in compliance with the JORC Code, along with a reconciliation to the material differences between the JORC Code and the applicable definitions adopted by the Canadian Institute of Mining, Metallurgy and Petroleum (CIM Definition Standards). In relation to the December 2012 Resources and Reserves Statement, the reconciliation is set out in Newcrest’s Canadian News Release dated 8 February 2013, and is available at www.sedar.com and at Newcrest’s website www.newcrest.com.au. Except as otherwise noted in that document, there are no material differences between the definitions of Measured, Indicated and Inferred Mineral Resources, and Proven and Probable Reserves, under the CIM Definition Standards and the equivalent or corresponding definitions in the JORC Code.
Competent Person’s Statement
The information in this presentation that relates to Exploration Results and other scientific and technical information is based on information compiled by C. Moorhead, EGM Minerals for Newcrest who is a Fellow of The Australasian Institute of Mining and Metallurgy, and a full-time employee of Newcrest. Mr Moorhead has sufficient experience which is relevant to the styles of mineralisation and types of deposits under consideration and to the activity which he is undertaking to qualify as a Competent Person as defined in the JORC Code and is a Qualified Person within the meaning of NI 43-101. Mr Moorhead consents to and has approved the inclusion in this presentation of the matters based on this information in the form and context in which it appears including sampling, analytical and test data underlying the results. For details of exploration reports refer to the Newcrest website at www.newcrest.com.au.
Non-IFRS Financial Information
This presentation uses Non-IFRS financial information including Underlying Profit, EBITDA and EBIT. Underlying Profit is presented to assist in the assessment of the relative performance of the Group. EBITDA and EBIT are used to measure segment performance and have been extracted from the Segment Information disclosed in the ASX Appendix 4D. Non-IFRS information has not been subject to review by Newcrest’s external auditor.

4
Today’s discussion
• Creating value in an evolving market– Cheap resource capture
– Optimise capital committed to growth
– Low cost, predictable production
• Gold markets– Gold price drivers still in place
– Gold vs. Gold Companies
• Newcrest• Focus on gold (copper and silver production)
• SE Asia location
• Concentrated portfolio of mines
• World’s 4th largest Gold Company

5
• Resource project capital expenditure overruns• Larger, long dated project risk
Cheap resource capture
Creating value in an evolving market
Value creation in mining Impacted by current market conditions
Optimise capital investments
Low cost, predictable production
• Negative view on M&A• Investor confidence lower• Backwardation on commodity price forecasts• Focus on returns in short / medium term
• Production reliability has been below par• Company focus on costs and productivity• Many investors short term event focus

6
Resource Industry Focus
• Industry has moved past ‘growth at all costs’
• Large scale M&A on hold (expensive and difficult)– A key test is what you pay for reserve and resource
– Needs to be very cheap, hard to add “operating” value
• Organic growth moderated (deliver existing projects)• Tighten large project capital, deliver to budget, modular approach
• Delay new projects, until price and capital cycle are more obvious
• Exploration focus (early entry, low cost)– Greenfield exploration, more patience and focus
– Increasing brownfield exploration, existing ore body potential
– Drilling becomes cheaper if you have money
Cycle of low price forecast and delayed projects circular impact on future supply

7
Industry cost trends, increases slowing
• Increasing cash costs across the industry– Cost followed revenue, lagged by 12 – 18 months
– Partly due to declining grades across industry
• Exchange rates drive regional differences
Increasing industry cash costs
Source: Thomson Reuters GFMS Gold Mine Economics Service
Relative cost impacted by exchange rates
-250
0
250
500
750
1,000
1,250
1,500
1,750
2,000
0 10 20 30 40 50 60 70 80 90 100
Ca
sh
Co
st
US
$/o
z (n
et
of
by-
pro
du
ct
cre
dit
)
Cumulative Production (Percent)
H1 2012
2006
Average Cash Cost• 2006 US$317/oz• H1 2012 US$727/ozAustralia• Q2/2012 US$868/oz
Source: Thomson Reuters GFMS, Bloomberg
Costs have following higher commodity prices, impacts now slowing
Papua New Guinea
AustraliaPeru
China
Brazil
Canada
Indonesia
USARussia
South Africa
Ghana
-70%
-50%
-30%
-10%
10%
30%
50%
70%
Ap
pre
cia
tion
to U
SD
(2
00
6 to
20
12
)
2012 gold production by country

8
Managing costs, Improving Productivity
• Mining is fixed activity short term, floating cost
• Typical mine cost structure– 40 - 50% labour
– 20 - 30% energy
– 20 - 30% consumables
• Focus is on productivity
• People/training
• Technology
• Lesser focus on cost cutting
• Pressure on contractors/services
• Supply contracts
Focus is on productivity

9
Funding mechanisms for exploration & projects
• Obvious caveats– Size and quality (grade, depth, metallurgy)
– Location (political conditions and remoteness)
– Price projections (revenue)
– Cost competitiveness (cash cost and total cost)
– Capability (technical and organisational)
• Timing always critical
• Approach to current market conditions– Wait (downsize, wait for cycle timing to fund)
– Financial partners (Shrinking, will look for faster returns)
– Find larger partners (expect dilution and control discussion)
– Merge (look for momentum through creation of a larger company)
– Sell (cash out)To maintain activity, alternate funding approaches are required

10
Gold markets

11
Gold price and money supply
• Western economies have loosened monetary policy
• Fundamentals still support a strong gold price– Currency devaluation
– Negative real interest rates
– Inflation, political and economic uncertainty
Source: World Gold Council
Global money supply and gold price
Fundamentals remain for a strong gold price

12
Growing gold demand
• Total gold demand up 50% from 2002 to 2012
• Total value up 850% in the same period
• China and India represent over 60% of global demand
Annual gold demand in tonnes and value 1
Source: Thomson Reuters GFMS, LBMA, World Gold Council
0
50
100
150
200
250
0
1,000
2,000
3,000
4,000
5,000
2002 2003 2004 2005 2006 2007 2008 2009 2010 2011 2012
US$BnTonnes
Gold demand volume Gold demand value
Who is buying
1 Gold demand comprises of jewellery, investment (excl, OTC & other stock flows), technology and official sector net purchases
Source: World Gold Council
India, 864
China, 818Rest of Asia, 230
Middle East, 178
Turkey, 119
Russia, 82
USA, 162 Europe, 318
2012 demand (tonnes)
Gold demand continues growing despite rising price

13
Demand led by investment
• Investments share of demand has grown from 11% to 40% in ten years
• Bar and coin investment growing– Growth in Europe and US as insurance against paper currencies
– Growth in India and China as an investment aligned to growing wealth
Share of gold demand by category
0%
10%
20%
30%
40%
50%
60%
70%
80%
90%
100%
2002 2003 2004 2005 2006 2007 2008 2009 2010 2011 2012
Jewellery Technology Investment
1,908t
428t
1,535t
Source: Thomson Reuters GFMS, World Gold Council
Bar and coin investment particularly strong
Source: Thomson Reuters GFMS, World Gold Council
-200
0
200
400
600
800
1000
1200
2002 2003 2004 2005 2006 2007 2008 2009 2010 2011 2012
Tonnes
Europe USA India China
Bars and coins leading the investment story

14
Supply history
• Mine production growing slowly– 1.4% annual increase in production
between 1989 and 2011
– Declining grades
– Higher costs
– Discoveries rate continue to decline
Decline in hedging (2002) and official sector sales (2008)
Scrap sales increase as prices rise
0500
100015002000250030003500400045005000
198
9
199
0
199
1
199
2
199
3
199
4
199
5
199
6
199
7
199
8
199
9
200
0
200
1
200
2
200
3
200
4
200
5
200
6
200
7
200
8
200
9
201
0
201
1
tonnes
Mine production Official sector sales Old gold scrap Net hedge & other
Changes in supply mix
Source: Thomson Reuters GFMS
Growth in mine production continues

15
Getting harder to find and slower to develop
Source: MEG Strategies for Gold Reserves Replacement
Exploration cost 1 and number of discoveries 2 Increasing time to develop
0
5
10
15
20
25
Ye
ars
fro
m D
isc
ove
ry t
o
Pro
du
cti
on
1 Exploration budget = Grassroots + 75% of late-stage budgets2 Major discoveries = Resources + past production > 2Moz Au (or >1Moz defined reserves)
• Discoveries are getting more difficult– Higher exploration cost for each discovery
– Fewer, smaller discoveries each year
– Taking longer to bring to production
0
3
6
9
12
15
18
0
1,000
2,000
3,000
4,000
5,000
6,000
Dis
co
veri
es
Ex
plo
rati
on
Bu
dg
et
(US
$m
)
Number of Discoveries Exploration Budgets
Source: MEG Strategies for Gold Reserves Replacement
Future supply under pressure

16
Industry correlation to gold price
• Gold equities performed poorly in 2012– S&P/TSX gold index down 24%1
– Key factors include: poor M&A, overspend on projects, missed production guidance
Gold producers now focussed on value and cash flow, not production growth– Expect improved discipline
Source: Bloomberg
1 Year to December 2012
1.00 1.00
0.570.64
0.78
-0.20
0.00
0.20
0.40
0.60
0.80
1.00
1.20
Gold spot$/oz
SPDR goldtrust
S&P/TSXglobal gold
index
FTSE goldmines index
Phili gold &silver index
10 years to December 2012
1.00 1.000.87 0.82 0.84
-0.20
0.00
0.20
0.40
0.60
0.80
1.00
1.20
Gold spot$/oz
SPDR goldtrust
FTSE goldmines index
S&P/TSXglobal gold
index
Phili gold &silver index
Source: Bloomberg
1 Measured over 12 months to 31 August 2012
Gold industry will correlate to gold price over time

17
Newcrest Mining
Telfer
Gosowong
Lihir Is
Cadia Valley
Wafi-GolpuTandai
Manus Is
Gold Equivalent Resource
Bonikro
Namosi JV
Hidden Valley
• 4th largest global gold producer1
• 6 production assets in 4 countries, primarily Australia and Asia Pacific
• Gold production 2.3 – 2.5Moz2
• Copper production 75 – 85kt2
• Reserve life of >40 years
• Workforce 19,000+
+50Moz
20-50Moz
0-20Moz
1 By market capitalisation2 FY13 production guidance.
• Long life, low cost, moderate growth
• Australia, SE Asia focus
• Unhedged, low gearing, dividend growth
• Focus on early stage resources
• People & technical capability focus
• Management incentives ROCE, reserve growth, and cost position
Newcrest in a snapshot
Newcrest strategy

18
Key themes for Newcrest
• Drive performance from existing assets– Ramp up and optimise high margin assets
– Lift return from existing assets
– Technology and people capability focus
– Increase productivity
– Strong focus on cost reduction
• Capital reduction– Investments in growth largely completed
– Minimise future investment until cycle trend becomes clearer
– Entering period of strong free cash flow generation
• Grow shareholder returns

19
Long reserve life, concentrated focus
• Long reserve life in the industry
• Concentration of high quality assets
• Brownfield focus continues to deliver upside
Reserve life (years) Number of Mine Provinces
Percentage of Mine Provinces in “Top 30” Mines
31
17 17
7
Barrick Newmont Goldcorp Newcrest
Source: Intierra; Minimum 40% holding, at least one project at mine must be pre-feasibility or concept
42
28
20 19
Newcrest Goldcorp Newmont Barrick
Source: company filings December 2012
43%
29%24%
16%
Newcrest Goldcorp Newmont Barrick
Source: Intierra; Top 30 NPV basis from BMO Equity Research at 5% discount rate and street consensus pricing; current as of 8-Jan-2013

20
Near term growth from past investment
5-year production growth of 35% to 50%
• CAGR = 5 to 10% per annum
• Past investments drive future growth
– Cadia East = 30 to 40% of 5 year growth
– Lihir = 50 to 70% of 5 year growth
– Other growth option studies continue
5-year production growth of 20% to 30%
• CAGR = 5 to 7% per annum
• Cadia East ramp-up delivers growth
• Telfer production declines to 25ktpa from FY14
As provided in August 2012 market guidance
2012 2013 2017
2012 2013 2017
2.29Moz
5% to 10%
growth per year
76kt
5% to7%
growth per year
2.3Mozto
2.5Moz
75ktto
85kt
Gold Production
Copper Production
21
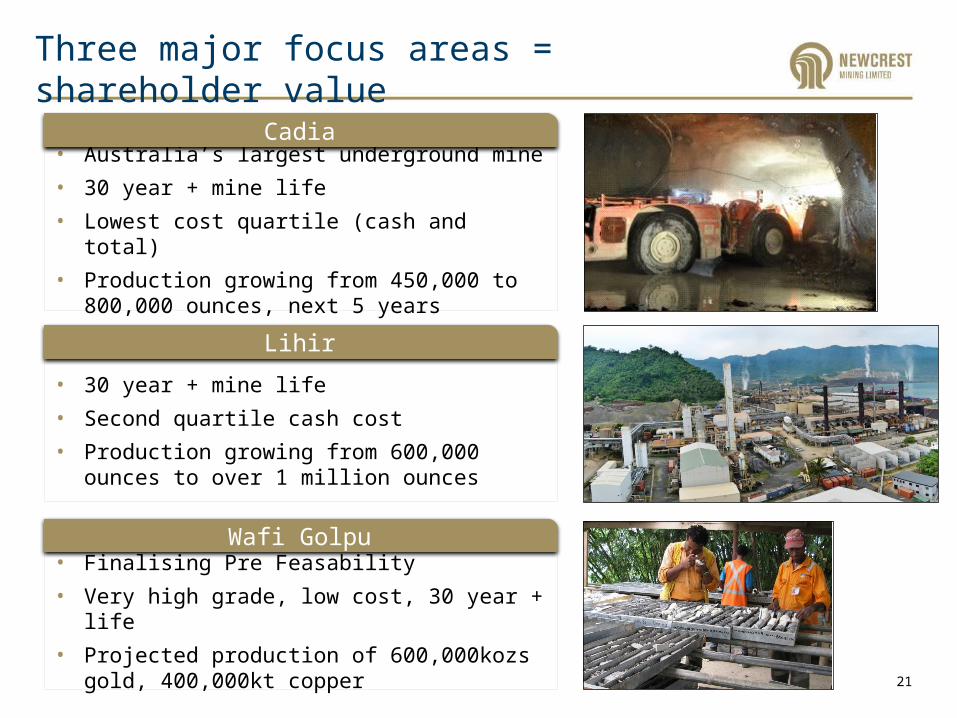
Three major focus areas = shareholder value
• 30 year + mine life
• Second quartile cash cost
• Production growing from 600,000 ounces to over 1 million ounces
• Finalising Pre Feasability
• Very high grade, low cost, 30 year + life
• Projected production of 600,000kozs gold, 400,000kt copper
• Australia’s largest underground mine
• 30 year + mine life
• Lowest cost quartile (cash and total)
• Production growing from 450,000 to 800,000 ounces, next 5 years
Cadia
Lihir
Wafi Golpu

22
0
200
400
600
800
1000
1200
0
10
20
30
40
50
60
FY05 FY06 FY07 FY08 FY09 FY10 FY11 FY12 FY13S
tatu
tory
Pro
fit
(A$M
)
Div
ide
nd
(cp
s)
Interim Dividend Final Dividend
Special Dividend FY Statutory Profit
Interim dividend maintained
Dividend growth
FY13 Interim dividend of 12cps
(unfranked)
Increasing payout ratio
Objective is to grow profit and cash flow, maintain a conservative balance sheet, spend within means, and return cash to shareholders via ordinary and special dividends
11% 12%10% 9%
15% 16%
20%
25%
29%
FY05 FY06 FY07 FY08 FY09 FY10 FY11 FY12 1HFY13
34% including special dividend
interim
Calculated as DPS divided by EPS (underlying)

23
Conclusion
• Creating value in today’s market – Cheap resource capture
– Optimised growth, limited capital
– Low cost, predictable production
• Gold markets– Fundamentals support a strong gold price
– Growing demand for investment
– Future supply under pressure
– Increasing costs
• Key Newcrest themes– Drive performance from existing assets
– Grow shareholder returns
– Set up future growth options

Save the Date for Mines and Money Hong Kong 2014March 24-28, 2014 - Hong Kong Convention & Exhibition Centre
www.minesandmoney.com/hongkongRegister your Interest at: