growth reinforcing composite materials from liquidus …cdn.intechweb.org/pdfs/16697.pdf · growth...
TRANSCRIPT
1
Growth Reinforcing Composite Materials from Liquidus Phase: Mechanical and Microstructural
Parameters Relationship Essentially Evincing the Predominance of an Akin Mass Composition
over the Domain of Compositions
B.L. Sharma and Parshotam Lal Department of Chemistry, University of Jammu
India
1. Introduction
Composite materials are heterogeneous systems consisting of two or more physically distinct and mechanically separable materials belonging to different space groups, and are in equilibrium with a single liquidus phase. The essence of composite materials lies in the concept that their properties must essentially be superior, and possibly unique in some specific respects, to those of the constituent phases, particularly if these are geometrically oriented to one another in some periodic or anisotropic manner (Sharma et al., 2008, 2009). Composite materials designed by anisotropic growth process, can offer advanced possibilities as reinforced materials for the constructions and further development of supersonic aircraft, space vehicles, high pressure tanks, for which strength properties are required that cannot be provided by the existing homogeneous materials (Ashbee & Woishnis, 1993). Besides mechanical fields, these materials are equally promising in a variety of other fields (Hull & Clyne, 2006). For example, most metallic permanent magnets are made of alnico alloys, obtained by unidirectional solid-state decomposition under cooling conditions in an applied magnetic field. The rod composite structure of quasi binary NiSb-InSb (Caram et al., 1990) obtained by unidirectional solidification from its homogeneous eutectic melt, finds a representative example in electronics. Currently, the femoral stem is constructed from Co-Cr-Mo, Co-Ni-Cr-Mo and Ti-Al-V alloys (Callister, 2006; Mallick, 1993 & Pillar, 1984) in preference to stainless steels. The advantages of composite materials appear when the specific modulus (modulus per unit weight) and specific strength (strength per unit weight) are considered. The higher specific modulus and specific strength of composite materials means that the weight of constituent phases can be reduced (Callister, 2006 & Courtney, 2000). This is a factor of greater importance in moving constituent phases in all forms of transport where reductions in weight result in greater efficiency and energy savings (Callister & Rethwisch, 2008). The essence of anisotropic growth applied to composite materials is the ability to put strong stiff fibers in the right place, in the right orientation with right volume fraction. Implicit in the present searching approach is the concept that while in designing the composite material by variable anisotropic growth, the solidification aspect is also related to discover the final
www.intechopen.com
Metal, Ceramic and Polymeric Composites for Various Uses
4
product as an acceptable analog for manufacturing the engineering product. Because of the complex nature of the phenomena involved in an anisotropic growth process from the melt, a considerable judgment is required to assess both theoretical and experimental observations, since the composite materials that can be developed by this process exhibit a large diversity of micro-morphologies. However, a physical understanding of the mechanical properties of composite materials as a basis for the improvement of the properties by controlling the growth rates from the melt can readily be distinguished when examined in an optical or electronic microscope. In view of watching the growth process visually, binary organic eutectic systems being transparent are a most suitable option for investigation, since metals are opaque and the observations had to be made on external surfaces. A very interesting finding of the current investigation is an akin mass composition (the composition whereat masses of the constituent members would almost overlap each other) that predominates the domain of compositions, since anisotropic mechanical parameters obeying the Weibull probability distribution curve evince the predominance, particularly at moderate anisotropic growth rate. Likewise, of greater interest is the moderate anisotropic growth in the domain of solidification modes as the modal products structured by the growth process comprise microstructures which are three-to-four fold superior in mechanical strength to their isotropic growth performed in an ice bath (273 K) and many fold to their respective individual components irrespective of the growth pattern. Vickers microhardness offers supporting evidence to the essence of an identical form of the Weibull distribution curve demonstrating the strength-growth relationship. The liquidus structure encompassing the entire composition of binary organic eutectic systems is characterized by rheological view point comprising of viscosity and surface tension measurements at different temperatures, which manifests specific interactions occurring in the eutectic compositional melt that are complimentary supported by thermodynamic analysis in terms of excess functions. The experimental data on kinetics and anisotropic crystal growth from the melt verify nucleation theory and evince the essence of dislocation mechanism. Thermal and X-ray diffraction studies of binary composite materials are accomplished in order to ascertain thermal stability, purity, composition, enthalpies of fusion and mechanical combination of homogeneous materials. A series of binary organic eutectic systems, viz., naphthalene-o-nitrophenol; ┙-naphthol-naphthalene; diphenylamine-┙-naphthol; benzil-diphenyl; benzoic acid-benzamide; benzoic acid-naphthalene; naphthalene-phenanthrene; ┙-naphthylamine-diphenylamine and binary metallic eutectic systems, namely, Sn-Cd; Cd-Bi; Pb-Sn and Pb-Bi, were selected for the investigation. The choice of homogeneous materials in aforementioned systems is restricted to the methodical considerations: low temperatures of melting, purity and the possibility of precisely controlling and measuring temperatures.
2. Experimental details
2.1 Materials and methodology A great precautious care was taken to the selection of utmost pure homogeneous materials, since organic materials are less pure and even small portion of soluble impurities can essentially influence the crystal growth. Consequently, preference was given to analytical reagent, especially of The British Drug House Limited and Merck for 99.9% pure organic materials (naphthalene, o-nitrophenol, ┙-naphthol, diphenylamine, benzil, diphenyl, benzoic acid, benzamide, phenanthrene and ┙-naphthylamine) and Alfa Aesar for 99.999%
www.intechopen.com
Growth Reinforcing Composite Materials from Liquid Phase: Mechanical and Microstructural Parameters Relationship Essentially Evincing the Predominance of an Akin Mass Composition…
5
pure metals (Pb, Sn, Bi and Cd). The melting temperatures and enthalpies of fusion of the experimental homogeneous materials were determined by thaw-melt technique and thermal analysis (DSC Linseis STA PT-1000) and found consistent with the literal values (Lide, 2009).
2.2 Diagrams of state Mixtures of the constituent materials were prepared covering the whole of the mole fraction composition range (binary organic systems) and weight percent composition converted into mole fraction composition range (binary metallic systems). The homogeneity in mixtures was ascertained by heat-chill method. The solidus-liquidus equilibrium curves of binary organic systems were studied by thaw-melt method, while those of binary metallic systems by thermal analysis.
2.3 Heterogeneous nucleation Nucleation studies of binary organic systems being transparent in nature were performed following the procedure referred earlier (Sharma et al., 2004a). A nearly constant amount (4.0 g) of each composition of the systems was carefully taken into different pyrex tubes of uniform internal diameters. The sample tubes were sealed and successively undertaken for spontaneous nucleation observations in a paraffin bath manipulated at the temperature ~30K higher than the melting temperature of each specimen. The bath temperature attained by the tube was ensured by thermometric technique before cooling process for spontaneous crystallization. The melt-nucleation process for each sample tube was recycled for several observations (minimum six runs) necessary in comparative estimate of undercooling. Maximum care was taken to perform undercooling experiments for different compositional melts under almost identical conditions by keeping the volume of the melt and the rate of cooling nearly the same in all the cases.
2.4 Anisotropic growth velocity The experimental technique for determining the anisotropic growth velocity from different compositional melts of binary organic systems was similar to that adopted earlier (Sharma, 2003). The velocity of anisotropic growth from a definite compositional melt was measured in a transverse direction along the length 10 X 10-2 m and internal diameter of 6 X 10⁻² m of the pyrex tube with terminal right-angled bends. The experimental tube was placed in a paraffin thermostat kept constant to ±0.01 K for experimental observations at several degrees of undercooling. The rate of advance of the crystal boundary was recorded by stop watch. Several observations (minimum six runs) of anisotropic growth velocity were recorded for each compositional melt at the selected experimental supercooling. The results are found less accurate from the eutectic melts of each system, since within the observation time the growing crystal front moved only a very small distance which could not be ascertained very accurately.
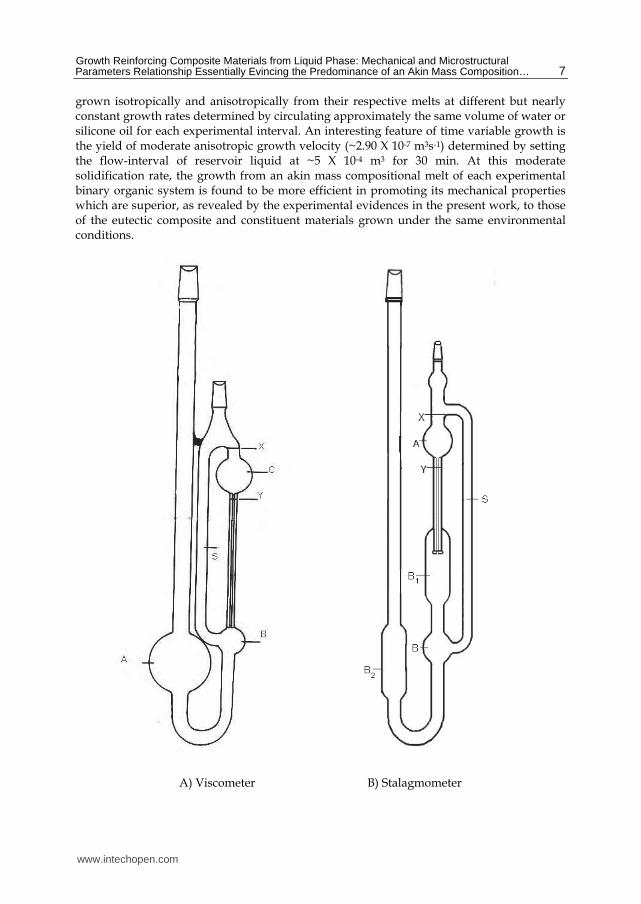
2.5 Rheological measurements Viscosities of different compositional melts representing the complete mole fraction composition range of each binary organic system, were measured relative to the literal viscosity values of reference liquid p-xylene (Lide, 2009) in a paraffin bath with an accuracy of ±0.05 K in the temperature range 391-408 K. The viscometer employed for the purpose was modified as shown in Fig.A. Likewise, an attempt was made for the first time to
www.intechopen.com
Metal, Ceramic and Polymeric Composites for Various Uses
6
measure surface tension of binary ┙-napthylamine-diphenylamine eutectic melt system related to the reference liquid p-xylene (Lide, 2009 & Edward, 1930) in the aforementioned bath in the temperature range 323-373 K using modified stalagmometer (Fig.B) compatible with the suitability of the experiment. The viscometer and stalagmometer are essentially modified by the side tube ‘S’ connecting the bulb ‘B’ right below the capillary of the viscometer to its upper mark ‘X’, and the bulb ‘B’ of the stalagmometer to the upper mark ‘X’ in the light of the following: i. the excess pressure of the melt increasing the kinetic energy of the flow is made to
escape through the side tube ‘S’ leaving the experimental volume of the melt to flow freely down the capillary under its own gravity. This minimizes kinetic energy correction.
ii. the bulb ‘B’ is an important component of the viscometer in connection with the elimination of upward thrust due to surface tension which could resist the free flow of the melt. The bulb ‘B1’ of the stalagmometer would also overcome in nipping the resistance.
iii. the advantage of the modified stalagmometer over other stalagmometer lies in the concept that the relative surface tension measurements of low temperature solid materials in general and binary or ternary solid mixtures in particular can easily be undertaken at different temperatures in an air oven or a suitable bath to assess the specific interactions in their respective melts’ surface.
2.6 Growth technique 2.6.1 Anisotropic crystal form Pyrex tubes of nearly the same dimensions were selected as dies to achieve anisotropic rod form of crystals from different compositional melts in the following experimental setup. An experimental pyrex tube containing half-full melt of freshly prepared eutectic or non-eutectic phase, was vertically clamped to the centre of an empty graduated beaker (volume capacity 1dm3) arranged in an oven set at a temperature ~30 K higher than the melting temperature of the experimental specimen. The molten mass was nucleated by circulating water in case of organic melt, and silicone oil in case of metallic melt from their respective reservoirs manipulated to perforate at ~300 K. The melt in the tube started nucleating when the rising level of water or silicone oil as the case may be, just touched the bottom of the tube creating sharp temperature gradient at the solidus-liquidus interface that resulted in the occurrence of melt-growth process anisotropically towards longitudinal direction along the length of the tube. In this manner, each compositional melt in a separate pyrex tube was grown to crystal form at 18 different intervals in the experimental time range 5-45 min. The crystal sample grown anisotropically was removed from an experimental pyrex tube by warming its section in both longitudinal and transverse directions just to glide the solidus mass to its easier exit.
2.6.2 Isotropic crystal form Nuclei of critical size almost grew out instantaneously in all directions when a pyrex tube containing the melt at ~30 K higher than its freezing temperature was dropped vertically into an ice bath maintained at ~273 K. This particular mode of solidification is presumed to be time independent and thereby zero order reference growth. The solidified crystal from the tube was removed following the aforementioned procedure. A good many crystal samples of eutectic and akin mass eutectic compositions, and the constituent materials were
www.intechopen.com
Growth Reinforcing Composite Materials from Liquid Phase: Mechanical and Microstructural Parameters Relationship Essentially Evincing the Predominance of an Akin Mass Composition…
7
grown isotropically and anisotropically from their respective melts at different but nearly constant growth rates determined by circulating approximately the same volume of water or silicone oil for each experimental interval. An interesting feature of time variable growth is the yield of moderate anisotropic growth velocity (~2.90 X 10⁻⁷ m3s-1) determined by setting the flow-interval of reservoir liquid at ~5 X 10⁻⁴ m3 for 30 min. At this moderate solidification rate, the growth from an akin mass compositional melt of each experimental binary organic system is found to be more efficient in promoting its mechanical properties which are superior, as revealed by the experimental evidences in the present work, to those of the eutectic composite and constituent materials grown under the same environmental conditions.
A) Viscometer B) Stalagmometer
www.intechopen.com
Metal, Ceramic and Polymeric Composites for Various Uses
8
2.7 Mechanical test 2.7.1 Macrorupture test The experimental samples after dimensions’ ascertainment were subsequently subjected to tensile, modulus of rupture (flexural) and compressive tests in a VEB Thuringer Industrie Werk Rauenstein tensometer where a steadily increasing load would determine the rupture force of a crystal specimen until it shows least resistance. These tests were performed visually watching the fracture process. Though the tests are of conventional nature, yet can be related also to the macro scale, particularly relevant to engineering products.
2.7.2 Microdeformation test Metallic systems are suitable materials for micro hardness testing because of atomically rough surfaces. Indentations were induced on selected points chosen diagonally on an ansiotropically or isotropically grown specimen at room temperature (~300 K) using Vickers microhardness tester attached to an incident-light metallurgical research microscope (Neophot-2) in the applied load range 10 X 10-2 - 100 X 10-2 N. For each test, a very small diamond indenter having pyramidal geometry was forced into the surface of the specimen at room temperature and the size of the indent was found growing with rising applied load.
2.8 Microscopic studies 2.8.1 Optical microscopic examination The micro-slides of binary organic eutectic and akin mass composite phases grown anisotropically and isotropically were examined in a polarizing microscope to view the growth habits of crystallites which were later photographed.
2.8.2 Electron microscope examination The metallic specimens grown isotropically and anisotropically were polished at room temperature by following the procedure referred in connection with the analogous problem (Caram et al., 1991). A thin layer of a specimen etched in ferric chloride was mounted on stub with gold coated holder and examined in a scanning electron microscope (Jeol T-330) for microgrowth observations. Several grown samples of eutectic and akin mass eutectic composites were viewed in this manner and the growth habits acquired by the growing eutectic phases during solidification process at different growth rates were photographed.
2.9 X-ray diffraction (XRD) studies X-ray diffraction patterns of eutectics and non-eutectics were scanned in a Rigaku X-ray diffractometer with Cu K┙ radiation of wave length 1.540 A0 at room temperature to reveal their nature of combination.
3. Observations
The experimental evidences offer convincing similarity among binary organic systems in physical behavior and characterization. Metallic systems Sn-Cd and Pb-Sn also exhibit alike behavior with distinct morphology (regular) from that (complex regular) of Cd-Bi and Pb-Bi systems. In view of physical habits’ resemblance of the systems, two representative examples, namely, naphthalene–o-nitrophenol from organic systems and Sn-Cd from metallic systems shall be the main components revealing the objectivity of the work. The melting temperatures of their constituent materials are recorded in Table1, also containing
www.intechopen.com
Growth Reinforcing Composite Materials from Liquid Phase: Mechanical and Microstructural Parameters Relationship Essentially Evincing the Predominance of an Akin Mass Composition…
9
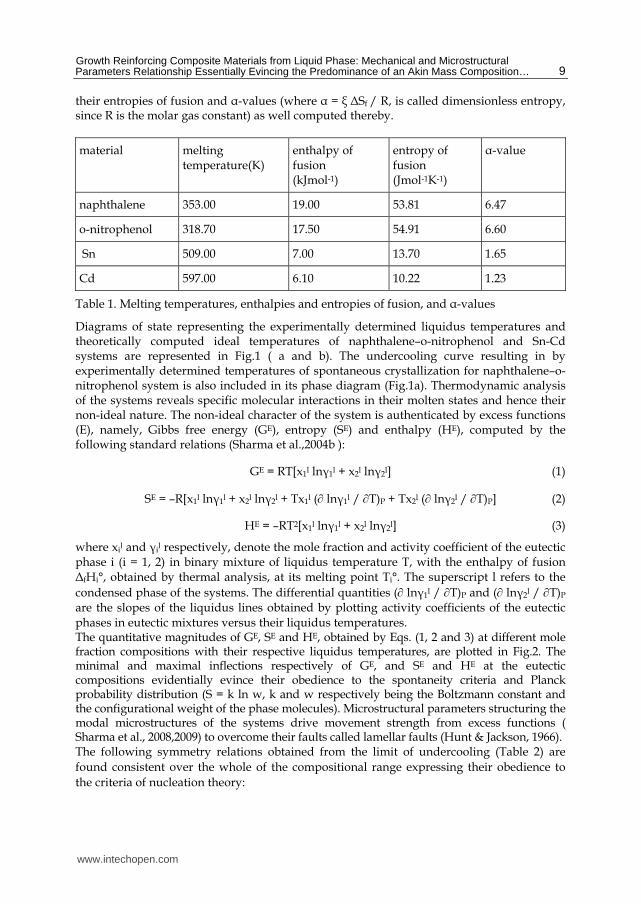
their entropies of fusion and ┙-values (where ┙ = ξ ΔSf / R, is called dimensionless entropy, since R is the molar gas constant) as well computed thereby.
material melting temperature(K)
enthalpy of fusion (kJmol-1)
entropy of fusion (Jmol-1K-1)
┙-value
naphthalene 353.00 19.00 53.81 6.47
o-nitrophenol 318.70 17.50 54.91 6.60
Sn 509.00 7.00 13.70 1.65
Cd 597.00 6.10 10.22 1.23
Table 1. Melting temperatures, enthalpies and entropies of fusion, and ┙-values
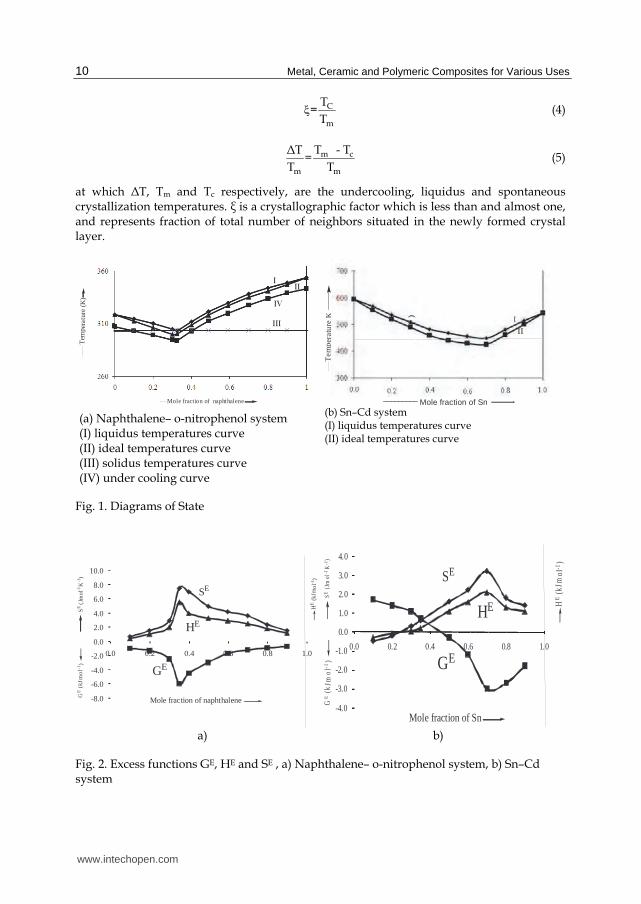
Diagrams of state representing the experimentally determined liquidus temperatures and theoretically computed ideal temperatures of naphthalene–o-nitrophenol and Sn-Cd systems are represented in Fig.1 ( a and b). The undercooling curve resulting in by experimentally determined temperatures of spontaneous crystallization for naphthalene–o-nitrophenol system is also included in its phase diagram (Fig.1a). Thermodynamic analysis of the systems reveals specific molecular interactions in their molten states and hence their non-ideal nature. The non-ideal character of the system is authenticated by excess functions (E), namely, Gibbs free energy (GE), entropy (SE) and enthalpy (HE), computed by the following standard relations (Sharma et al.,2004b ):
GE = RT[x1l ln┛1l + x2l ln┛2l] (1)
SE = –R[x1l ln┛1l + x2l ln┛2l + Tx1l ( ln┛1l / T)P + Tx2l ( ln┛2l / T)P] (2)
HE = –RT2[x1l ln┛1l + x2l ln┛2l] (3)
where xil and ┛il respectively, denote the mole fraction and activity coefficient of the eutectic phase i (i = 1, 2) in binary mixture of liquidus temperature T, with the enthalpy of fusion ΔfHi°, obtained by thermal analysis, at its melting point Ti°. The superscript l refers to the condensed phase of the systems. The differential quantities ( ln┛1l / T)P and ( ln┛2l / T)P are the slopes of the liquidus lines obtained by plotting activity coefficients of the eutectic phases in eutectic mixtures versus their liquidus temperatures. The quantitative magnitudes of GE, SE and HE, obtained by Eqs. (1, 2 and 3) at different mole fraction compositions with their respective liquidus temperatures, are plotted in Fig.2. The minimal and maximal inflections respectively of GE, and SE and HE at the eutectic compositions evidentially evince their obedience to the spontaneity criteria and Planck probability distribution (S = k ln w, k and w respectively being the Boltzmann constant and the configurational weight of the phase molecules). Microstructural parameters structuring the modal microstructures of the systems drive movement strength from excess functions ( Sharma et al., 2008,2009) to overcome their faults called lamellar faults (Hunt & Jackson, 1966). The following symmetry relations obtained from the limit of undercooling (Table 2) are found consistent over the whole of the compositional range expressing their obedience to the criteria of nucleation theory:
www.intechopen.com
Metal, Ceramic and Polymeric Composites for Various Uses
10
C
m
T=
T (4)
m c
m m
T - TΔT=
T T (5)
at which ΔT, Tm and Tc respectively, are the undercooling, liquidus and spontaneous crystallization temperatures. ξ is a crystallographic factor which is less than and almost one, and represents fraction of total number of neighbors situated in the newly formed crystal layer.
Mole fraction of naphthalene
Tem
p era
ture
(K)
III
III
IV
Mole fraction of Sn_________
Tem
p era
ture
KI
II
(a) Naphthalene– o-nitrophenol system (I) liquidus temperatures curve (II) ideal temperatures curve (III) solidus temperatures curve (IV) under cooling curve
(b) Sn–Cd system (I) liquidus temperatures curve (II) ideal temperatures curve
Fig. 1. Diagrams of State
-8.0
-6.0
-4.0
-2.0
0.0
2.0
4.0
6.0
8.0
10.0
0.0 0.2 0.4 0.6 0.8 1.0
SE
(Jm
ol-1
K-1
)G
E(k
Jmo
l-1)
SE
HE
GE
Mole fraction of naphthalene
HE
(kJm
ol-1
)
-4.0
-3.0
-2.0
-1.0
0.0
1.0
2.0
3.0
4.0
0.0 0.2 0.4 0.6 0.8 1.0
SE(J
mol
-1K
-1)
GE
(kJm
ol-1
)
SE
HE
GE
HE
(kJm
ol-1
)
Mole fraction of Sn a) b)
Fig. 2. Excess functions GE, HE and SE , a) Naphthalene– o-nitrophenol system, b) Sn–Cd system
( )
www.intechopen.com
Growth Reinforcing Composite Materials from Liquid Phase: Mechanical and Microstructural Parameters Relationship Essentially Evincing the Predominance of an Akin Mass Composition…
11
mole fraction of
naphthalene
liquidus temperature
Tm (K)
temperature of spontaneous
crystallization Tc (K)
maximum undercooling ∆T=(Tm– Tc) (K)
ξ mT
Tc
mT
T x10-2
0.0 318.70 307.20 11.50 0.96 3.61 0.1 315.20 303.10 12.10 0.97 3.84 0.2 311.70 299.00 12.65 0.96 4.06 0.3 304.70 294.70 10.00 0.97 3.28
0.33(e*): 303.70 293.20 10.50 0.97 3.46 0.4 313.70 304.70 9.00 0.97 2.87 0.5 321.20 312.40 8.80 0.97 2.74 0.6 329.70 319.80 9.90 0.97 3.00 0.7 339.90 327.70 12.20 0.97 3.59 0.8 343.20 333.70 9.50 0.97 2.77 0.9 348.70 339.10 9.60 0.97 2.75 1.0 353.50 343.70 9.80 0.97 2.77
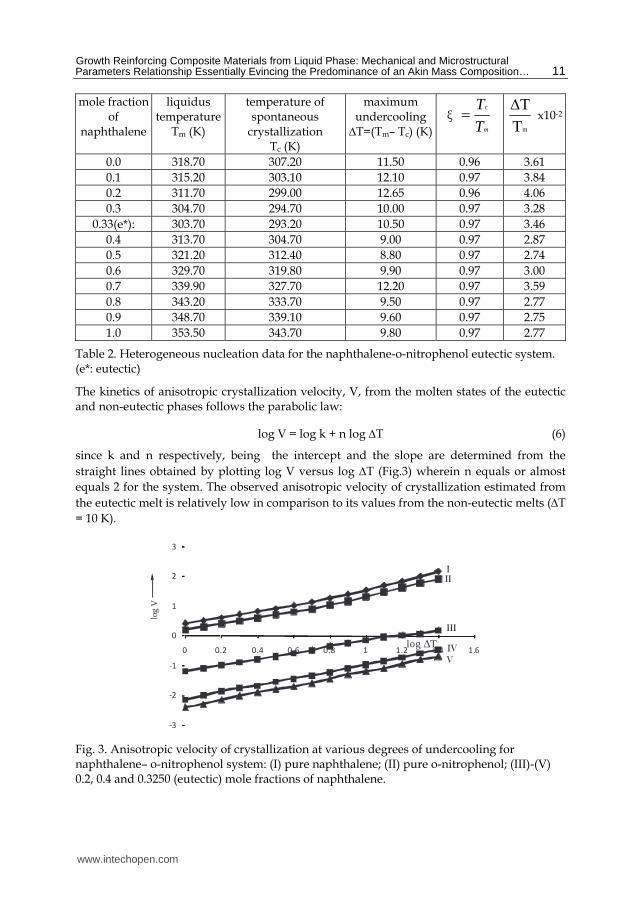
Table 2. Heterogeneous nucleation data for the naphthalene-o-nitrophenol eutectic system. (e*: eutectic)
The kinetics of anisotropic crystallization velocity, V, from the molten states of the eutectic and non-eutectic phases follows the parabolic law:
log V = log k + n log T (6)
since k and n respectively, being the intercept and the slope are determined from the straight lines obtained by plotting log V versus log T (Fig.3) wherein n equals or almost equals 2 for the system. The observed anisotropic velocity of crystallization estimated from the eutectic melt is relatively low in comparison to its values from the non-eutectic melts (T = 10 K).
‐3
‐2
‐1
0
1
2
3
0 0.2 0.4 0.6 0.8 1 1.2 1.4 1.6
log
V
log T
I
II
III
IV
V
Fig. 3. Anisotropic velocity of crystallization at various degrees of undercooling for naphthalene– o-nitrophenol system: (I) pure naphthalene; (II) pure o-nitrophenol; (III)-(V) 0.2, 0.4 and 0.3250 (eutectic) mole fractions of naphthalene.
www.intechopen.com
Metal, Ceramic and Polymeric Composites for Various Uses
12
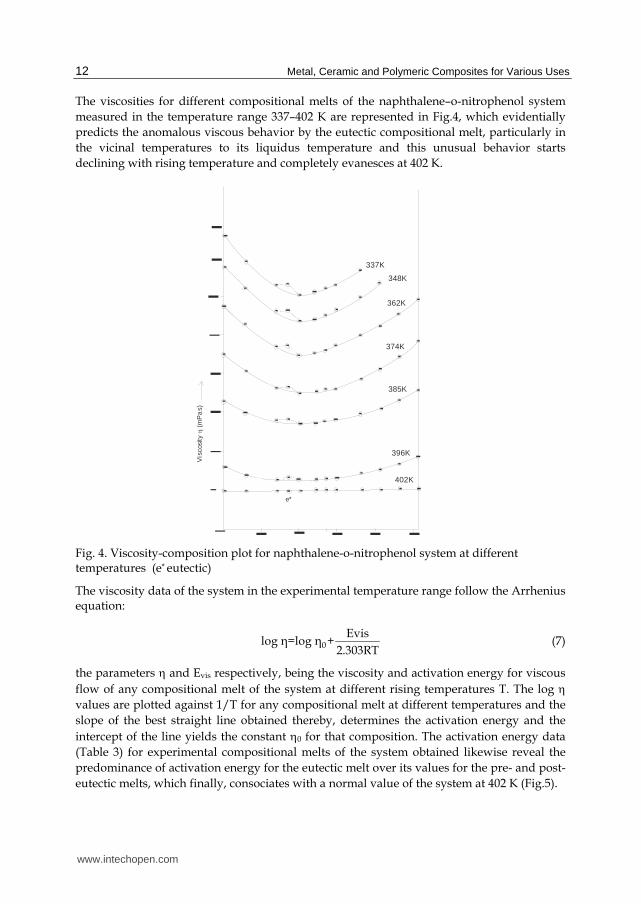
The viscosities for different compositional melts of the naphthalene–o-nitrophenol system measured in the temperature range 337–402 K are represented in Fig.4, which evidentially predicts the anomalous viscous behavior by the eutectic compositional melt, particularly in the vicinal temperatures to its liquidus temperature and this unusual behavior starts declining with rising temperature and completely evanesces at 402 K.
Vis
cosi
ty
(mP
as)
337K
348K
374K
385K
396K
402K
362K
e*
Fig. 4. Viscosity-composition plot for naphthalene-o-nitrophenol system at different temperatures (e* eutectic)
The viscosity data of the system in the experimental temperature range follow the Arrhenius equation:
0Evis
log η=log η +2.303RT
(7)
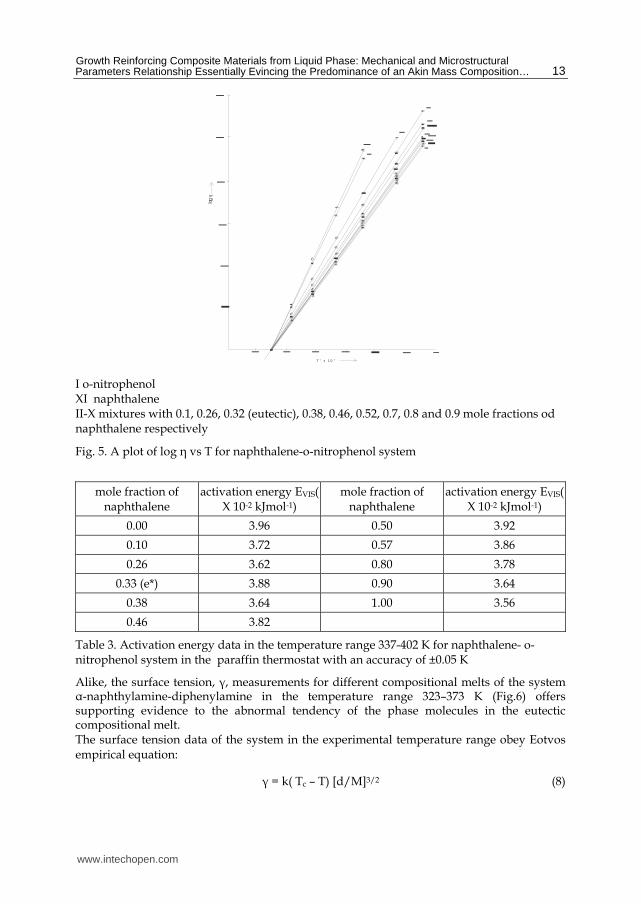
the parameters and Evis respectively, being the viscosity and activation energy for viscous flow of any compositional melt of the system at different rising temperatures T. The log values are plotted against 1/T for any compositional melt at different temperatures and the slope of the best straight line obtained thereby, determines the activation energy and the intercept of the line yields the constant 0 for that composition. The activation energy data (Table 3) for experimental compositional melts of the system obtained likewise reveal the predominance of activation energy for the eutectic melt over its values for the pre- and post-eutectic melts, which finally, consociates with a normal value of the system at 402 K (Fig.5).
www.intechopen.com
Growth Reinforcing Composite Materials from Liquid Phase: Mechanical and Microstructural Parameters Relationship Essentially Evincing the Predominance of an Akin Mass Composition…
13
log
T x 1 0- 1 3
I o-nitrophenol XI naphthalene II-X mixtures with 0.1, 0.26, 0.32 (eutectic), 0.38, 0.46, 0.52, 0.7, 0.8 and 0.9 mole fractions od naphthalene respectively
Fig. 5. A plot of log η vs T for naphthalene-o-nitrophenol system
mole fraction of
naphthalene activation energy EVIS(
X 10-2 kJmol-1) mole fraction of
naphthalene activation energy EVIS(
X 10-2 kJmol-1)
0.00 3.96 0.50 3.92
0.10 3.72 0.57 3.86
0.26 3.62 0.80 3.78
0.33 (e*) 3.88 0.90 3.64
0.38 3.64 1.00 3.56
0.46 3.82
Table 3. Activation energy data in the temperature range 337-402 K for naphthalene- o-nitrophenol system in the paraffin thermostat with an accuracy of ±0.05 K
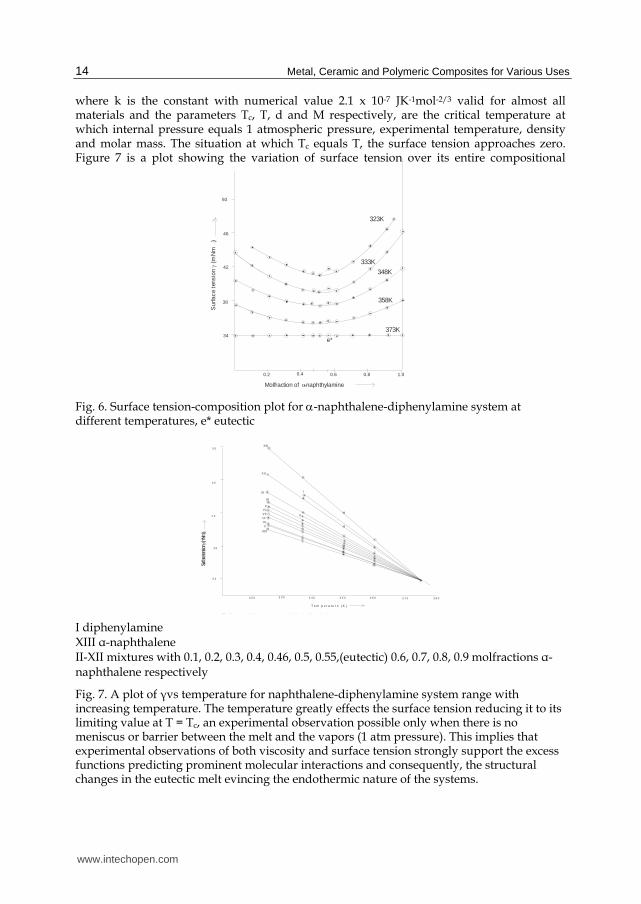
Alike, the surface tension, ┛, measurements for different compositional melts of the system ┙-naphthylamine-diphenylamine in the temperature range 323–373 K (Fig.6) offers supporting evidence to the abnormal tendency of the phase molecules in the eutectic compositional melt. The surface tension data of the system in the experimental temperature range obey Eotvos empirical equation:
┛ = k( Tc – T) [d/M]3/2 (8)
www.intechopen.com
Metal, Ceramic and Polymeric Composites for Various Uses
14
where k is the constant with numerical value 2.1 x 10⁻⁷ JK-1mol-2/3 valid for almost all materials and the parameters Tc, T, d and M respectively, are the critical temperature at which internal pressure equals 1 atmospheric pressure, experimental temperature, density and molar mass. The situation at which Tc equals T, the surface tension approaches zero. Figure 7 is a plot showing the variation of surface tension over its entire compositional
34
38
42
Sur
face
tens
ion
(mN
m)
-1
0.4 0.80.2 1.0
Molfraction of -naphthylamine
50
0.6
323K
333K
373K
46
348K
358K
e*
Fig. 6. Surface tension-composition plot for -naphthalene-diphenylamine system at different temperatures, e* eutectic
3 4
3 8
4 2
Surfa
ce te
nsion
(m
Nm)
-1
3 3 0 3 5 03 2 0 3 6 0
T e m p e r a t u r e ( K )
5 0
3 4 0
4 6
3 7 0 3 8 0
Fi 7 A l t f V t t f hth l i di h l i t
XIII
XII
XI I
III
II
XIV
VIIIXVI
VIII
V
I diphenylamine XIII ┙-naphthalene II-XII mixtures with 0.1, 0.2, 0.3, 0.4, 0.46, 0.5, 0.55,(eutectic) 0.6, 0.7, 0.8, 0.9 molfractions ┙-naphthalene respectively
Fig. 7. A plot of ┛vs temperature for naphthalene-diphenylamine system range with increasing temperature. The temperature greatly effects the surface tension reducing it to its limiting value at T = Tc, an experimental observation possible only when there is no meniscus or barrier between the melt and the vapors (1 atm pressure). This implies that experimental observations of both viscosity and surface tension strongly support the excess functions predicting prominent molecular interactions and consequently, the structural changes in the eutectic melt evincing the endothermic nature of the systems.
www.intechopen.com

Growth Reinforcing Composite Materials from Liquid Phase: Mechanical and Microstructural Parameters Relationship Essentially Evincing the Predominance of an Akin Mass Composition…
15
The germinating crystallites from organic eutectic phases melt in an ice bath environment (~273 K) are of short size, aggressive, non-attaching and crossing each other showing no crystallite–matrix relationship resulting in overall morphology amply rich in small spherulites (Fig. 8a). The spherulitic density (spherulites per unit area) decreases with
(a) (b) (c)
(d) (e) (f)
Fig. 8. Morphological diversity of naphthalene–o-nitrophenol eutectic composite materials by different modes of solidification (100 x). Microstructure of eutectic composite material in (a) ice bath (~273 K), isotropic growth, (b) at room temperature (~300 K), random growth, (c) at 315 K, (d) at moderate anisotropic growth from bottom to top (~2.90 X 10⁻⁷ m3s-1), (e) akin mass eutectic composite material at moderate anisotropic growth from bottom to top (~2.90 X 10⁻⁷ m3s-1), (f) eutectic composite material at anisotropic growth from bottom to top (~2.14 X 10⁻⁷ m3s-1)
decreasing undercooling (Fig. 8b) and spherulitic size increases (~300 K) showing its centre as the seat of nucleation which finally evanesces (Fig.8c) with further undercooling decrease (~315 K). Nevertheless, the crystallites’ growth habits of eutectic and akin mass eutectic compositions can be transformed from spheric or irregular morphology to unique fibrous and lamellar structures consisting of crystallites which are non-aggressive, attaching and embedded parallel to each other reinforcing the matrix by anisotropic growth modes of
www.intechopen.com
Metal, Ceramic and Polymeric Composites for Various Uses
16
solidification. In the domain of solidification rates, microstructures represented by Figs. 8d and 8e are respectively discovered for eutectic and akin mass eutectic composites of naphthalene–o-nitrophenol system at moderate anisotropic growth rate (~2.90 X 10⁻⁷ m3s-1). Both the microstructures indispensably exhibit long and continuous crystallites with damaged free surfaces embedded parallel to each other along the growth direction. The akin mass eutectic composite structure is annexed superior to that of eutectic composite, vis-à-vis strength point of view. Figure 8f is a microstructure of the eutectic phases developed at anisotropic growth velocity ~2.14 X 10⁻⁷ m3s-1 showing crystallites of short size and disconnected with aligning tendency to the longitudinal growth direction. On the contrary, pure eutectic components grew out from their respective melts as lamellar cells that crystallized either from the bulk of the melt or through secondary nucleation during the entire anisotropic solidification process. In view of anisotropic growth ability to organize the growing eutectic phases from the molten state, microstructures represented by Fig.9 (a, b and c) comprising of aligning lamellae, respectively are the specimens of Sn-Cd eutectic phases grown at moderate (~2.90 X 10⁻⁷ m3s-1), post-moderate (~3.50 X 10⁻⁷ m3s-1) and pre-moderate (~2.30 X 10⁻⁷ m3s-1) anisotropic growth rates. The basic distinction in morphologies of non-metallic and metallic eutectic systems lies in the thermodynamic concept (Ovsienko et al., 1980) that coupled growth occurs when both phases have low entropies of fusion (┙<2); i.e.; the lamellae or crystallites of the phases grow in contact resulting in regular structure with their round growth fronts and the overall growth is termed non-faceted–non-faceted (nf-nf). A coupled growth doesn’t occur when both the eutectic phases have high entropies of fusion (┙>2) and consequently a regular structure result in consisting of crystallites or lamellae of the phases that grow side by side near each other with sharp growth fronts and the type of the growth is differentiated faceted-faceted (f-f). A complex regular structure comprising of either nf- f lamellae or nf-f crystallites is produced when the entropy of fusion is low (┙<2) in one phase but high (┙>2) in the other and the growth being the intermediate case, is distinguished non-faceted–faceted (nf-f). In the naphthalene–o-nitrophenol system, both the phases have high entropy of fusion (┙>2) furnishing an irregular structure, whereas in Sn-Cd system, both the phases have low entropy of fusion producing regular morphology. Regular morphology implies that the spacing among lamellae or crystallites must appear constant throughout the structure; otherwise irregular in nature. For this very reason, rod-type growth has a perfect ordered structure merely because of periodic constant inter-rod spacing, whereas lamellar structure proves to be less regular sheerly because of the movement of lamellae or crystallites termed lamellar or fiber faults that would become the cause of slight uncertainty in their spacing consistency. Macro-rupture of naphthalene–o-nitrophenol system is virtually a collection of the following stress-strain fractures (Boyer, 1999; Callister,2006 & Kollmann, 1975):
(i) Modulus of rupture, rup = 3PL
Yr (circular cross section) (9)
(ii) Tensile strength, rup 2P
T =r (10)
(iii) Compressive strength, 2P
=rrup (11)
www.intechopen.com

Growth Reinforcing Composite Materials from Liquid Phase: Mechanical and Microstructural Parameters Relationship Essentially Evincing the Predominance of an Akin Mass Composition…
17
where the parameters P, L and r respectively, are the applied load in Newton force (N), span, and radius of an experimental specimen in metres, herewith P and r being dependent on the dimensions of the specimen and nature of the fracture, have variable magnitudes. In each fracture, the specimens yielding strength deviations by >15% from the averaged result were not included in the computed mechanical property data presented for eutectic and akin mass eutectic composite phases grown at both moderate anisotropic (2.90 X 10⁻⁷ m3s-1) and isotropic (~273 K) solidification rates, in Table 4.
(a) (b) (c)
Fig. 9. Lamellar growth of Sn-Cd eutectic alloy in the moderate growth region (1500x): (a) lamellar Sn-Cd eutectic at moderate anisotropic growth from bottom to top (~2.90 X 10⁻⁷ m3s-1), (b) disconnected lamellar Sn-Cd eutectic at anisotropic growth from bottom to top (~3.50 X 10⁻⁷ m3s-1),(c) disconnected and short lamellae structure of Sn-Cd eutectic at anisotropic growth from bottom to top (~ 2.30 X 10⁻⁷ m3s-1).
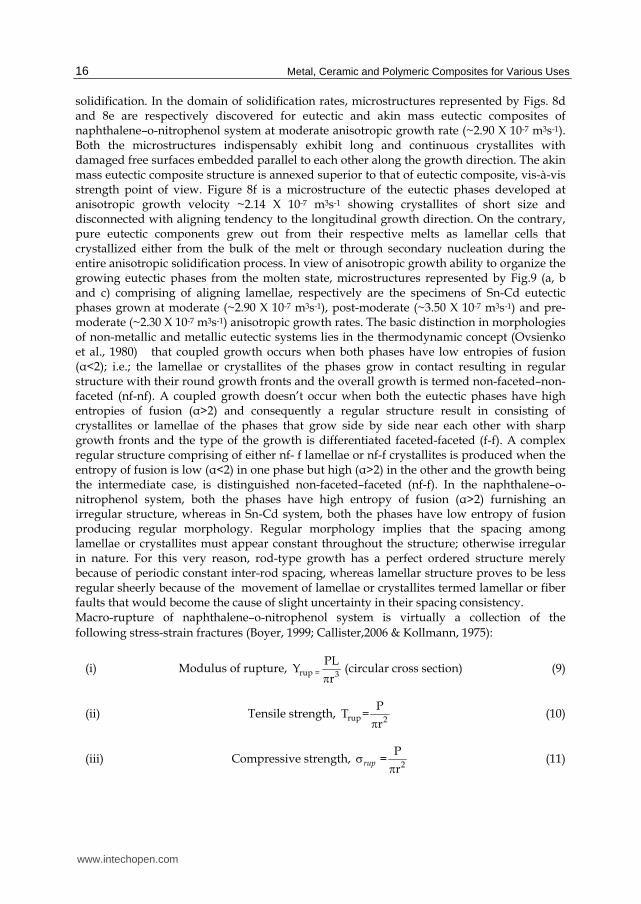
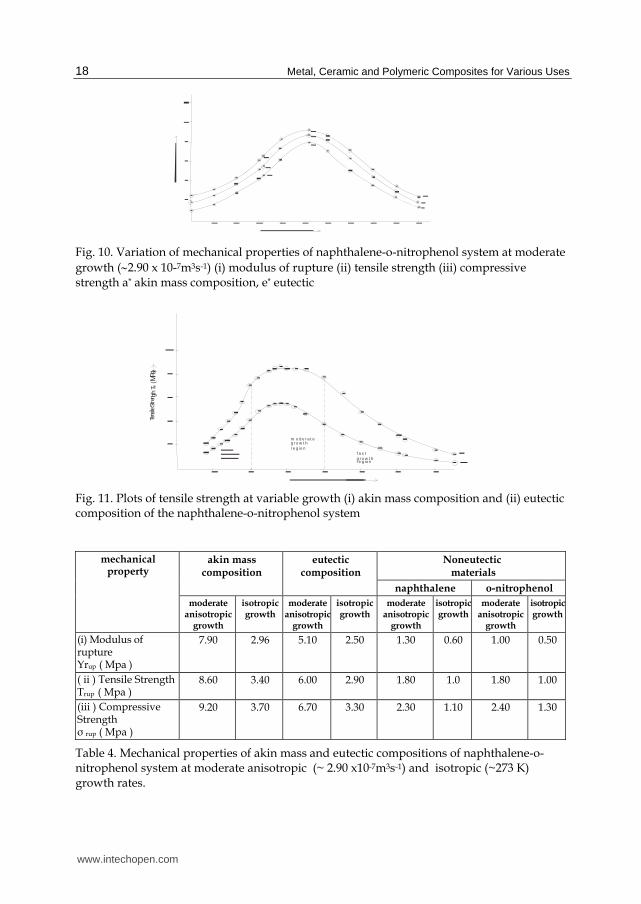
The mechanical observations data , obtained by Eqs. (8, 9 and 10) for the entire composition range of the naphthalene–o-nitrophenol system at constant moderate anisotropic growth (~2.90 X 10⁻⁷ m3s-1), are plotted in Fig.10, implicitly indicating the predominance of the akin mass eutectic composition. In search of authenticity onto this experimental evidence, both eutectic and akin mass eutectic composite materials grown at constant but different anisotropic growth rates, were subsequently subjected to tensile, flexural (modulus of rupture), and compressive tests and the computed tensile strength data are represented in Fig.11, while data for modulus of rupture and compressive modes are recorded in Table 5, supporting the predominance of the akin mass eutectic composite over eutectic composite, both expressing obedience to the Weibull distribution. Evidently, this aspect generates the strength-growth relationship which follows an identical form of the Weibull probability distribution curve inculcating the obedience of the microstructural paramaters, namely, crystallite diameter, crystallite length, crystallite length distribution, volume fraction of crystallites, and the alignment and packing arrangements of crystallites, to the distribution.
www.intechopen.com
Metal, Ceramic and Polymeric Composites for Various Uses
18
Fig. 10. Variation of mechanical properties of naphthalene-o-nitrophenol system at moderate growth (2.90 x 10⁻⁷m3s-1) (i) modulus of rupture (ii) tensile strength (iii) compressive strength a* akin mass composition, e* eutectic
Tens
ile S
tren g
th T
()
rup
MPa
m o d e r a t e g r o w t h r e g io n
f a s t g r o w t h r e g io n
Fig. 11. Plots of tensile strength at variable growth (i) akin mass composition and (ii) eutectic composition of the naphthalene-o-nitrophenol system
mechanical property
akin mass composition
eutectic composition
Noneutectic materials
naphthalene o-nitrophenol
moderate anisotropic
growth
isotropic growth
moderate anisotropic
growth
isotropic growth
moderate anisotropic
growth
isotropic growth
moderate anisotropic
growth
isotropic growth
(i) Modulus of rupture Yrup ( Mpa )
7.90 2.96 5.10 2.50 1.30 0.60 1.00 0.50
( ii ) Tensile Strength Trup ( Mpa )
8.60 3.40 6.00 2.90 1.80 1.0 1.80 1.00
(iii ) Compressive Strength σ rup ( Mpa )
9.20 3.70 6.70 3.30 2.30 1.10 2.40 1.30
Table 4. Mechanical properties of akin mass and eutectic compositions of naphthalene-o-nitrophenol system at moderate anisotropic (~ 2.90 x10⁻⁷m3s-1) and isotropic (~273 K) growth rates.
www.intechopen.com
Growth Reinforcing Composite Materials from Liquid Phase: Mechanical and Microstructural Parameters Relationship Essentially Evincing the Predominance of an Akin Mass Composition…
19
growth velocity ( V X 10-
7m3s-1)
akin mass composition eutectic composition
modulus of rupture Yrup
(MPa )
compressive strength σrup
(MPa )
modulus of
rupture Yrup
(MPa )
compressive strength σrup
(MPa )
0.8 1.10 2.80 0.70 1.50 1.0 1.80 3.50 1.00 1.90 1.2 2.80 4.40 1.30 2.40 1.4 4.20 5.10 1.70 2.70 1.6 5.40 6.00 2.30 3.70 1.8 6.20 6.80 2.80 4.30 2.0 6.80 7.60 3.30 5.00 2.2 7.10 8.20 3.80 5.70 2.5 7.70 8.90 4.20 6.30 2.7 7.80 9.10 4.40 6.50 2.8 7.90 9.20 4.50 6.60 3.0 7.80 9.10 4.40 6.50 3.2 7.60 9.00 4.30 6.40 3.5 7.10 8.80 3.80 6.00 4.0 6.10 7.80 2.70 5.20 4.5 4.80 6.20 2.00 3.80 5.0 3.70 4.70 1.50 2.90 5.5 2.60 3.80 1.10 2.30 6.0 2.10 3.00 0.80 1.80 6.2 1.70 2.70 0.60 1.60 7.0 1.20 1.80 0.30 1.50 7.5 0.80 1.30 0.20 0.80
Table 5. Variation of modulus of rupture and compressive strength with growth velocity of naphthalene- o-nitrophenol binary system.
Micro deformation test virtually represents the Vickers microhardness, Hv, which is a measure of a materials resistance to localized plastic deformation (e.g., a small dent or a scratch) by the stress-strain relation (Beigh et al., 1995 & Hayden, 1965):
Hv = 1.8544 P/d2 (12)
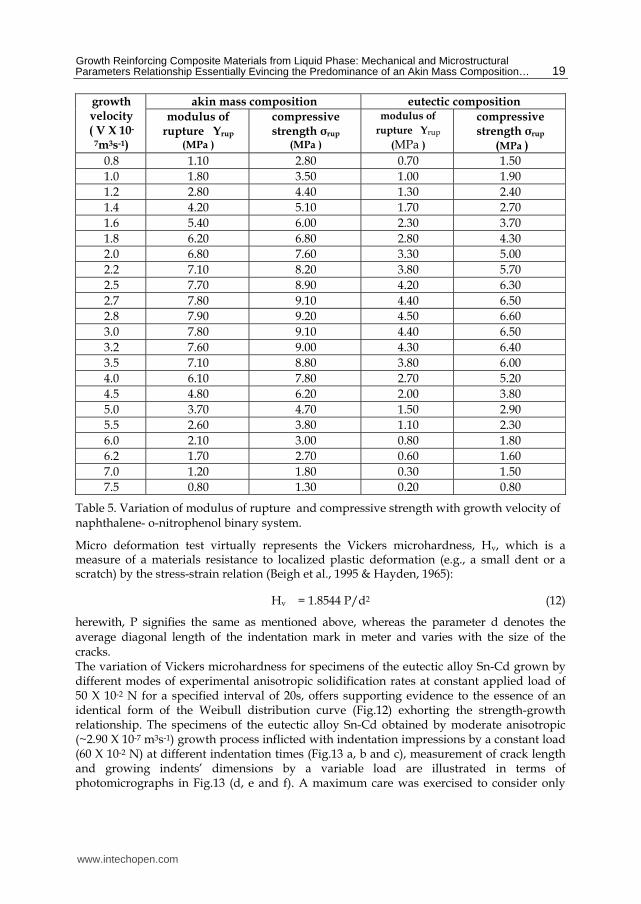
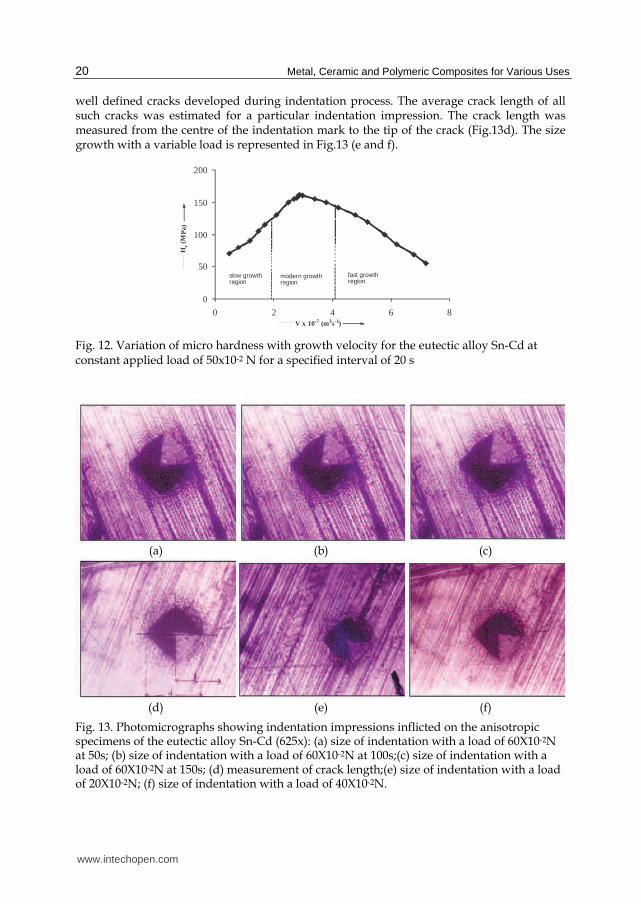
herewith, P signifies the same as mentioned above, whereas the parameter d denotes the average diagonal length of the indentation mark in meter and varies with the size of the cracks. The variation of Vickers microhardness for specimens of the eutectic alloy Sn-Cd grown by different modes of experimental anisotropic solidification rates at constant applied load of 50 X 10-2 N for a specified interval of 20s, offers supporting evidence to the essence of an identical form of the Weibull distribution curve (Fig.12) exhorting the strength-growth relationship. The specimens of the eutectic alloy Sn-Cd obtained by moderate anisotropic (~2.90 X 10⁻⁷ m3s-1) growth process inflicted with indentation impressions by a constant load (60 X 10-2 N) at different indentation times (Fig.13 a, b and c), measurement of crack length and growing indents’ dimensions by a variable load are illustrated in terms of photomicrographs in Fig.13 (d, e and f). A maximum care was exercised to consider only
www.intechopen.com
Metal, Ceramic and Polymeric Composites for Various Uses
20
well defined cracks developed during indentation process. The average crack length of all such cracks was estimated for a particular indentation impression. The crack length was measured from the centre of the indentation mark to the tip of the crack (Fig.13d). The size growth with a variable load is represented in Fig.13 (e and f).
0
50
100
150
200
0 2 4 6 8
slow growthregion
modern growth region
fast growthregion
V x 10-7 (m3s-1)
Hv
(MP
a)
Fig. 12. Variation of micro hardness with growth velocity for the eutectic alloy Sn-Cd at constant applied load of 50x10-2 N for a specified interval of 20 s
(a) (b) (c)
(d) (e) (f)
Fig. 13. Photomicrographs showing indentation impressions inflicted on the anisotropic specimens of the eutectic alloy Sn-Cd (625x): (a) size of indentation with a load of 60X10-2N at 50s; (b) size of indentation with a load of 60X10-2N at 100s;(c) size of indentation with a load of 60X10-2N at 150s; (d) measurement of crack length;(e) size of indentation with a load of 20X10-2N; (f) size of indentation with a load of 40X10-2N.
www.intechopen.com
Growth Reinforcing Composite Materials from Liquid Phase: Mechanical and Microstructural Parameters Relationship Essentially Evincing the Predominance of an Akin Mass Composition…
21
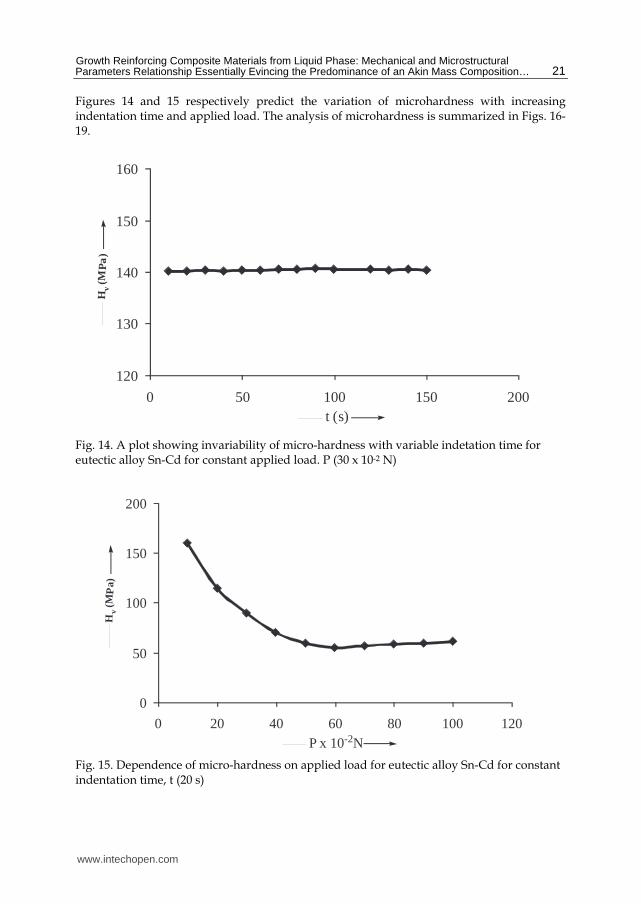
Figures 14 and 15 respectively predict the variation of microhardness with increasing indentation time and applied load. The analysis of microhardness is summarized in Figs. 16-19.
120
130
140
150
160
0 50 100 150 200
Hv
(MP
a)
t (s)
Fig. 14. A plot showing invariability of micro-hardness with variable indetation time for eutectic alloy Sn-Cd for constant applied load. P (30 x 10-2 N)
0
50
100
150
200
0 20 40 60 80 100 120
Hv
(MP
a)
P x 10-2N Fig. 15. Dependence of micro-hardness on applied load for eutectic alloy Sn-Cd for constant indentation time, t (20 s)
www.intechopen.com
Metal, Ceramic and Polymeric Composites for Various Uses
22
-0.8
-0.6
-0.4
-0.2
0
‐4.6 ‐4.4 ‐4.2 ‐4 ‐3.8 ‐3.6log d
log
P
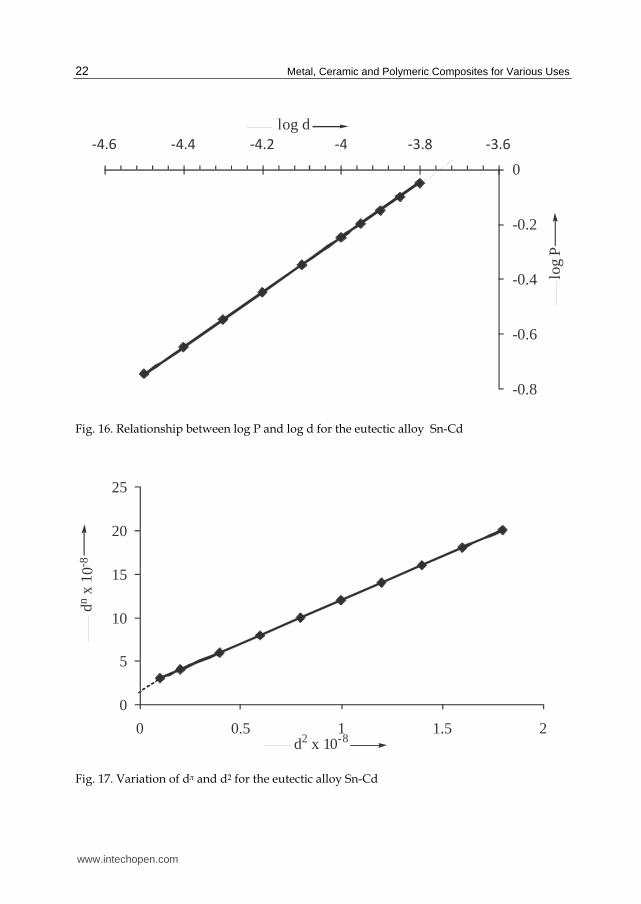
Fig. 16. Relationship between log P and log d for the eutectic alloy Sn-Cd
d2 x 10-8
dnx
1 0- 8
0
5
10
15
20
25
0 0.5 1 1.5 2
Fig. 17. Variation of dπ and d2 for the eutectic alloy Sn-Cd
www.intechopen.com
Growth Reinforcing Composite Materials from Liquid Phase: Mechanical and Microstructural Parameters Relationship Essentially Evincing the Predominance of an Akin Mass Composition…
23
-0.9
-0.7
-0.5
-0.3
-0.1
-6 -5 -4
log d
log
(P-W
)
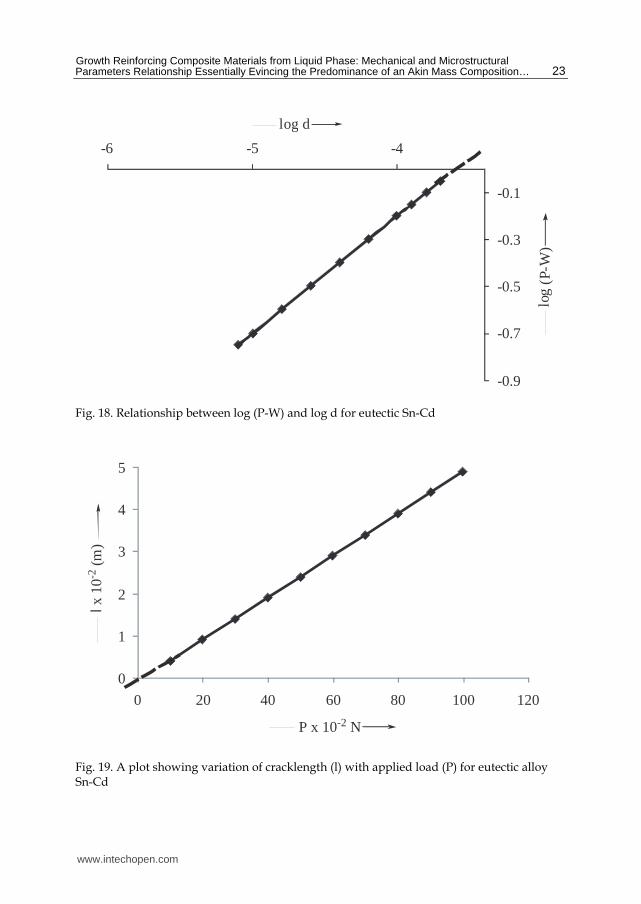
Fig. 18. Relationship between log (P-W) and log d for eutectic Sn-Cd
0
1
2
3
4
5
0 20 40 60 80 100 120
P x 10-2 N
lx10
-2(m
)
Fig. 19. A plot showing variation of cracklength (l) with applied load (P) for eutectic alloy Sn-Cd
www.intechopen.com
Metal, Ceramic and Polymeric Composites for Various Uses
24
The parameters extracted from the analysis are recorded in Tables 6-7.
eutectic alloy
n 106Nm-2
k1 106Nm-2
k2 k2/k1 W (10-3N) W/k1
(10-8m2)
Sn-Cd 1.5672 1.3824 7.4155 5.3642 8.7868 6.3562
Table 6. Hardness analysis constants for the eutectic alloy Sn-Cd
applied load
P x 10-2N crack length
(l x 10-2m) fracture
toughness Kc
(Nm-3/2)
brittleness Bi
(106m-1/2) hardness Hv (MPa)
yield strength
y (MPa) 10 0.3 89.29 1.79 160 53.33 20 0.7 84.03 1.37 115 38.33 30 0.9 50.19 1.79 90 30.00 40 1.2 43.62 1.60 70 23.33 50 1.6 35.36 1.69 60 20.00 60 1.9 32.72 1.68 55 18.33 70 2.1 32.89 1.73 57 19.00 80 2.7 25.74 2.29 59 19.67 90 3.2 22.48 2.67 60 20.00
100 3.4 22.78 2.68 61 20.33
Table 7. Hardness parameters for the eutectic alloy Sn-Cd
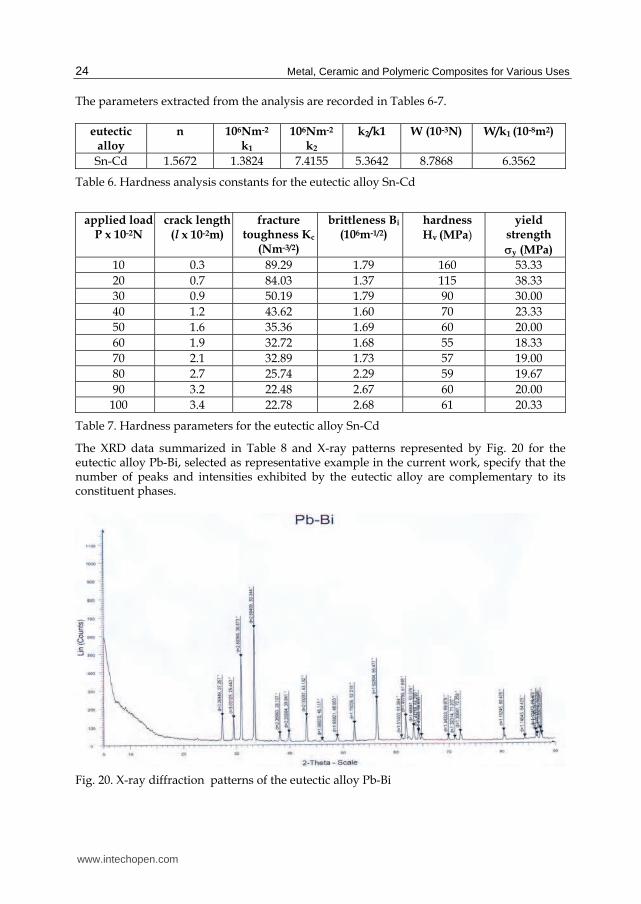
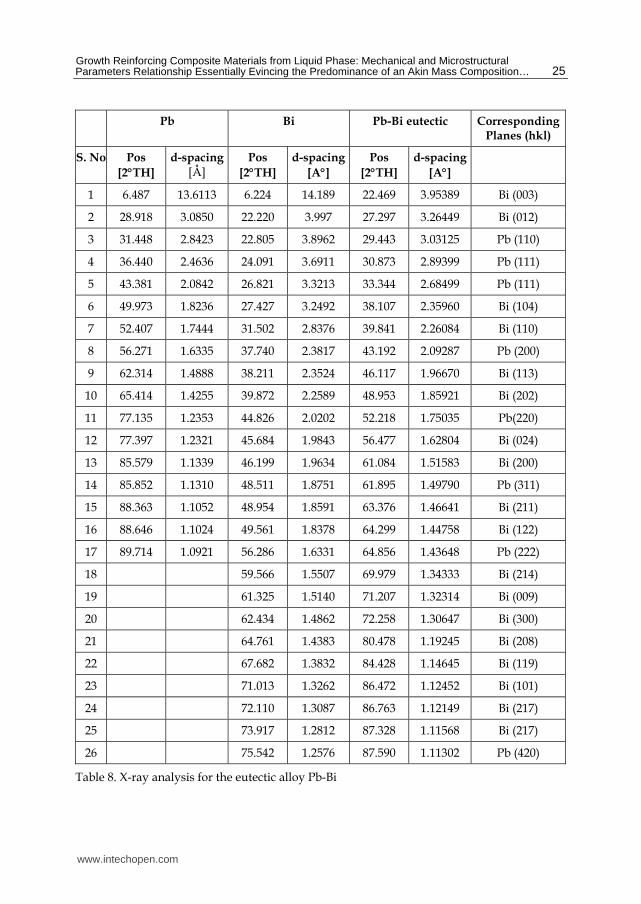
The XRD data summarized in Table 8 and X-ray patterns represented by Fig. 20 for the eutectic alloy Pb-Bi, selected as representative example in the current work, specify that the number of peaks and intensities exhibited by the eutectic alloy are complementary to its constituent phases.
Fig. 20. X-ray diffraction patterns of the eutectic alloy Pb-Bi
www.intechopen.com
Growth Reinforcing Composite Materials from Liquid Phase: Mechanical and Microstructural Parameters Relationship Essentially Evincing the Predominance of an Akin Mass Composition…
25
Pb Bi Pb-Bi eutectic Corresponding Planes (hkl)
S. No Pos
[2TH]
d-spacing [Å]
Pos
[2TH]
d-spacing
[A] Pos
[2TH]
d-spacing
[A]
1 6.487 13.6113 6.224 14.189 22.469 3.95389 Bi (003)
2 28.918 3.0850 22.220 3.997 27.297 3.26449 Bi (012)
3 31.448 2.8423 22.805 3.8962 29.443 3.03125 Pb (110)
4 36.440 2.4636 24.091 3.6911 30.873 2.89399 Pb (111)
5 43.381 2.0842 26.821 3.3213 33.344 2.68499 Pb (111)
6 49.973 1.8236 27.427 3.2492 38.107 2.35960 Bi (104)
7 52.407 1.7444 31.502 2.8376 39.841 2.26084 Bi (110)
8 56.271 1.6335 37.740 2.3817 43.192 2.09287 Pb (200)
9 62.314 1.4888 38.211 2.3524 46.117 1.96670 Bi (113)
10 65.414 1.4255 39.872 2.2589 48.953 1.85921 Bi (202)
11 77.135 1.2353 44.826 2.0202 52.218 1.75035 Pb(220)
12 77.397 1.2321 45.684 1.9843 56.477 1.62804 Bi (024)
13 85.579 1.1339 46.199 1.9634 61.084 1.51583 Bi (200)
14 85.852 1.1310 48.511 1.8751 61.895 1.49790 Pb (311)
15 88.363 1.1052 48.954 1.8591 63.376 1.46641 Bi (211)
16 88.646 1.1024 49.561 1.8378 64.299 1.44758 Bi (122)
17 89.714 1.0921 56.286 1.6331 64.856 1.43648 Pb (222)
18 59.566 1.5507 69.979 1.34333 Bi (214)
19 61.325 1.5140 71.207 1.32314 Bi (009)
20 62.434 1.4862 72.258 1.30647 Bi (300)
21 64.761 1.4383 80.478 1.19245 Bi (208)
22 67.682 1.3832 84.428 1.14645 Bi (119)
23 71.013 1.3262 86.472 1.12452 Bi (101)
24 72.110 1.3087 86.763 1.12149 Bi (217)
25 73.917 1.2812 87.328 1.11568 Bi (217)
26 75.542 1.2576 87.590 1.11302 Pb (420)
Table 8. X-ray analysis for the eutectic alloy Pb-Bi
www.intechopen.com
Metal, Ceramic and Polymeric Composites for Various Uses
26
4. Analysis and discussion
The deviations of the systems from ideal regions covered by their respective diagrams of state (Fig.1) consisting of solidus-liquidus equilibrium curves, predict specific interactions between unlike phase molecules or unlike atoms in the miscibility phenomenon. The thermodynamic analysis of the systems confirms the deviations (Fig.2) and comprehensively yields quantitative idea of the interactions, inasmuch the excess functions are being computed from experimentally determined parameters, are reliable and discovered expedient for predicting the phase equilibrium curves of binary systems (Sharma et al.,2004). The heterogeneous nucleation data obtained from the limit of undercooling (Table 2) provide a lucid consistency in the symmetry relations, ξ = Tc/Tm and ΔT/Tm, which certainly authenticates the nucleation theory for the system entirety. This essential constancy in symmetry relations implicitly explores a definite relationship existing between the nucleating solidus form obtained from the limit of undercooling and the liquid structure conceived by the entropy of fusion. The critical analysis of the plot (Fig. 3) shows that the anisotropic velocity of crystallization from binary compositional melts essentially decreases significantly with the gradual addition of one eutectic phase to the other. Consequently, the inferential interference of the eutectic phases decreases the crystallization velocity from the eutectic melt (10 X 10-4ms-1) which is much lower than its value from the non eutectic melts; naphthalene (158 X10-4ms-1) and o-nitrophenol (92 X10-4ms-1) for fixed undercooling ΔT= 10K. The kinetics of the anisotropic crystal growth being dependent on parabolic form, follow the dislocation mechanism wherein eutectic phases would diffuse and grow at the sites at which surface with the stages is formed owing to lattice imperfections and screw dislocations. These imperfections do intersect the surfaces and produce steps of one or more molecular diameters in height. These steps are the center of lattice disturbance and wind themselves in spirals during crystal growth. The logical growth concept extracted from the theoretical interpretation of the experimental observations is consistent with the diffusion growth of the eutectic phases from their binary melt that the growing phases mutually sustain the diffusion process through melt layer becoming rich in their concentration at different times of successive nucleation. The anomalous behavior of viscosity (Fig.4) and surface tension (Fig.6) for the eutectic melt furnishes supporting evidence to the essence of molecular interactions conceiving magnitudes already delivered by the excess functions. The most probable structural change (configurational weight) in phase molecules occurs in the eutectic compositional melt owing to three phases’ coexistence, resulting in significant molecular clusters’ formation rich in one of the eutectic phases. The degree of molecular clustering tendency decreases as the temperature is gradually raised that would finally become the cause of limiting values of rheological parameters. The explanation for the higher value of the activation energy for the eutectic melt may be attributed to the following contributions: (i) the activation energy for viscous flow; (ii) the energy essentially required overcoming the molecular clusters’ tendency. The molecular clustered array of atoms would inevitably result in an increase both in viscosity and surface tension, and a reduction in surface area. Consequent thereupon, the thermal energy expended to break the clusters would certainly exceed activation energy. An increasing temperature vitiates clustering phenomenon and the
www.intechopen.com
Growth Reinforcing Composite Materials from Liquid Phase: Mechanical and Microstructural Parameters Relationship Essentially Evincing the Predominance of an Akin Mass Composition…
27
particular temperature whereat it completely evanesces only the first contribution will be the activation energy. In the current work, the cluster-free flow is evidentially illustrated for viscosity at 402K in Fig.4 and for surface tension at 373 K (Fig.6). Likewise, the activation energy for eutectic compositional melts also consociates with normal value of the systems as indicated by dotted lines in Fig.5 for viscous flow of naphthalene–o-nitrophenol system at 402K, and in Fig 7 for loose surface flow of ┙-naphthylamine-diphenylamine system at 373K. An irregular morphology (Fig 8 a –c) by f-f growth of eutectic phases from molten state results in because of their high entropies of fusion, since the formation of packs of their crystallites from the eutectic melt would arise under the influence of large thermal and mechanical stresses during the growth process. These stresses seem to be the cause of splitting the main single crystallite into separate single crystallites or groups of single crystallites in the absence of orientation relationship among faceted crystallites, eventually accomplishing an irregular morphology. The crystallite spherulitic form occurs at a large undercooling (~273 K) merely because the rich eutectic phase first nucleates and grows depleting the vicinal melt to be rich in other phase that also nucleates at a certain supersaturation. Alike, both the phases grow side by side. The large thermal and mechanical stresses influence the splitting of crystallites to occur along the direction and successive splitting lead to the formation of spherulites. As mentioned in the observation section, the moderate anisotropic growth is predominant finding in the domain of anisotropic solidification rates because of its aesthetics ability to produce in- situ oriented composite materials consisting of crystallites (Fig.8 d – e) and lamellae (Fig.9a) which are attaching , nonaggressive and embedded parallel to each other exhibiting nearly consistent periodic orientation relationship. Microstructure (Fig.9b) consisting of long and continuous parallel lamellae indicates lamellar faults (Hunt &Jackson, 1966). Microstructures (Figs.8f and 9c) consisting of crystallites or lamellae of short size, exhibit their disconnected but non aggressive alignment along the growth direction. The supercrescent crystallites or lamellae growth virtually produces the complete lamellar or rod –type microstructures .The eutectic phases with ┙ >2 grow side by side near each other from binary melt resulting in lamellar structures of long and continuous non aggressive crystallites lamina (Fig.8d - e), whereas eutectic phases with ┙ <2 grow supercrescently (edge-wise) from the melt to produce lamellar or rod-type lamina consisting of long and continuous nonaggressive lamellae which are embedded parallel to each other showing orientation relationship almost consistent throughout the structure (Fig. 9a). An insight analysis of Table 4 reveals approximately one and a half to two fold enhancement in each mode of mechanical property of the akin mass eutectic composite material at the moderate anisotropic growth velocity (~2.90 X 10⁻⁷ m3s-1) in comparison to the eutectic composite material and many fold superiority over its isotropic growth (~273 K) and constituent materials whether grown anisotropically or isotropically. The plot of Fig.10 drawn between different modes of macrohardness and the entire range of composition of the naphthalene-o-nitrophenol system at nearly constant moderate anisotropic growth velocity (~2.90 X 10⁻⁷ m3s-1) strengthens the quantitative analysis by showing the predominance of the akin mass eutectic composition. Consequently, the curve (Fig.11) divides the experimental range of anisotropic growth velocity into three regions, namely, (i) slow growth region; (ii) moderate growth region and (iii) fast growth region .Among which, the moderate growth region, as is evident from the plot (Fig.11), would seem to be the most probable for producing lamellar or rod-type structures of both eutectic (Fig.8d) and akin
www.intechopen.com
Metal, Ceramic and Polymeric Composites for Various Uses
28
mass eutectic (Fig.8e) composite materials, since microstructural parameters appear to be nearly obeying the Gauss distribution. Consequentiality, the microstructural crystallites of the akin mass composite material nearly follow the rod- type growth habits (Fig.8e) reinforcing the matrix where there is a perfect crystallite- matrix bond. On the contrary, the crystallites of the eutectic microstructure (Fig.8d) emerge with lamellar growth habits reinforcing the matrix but the crystallite- matrix bond exist with less perfection .The mechanical parameters of both the composite materials in the slow and fast growth regions are found comparable (Table 5 and Fig.11) because microstructural parameters express their obedience to the Weibull distribution in these regions showing no crystallite matrix relationship (Fig.8 a- c).The analysis necessarily involves a physical understanding of the relationship between the microstructures of materials and their mechanical properties .Evidentially, the curve (Fig.11) has two cut-off points corresponding to a lower strength limit in the slow and fast growth regions, and an upper strength limit in the moderate growth region. The later is equivalent to the theoretical strength of the matrix reinforced crystallites with damaged free surfaces, practically having no density of dislocations; i.e.; internal defects or surface flaws responsible for reduced strength. Likewise, the microhardness of the eutectic alloy Sn-Cd (Fig. 12) can be explained essentially involving its microstructures presented in Fig.9 on the similar dependence pattern with variable anisotropic growth velocity as tensile strength for the eutectic and akin mass eutectic composite materials of the naphthalene-o-nitrophenol system, follows in Fig.11. Implicit in the plots (Figs.11 and 12) is the concept that the variation of an anisotropic mechanical property over the entire range of growth velocity furnishes an evidence of its dependence as linear, optimum, and linear respectively in slow, moderate, and fast growth regions of solidification. An interesting finding to be noted from Tables 4 -5 is that, both eutectic and akin mass eutectic composite materials with isotropic growth (~273 K) are respectively found nearly twice and thrice stronger than that of their constituent materials merely because of their high specific modulus and high specific strength due to alignment of the crystallites although having dislocations. Likewise, moderate anisotropic growth of pure constituent materials is superior to their isotropic growth. Besides, the quantitative perusal of mechanical parameters presented in Tables 4 and 5,explores that the compressive mode slightly exceeds the tensile mode, which in turn shows an edge on modulus of rupture ( rup > Trup > Yrup ).The inequality existing between mechanical modes essentially involves crystallite’s length, which in the current work, accomplishes with the attachment of alike crystallites at different times and their efficiency in gripping and the reinforcing the matrix decreases with the reduction of crystallite’s length. Crystallite-ends play important role in the fracture of short crystallite composite materials (Fig.8f and Fig.9c) and also in continuous crystallite composite materials (Fig.8d and Fig.9b), since the long crystallites may break down into discrete lengths. Figure 13a-c reveals that the indentation size by a constant load (60x10-2N) is independent of variable indentation times inferring the microhardness (Hv) to be so. The observation is strongly supported by Fig.14 indicating practically no change in the microhardness with the variable indentation time for a constant applied load of (30 X10-2N) at room temperature, which is consistent with the plastic deformation of the eutectic alloy that remains unaffected with variable indentation times. The nonlinear variation of microhardness ( Fig.15) with variable applied load in the range 10 X 10-2 – 100 X10-2 N at constant indentation time, t (20s) shows that Hv decreases with increasing load until about 60 X10-2N and thereafter , Hv tends to saturation which is full at 70 X10-2N.The qualitative explanation of the variation follows
www.intechopen.com
Growth Reinforcing Composite Materials from Liquid Phase: Mechanical and Microstructural Parameters Relationship Essentially Evincing the Predominance of an Akin Mass Composition…
29
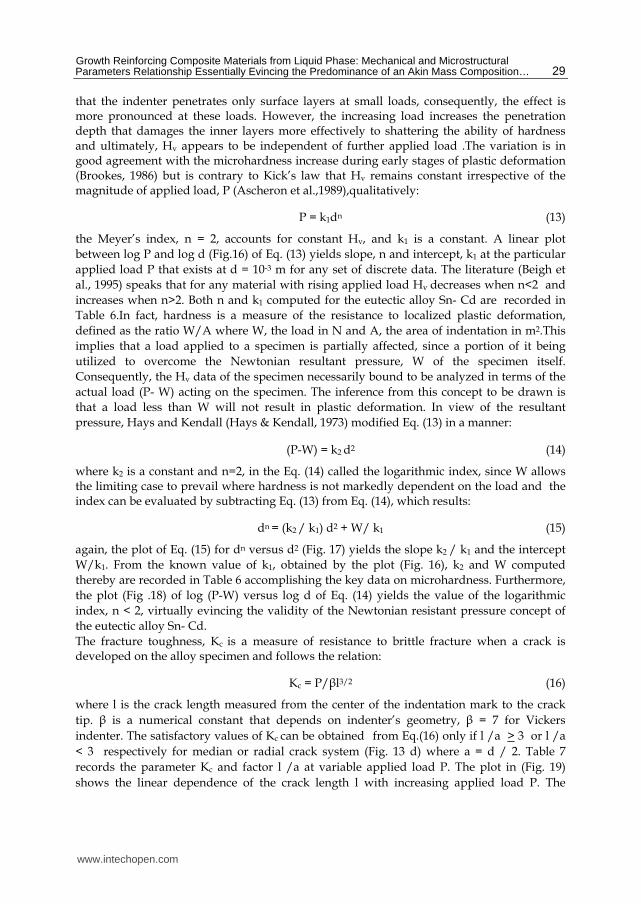
that the indenter penetrates only surface layers at small loads, consequently, the effect is more pronounced at these loads. However, the increasing load increases the penetration depth that damages the inner layers more effectively to shattering the ability of hardness and ultimately, Hv appears to be independent of further applied load .The variation is in good agreement with the microhardness increase during early stages of plastic deformation (Brookes, 1986) but is contrary to Kick’s law that Hv remains constant irrespective of the magnitude of applied load, P (Ascheron et al.,1989),qualitatively:
P = k1dn (13)
the Meyer’s index, n = 2, accounts for constant Hv, and k1 is a constant. A linear plot between log P and log d (Fig.16) of Eq. (13) yields slope, n and intercept, k1 at the particular applied load P that exists at d = 10-3 m for any set of discrete data. The literature (Beigh et al., 1995) speaks that for any material with rising applied load Hv decreases when n<2 and increases when n>2. Both n and k1 computed for the eutectic alloy Sn- Cd are recorded in Table 6.In fact, hardness is a measure of the resistance to localized plastic deformation, defined as the ratio W/A where W, the load in N and A, the area of indentation in m2.This implies that a load applied to a specimen is partially affected, since a portion of it being utilized to overcome the Newtonian resultant pressure, W of the specimen itself. Consequently, the Hv data of the specimen necessarily bound to be analyzed in terms of the actual load (P- W) acting on the specimen. The inference from this concept to be drawn is that a load less than W will not result in plastic deformation. In view of the resultant pressure, Hays and Kendall (Hays & Kendall, 1973) modified Eq. (13) in a manner:
(P-W) = k2 d2 (14)
where k2 is a constant and n=2, in the Eq. (14) called the logarithmic index, since W allows the limiting case to prevail where hardness is not markedly dependent on the load and the index can be evaluated by subtracting Eq. (13) from Eq. (14), which results:
dn = (k2 / k1) d2 + W/ k1 (15)
again, the plot of Eq. (15) for dn versus d2 (Fig. 17) yields the slope k2 / k1 and the intercept W/k1. From the known value of k1, obtained by the plot (Fig. 16), k2 and W computed thereby are recorded in Table 6 accomplishing the key data on microhardness. Furthermore, the plot (Fig .18) of log (P-W) versus log d of Eq. (14) yields the value of the logarithmic index, n < 2, virtually evincing the validity of the Newtonian resistant pressure concept of the eutectic alloy Sn- Cd. The fracture toughness, Kc is a measure of resistance to brittle fracture when a crack is developed on the alloy specimen and follows the relation:
Kc = P/┚l3/2 (16)
where l is the crack length measured from the center of the indentation mark to the crack tip. ┚ is a numerical constant that depends on indenter’s geometry, ┚ = 7 for Vickers indenter. The satisfactory values of Kc can be obtained from Eq.(16) only if l /a > 3 or l /a < 3 respectively for median or radial crack system (Fig. 13 d) where a = d / 2. Table 7 records the parameter Kc and factor l /a at variable applied load P. The plot in (Fig. 19) shows the linear dependence of the crack length l with increasing applied load P. The
www.intechopen.com
Metal, Ceramic and Polymeric Composites for Various Uses
30
brittleness is usually expressed as the brittleness index Bi and can be estimated from Kc
values by the relationship (Lawn & Fuller, 1975):
Bi = Hv / Kc (17)
Bi values calculated by Eq.(17) for the eutectic alloy Sn- Cd are presented in Table 7.The yields strength of a material can be estimated from the microhardness values using the relation (Beigh et al., 1995 ) valid for n<2:
σV = Hv /3 (18)
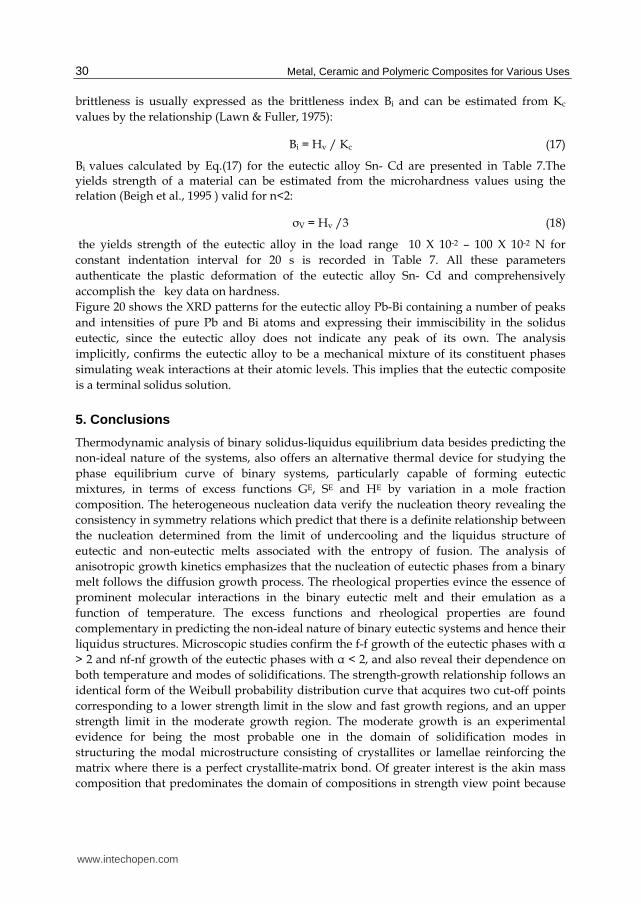
the yields strength of the eutectic alloy in the load range 10 X 10-2 – 100 X 10-2 N for constant indentation interval for 20 s is recorded in Table 7. All these parameters authenticate the plastic deformation of the eutectic alloy Sn- Cd and comprehensively accomplish the key data on hardness. Figure 20 shows the XRD patterns for the eutectic alloy Pb-Bi containing a number of peaks and intensities of pure Pb and Bi atoms and expressing their immiscibility in the solidus eutectic, since the eutectic alloy does not indicate any peak of its own. The analysis implicitly, confirms the eutectic alloy to be a mechanical mixture of its constituent phases simulating weak interactions at their atomic levels. This implies that the eutectic composite is a terminal solidus solution.
5. Conclusions
Thermodynamic analysis of binary solidus-liquidus equilibrium data besides predicting the non-ideal nature of the systems, also offers an alternative thermal device for studying the phase equilibrium curve of binary systems, particularly capable of forming eutectic mixtures, in terms of excess functions GE, SE and HE by variation in a mole fraction composition. The heterogeneous nucleation data verify the nucleation theory revealing the consistency in symmetry relations which predict that there is a definite relationship between the nucleation determined from the limit of undercooling and the liquidus structure of eutectic and non-eutectic melts associated with the entropy of fusion. The analysis of anisotropic growth kinetics emphasizes that the nucleation of eutectic phases from a binary melt follows the diffusion growth process. The rheological properties evince the essence of prominent molecular interactions in the binary eutectic melt and their emulation as a function of temperature. The excess functions and rheological properties are found complementary in predicting the non-ideal nature of binary eutectic systems and hence their liquidus structures. Microscopic studies confirm the f-f growth of the eutectic phases with ┙ > 2 and nf-nf growth of the eutectic phases with ┙ < 2, and also reveal their dependence on both temperature and modes of solidifications. The strength-growth relationship follows an identical form of the Weibull probability distribution curve that acquires two cut-off points corresponding to a lower strength limit in the slow and fast growth regions, and an upper strength limit in the moderate growth region. The moderate growth is an experimental evidence for being the most probable one in the domain of solidification modes in structuring the modal microstructure consisting of crystallites or lamellae reinforcing the matrix where there is a perfect crystallite-matrix bond. Of greater interest is the akin mass composition that predominates the domain of compositions in strength view point because
www.intechopen.com
Growth Reinforcing Composite Materials from Liquid Phase: Mechanical and Microstructural Parameters Relationship Essentially Evincing the Predominance of an Akin Mass Composition…
31
of its superior microstructure. The chapter also discusses the micohardness of binary metallic eutectic system Sn-Cd and the experimental evidences confirm the plastic deformation of the system. The chapter work authenticates with experimentally investigated strength data that the physical properties, and in particular, the mechanical behavior of a material depend on the growth habits to produce the modal microstructure of the material. X-ray studies affirm the mechanical combination of the eutectic phases resulting in terminal solidus solution and hence the eutectic solidus structure.
6. Acknowledgement
The authors gladly express thanks and acknowledge the instinct cooperative spirit of Ms. Surby Gupta, Mr. Arun Kumar, Ms. Savita Gupta, Mr. Sahil Sharma (Computer Assistant), Mr. Rajesh and Mr. Asim Sharma in making the chapter work more effective as a teaching and learning, and research tool, and all those who have shared their input and contributions in compiling the chapter.
7. References
Ashbee, K.H. (1993) Fundamental Principles of Fiber Reinforced Composites, 2nd ed., Technomic Publishing Company, Lanchaster, PA (1993).
Ascheron C., Hasse C., Kuhn G., & Neumann H., (1989). Microhardness of Sn-doped InP. Crystal research and technology. Vol. 24, Issue 2, (February 1989) , pp. ( K33-K35).
Beigh, S., Kotru, P. N., & Wanklyn, B.N. (1995). Indentation induced microhardness and fracture studies on (110) and (001) planes of flux-grown dysprosium orthoferrite single crystals. Materials chemistry and physics, Vol.40 (1995), pp (.99-104).
Boyer, H.E. (1999). Hardness Testing, 2nd ed., ASM International Materials Park, OH (1999). Brookes.C.A.(1986). Inst. Phys. Ser, Vol. 75, Chapter 3. Callister, W.D.(2006). & Rethwisch D.G. (2008). Composites: Polymer-Matrix Composites.
Fundamentals of Materials Science and Engineering, 3rd ed., Hoboken, New York (2008).
Callister, W.D. Materials Science and Engineering. An introduction. 6th Ed., John Wiley and Sons Inc., Canada (2006).
Caram, R., Banan, M.,& Wilcox, W. R. (1991). Directional solidification of Pb-Sn eutectic with vibration. Journal of crystal growth, Vol.114 (July 1991), pp.( 249-254).
Caram, R., Chandrashekher, S.,& Wilcox, W.R. (1990). Influence of convection on rod spacing of eutectics. Journal of crystal growth, Vol.106 (march1990), pp.(294-302).
Courtney, T.H. (2000). Mechanical Behavior of Materials, 2nd Ed., Mc Graw- Hill Higher Education, Burr Ridge, IL, (2000.)
Edward, W. W .(1930). International Critical Tables of Numerical Data, Vol.7,McGraw-Hill,New York (1930).
Hayden, H.W., Moffatt, W.G., & Wulff, J. (1965), The Structure and Properties of Materials, Vol. III, Mechanical Behaviour, John Wiley & Sons, New York (1965).
Hays C.,& Kendall E.G. (1973). Analysis of knoop microhardness. Metallography. Vol. 6 (August 1973), pp. (275-282).
Hull, D., & Clyne, T.W. (2006). An introduction to composite materials, 2nd Ed., Cambridge University Press, Newyork, 2006.
www.intechopen.com
Metal, Ceramic and Polymeric Composites for Various Uses
32
Hunt,D., & Jackson K. A.,(1966). Binary Eutectic Solidification. Trans. AMIE, Vol.236 (June 1966), pp.( 843-852).
Kollman, F. P., Ed. F. P. Kollman, Berlin, (1975). Principles of Wood Science and Technology, Heildberg, New York (1975).
Lawn B. R.,& Fuller E. R. (1975). Equilibrium penny – like cracks in indentation fracture. Journal of Material science. Volume 10, (1975), pp. (2016-2024).
Lide,D.R.(2009). CRC Handbook of Chemistry and Physics, A Ready Preference Book of Chemical and Physical Data:90thEd.,CRC Press,London 2009.
Mallick, P.K. (1993). Fiber-Reinforced Composites, Materials, Manufacturing, and Design, 2nd ed., Marcel Dekker, New York (1993).
Ovsienko, D.E., Alfinstev, G. A.,& Arizumi,T. Ed. 2nd (1980) Crystal Growth, properties and Application, vol. 2, Springer-Verlag, Berlin Heidelberg New York 1980. ]
Pillar, R.M. (1984). “Manufacturing Processes of Metals: The Processing and Properties of Metal Implants,” Metal and Ceramic Biomaterials, Ducheyne, P & Hastings, G (Editors), Franklin Book Company, Elkins Park, PA (1984).
Sharma, B.L. (2003). Structural models of faceted –faceted eutectic system vanillin –acenaphthene Mater. Chem. Phys. 78 (2003), pp. (691-701).
Sharma, B.L., Jamwal, R. & Kant, R. (2004a). Thermodynamic and lamella models relationship for the eutectic system benzoic acid –cinnamic acid Cryst. Res. Technol. 39, No. 5, (2004), pp.(454-464).
Sharma, B.L., Tandon, S. Kant, R , & Sharma, R. (2004b). Quantitative essence of molecular interactions in binary organic eutectic melt systems Thermochimica Acta 421 (2004), pp. (161-169).
Sharma, B.L., Gupta, S.,Tandon,S , & Kant, R.(2008). Physico-mechanical properties of naphthalene- acenaphthene eutectic system by different modes of solidification. Mater.Chem.,Phys.Vol. 111, (2008) pp. (423-430)
Sharma, B.L., Tandon, S., & Gupta, S. (2009). Characteristics of the binary faceted eutectic : benzoic acid –salicylic acid system, Cryst. Res. Technol. 44, No.3, (2009). pp. (258-268)
Woishnis W. A. (1993). Engineering Plastics and Composites, 2nd ed., ASM International Materials Park, OH (1993).
www.intechopen.com
Metal, Ceramic and Polymeric Composites for Various UsesEdited by Dr. John Cuppoletti
ISBN 978-953-307-353-8Hard cover, 684 pagesPublisher InTechPublished online 20, July, 2011Published in print edition July, 2011
InTech EuropeUniversity Campus STeP Ri Slavka Krautzeka 83/A 51000 Rijeka, Croatia Phone: +385 (51) 770 447 Fax: +385 (51) 686 166www.intechopen.com
InTech ChinaUnit 405, Office Block, Hotel Equatorial Shanghai No.65, Yan An Road (West), Shanghai, 200040, China
Phone: +86-21-62489820 Fax: +86-21-62489821
Composite materials, often shortened to composites, are engineered or naturally occurring materials madefrom two or more constituent materials with significantly different physical or chemical properties which remainseparate and distinct at the macroscopic or microscopic scale within the finished structure. The aim of thisbook is to provide comprehensive reference and text on composite materials and structures. This book willcover aspects of design, production, manufacturing, exploitation and maintenance of composite materials. Thescope of the book covers scientific, technological and practical concepts concerning research, developmentand realization of composites.
How to referenceIn order to correctly reference this scholarly work, feel free to copy and paste the following:
B.L. Sharma and Parshotam Lal (2011). Growth Reinforcing Composite Materials from Liquid Phase:Mechanical and Microstructural Parameters Relationship Essentially Evincing the Predominance of an AkinMass Composition over the Domain of Compositions, Metal, Ceramic and Polymeric Composites for VariousUses, Dr. John Cuppoletti (Ed.), ISBN: 978-953-307-353-8, InTech, Available from:http://www.intechopen.com/books/metal-ceramic-and-polymeric-composites-for-various-uses/growth-reinforcing-composite-materials-from-liquid-phase-mechanical-and-microstructural-parameters-r