growth of candida utilis on amberlite with glucose and...
TRANSCRIPT

Growth of Candida utilis on Amberlite with Glucose and Ethanol as Sole Carbon':Sources . t , " ..,.~ .!.>J.... . ' I I , . ..
, , i :,::,, . .' ;? , , .
P. Chr&tenl, R. Aurial, R. Marco@, E.:Villegas?,.and :. y" .*.::.:?3:1, .,::{:,,;., :':"' ' S. , Revah2 ' .
1ORSTOM (Institut Français de Recherche Scientifi II
MEXICO i
I . . . . . L I . CoopBration), Cicer6n 609, Col. Los Moral . . .
2UAM-Iztapalapa, Dpto. de Ingenieria de Procesos,,Apd 4,09340 México, D.F., . .
, ~ .rl
. .,, . ..
The results of Candida utilis nrowth'on an anionic resin (Amberlite) at high gluce
,----- _-__. ~~ . . was a reliable on-line methddfor monitoring growth.Tbe respiratory q u b h t (RQ) showed the changes in the nktabolism o f the veast durinn nlucose consumption,from a fermentative to an oxidative route.When C. utilis was grown on gaseous
2.Txlfl cells f p ZDM)-l was attained. The imDortance of mineral salts
I . the mineral medirim was not limiting. Small amhn t s of acetaldehyde and ethyl acetate were detected at the outlet of the reactor (1.88 pl I-I and 0.87pl I-1, respectively). Ethanol accumulatedin the reactor up to 120 mg (g IDM)-l (probably an inhibitory level for this yeast). RQ remained constant at around 0.6 during the fermentation.
MATERIAL PbJD METHODS Solid state fermentation (SSF) is ar. old technique that has been recently revaluated and modernized to enhance wicrooraanisa ,
protein content of agro-industrial The yeast CanQida utilis 3,TCC 9 9 5 0 i I wastes (1,2,3) or to produce enzymes
(4) , secondary metabolites ( 5 ) , spores of fungi (6) or cheese or fruity fla- vors (7,8) . Some reports deal more
merits'.: It on potato. dextrose agar slants---and stored at.4yC.
I the ability of a Candida utilis strain to grow on various substrate/supports
I was demonstrated (12).
1
1
Furthermore, yeasts from the genius , Candida are known to be able to con- vert ethanol to ethyl acetate (13,141 or acetaldehyde (15). Both components present an economical interest in the
I
1 food additives industry (16). I
In this work, the effect of inocuium concentration and high glucose concen- trations on growth of C. utilis on a synthetic support (Amberlite) under SSF conditions was evaluated in terms
i
The inoculum was grown on a liquid me- dium composed with glucose (20 .g/l) and malt extract (20 g/1) in 150 ml Erlenmeyer flasks agitated at 200 rpm at 3OoC for 20h. The yeast was then grown on -merlite IRA-900 (Rohm & Haas) , an anionic resin, prepared ac- cording to Auria et al. (17) and im- bibed with the minimal sal!.s medium described by Thomas and Dawbon (18). This nutritive medium was used with different glucose concentrations from 40 to 240 mg/g Initial Dry Matter (IDM). For the case of cultures on ethanol, glucose (40 mg/g IDM) was used in the beginning of the fermenta- tion and then gaseous ethanol was fed.
/ / a A I u yLuuuLG c L ~ ~ y ~ acetate and ac- Culcure's wgre performed in t!ie set up etaldehvdn when fed with air enriched represented in Figure 1. i
I with gaseous ethanol was also studied.

. 8 8
1,Airsupply. 2. Humidfier, %Ar cOllector,4.Temperatureconboller 5. Water bath. 6. Column lemontor, 7. Humidifiers, 8. Ethanol supply
Figure 1. Experimental set up for SSF.
In the experiments run with ethanol, the alcohol was fed to the columns by bubbling air in pure solution as it was done for water in air. The initial culture conditions were: pH, 6; Temperature, 30°C; Moisture content, 58% (w/w); yeast inoculum concentration, 1x10~ cells/g IDM ex- cept when mentioned; aeration rate, 0.1 or 0.05 l/h.g IDM, ethanol rate feed, 5 pl/h.g IDM and packing densi- ty, 0.6 g/ml. Analvtical methods Biomass was determined by direct cell count and viability with methylene blue coloration as described previous- ly ( 1 2 ) . In liquid culture, it was found that l o 7 cells correspond to 0.092mg (12). pH was measured with a Conductronic pH meter and Aw with an Aqualab CX-2 apparatus (Decagon, USA). With the same sample, glucose was de- termined by the dinitrosalicylic acid method (19) and residual ethanol was measured by gas chromatography. Head- space analysis of the exit air was achieved for acetaldehyde, ethanol and ethyl acetate determination. Gas chromatography analysis was made with a Hewlett-Packard chromatograph equipped with a flame ionization de- tector. Nitrogen was used as carrier gas at a 4 ml/mn rate. Split ratio was 1:50. Temperature were: injector and detector, 18OOC; oven, 4OoC. Separa- tion was achieved with a Megabore HP-1 column (Length, 5m; Inner diameter, 0.53 riun), Concentrations were reported as p1 liquid/l gas. Respirometry (02 and CO2 measurements) was realized with a Gow-Mac chromato- graph equipped with a thermal conduc-
tivity detector and a concentric col- umn CTR-1 (Alltech, USA). Helium was used as carrier gas (flow rate, 60 ml/mn). Carbon dioxide production rate (CDPR), oxygen uptake rate (OUR) and respiratory quotient (RQ) were calcu- lated as follows : CDPR = (%CO2 produced x F) / (100 x W) OUR = (%O2 consumed x F) / (100 x W) RQ = CDPR/OUR. FESULTS AND DISCUSS ION Glucose as so le carbon source
These experiments were run with an in- itial glucose concentration of 135 mg/g IDM and inoculum concentration of 1.4, 2.2 and 3. 6x10⁷ cells/ml respec- t ively .
. rnfluence of inoculum size
100OF
OI .) - 1.4 10'CelWglDM
-3- 2.2 10'Cellslg IDM
A . ' 3.6 10'CellYglDM
I I .-A - _ 24 ' 4 8 72 96
Time (h)
Figure 2 .Logarithmic evolution of bio- mass vs. time. Ipf luence of inoculum size.
In Figure 2 , it can be seen' that inoc- ulum size did not have a strcny influ- ence on growth rate. There is not a significant influence on the final bi- omass (between 300 and 3 5 0 ~ 1 0 ~ cells/g IDM) and all the glucose was exhausted after 50 hours. The same conclusions were obtained in submerged cultures.
e con- gent rat i on Three different glucose concentrations were studied: 40, 135 and 240 mg/g
' IDM. It appeared that the phase lag and the fermentation time were longer, and the maximum biomass was reached later for higher glucose concentra- tions ( C f Figure 3). These mexima were related to the initial gluco: e concen- traticin (more than 5 5 0 ~ 1 0 ~ ce?.is/g IDM
. I n f l u e n c e o f c o s
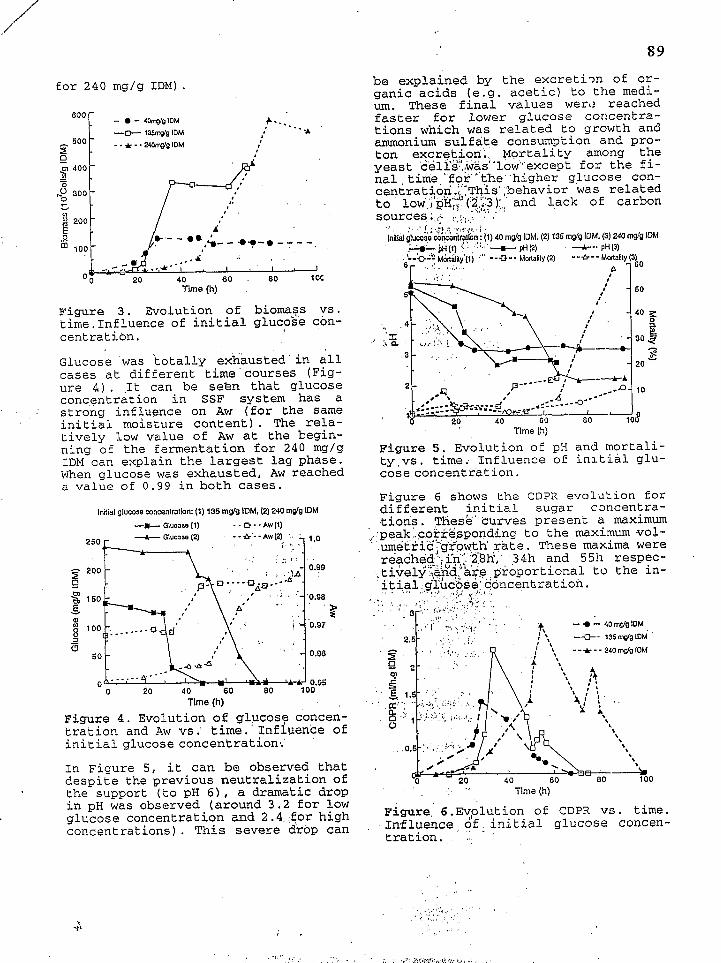
for 2 4 0 mg/g IDM).
Figure 3 . Evolution of biomass vs. time. Influence of initial glucobe con- centration,
Glucose was 'totally exhausted in all cases at different time courses (Fig- ure 4). It can be sekn that glucose concentration in SSF system has a strong influence on Aw (for the same initial moisture content). The rela- tively low value of Aw at the begin- ning of the fermentation for 240 mg/g IDM can explain the largest lag phase. When glucose was exhausted, Aw reached a value of O .99 in both cases.
Indial glucose concentration: (1) 135 mug IDM, (2) 240 mdg IDM -m- Glucose [ 1) - - Q -. Aw(1)
I '
G l u c o s e -
O 20 40 Time (h)
Figure 4 . Evolution of glucose concen- tration and Aw vs. time. Influence of initial glucose concentration:
In Figure 5, it can be observed that despite the previous neutralization of the support (to pH 6), a dramatic drop in pH was observed (around 3 . 2 for low glucose concentration and 2.4 for high concentrations). This severe drop can
i . V'
89
be explained by the excretim of or- ganic acids (e.g:acetic) to the medi- um. These final values wer\? reached faster for lower glucose concentra- tions which was related to growth and
consumption and pro- Mortality among the 1ow'"except for the fi- e"higher glucose con- s' ;behavior was related !;.;' and lack of carbon
40 mglg [OM, (2) 135 mgg IUM, (3) 240 d g IDM
-G-- Malalily (2) - pH(2) . --A--. pH(3)
--e-- MMalily (3) n 160
Time (h)
Figure 5. Evolution of pH and mortali- t y , ~ ~ . time: Influence of initial glu- cose concentration.
Figure 6 shows the CDPR evolution for different initial sugar cancentra- .tioris. ?lies&' curves present a maximum
':peak..correspondhg ? . to the maximum vol- .uqe$ric;g$g,wt-h ,rate. These maxima were reach8d~;.j~ri,~':2,8h',' 34h and 5511 respec- .tively.:iand,, a.re proportional to the in- itial:,g;uCos;e;, concentration.
Tlme (h)
Figure 6.Eyplution of CDPR vs. time. Influence of initial glucose concen- tration. .

9 0
In the cases of 135 and 240 mg/g IDM, a second peak smaller and later was observed. It appeared when glucose was exhausted and was probably due to a diauxic effect from other substrates in Figure 7. released previously in the medium (e.g. ethanol or organic acids). The maxima values of CDPR reached are com- parable with those obtained by A u r i a et a l . (17) for Aspergillus niger grown on the same support. Table 1. Summing up of the results of the glucose fermentation by C. utilis grown on Amberlite. ( * Cf Figure 10)
was initiated with glucose ( 4 0 mg/g IDM) and ethanol vapor phase fed when glucose was totally exhausted (after 24 hours). Growth evolution is shown
---&-- nuneral Iimilatlon + no mineral linutalion
- Initial glucose (mg/g) 40 135 240
Fermentation time (h) 29.5 41 80.5 a X max 11.41 27.05 52.07
CDPR max 1.42 2.28 2.13 Time (h) A R.Q.* 1.1/1.3 1.1/1.3 1.0/2.5
p max n.c. 0.55 0.58 Figure 7. Evolution of biomass vs. time. Influence of mineral medium con- centration. Growth on ethanol.
YX/S 0.283 0.201 0.225 Rx max 0.74 0.83 1.97
The interest of using the higher min- From table 1, it can be concluded that eral salts concentration was clearly biomass production, in the range of demonstrated since a final population the glucose concentrations studied, of 3 3 0 ~ 1 0 ~ cells/g IDM was reached was proportional to the initial con- centrations. The substrate conversion against 1 5 0 ~ 1 0 ~ cells/g IDM for the
lower concentration. The maxima were yields into biomass kept within a reached in the same time (about 75h). range of 0.2 to 0 .28 with highest val- The fact that the increase in biomass ue for lowest concentration. There is
no significant influence of glucose
contrary, the volumetric productivity (W) is greatly increased when sub- strate concentration is higher. There is also a clear influence of glucose level on the orientation of the metab- olism. The respiratory quotient reached * values superior to 2 ( f ermen- tative route) for 240 mg/g IDM, when these values kept near above 1 at low- er concentrations (oxidative pathway). I C. utilis, when grown on Amberlite, displayed a good tolerance toward high glucose levels, low pH value and seemed to be able to assimilate etha-. no1 - or other metabolites released in* the medium. Ethanol as consecutive Ca rbon sou rce
centra t i oq Two experiments were made: one with mineral medium concentration corre- Time (h)
sponding to 40 mg/g IDM of glucose, Figure 8. Evolution of biomass and
of 3.5 In both cases, the fermentation
concentration on growth rate. On the
.Growth and substrates consumotios
.Influence of mineral medium con
I l
the Other One a factor . substrates vs.time. Growth or. ethanol.

i 91 I From figure 8, it can be observed that
the maximum population is reached af- ter 75 hours when ethanol concentra- tion in the medium was about 40 mg/g IDM and mortality yield was 16%. It can be seen that ethanol in the column increased constantly and with a higher velocity after 2 4 hours of culture on this substrate, which probably meant that the concentration reached was limitating but not lethal for the yeast (about 2 0 mg/g IDM) . Meanwhile, the mortality yield increased up to 80% at the end of the fermentation. The yeast displayed a better tolerance toward ethanol than observed previous- ly (131, which can be due to a protec- tive effect of the support. The pH dropped to 2 . 5 in the first 30 hours and then kept constant around this value. Water activity was constant above O . 98 all along the experiment ;- It can be concluded from these da.ta that SSF is an adequate system for the growth of C. u t i l i s on gaseous sub- strate. 4
.Ethanol ethvl acetate a nd aceta 1- dehvde evolution in the exit aag According to Armstrong et al. (13), ethyl acetate production from ethanol for C . u t i l i s follows three steps:
I
1.Ethanol + O2 - - - -> Acetaldehyde 2.Acetaldehyde + 02 - - - -> Acetic acid 3.Ethanol+Acetic ac. --->Ethyl acetate i H20
These reactions are catalyzed by alco- h o l dehydrogenases (steps 1 and 2) and by an esterase (step 3). The evolution of ethanol, acetaldehyde and ethyl acetate concentrations in the exit gas is plotted in figure 9.
--t Ethyl Acelate - 8 - Ethanol --4--Acelaldehyde
I :: w 1.5 5 3 Q
' 2 % E
0.53 Q
Q
9 S li 140 0 -
Time (h) Figure 9. Headspace of solid state culture of C. u t i l i s grown on ethanol.
The curves shown in figure 9 can be divided in three regions. From 2 4 to 55 hours, exit ethanol concentration increased as well as ethyl acetate and acetaldehyde, this one presented a maximum around 36 hours. From 55 to 75 hours, a steady state was set and the three concentrations remained con- stant. From 75 hours, when growth stopped, ethanol concentration in- creased again in relation to the con- centration of the liquid phase, xe- flecting the fact that it was not con- sumed. No evidence was found that non- growing C. utilis'cells produced ethyl acetate or acetaldehyde. Most of the time, acetaldehyde levels were above those of ethyl acetate. Levels of both compounds were low probably because ethanol concentration was too high, pH low and hence inhib- ited redox enzyme system of the yeast. It should be observed that neither ac- etaldehyde nor ethyl acetate were de- tected in the solid state r6edium. By integration of the ethyl acetate and acetaldehyde curves, it was calculated that 23 mg and 38 mg were produced re- spectively. Finally, a comparison of the respira- tory coefficients i n three cases is presented in figure 10.
2.5 2 E f, Initial g:Lcose concenlralion: : ', -.P- 135nglgIOM
--A--- 240nglgIOM '\ I '.
0.5
O 20 40 60 80 1 O0 Time (h)
Figure 10. Evolution of the respirato- ry quotient vs. time on different glu- cose concentrations and on ethanol.
The evolution in each case is very significative:
. for 135 mg glucose/g I D b l , RQ kept constant around a value of 1, charac- teristic of the oxidative mtabolism of glucose, where :
I

92 , . .
Glucose + 602 ---> 6~02 + 6H20 + 28.ATP (theoretical RQ = 1) . for 240 mg glucose/g IDM, 'RQ var-
ied between 1 and 2.5. This is charac- teristic of a partial orientation of outlet gas phase. R. Marcos was a post-graduate student from the metabolism toward a fermentative . .
ENSBANA (Dijon-FRANCE). This work was route sensu s t r i c t o , where : . achieved under research agreement between UAM Glucose ---> 2C02 + 2 Ethanol + 2 ATP
(theoretical RQ ---> -1 . for growth. on.. ethanol, RQ , was . constant, around 0..6. This represents : the oxidative metabolism of ethanol- where : Ethanol + 302 --i> '2C02 + 3H20' +: 1lATP. ' .
Although C. u t i l i s showed its capacity to grow on e.thano1 ' as sole carbon n rate (ml/h) '
source, the overall results of ',':the,.* :OUR' Oxygen uptake rate (ml/h.g IDM) fermentation are lower than those~"ob- , : . . I
tained on .glucose (pax', R x max) basi- cally for the reason given above'.,'(cf . ., . . Rx . Volumetric growth rate (mg bio- Table 2). Table 2 . Kinetic parameters of the W . Initial dry matter weight (9) fermentation of ethanol by C. u t i l i s on Pmberlite.
a tolerance of the'yeast toward ethanol. -. Although the conditions were not Opti- , mized,. low excretion of ethyl acetate and acetaldehyde were obtained in the
ICO) and ORSTOM (FRANCE).
ater activity ( - ) . - ;. 1. : .
(theoretical RQ = 0.67) ' ... ',;, ; :. . , ' . e production rate , , /. 7, r
"',' 'R:'Q. . I I Respiratory quotient (-i
mass/g.h) .
X Biomass (mg/g IDM)
, '
. . 9. . ' I .. .. ' .J ' .
. . "'* Yx/s Biomass yield on substrate
O .5/0.72 ' p Specific growth rate (h-l)
(g biomass/g substrate) . , i ..i . ! . , I
A R.Q. p max 0.13 LITERATURE CITED Rx max O. 41 'R 1. Raimbault, M. and A. Alazasd. Eur.
J. A p p l . Microbiol. Biotecbnol. , 9, LUS1 . 199 (1980).
:::his z r k , the influence of glucose concentration on growth was shown. It
lag phase duration and yield of ..sub-: strate conversion into. biomass, werè:, dependent on initial g1ucos.e CO tratiÒn as,,kwell, as the type of, met
r;' '2. BaldensPergert J. I J. Le MerI L. . . . Hannibal and P. J. Quinto. Biotech-
nol . L e t t . 7 , 7 4 3 (1985)..
8 -Aidoo, K. E. , R . Hendry and B. J. B. lism (oxidative or oxidative/fementa- Wood. Adv. APP~. Microbiol. I 28,
201 (1982).
. . Desfarges, C. , C . Larroche and J.B. Gros. Biotechnol: Bioeng. ,29, 1050
gaseous ethanol. It was shown 'that mineral salts Concentration .could be a 8 * p. E* ana limiting factor f o r growth and that. C. u t i l i s was able to use ethanol for.its growth and to produce other metabo- . '.ilg. Grant, G . A . , y.w. Han and A.W. An- lites. Moreover, the SSF system pro- " ' dersson. A p p l , Env. Microbid . , 3 5 , vided the, advantage to increase the
vah. Biotechnol. L e t t . Subinitted (1994).

.....