growth monitoring report 2017 - edmonton
TRANSCRIPT

OUR GROWING CITY
annual growth monitoring report 2017

01
2017 growth monitoring report
Edmonton is a city that continues to attract, house and employ people. The city continues to grow at a fast pace, and there is a need to maintain its vibrancy and quality of life.
The City of Edmonton and our partners strive to strike a balance between preserving ecologically sensitive land, supporting the revitalization of downtown, densifying mature areas, and accommodating new development in a sustainable manner.
Each year the City endeavours to deliver infrastructure and services that are most important to Edmontonians while managing the opportunities and challenges of an ever-changing city. Our annual Growth Monitoring Report tracks how we are doing in this regard.
The City’s vision is outlined in The Way Ahead, which contains key directional plans to shape the way we grow our city, green our environment, live in our community, move people and goods efficiently, prosper
OUR SHARED VISION
locally and globally, and finance our needs responsibly and strategically. Edmonton’s vision provides the platform for building the kind of communities that deliver choice, diversity, resiliency, sustainability, and innovation.
Several key initiatives demonstrate how the City's vision guides Edmonton’s growth. Transit Oriented Development, West Rossdale, Blatchford, and Downtown redevelopment are helping our central neighbourhoods and areas along Edmonton’s expanding LRT routes grow “upward.” Ongoing efforts to enable infill opportunities in our mature and established neighbourhoods help our city grow “inward,” and the construction of new neighbourhoods in developing areas enables our city to grow “outward.”
Together, we are building the Edmonton we are proud of: resilient, innovative, strong and sustainable. Together, we will create and invest in our shared future.

02
Message from the Chief Planner
I am pleased to present the fourth edition (2017) of the Growth Monitoring Report. Over the past three years (2014, 2015 and 2016), this annual report has become a much anticipated publication, providing reliable data that informs sound and responsive decision making in a city of continuous growth and change. The trends outlined in the report begin to highlight some of the challenges and opportunities that rapid urban growth presents.
At a current population of 932,546, the City of Edmonton is the fastest growing major city in Canada. If this pace of population growth continues, the Capital Region Board anticipates that Edmonton will require a minimum of 150,000 new housing units by 2040.
Given this trend, the City continues to facilitate the transition of residential growth patterns towards an improved balance between greenfield and infill development. For example, last year the City came close to attaining its infill target of 25% of new residential units in mature and core areas. This was in part due to over 700 residential units being permitted for the core. Our data indicates that we are consistently adding to our housing stock in mature and core areas. In the past year, the city experienced the addition of 2,022 net new units in mature and core neighbourhoods compared to 1,701 net new units in 2015.
This change makes 2016 the highest net unit growth year in our core and mature neighbourhoods in the last ten years.
In terms of the unit types added, the report demonstrates that there has been a continued shift towards multi-family units. In fact, the highest percentage of unit growth this past year occurred in apartment units.
The City of Edmonton will continue to work with our partners to build a more diverse housing supply in Edmonton, building townhouses and mid-rise multifamily housing on main transit corridors and around transit stations to support transit and retail. This will create more livable, walkable, compact communities, giving Edmontonians more choices to walk and use public transit to run their daily errands, in human scale, vibrant urban villages.
I am enthused by the growth of the city and the opportunities it presents. We at the City, are looking forward to working with our partners and stakeholders to use the data presented in this report to provide the evidence needed to build resilient, vibrant communities, that will continue to grow and prosper.

03
2017 growth monitoring report
table of contents
1.0 Monitoring Growth and Change 04
2.0 Edmonton’s Place in the Region 08
3.0 Edmonton’s Demographic Update 18
4.0 Land Use and Development 24
5.0 Development Patterns and Trends 36
6.0 Spotlight on Non-residential Land 54
7.0 Housing in the City 58
8.0 Hot Spots for Growth 74
9.0 Appendices 84
A References 86
B Definitions 87
C Zoning Summary 88
D Methodology Notes 91
E Edmonton Zoning Trends 2006-2016 92

04
1
04

05
2017 growth monitoring report Monitoring Growth and Change 1.0
Edmonton is a great city that continues to attract new residents. In order to accommodate growth in a fiscally, socially and environmentally responsible manner, The Way We Grow, Edmonton’s Municipal Development Plan, directs the management of future public obligations and growth opportunities through a long-term growth coordination strategy.
In November 2012, Council approved the Growth Coordination Strategy. The Strategy provides a framework to identify and manage future public obligations and to accommodate expected growth through monitoring, reporting, coordination and communication. A key element directed by the Strategy is the preparation of an annual Growth Monitoring Report.
“ The notion of city building resonates in different ways for different people. Whether it’s our ability to compete around the world, or thoughtful planning and great urban design, or ensuring this is an inclusive place for all who choose to live here — city building, in fact, is all of this. It’s the infinite combination of things that make Edmonton more livable, more beautiful and more prosperous each day.”
Mayor Don Iveson, 2016 State of the City Address
monitoring growth and change

06
Following direction from the Growth Coordination Strategy, this report contains information on Edmonton’s neighbourhoods, which are divided into four geographic areas based on The Way We Grow:
Core areas (downtown and adjacent neighbourhoods)
Mature areas (neighbourhoods outside the core, generally completed prior to 1970)
Established areas (completed neighbourhoods, generally within the Anthony Henday Transportation Corridor)
Developing areas (currently developing and planned neighbourhoods where lot registration is not yet complete)
(See Map 1.1)
This is the fourth annual Growth Monitoring Report. This document reports on 2016 growth in the city, containing information on key demographic, residential and non-residential growth trends across the city. It builds on growth-related measures tracked throughout the year. The report provides the reader with snapshots in time on certain attributes of urban growth.
How does this report work?
This report offers a summary snapshot of city growth supported by detailed reports, open data sets and complementary links. Using a layered approach, this report is structured as a “portal” into the diverse and detailed information the City of Edmonton collects, maintains, analyzes and shares about its physical development and population growth trends. Through this report, readers are linked to increased levels of information to match their own analytical needs.
To help inform the report’s development, a Growth Coordination Committee composed of diverse stakeholders, including the development industry, private and public sector partners, community groups, and other city departments, provided input on its content and presentation style. The purpose of their feedback was to understand what types of data and information users require and how this might best be communicated to meet the needs of multiple audiences.
The Committee identified the importance of an integrated communications approach for the release, timing, distribution and cross-referencing of the city’s growth-related information in a variety of formats. As such, this report will be complemented by an information framework that makes data and analysis available throughout the year via ongoing publications and summary reports, newsletter updates, a streamlined website, better links and the continual release of open source data. Future annual reports and the communication of key information will continuously improve to adapt to stakeholder needs over time.
Information is sourced from Statistics Canada, the Canadian Mortgage and Housing Corporation (CMHC), and City of Edmonton sources and is current as of

07
2017 growth monitoring report Monitoring Growth and Change 1.0
Core areas
Mature areas
Established areas
Developing areas
Urban growth area
River valley & ravine system
Transportation & Utility Corridor
Industrial area
map 1.1
neighbourhood
classification
Neighbourhood Classifications in this report are as per "The Way We Grow" Municipal Development Plan (2008) unless otherwise noted. Minor variances may occur due to land use and existing bylaws

08
2
08

09
2017 growth monitoring report Edmonton's Place in the Region 2.0
by 2044, the capital region will have roughly the same population (2.2 million) as the current metro area populations of vancouver, portland, denver, stockholm and liverpool.
Edmonton is growing. Keeping pace with this growth remains a challenge. Edmonton is the urban centre of a resource-rich economic region and a gateway to global trade where goods for a global market are produced and distributed.
The city is the heart of the Capital Region. The Capital Region is composed of 24 diverse municipalities – five cities, eleven towns, three villages and five counties. The largest are Edmonton, St. Albert, Spruce Grove, Stony Plain, Leduc and the counties of Leduc, Parkland, Strathcona, Sturgeon and Lamont (see Map 2.1). Edmonton provides wide range of services, employment and housing choices to the entire region.
By 2044, jobs in the Capital Region are projected to grow from 725,000 to 1.2 million with Edmonton accounting for approximately 909,000 of those jobs. Projections indicate Edmonton will grow its share of jobs within the region based on current and future efforts to expand its employment base across all sectors. Based on this anticipated increase, it is estimated Edmonton will require a minimum of 150,000 new housings units by 20401.
1 Source: The Capital Region Board
edmonton's place in the region

10
Edmonton has consistently maintained a majority of housing starts within the Capital Region. While housing starts dropped significantly in Edmonton and the Capital Region in 2016, 72% of the region’s total housing starts occurred within the city. This is higher than the ten-year average of 68%. Over this same period, the city’s regional share of single-detached and multi-family (semi-detached, row housing and apartments) has averaged 61% and 74% respectively. With several smaller communities surrounding Edmonton, the city must provide complementary housing options to those available within the region. Ensuring growth is both coordinated and efficient is integral to providing cost-effective housing.
map 2.1capital region
With about 30% of the province’s population, the region represents 40% of Alberta’s GDP.
1 Source: Canada Mortgage and Housing Corporation
REGIONAL HOUSING STARTS 1
2015 2016 Change %Change
Single-family 3,957 3,079 - 878 -22.2%
Multi-family 9,354 4,184 -5,170 -55.3%
Total housing starts 17,050 10,036 -7,014 -41.1%
Please see Appendices for more information on Canadian Mortgage and
Housing Corporation
These growth pressures have been reflected in an active housing market, with 79,523 housing starts between 2007 and 2016 inclusive.

11
2017 growth monitoring report Edmonton's Place in the Region 2.0
Since the 2011 federal census, edmonton’s population has grown from 812,201 to 932,546.1 that is an increase of over 120,000 people in five years. When examining population and density, the Capital Region Board organizes the region into three tiers; the Metropolitan Core, Metropolitan Area and Rural Area. Map 2.2 shows the Metropolitan Tiers and the Capital Region’s current residential densities, sourced by Statistics Canada data. When the Edmonton Metropolitan Region Growth Plan is approved by the Government of Alberta, our minimum density targets within the Metropolitan Area will range from 35 to 45 du/nrha while the Metropolitan Core will strive for the region’s highest urban densities with aspirational targets well above 100 du/nrha
1 Source: Statistics Canada
map 2.2 dwelling unit density by metropolitan tiers

12
With an eye to creating a resilient, future-ready Edmonton Metro Region, nine Edmonton-area mayors recently came together to form the Metro Mayors Alliance. These municipalities share the greatest risks and consequences if the Metro Region is not competitive in today’s global marketplace.
The municipalities represented
in the metro mayors alliance –
edmonton, fort saskatchewan,
leduc, leduc county, parkland
county, spruce grove,
st. albert, strathcona
county and sturgeon county
– account for 95% of the
region’s population, 96% of
its assessment base and about
80% of its land base.
A core concept of successful metro regions is the ability to plan, decide and act as a region. This requires bringing the critical cornerstones of competitiveness together into strategic, aligned systems across a region. While there are many recognized drivers of competitiveness in city-regions, three stand out as most critical for this region:
economic development,
public transit, and
land use and infrastructure development.
These three cornerstones are the primary factors considered by investors when deciding where to locate new industries and major facilities. If aligned, they provide a strong foundation for this Metro Region to achieve its economic, social and environmental goals.
Another core concept of successful regions is the capacity to negotiate and manage shared investment (costs and risks) and shared benefits (revenue, assessment and other returns) from projects. This requires appropriate agreements to be in place and the forum or platform for these negotiations.
The Advisory Panel on Metro Edmonton’s Future was appointed by the Metro Mayors Alliance. In June 2016, the Advisory Panel released a report, “Be Ready, Or Be Left Behind,” that provides a roadmap for creating a globally competitive, future-ready Edmonton Metro Region.
The Edmonton
Metro Region and the
Metro Mayors Alliance

13
2017 growth monitoring report Edmonton's Place in the Region 2.0
The report concluded the Metro Region is better served with a collaborative voice on significant regional infrastructure priorities, representing over one million people and presenting a united case to other orders of government on infrastructure funding priorities for the region. Municipal Government Act amendments call for a regional body that would ensure such collaboration through land-use planning, servicing of growth, regional service delivery, cost-sharing and dispute resolution.
This collaboration will foster good governance and promote good land use and infrastructure planning. Related regulations are currently being developed.
working together to make the edmonton metro region globally competitive.
Investment dollars for regional infrastructure are pooled and leveraged for optimal regional benefit. Municipalities act with a “shared investment, shared benefit” philosophy to make capital investments in regionally significant infrastructure that supports the Metro Region becoming globally competitive. The pooling of investment dollars enables greater “bang for the buck,” providing benefits to Metro Region taxpayers.
The work of the Metro Mayors Alliance and its Advisory Panel has proven to be very influential in upcoming changes to the intermunicipal governance structure that exists in the region.
For more information, visit edmontonmetropanel.ca.

14
What is the Municipal Government Act (MGA)?
The MGA is one of Alberta’s largest pieces of legislation and helps guide how our municipalities operate. The Act governs 349 municipalities across the province, from a summer village with a population of 10 to a big city such as Edmonton with a population of more than 930,000. The Act focuses on governance and administration, assessment and taxation, and planning and development.
The Modernized Municipal Government Act (MMGA) Bill 21 was passed by the Alberta Legislature in December 2016. This act introduced changes in three major areas: Planning and development, Governance and administration and Assessment and taxation. The regulations required to implement these changes are being developed and are expected to be released Summer 2017. The amendments impact how municipal reserve (MR) is assembled for schools and parks giving municipalities the ability to define a geographical area in a developing area that will benefit from larger assembly of land sites. The MMGA also expands off-site levies to include fire halls, police stations, libraries, and community recreation facilities.
For more information on the modernized MGA, visit mgareview.alberta.ca or the City of Edmonton website.

15
2017 growth monitoring report Edmonton's Place in the Region 2.0
CITY OF EDMONTON CHIEF ECONOMIST
Edmonton’s Economic Outlook – Firmer Oil Prices Support a Return to Growth
A recovery in energy prices from their lows in early 2016 has helped to stabilize employment and economic output for both the City of Edmonton and the Capital Region in early 2017. Both economies will expand at about 2% in 2017, which will be slightly below the forecasted growth rate for Alberta and Canada. Solid employment gains in health care, education and financial services will make up for continuing weakness in areas such as construction and manufacturing over the course of 2017.
Looking forward, oil prices will continue to rise but at a slow and irregular pace. This, in turn, will provide support for a modest improvement in energy-related activities throughout Alberta. With its more diversified economy, the City’s growth rate will gradually rise above that of the province as sectors such as professional and financial services expand. This higher level of growth in the medium term will attract individuals from other parts of the province as well as Canada to Edmonton, boosting population growth. Annual population growth will be about 1.9% over the next decade which, while well above the national average, will be slightly slower than the growth rates seen in Edmonton between 2010 and 2016.
a growing population requires services such as public transit, police services and affordable housing.In the longer term, growth rates will level off and begin to slow as an aging population constrains growth in the available labour force. However, a relatively young demographic will mean that Edmonton will experience an easing of growth that will be much less than that forecasted for many other metropolitan areas. Moving towards 2021, real GDP growth is expected to average about 2.8%, which will be well above the comparable rates for Alberta and Canada.
While Edmonton’s population continued to expand during 2016, the stock of multifamily housing units also grew rapidly with the result that the rental vacancy rate moved up from 4.2% in 2015 to 7.1% in 2016. Ongoing population growth in Edmonton will gradually bring the vacancy rate down over the period to 2021.
Lower sales for both existing and new homes and a rising stock of new homes resulted in limited declines in average house prices in Edmonton during 2016. Consequently, housing costs continue to be very favourable compared to other markets such as Toronto and Vancouver. Edmonton’s housing affordability remains one of the best among Canada’s largest metropolitan areas.
Inflation as measured by the Consumer Price Index (CPI) remained low in 2016 as lower costs for food, electricity and gasoline offset higher home heating costs. Edmonton’s inflation rate over 2016 was 1.1%, unchanged from 2015. The rate for Canada in that same period was 1.4%. In the first quarter of 2017, inflation in Edmonton rose to just above 2% as higher energy related costs drove up the CPI. This impact will be temporary and inflation should slow over the course of 2017 as lower shelter costs offset the impact of higher gasoline and home heating costs.
For more information, please contact the Urban Development Institute, at www.udiedmonton.ca
% AVERAGE ANNUAL GROWTH
2017–2021 2017–2026
CITY OF EDMONTON
REAL GDP 2.8 2.7
POPULATION 2.0 1.9
EMPLOYMENT 2.0 1.7
HOUSING STARTS (UNITS) 9,150 9,690
EDMONTON CMA
REAL GDP 2.5 2.8
POPULATION 2.2 2.2
EMPLOYMENT 1.7 2.1
HOUSING STARTS (UNITS) 11,780 12,190

16
a market perspective:
Urban Development Institute
UDI-ER is pleased to provide input into the fourth Growth Monitoring Report, 2017. Over the years, this report has proven to be an important source of land supply intelligence for Edmonton. It provides our members with invaluable data required for evidence based decision making in the development industry.
The 2016 Federal Census reports that the Edmonton’s population has increased by over 120,000 since 2011. Edmonton has the fastest growing population of any Canadian city of its size. In 2016, despite the current economic climate, the City did not see a significant drop in construction values City wide. The City continues to grow and develop at a healthy pace.
In this context of rapid local population growth and global economic uncertainty, it is imperative that planning decisions relating to future city growth are backed by the most comprehensive research and analysis possible. Development must be evidence driven, based on practical analysis of market conditions, growth projections, and demographics. The Growth Monitoring Report allows for a shared understanding of our past, current and projected growth, which is critical to move the Region forward as a whole.
UDI-ER strongly supports the City’s The Way We Grow, a directional plan aimed at setting out where the city is going and how it wants to get there. Moving forward UDI-ER is keen to work with the City in creating a shared vision of growth. UDI- ER recognizes that creating a shared vision is hard, time-consuming work that requires collaboration, creativity, and trust. The implementation of the vision requires consistent and disciplined public policy that supports development in the long term.
In today’s global economy, metropolitan regions - not municipal jurisdictions - are the units of economic competition. Thus, competition for jobs or businesses between local jurisdictions weakens the region’s ability to compete in the global economy. All the jurisdictions in the region are interdependent, and the metropolitan region functions as a whole economically. UDI - ER’s position is that regional collaboration makes the region more efficient, competitive, and attractive and can improve the economic well-being and quality of life for everyone.
UDI-ER stands alongside the City of Edmonton, as a partner, in realizing a strategic vision and approach for the Region’s economic growth and prosperity.
For more information, please contact the Urban Development Institute, at www.udiedmonton.ca
The Urban Development Institute-Edmonton Region (UDI-ER) is a non-profit association representing the land development industry. Our members are development companies and professionals involved in the industry, such as planners, surveyors, architects, landscape architects, engineers, contractors, lawyers, financial managers, municipalities, and utility companies.
Recognizing that the development of land is an essential function of our economy, UDI-ER’s activities and objectives focus on Building Communities Together through promoting wise, efficient and productive urban growth.

17
2017 growth monitoring report Edmonton's Place in the Region 2.0
a market perspective:
Infill Development in Edmonton Association The Infill Development in Edmonton Association (IDEA) is a non-profit association working to promote and advocate for complete communities with diverse housing and healthy lifestyle choices. We believe that infill development can be creative and appropriate - so that Edmonton's existing neighbourhoods are great places to live for a diverse range of family types, income ranges, and age groups. IDEA would like to highlight five points of interest for the report:
1. There is a disconnect in Edmonton between housing type options and average persons per household. As per the data in the 2017 Growth Monitoring Report, 60% of households in Edmonton have two or less people living in them, however 50% of the housing stock in our City are single detached homes. Providing smaller and more sustainable housing typologies would meet the needs and wants of a 1-2 person household.
2. Edmonton is a young city with 40% of our population ranging between 20 – 44 years old. However, with limited options outside of a single detached home, Edmonton has created a situation where homeownership is difficult. IDEA is also seeing a cultural shift happening in what people want out of their homes. Proximity to local amenities and a decrease in commute times has started to take precedence over larger parcels of land with front attached garages. It is important to note that with high land costs and additional regulations, infill becomes unaffordable for the younger half of this age group.
3. Despite the economic downturn, infill development saw growth and housing prices in core and mature neighbourhoods stayed relatively constant.
4. Our Capital Region Growth Plan has set density targets for the Edmonton Metropolitan Region at 30 – 45+ dwelling units per net residential hectare (du/nrha). Although we are slowly increasing our density
in mature neighbourhoods to 26.3 dwelling (du/nrha) and in developing neighbourhoods to 30 (du/nrha), the City is short of reaching the regional target. IDEA recommends that to make the best and most efficient use of our land and existing infrastructure, our inner city neighbourhoods should aim to meet or exceed the density targets of our new developing communities.
5. Based on the Capital Region job and housing projection, Edmonton will require a minimum of 150,000 new housing units by 2040. The City has established a target of 25% infill within the mature and core neighbourhoods which implies that 112,500 housing units will be developed at the city perimeter. As per the 2016 Census, the City of Edmonton currently has 387,950 private dwellings. Based on those projections Edmonton would need to increase in land size by approximately 30% in 23 years to accommodate 112,500 housing units using status quo projections.
Throughout this report and other City policies, the City of Edmonton supports creating a diversity of housing types for diverse groups of people. IDEA will be working over this next year to gather further market research and answer questions regarding missing housing typologies that are not being met by the current market. We encourage you to join the conversation at www.infilledmonton.com. For more information on IDEA, go to www.infilledmonton.com

18
3
18

19
2017 growth monitoring report Edmonton's Demographic Update 3.0
the capital region board forecasts there will be up to 2.2 million people living in the capital region by 2044.
edmonton’s demographic update
Over the past ten years, Edmonton's population has increased by 28%. Since 2011, the Edmonton Census Metropolitan Area (CMA) grew by 13.9%, making it the second fastest-growing CMA in Canada after Calgary (see Figure 3.1). Source: Statistics Canada
CITY VS. CENSUS METROPOLITAN AREA
Statistics relating specifically to Edmonton – city statistics – are defined by the geographic boundaries of the City of Edmonton. Statistics relating to the Edmonton Census Metropolitan Area (CMA) include the twenty-four municipalities within the Capital Region as well as the four nearby reserves of the Alexander First Nation, Stony Plain 135 of the Enoch Cree Nation and Wabamun 133A and 133B of the Paul First Nation.
A young, growing population

FIGURE 3.3 CITY POPULATION PERCENTAGE CHANGE (1971-2016)
1,000,00
900,000
800,000
700,000
600,000
500,000
400,000
300,000
200,000
100,000
0
18%
16%
14%
12%
10%
8%
6%
4%
2%
0%
-2%1971 1976 1981 1986 1991 1996 2001 2006 2011 2016
Growth RateTotal Population (Edmonton City)
5.9%6.1%
7.3%
-1.1%
7.7%
11.3%11.2%
14.8%16.6%
FIGURE 3.1 CMA POPULATION CHANGE (2011-2016)
Edmonton
Calgary
Regina
Saskatoon
Winnipeg
Vancouver
Toronto
Montreal
0% 2% 4% 6% 8% 10% 12% 14%
FIGURE 3.2 CITY POPULATION PERCENTAGE CHANGE (2011-2016)
Edmonton
Calgary
Regina
Saskatoon
Winnipeg
Vancouver
Toronto
Montreal
0% 2% 4% 6% 8% 10% 12% 14% 16%
13.9% 14.8%
20
THE FASTEST GROWING CITY IN CANADA
the city of edmonton’s population is 932,546, or 2.7% of the total population of canada. since the federal census in 2011, edmonton has grown by 14.8%, making it the fastest growing major city in canada.

21
2017 growth monitoring report Edmonton's Demographic Update 3.0
30,780 31,04529,025 29,880
41,645 43,135 35,580 37,215
30,820 31,950
41,980 43,42534,235 34,880
24,840 26,01023,515 24,835
27,385 28,71029,470 30,600
160 30935 275
3,290 1,4156,325 3,900
8,850 6,31510,620 8,470
13,300 11,330
25,030 24,50529,795 29,820
19,075 18,145
the average age in edmonton is 37.7 compared to 41 in the rest of the country.
Edmonton provides a wide range of economic opportunities inciting working age people and their families to move here.
AGE STRUCTURE
Edmonton is home to one of the youngest populations in the country with 31% of its population under the age of 25.
FIGURE 3.4 POPULATION PYRAMID (CITY OF EDMONTON, 2016 FEDERAL CENSUS)
100+
90-94
80-84
70-74
60-64
50-54
40-44
30-34
20-24
10-14
0-4
AGE
RAN
GE
Population
Female
Male
| | | | | | | | | | |50,000 40,000 30,000 20,000 10,000 0 10,000 20,000 30,000 40,000 50,000

22
Source: Statistics Canada 2016
AVERAGE AGES IN CANADA'S LARGEST CITIES
Another growing segment are those aged 50-64 (pre-retirement). This segment is forecast to continue growing.
Edmonton’s young population and the growing pre-retirement segment suggests that planners need to cater to both of these fastest growing segments. We as a city need to continue to discuss when and how we are to prepare for aging societies in our long-term priorities. We will continue our discussion about when and how we are to build public awareness about aging and focus on the capacities of seniors to lead autonomous and active lives.
This means continuing to redesign our transit system to consider mobility issues, examine how we provide amenities, ensure housing affordability and develop policies that promote health, well-being and aging in place. On the other spectrum, a young population also has implications for providing sufficient employment opportunities, amenities, affordable housing, schools and entertainment.
City planning will need to meet current needs while addressing the future for both segments.
40.6toronto
40.3montreal
37.6calgary
40.1ottawa
39.6mississauga
39.9winnipeg
42.5vancouver
36.5brampton
41.5hamilton
37.7edmonton
41canada

23
2017 growth monitoring report Edmonton's Demographic Update 3.0

24
4
24

25
2017 growth monitoring report Land Use and Development 4.0
Edmonton’s development is diverse, with residential, commercial, industrial, institutional and recreational land uses throughout the city (see Map 4.2). Combined, Edmonton’s different land uses and development patterns support a range of buildings, landscapes and amenities that create a vibrant city and provide a range of opportunities for people to live, work and play.
Development patterns shift and change as the city grows. This section provides an overview of Edmonton’s growth with respect to its non-residential and residential land use patterns and land use supply.
Edmonton’s history is characterized by periods of rapid growth. The city has expanded its boundaries several times since its incorporation (see Map 4.1) to accommodate waves of newcomers lured by
LAND USE & DEVELOPMENT
a diverse range of economic opportunities. After World War II and the 1947 discovery of oil in Leduc, Edmonton experienced a growth spurt that lasted twenty years when Edmonton’s compound growth rate hovered around 5-6%, and the city’s area doubled to accommodate the demand for residential land. The most recent municipal boundary change was in 1982. This change was followed by the low-growth years of the later 1980s and the 1990s when the compound population growth was less than 1%.
since 2009, edmonton has experienced rapid expansion at a compound growth rate1 of 2.1%,prompting further expansion of city boundaries.1 Compound growth calculation is a measure of growth over multiple time periods. When growth rates fluctuate from year to year, a compound growth rate can be used to measure growth over a certain time period, combining data from individual years.
Diverse Development to Meet a Diverse Population

26
map 4.1 edmonton's boundary history
LEGEND
Edmonton 1892Annexation 1899-1908Annexation 1911-1922Annexation 1947-1959Annexation 1960-1969Annexation 1970-1976Annexation 1980Annexation 1982Proposed Annexation (as of 2017)
N
1980
1969
1922
1892
1908
1959
1976
1982
PROPOSED
PROPOSED

27
2017 growth monitoring report Land Use and Development 4.0
map 4.2 edmonton's general zoning category (april 2017)
Residential
Commercial
Industrial
Direct/Mixed Development
Agriculture and Reserve
Agriculture and Reserve in Industrial Neighbourhoods
Urban Services - Parks
Urban Services - Other
Transportation and Utility Corridor

28
Edmonton supports a diversity of land uses: residential, commercial, industrial, institutional and recreational (see Map 4.2). The city shapes the different types of uses and built form for any given land parcel, as well as the area committed to those uses, through the zoning process.1
Development patterns change as the city evolves and different land uses are established in different areas. In order to ensure sustainable development patterns, the city strives to maintain a balance between different zones.
1 For more information, refer to the Appendix or see Edmonton’s Zoning Bylaw 12800 (www.edmonton.ca/zoningbylaw)
for the past decade edmonton has converted an average of 1,000 ha of agricultural/ reserve zoned land annually into urban zones. the decade-long pattern of a 2:1 ratio of residential to business employment (industrial/commercial) land area continues.
the city's total area is 70,000 square hectares (700 square kilometres).
Direct control zones are used to define unique regulations or accommodate mixed uses, so Edmonton’s actual land use breakdown may under-represent areas where specialty zoning is more common, such as the downtown.
Special “direct control” zones account for 4.4% of land uses (up from 4.3% in 2016), transportation/utility corridor (TUC) 12.6% (up from 6.5% in 2016) and agricultural/reserve 24.8% (down from 25.5% in 2016), representing a decrease from 17,860 hectares (ha) in 2016 to the current 17,340 ha.
Residential Commercial Industrial Institutional Parks & Open Space
Direct Control TUC2 Agriculture
& Reserved
As of Feb. 2016
32.5%2.5%
12.6%6.8%
10.0% 4.4%6.5%
24.8%
32.3% 2.5% 12.3% 6.8% 9.7% 4.3% 6.5% 25.5%
2 Transportation/Utility Corridor
How big is a hectare? A hectare is about 2.47 acres. The grass surface within the running track of Commonwealth Stadium is approximately one hectare.
LAND CLASSIFICATION (AS OF FEBRUARY 2017) NUMBERS HAVE BEEN ROUNDED TO ONE DECIMAL POINT

29
2017 growth monitoring report Land Use and Development 4.0
THE SEQUENCE OF NEIGHBOURHOOD PLANNING AND DEVELOPMENT
Area Structure Plans (ASP) apply to generally 600 (or more) hectares of land. Area Structure Plans provide a high-level development concept identifying the general location and configuration of residential, commercial, institutional, public open space and utilities, and the alignment of major transportation infrastructure including LRT, highways, and arterial and collector roadways. Area Structure Plans also outline a scheme to service and stage the development of the Plan area. In preparing an Area Structure Plan, the City collaborates with the development industry and others (e.g, schools, utilities) to ensure the development concept and servicing scheme comply with the City’s applicable policies and standards and appropriately addresses the constraints and opportunities present in the Plan area. It is at this stage that the City evaluates, understands, and begins to identify the infrastructure and service needs attributable.
An Area Redevelopment Plan (ARP) is used for the purpose of facilitating development in a specific geographic area. They differ from ASPs in that they apply to areas that have already been developed. They are used to guide how an existing built-up area or neighbourhood should develop in the future.
A Neighbourhood Structure Plan (NSP) is a required land use concept plan for any large undeveloped parcel of land generally one quarter section (160 acres) in size or larger that will support approximately 4,000 to 7,000 people. It is a statutory plan requiring City Council approval.
Zoning is applied to land in compliance with the Area and Neighbourhood Structure development concepts and assigns the development opportunities and regulations for built form on the affected lands. Land use zones identify permitted and discretionary uses; site coverage, building heights, forms and density; landscaping, site layout and parking requirements.
Subdivision divides land into smaller parcels in accordance with the land use zone in place for the “parent” parcel, and establishes the configuration and orientation of lots and the pattern and alignment of the abutting road network. It is at the subdivision stage that the City identifies specific requirements (including infrastructure) necessary to support the future development of the lots created by the subdivision.
Servicing Agreements are a condition of subdivision approval and are concluded into between a land developer and the City. Agreements specify the location and standard of the municipal improvements (sewer, water, roads, etc.) required to support a subdivision. Once a servicing agreement is in place the lots created by a subdivision can be registered, serviced and sold to builders to construct housing and commercial buildings, etc.
Development Permits allow for the operation of a particular land use as specified under the land use zone in place for the affected land. Building Permits are the end product of a review by the City to ensure a particular development meets the requirements of the Edmonton Zoning Bylaw, the Alberta Building Code and other City regulations.
Building Permits are the end product of a review by the City to ensure a particular development meets the requirements of the Edmonton Zoning Bylaw, other City regulations and the Alberta Building Code. Building permits are divided into residential and non-residential according to the development activities they allow. Over the past five years, the number of permits and combined total construction values have generally grown steadily although non-residential construction values tend to be more variable as individual projects can have significant financial impact.
RSL
RSL
AP
RF5RF5
1 GA underplantwith 19 sj
6 frg
20 dgn
13 sj
1 AE underplantwith 3 fs
600mm rock mulchkill strip - typ
7.5m SETBACK LINE
61 bog
Decorativeboulders
PROPERTY LINE / EDGE OF SIDEWALK
8 dgn

30
in 2016, the city issued 12,315 residential permits and 2,013 industrial building permits. The value of residential construction in the city was $2.45 billion in 2016 (almost $3.19 billion in 2015). The value for non-residential construction in 2016 was approximately $5.57 billion ($1.61 billion in 2015).
5.5
5.0
4.5
4.0
3.5
3.0
2.5
2.0
1.5
1.0
0.5
0 2011 2012 2013 2014 2015 2016
FIGURE 4.1 ESTIMATED CONSTRUCTION VALUES IN BILLIONS ($)
FIGURE 4.2 TOTAL NUMBER OF BUILDING PERMITS (2011-2016)
14,000
12,000
10,000
8,000
6,000
4,000
2,000
0 2011 2012 2013 2014 2015 2016
residential
non-residential
residential
non-residential

31
2017 growth monitoring report Land Use and Development 4.0
Industrial land is located in seven neighbourhoods across the city and three main sectors: the northeast, northwest and south/southeast. Industrial land absorption rates, tracked by development permits, comprised 116 ha in 2016, 49% higher than the 78 ha absorption in 2015. Almost half of the absorption is composed of activities for development of large storage areas or infrastructure facilities. The 2016 absorption rate is below the past ten-year average of 134 ha per year. In 2016, 68 industrial building permits were issued in the city with a construction value of $251 million.
Before significant housing development can occur in developing neighbourhoods, they must receive statutory approval through an Area Structure Plan (ASP) and a Neighbourhood Structure Plan (NSP). These plans provide a framework for land use decisions, as well as an estimate of neighbourhood density and the total number of housing units.
In 2016, three Neighbourhood Structure Plans were approved; Kinglet Gardens, Glenridding Ravine and Stillwater. Developing neighbourhoods have been collapsed into Northeast, North, Northwest, West, Southwest and Southest sectors for analysis (see Map 4.3).
of the vacant land, 24% is zoned as net industrial. Industrial land absorption rate was 116 ha in 2016. This is a 49% increase in land absorption since 2015. More information on Industrial Lands
can be found in Section 6.0 of this report.
There are a total of 289 residential neighbourhoods in the City of Edmonton. 105 neighbourhoods (planned and developing) are in approved Area Structure Plans, while 87 neighbourhoods have approved Neighbourhood Structure Plans. A total of 62 neighbourhoods are currently available for residential construction. As of December 2016 there were:
44 neighbourhoods under development,
18 neighbourhoods at the planned stage (no approved NSP), and
43 neighbourhoods with 95-100% of the single attached and semi-familyt (low density) residential completed.
Of the 44 developing neighbourhoods:
nine neighbourhoods had no development started, six neighbourhoods were less than 25% complete, twenty-five neighbourhoods between 25-74% complete, and four neighbourhoods were 75-94% complete.
INDUSTRIAL LANDS
RESIDENTIAL DEVELOPMENT PATTERNS

32
Once 95% of these low-density lots available in a neighbourhood have been registered, a neighbourhood is considered “complete.” Neighbourhoods may not reach full completion due to obstacles with servicing or land ownership, so 95% is used as a proxy.
North includes absorption in north, northeast and northwest subsectors of the city.
West includes absorption in the west subsectors of the city.
South includes absorption in the southeast and southwest subsectors of the city.
FIGURE 4.3 ANNUAL LOW-DENSITY ABSORPTION 2006-2016
3,500
3,000
2,500
2,000
1,500
1,000
500
0
Lots
2007 20082006 2009 2010 2011 2012 2013 2014 2015 2016
West North South
Tracking lot registrations provides a record of past development and indicates how economic activity, demand and affordability affect the rate at which lots were absorbed from supply.
City Sector 2012 2013 2014 2015 2016 Average
North 1,180 1,068 559 337 73 643.5
Northeast 330 422 609 744 147 450.4
Northwest 415 80 163 178 49 177.0
Southeast 883 1,235 1,347 1,542 638 1,129.0
Southwest 1,197 807 1,330 2,103 655 1,218.4
West 727 818 1,044 857 328 754.8
Total Lots 4,732 4,430 5,052 5,761 1,890 4,373.0
FIGURE 4.4 FIVE-YEAR RUNNING AVERAGE OF LOW-DENSITY LOT ABSORPTIONS

33
2017 growth monitoring report Land Use and Development 4.0
Mature Area
North
Northeast
Northwest
Southeast
Southwest
West
City Subsector
Developing Planned 95% Complete
Potential Lot Supply
North 4,732 0 149 4,881
Northeast 7,517 12,441 0 19,958
Northwest 4,186 1,800 0 5,986
Southeast 9,410 21,709 0 31,119
Southwest 12,064 3,660 0 15,724
West 15,271 5,601 10 20,882
City-wide 53,180 45,211 159 98,550
FIGURE 4.5 2016 TOTAL LOW DENSITY RESIDENTIAL LOT SUPPLY BY SUBSECTOR
NOTE: Potential Lot Supply means the estimated
future number of single or semi-family (low-
density) lots within approved Area Structure Plans
or Servicing Concept Design Briefs. Once a lot has
been registered, it is considered absorbed.
Developing neighbourhoods have an approved
Neighbourhood Structure Plan and are within an
approved Area Structure Plan or Servicing Concept
design brief. Low-density residential development
can range from 1-94%.
Planned neighbourhoods require a Neighbourhood
Structure Plan before development can start.
When a developing neighbourhood has more than
95% of the low-density residential registered, it is
considered to be a complete neighbourhood.
More information on Lot Registrations can be
found in the 2016 Lot Registrations Report at www.
edmonton.ca/growthanalysis.
map 4.3 city subsectors

34
Typically, low-density lots are absorbed faster than higher-density lots. However, in recent years, medium-density lots have been developed at the same rate as low-density units, so low-density lot completion has begun to approximate full residential completion of a neighbourhood. Past development trends and future projections are calculated through servicing records for low-density residential lots.
Once a water main is charged and ready to be connected to a new home, the lot is considered “serviced.” Functioning water service is required for fire protection prior to the construction of the first showhome in a new neighbourhood, so servicing projections can be used to represent the start of new construction areas.
The number of low-density residential lots serviced in Edmonton’s developing neighbourhoods in 2016 was 2,949.
City Sector 2006 2007 2008 2009 2010 2011 2012 2013 2014 2015 2016
North 25% 17% 10% 17% 15% 21% 17% 34% 19% 32% 16%
West 21% 25% 7% 43% 20% 13% 22% 20% 25% 13% 7%
South 53% 59% 82% 39% 65% 65% 61% 46% 56% 55% 77%
Total Lots 2,700 4,945 3,128 595 4,576 3,568 4,539 4,430 5,889 4,297 2949
FIGURE 4.6 SERVICING LEVELS 2006-2016
Low-Density Residential (LDR) A single-detached house or semi-detached/duplex housing, which may include a secondary suite.
Medium-Density Residential (MDR) Attached units, except semi-detached dwellings and duplexes, but including row-housing and low and mid-rise apartments/condominiums.
High-Density Residential (HDR) Includes higher volume multi unit structures including residential tower structures.

35
2017 growth monitoring report Land Use and Development 4.0
Registrations, servicing, permits and housing starts1 are related, but different, snapshots of the development timeline. Registration documents the creation of legal lots and generally comes first. Servicing is required to complete infrastructure and may be required with lot registration. Permits are issued to allow for construction activity while housing starts measure the actual start of construction. Averaged over many years, all measures should indicate approximately the same amount of activity while monthly or yearly figures illustrate the balance of land at different stages of the development process.
1 Housing starts are tracked by the Canadian Mortgage and Housing Corporation and reported city-wide while other measures are monitored by the
City by neighbourhood. As a result, the “housing starts” statistics are not shown on this graph. For information, a CMHC-based housing starts summary
chart is available in the Appendix and in Open Data (https://data.edmonton.ca).
FIGURE 4.7 RESIDENTIAL (SINGLE AND SEMI) LAND DEVELOPMENT
8,000
7,000
6,000
5,000
4,000
3,000
2,000
1,000
02010 2011 2012 2013 2014 2015 2016
Registrations Servicing Permits

5
36

37
2017 growth monitoring report Development Patterns & Trends 5.0
Edmonton is growing and changing in many ways. Our neighbourhoods range from one to more than 100 years old and have different population characteristics, housing characteristics and patterns of development. This section reviews physical development patterns in terms of housing form and density and by summarizing trends in recent development.
Residential Density: The number of residential dwelling units per net residential hectare (du/nrha). Parks, utilities and roads are not included. Lands zoned as parks, utilities and roads are not included in residential calculations. See Map 5.1 for neighbourhood residential densities
DEVELOPMENT PATTERNS & TRENDS
DEVELOPING CORE MATURE ESTABLISHED (PLANNED) CITY-WIDEDensity range 33-373 8–81 11–129 14.6 -149.0 1-373
Overall density 132.1 26.3 24.0 33.1 28.17
FIGURE 5.1 RESIDENTIAL DENSITY (du/nrha)

38
CORE NEIGHBOURHOODS
Core neighbourhoods contain more apartment buildings and fewer single-detached and row housing. Five of the top ten neighbourhoods with the highest dwelling unit density are located in the core (see Figure 5.2).
MATURE NEIGHBOURHOODS
Mature neighbourhoods tend to have more single-detached homes than other neighbourhoods. The density of mature neighbourhoods ranges from eight in Quesnell Heights to 81 in Cromdale. Five mature neighbourhoods (Gainer Industrial, Abbottsfield, Cromdale, Empire Park, Queen Alexandra and Westwood) have unit densities over 50.
ESTABLISHED NEIGHBOURHOODS
Established neighbourhoods tend to have lower average densities than mature neighbourhoods, with fewer apartments and more row housing. Densities range from 12 in Westridge to 129 in Pembina. Six neighbourhoods (Tawa, Ermineskin, Baranow, Terra Losa, Callingwood South and Pembina) have unit densities over 50.
DEVELOPING NEIGHBOURHOODS
Many neighbourhoods classified as developing according to the Municipal Development Plan are almost fully developed. For example, 95% of Eaux Claires is covered by registered subdivisions.
New Neighbourhood Structure Plans on the perimeter of the city initially may have low dwelling unit density because development is in its early stages and single-detached homes tend to be the first areas developed. Recent Neighbourhood Structure Plans trend towards densities greater than 30 and contain a more balanced range of dwelling types (see Figure 5.3).
figure 5.3 developing neighbourhoods with densities greater than 30 as of 2016
figure 5.2 top 10 neighbourhoods with highest unit densities
Neighbourhood Type Density (du/nrha)
Downtown Core 373.2
Oliver Core 230.6
Boyle Street Core 196.2
Garneau Core 152.0
Pembina Established 129.3
Mill Woods Town Centre Established 126.5
Central McDougall Core 111.9
McCauley Core 85.0
Clareview Town Centre Developing 83.6
Heritage Valley Town Centre Area Developing 82.4
Developing Neighbourhoods
Planned Density
(du/nrha)
Density as of 2016 (du/nrha)
Clareview Town Centre
103.1 83.6
Heritage Valley Town Centre Area
149.0 82.4
Albany 41.3 42.2
MacEwan 30.3 38.1
South Terwillegar 41.7 35.7
Ambleside 104.5 35.0
Eaux Claires 44.6 34.1
McConachie Area 32.5 33.2
Callaghan 47.9 32.9
See Map 1.1 for Neighbourhood classifications

39
2017 growth monitoring report Development Patterns & Trends 5.0
map 5.1 dwelling unit density1 (du/nrha)
1 More information can be found in "2009-2016 Neighbourhood Density Statistics" at www.edmonton.ca/growthanalysis.

40
Residential development is monitored through building permits that track and assess the annual number of new units1 (see Figure 5.5), permit activity and estimated construction value.
new housing units showed steady growth in recent years until 2016 when building permit activity decreased 33.6% from 2015 (see Figure 5.4).1 Building permit activity tracks unit growth.
This chart shows some shifts from 2015 when share of net units for single family and apartments were 27% and 40% respectively.
in 2016, apartment units experienced a 48% net decrease while they experienced a 32% net increase in 2015.
FIGURE 5.4 NET HOUSING UNITS CITY-WIDE (2007-2016)
14,000
12,000
10,000
8,000
6,000
4,000
2,000
02007 2008 2009 2010 2011 2012 2013 2014 2015 2016
6,337
3,613
4,141
6,367
6,999
9,126
10,203
12,018
12 ,874
Development Trends
FIGURE 5.5 NET HOUSING UNITS CITY-WIDE (2016) Apartments
2,655 (31.1%)
Single-detached 2,603 (30.5%)
Semi-detached/Row House 2,592 (30.3%)
Secondary Suites 607 (7.1%)
Other (Garden Suites, Garage Suites, Duplex and Mobile Homes) 86 (1.1%)
TOTAL UNITS: 8,543
8,543
Net Unit growth refers to the number of units built, minus the number of units demolished.

41
2017 growth monitoring report Development Patterns & Trends 5.0
CORE NEIGHBOURHOODS
In the core neighbourhoods, apartment housing accounted for most of the net housing unit gain. The largest gains were:
Downtown with 1,063 net units, 1
Queen Mary Park with 180 net units, and
Strathcona with 90 net units.
MATURE NEIGHBOURHOODS
Mature neighbourhoods represent a relatively low proportion of city-wide growth due to strong increases in newer neighbourhoods. This remains the case even with established and developing neighbourhood activity cooling slightly due to the recent economic downturn.
Mature neighbourhoods typically lose single-detached homes and gain multi-unit development. In 2016, mature neighbourhoods lost 382 single-detached homes and gained 370, resulting in a net loss of 12 single-detached homes. New single-detached homes tend to increase residential density (du/nrha) in part because some are built with secondary suites. Of the new single-detached homes, 39, or about 11%, were built with secondary suites. Comparatively, in developing neighbourhoods, only 5% of new single-detached homes were built with secondary suites.
Among mature neighbourhoods, the largest gains were:
Griesbach with 149 units,
Gainer Industrial with 71 units 2, and
Parkdale with 68 units.
Net unit increases were driven by secondary suite creation (41%), multi-family units including semi-detached and row housing (29%) and apartment housing (30%).
2015 2016 Unit change over 2015 % Unit change
# Units % of all new units # Units % of all
new units
Core 645 5.0 1,335 15.6 690 107%
Mature 1,056 8.2 759 8.9 -297 28%
Established 670 5.2 514 6.0 -156 23%
Developing 10,503 81.6 5,935 69.5 -4,568 44%
TOTAL 12,874 100 8,543 95 -4,331 34%
DEVELOPMENT TRENDS BY NEIGHBOURHOOD TYPE
FIGURE 5.6 NET HOUSING UNITS
1 In 2016, downtown neighbourhoods experienced the highest net unit gain due to two large mixed use buildings with a 741 net unit gain that has a
total construction value of $360 million.
2 Gainer Industrial is an industrial area that has experienced residential development and is included based on its central location.

42
ESTABLISHED NEIGHBOURHOODS
As housing stock in established neighbourhoods is relatively newer, fewer units tend to be demolished and most gains are through completion of remaining vacant parcels. Unit increases were driven via semi-detached and row housing (42%), apartment housing (41%) and secondary suites (12%). Single-detached units comprise the remaining 5%.
Among established neighbourhoods, the largest gains were:
Ermineskin with 176 units, driven by the construction of a large apartment development,
Larkspur 108 units, also driven by the construction of a large apartment complex, and
Homesteader with 54 units.
Combined, these three neighbourhoods accounted for approximately 66% of all gains in established neighbourhoods.
DEVELOPING NEIGHBOURHOODS
Within developing neighbourhoods, row housing and semi-detached homes accounted for 36% percent of all new dwelling units, single-detached housing for 44%, secondary suites for 5%, duplex for 1% and apartment housing for 15%.
Among developing neighbourhoods, the largest gains were:
Chappelle Area with 521 units,
Laurel with 421 units, and
Crystallina Nera West with 316 units.
In 2016, established and developing neighbourhood permitting activity declined by 4,722 net units from 2015.
* For more information on permitting, unit growth, and construction values, please refer to the Mature Neighbourhood Reinvestment Report and
the Neighbourhood Buildinhng Permit statistics spreadsheet (www.edmonton.ca/growthanalysis).

43
2017 growth monitoring report Development Patterns & Trends 5.0
What is a Neighbourhood Life Cycle?
All neighbourhoods change as they go through a typical lifecycle process. When they are first building out, new neighbourhoods experience rapid population expansion as the community develops, new households are formed and household size grows. They then tend to stabilize for a period of time, which is followed by population decline as children grow up and leave home. Neighbourhoods can then experience a variety of transitions and different outcomes over time. Neighbourhood populations may continue to shrink as household size declines for a period, or they may grow again as new generations of Edmontonians move in and expand their household size (see Figure 5.7).
FIGURE 5.7 THE TYPICAL LIFECYCLE OF A NEIGHBOURHOOD
Development of vacant lands results in population increase, typically young families with young children.
Neighbourhoods are completed and in-migration slows. The population continues to grow as families have children.
The population declines as children grow up and leave home.
Neighbourhoods may be revitalized, or become seen as a desirable place to live. Redevelopment and intensification increase available dwellings and attract new residents.
New in-migration from young families occurs as older couples begin to leave the neighbourhood. A stable neighbourhood population is achieved.
Undesirable economic and social conditions may make neighbourhoods unattractive, resulting in population losses.
Popu
latio
n
1 6 11 16 21 26 31 36 41 46Years

44
79.9% 79.5% 92.8% 81.1% 81.6% 85.0% 86.3% 85.4% 86.8% 75.5%
20.1% 20.5% 7.2% 18.9% 18.4% 15.0% 13.7% 14.4% 13.2% 24.5%
Looking Deeper – Unit Growth and Construction Values in Edmonton
The goal of 25% city-wide housing unit growth to be located in the downtown and mature neighbourhoods was established in the way we grow, municipal development plan (2010), section 3.1.1.2.
UNIT GROWTH
When indicators are combined over multiple years, a picture emerges that shows uneven reinvestment across neighbourhood types in terms of net unit gain or loss. Factors for this uneven reinvestment can include the stage of a neighbourhood within the neighbourhood lifecycle (see Figure 5.7), attractive opportunities for development elsewhere in the city, geographic location and perceived desirability of a neighbourhood.
Over ten years, the city has grown by 80,221 units, or an average of 8,022 net units per year. From 2012 to 2016, net unit growth was above this average with mature and core neighbourhoods making up 16% of the ten-year total (see Figure 5.8 and Figure 5.9).
FIGURE 5.8 NET RESIDENTIAL UNITS (TOTAL)
14,000
12,000
10,000
8,000
6,000
4,000
2,000
02007 2008 2009 2010 2011 2012 2013 2014 2015 2016
Core / Mature Neighbourhoods City-wide Total
100%90%80%70%60%50%40%30%20%10%
0%
FIGURE 5.9 NET RESIDENTIAL UNITS (PERCENTAGE SHARE)
2007 2008 2009 2010 2011 2012 2013 2014 2015 2016
Established / Developing Neighbourhoods
Core / Mature Neighbourhoods
1,273741 299 1,201 1,286 1,373 1,393 1,731 1,701 2,094
6,337
3,613
4,141
6,367
6,999
9,126
10,203
12,018
12 ,874
8,543

45
2017 growth monitoring report Development Patterns & Trends 5.0
TYPES OF UNITS
Separating unit growth into multi-family units or single units tells another story. The traditional style of single-unit home remains popular with Edmontonians. However, multi-family units growth is prevalent in core and mature neighbourhoods.
Single Family
-659
Multi Family
11,599
Secondary Units
1,892
FIGURE 5.11 NET UNIT CHANGE IN CORE AND MATURE NEIGHBOURHOODS (2007-2016)
14,000
12,000
10,000
8,000
6,000
4,000
2,000
0
-2000
2007 2008 2009 2010 2011 2012 2013 2014 2015 2016 10 year
Single Family -120 -121 -35 -31 -30 -66 -73 -94 -58 -31 -659
Multi Family 1405 833 247 843 1,095 1,185 1,226 1,515 1,455 1,795 11,599
Secondary Suites 209 248 251 240 310 304 330 1,892
Totals 1285 712 212 1,021 1,313 1,370 1,393 1,731 1701 2,094 12,832
FIGURE 5.10 NET UNIT CHANGE BY YEAR AND TYPE IN CORE AND MATURE NEIGHBOURHOODS (2007-2016)
Note: Unless otherwise noted, unit growth reported is net figure.

46
2011 Census of Canada; Statistics Canada. Map compiled by Geospatial Services, City Planning Branch
Central Core
Mature Neighbourhoods (generally completed before 1970 and excluding central core)
Established Neighbourhood (fully developed suburban areas)
Planned or Developing Neighbourhood
Industrial Area
MAP 5.2 CITY NEIGHBOURHOOD CLASSIFICATION
47
2017 growth monitoring report Development Patterns & Trends 5.0
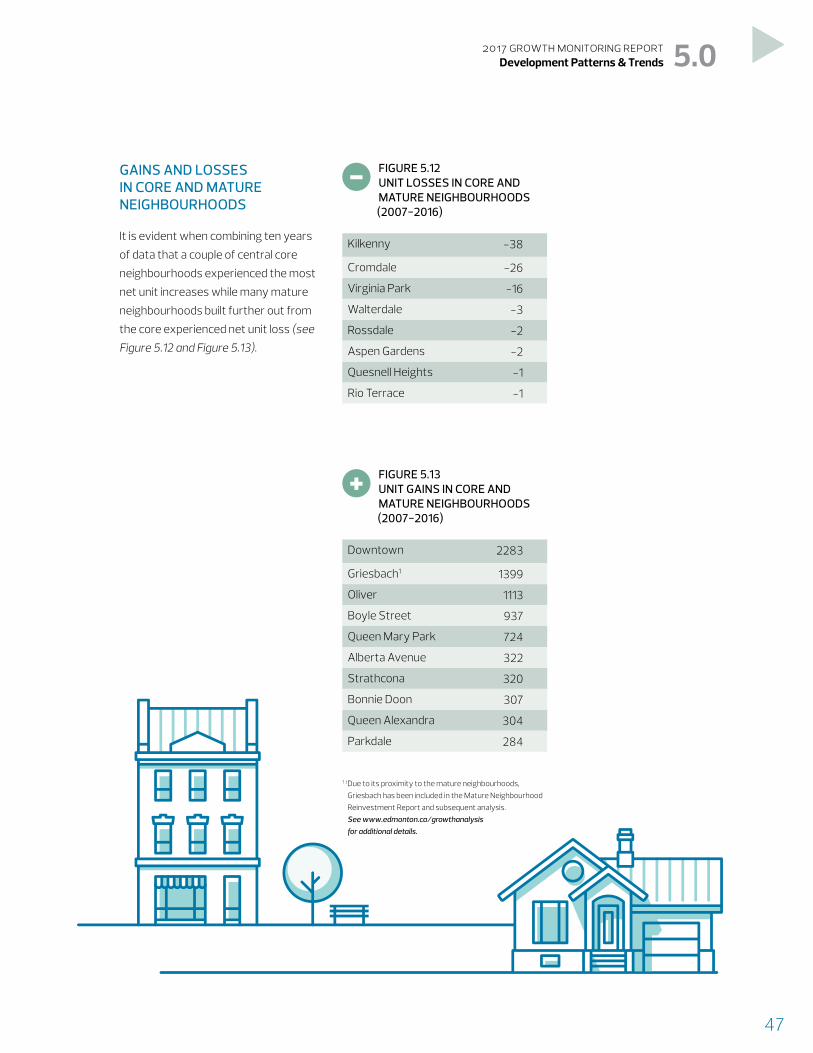
GAINS AND LOSSES IN CORE AND MATURE NEIGHBOURHOODS
It is evident when combining ten years of data that a couple of central core neighbourhoods experienced the most net unit increases while many mature neighbourhoods built further out from the core experienced net unit loss (see Figure 5.12 and Figure 5.13).
1 t Due to its proximity to the mature neighbourhoods, Griesbach has been included in the Mature Neighbourhood Reinvestment Report and subsequent analysis. See www.edmonton.ca/growthanalysis for additional details.
FIGURE 5.12 UNIT LOSSES IN CORE AND MATURE NEIGHBOURHOODS
(2007-2016)
Kilkenny -38
Cromdale -26
Virginia Park -16
Walterdale -3
Rossdale -2
Aspen Gardens -2
Quesnell Heights -1
Rio Terrace -1
FIGURE 5.13 UNIT GAINS IN CORE AND MATURE NEIGHBOURHOODS
(2007-2016)
Downtown 2283
Griesbach1 1399
Oliver 1113
Boyle Street 937
Queen Mary Park 724
Alberta Avenue 322
Strathcona 320
Bonnie Doon 307
Queen Alexandra 304
Parkdale 284
+
-

48
GAINS AND LOSSES IN ESTABLISHED AND DEVELOPING NEIGHBOURHOODS
Established neighbourhoods are completed neighbourhoods generally within the Anthony Henday Transportation Corridor. Developing neighbourhoods refer to neighbourhoods currently under development and planned neighbourhoods where lot registration has not yet started. As with the core and mature neighbourhoods, a pattern emerges when combining five years of data in the established and developing neighbourhoods (see Map 5.2).
Over a five-year period, the developing and established neighbourhoods grew by 43,448 units. In a ten-year period, the core and mature neighbourhoods grew by 12,936 units. Growth is occurring quickly and in high volumes in developing neighbourhoods (see Figure 5.15). However, this activity will slow down as land is fully developed.
Not surprisingly, the greatest number of units (and highest construction values) occurred in developing neighbourhoods as high activity levels are expected at the beginning of a neighbourhood’s life cycle. The majority of developing neighbourhoods with high unit growth are in the city’s south side with the exception of Chambery and McConachie in the north and Rosenthal and Secord in the west. Neighbourhoods with lower unit growth are located in the city’s north and west sectors.
Both the unit growth and losses reflect development status in these neighbourhoods. The unit numbers illustrate the high volume of development activity in the neighbourhoods in the south, with development slowing down in developing neighbourhoods elsewhere. Developing neighbourhoods with lower unit growth are close to, or fully, developed (see Figure 5.16).
Established neighbourhoods paint a different picture because of their stage in the Neighbourhood Life Cycle (see Figure 5.7). In established neighbourhoods, 21 of 92 (23%) are experiencing unit losses, or very minor unit gains. Nine established neighbourhoods experienced no unit growth, while ten established neighbourhoods experienced a unit growth of one in the past five years (see Figure 5.18).
FIGURE 5.14 UNIT GROWTH TOTAL IN DEVELOPING AND ESTABLISHED NEIGHBOURHOODS (2012-2016)
Developing 41,168
Established 2,280

49
2017 growth monitoring report Development Patterns & Trends 5.0
FIGURE 5.18 ESTABLISHED NEIGHBOURHOODS WITH UNIT GROWTH OF ONE OR LESS OVER 5 YEARS
Beaumaris 1
Blackburne 1
Bulyea Heights 1
Carter Crest 1
Henderson Estates 1
Sifton Park 1
Summerlea 1
Sweet Grass 1
Thorncliff 1
Twin Brooks 1
Blue Quill Estates 0
Brander Gardens 0
Keheewin 0
Mill Woods Town Centre 0
Ogilvie Ridge 0
Overlanders 0
Skyrattler 0
Terra Losa 0
Westridge 0
-
+FIGURE 5.17 ESTABLISHED NEIGHBOURHOODS WITH OVER 100 UNITS GROWTH OVER 5 YEARS
Baranow 382
Ermineskin 317
Larkspur 305
Pembina 157
Homesteader 132
Canon Ridge 107
+FIGURE 5.15 DEVELOPING NEIGHBOURHOODS WITH OVER 1,000 UNIT GROWTH OVER 5 YEARS
Windermere 2,772
Walker 2,504
Laurel 2,231
Chambery 2,090
McConachie 2,038
Summerside 1,983
Allard 1,661
Chappelle Area 1,379
Callaghan 1,273
Ambleside 1,202
Secord 1,095
Rosenthal 1,025
FIGURE 5.16 DEVELOPING NEIGHBOURHOODS WITH FIVE OR FEWER UNIT GROWTH OVER 5 YEARS
Matt Berry 5
Mayliewan 4
Canossa 2
Belle Rive 1
Breckenridge Greens 1
Potter Greens 1
Rural West Big Lake 1
Wedgewood Heights 0
-

50
SECONDARY SUITES
In 2007, the Zoning Bylaw was amended to allow for secondary suites in single-family dwellings. In 2009, the Zoning Bylaw was further amended to allow for garden and garage suites in restricted areas on lots that have a single-family dwelling. As a result, the number of permits issued for secondary suites has grown significantly.
Year 2016 had the highest number of net secondary suite units since 2008 (see Figure 5.19). It is significant to note that not all secondary suites are conversions occurring in existing housing units. Some new constructions are being built with secondary suite capacity in developing neighbourhoods as illustrated in citywide totals.
FIGURE 5.19 SECONDARY SUITES 2008-2016
700
600
500
400
300
200
100
0
Num
ber o
f Sec
onda
ry S
uite
s
2008 2009 2010 2011 2012 2013 2014 2015 2016
Core & Mature Neighbourhoods City-wide
2981
209248 251 240
310 304 330
50111
274326 349 356
535598
664

51
2017 growth monitoring report Development Patterns & Trends 5.0
CONSTRUCTION VALUES
The City of Edmonton measures construction values through building permit activity (see Figure 5.21). Construction activity includes new unit builds, demolitions, interior renovations and exterior renovations. Refer to Open Data (data.edmonton.ca) for permitting information and details.
Construction values (and net unit growth) continue to be higher in Developing and Established neighbourhoods (see Figure 5.20). This is typical of Developing neighbourhoods as they experience rapid growth for approximately the first 15 years of their development, when the majority of the land is usually developed.
core and mature neighbourhoods accounted for 19% of total construction value whereas developing and established neighbourhoods accounted for 81% of total construction value over the past ten years.
FIGURE 5.21 CITY-WIDE RESIDENTIAL CONSTRUCTION VALUE BY YEAR
3.5
3.0
2.5
2.0
1.5
1.0
0.5
0.02007 2008 2009 2010 2011 2012 2013 2014 2015 2016
$1.21 $0.92
$1.31
$1.77$1.84
$2.19
$2.55
$2.98$3.19
$2.45
Billio
ns ($
)
FIGURE 5.20 CITY-WIDE CONSTRUCTION VALUE OVER 10 YEARS
$20BILLION
Core / Mature $3.8 Billion
Established/Developing $16.6 Billion
19% 81%
52
Key Findings*
* For more information, please go to www.edmonton.ca/growthanalysis
Last year (2016), Edmonton came close to achieving its 25% target for growth in Mature and Core neighbourhoods. Developing and Established neighbourhoods accounted for 75.5% of new residential growth while Core and Mature neighbourhoods accounted for 24.5%. This percentage is dependent on permitting activity in Established and Developing neighbourhoods, which experienced a decline in 2016. Permitting activity is a result of construction cycles and are market sensitive. Hence, this proportion can be attributed to the slow-down in suburban neighbourhoods (Established and Developing neighbourhoods) and increased activity in Core and Mature neighbourhoods, specifically in the Downtown neighbourhood.
Multi-family units in Mature and Core neighbourhoods have experienced steady increases. A total of 1,795 multi-family units were permitted in 2016 in these neighbourhoods. This is the highest multi-family annual total in ten years. Established and Developing neighbourhoods accounted for all single detached net unit gains city-wide in 2016, while Mature and Core neighbourhoods experienced a net loss of single detached units. Conversely, Mature and Core neighbourhoods accounted for over one-third of multi-family units and nearly half of secondary suite units city-wide in 2016. While this unit type dispersal can be related to where the neighburhood is in its lifecycle (older homes being demolished and replaced with new single or multi-family units), it also illustrates that diverse housing stock is available in the City. In 2016, city-wide permitting activity remained above the ten year average. This is positive news and illustrates that Edmonton is a resilient City, even when facing changes in our economy.

53
2017 growth monitoring report Development Patterns & Trends 5.0

6
54

55
2017 growth monitoring report Non-Residential Growth 6.0
WHAT IS NON-RESIDENTIAL DEVELOPMENT?
Non-residential uses include institutional (such as schools and hospitals), commercial (such as retail and offices) and industrial (such as manufacturing and processing plants).
industrial development is a key part of edmonton’s fiscal well-being and is needed to grow a great city.
WHY IS NON-RESIDENTIAL DEVELOPMENT IMPORTANT?
Residential neighbourhoods exist to provide housing and community amenities. Other areas of the city, such as industrial areas and commercial nodes, exist to provide employment and wealth generation. The amount of revenue the City needs from property taxation is determined for the city as a whole and takes into consideration the balance between residential and non-residential assessment.
Although non-residential uses make up only 25% of Edmonton’s total assessment, they contribute approximately 50% of Edmonton’s tax revenues, making these uses a key component of the City’s fiscal well-being. This positive financial contribution to the City makes growing the non-residential tax base important to support other city-building initiatives such as provision of infrastructure and servicing new residential neighbourhoods.
NON-RESIDENTIAL GROWTH

56
The overall balance of residential and non-residential land in Edmonton is important in a number of ways. Residential areas provide places for people to live and build community. Non-residential areas provide employment, services and amenities among other things. Both contribute to and are an essential part of the fabric of the city. Maintaining a healthy balance between them is critical.
As the City grows new residential areas, it must also grow its non-residential areas to maintain balanced growth for revenue generation and sustainability. For the city as a whole to maintain the current ratio, there needs to be approximately $5 billion of non-residential assessment for every $20 billion in residential assessment growth.
The industrial districts (see Map 6.1) are strategically located along major transportation corridors and located throughout the city with 1,447 net hectares (3,576 net acres) of industrially-zoned vacant
land available for development, and a further 4,777 gross hectares (11,804 gross acres) of reserve land intended for future industrial growth and ideal for large greenfield development1. This includes 4,089 gross hectares in the Edmonton Energy and Technology Park. Of the industrially zoned vacant land, 726 net hectares (1,794 net acres) is available for immediate development in traditional industrial sectors of Edmonton.
BUILDING PERMITS IN INDUSTRIAL AREAS
All new significant building activity, whether on a new site or a site with existing development, is tracked to help understand all the building activity taking place in the city.
The highest value of permits, $132,970,189, was issued in the Northeast Industrial Area. Other areas followed, including $66,868,305 in the Northwest Industrial Area and $51,718,160 for the Southeast Industrial Area (see Figure 6.1 Building Permit Values by Industrial Area 2016). Most of the building activity took place in a few key neighbourhoods including Yellowhead Corridor East at around $123 million, Summerside at $22 million, Rampart at $22 million, Winterburn Industrial West at $11 million and Mistatim at $11 million.
together, these neighbourhoods comprised around 75% of building permit activity out of all industrial areas.
$251.56million
Northeast $132.97 M
Northwest $66.87 M
Southeast $51.72 M
FIGURE 6.1 BUILDING PERMIT VALUES BY INDUSTRIAL AREA 2016
1 Source: Vacant Industrial Land Supply December 2016 Report

57
2017 growth monitoring report Non-Residential Growth 6.0
map 6.1
edmonton industrial districts
Edmonton Energy & Technology Park
Northeast District
Northwest District
South District
Southeast District

7
58

2017 growth monitoring report Housing in the City 7.0
59
The Way We Grow, the City’s Municipal Development Plan, was approved May 26, 2010. It is one of six strategic documents that support The Way Ahead, the City’s strategic plan.
The Way We Grow provides for the creation of the Growth Coordination Strategy (GCS) based on the several factors including addressing demand for land, housing units and housing choices at the regional, city-wide and sector levels.
A thorough understanding of Edmonton’s housing conditions is fundamental in developing effective housing strategies that will assist the City in its housing-related policy work.
one of the main indicators of a city’s livability is the manner in which it grows. a livable city draws people to it. a livable city employs people. a livable city offers its residents a wide range of housing choices.
This study provides an overview of recent housing activities in Edmonton including current housing situations, recent trends, household characteristics, housing demand and supply, and affordable housing.
HOUSING IN THE CITY

60
According to Statistics Canada, a dwelling is defined as a set of living quarters. The Federal Census identifies two dwelling types: collective dwellings and private dwellings. Collective dwellings are institutional, communal or commercial. Private dwellings refer to a separate set of living quarters with a private entrance either from outside the building or from a common hall, lobby, vestibule or stairway inside the building. A dwelling may be classified as occupied or unoccupied by a person or a group of persons as well.1 This section provides some high-level 2016 Federal Census information based on data availability.
the number of private dwelling units in the city has continued to grow. nearly 73,500 new private dwellings were added between the 2006 and 2016 federal censuses. the 2011 Federal Census showed that most construction happening primarily in developing areas.
Dwelling Units
450,000 –
400,000 –
350,000 –
300,000 –
250,000 –
200,000 –
150,000 –
100,000 –
50,000 –
0 –2006 2011 2016
FIGURE 7.1 TOTAL PRIVATE DWELLINGS VS. OCCUPIED PRIVATE DWELLINGS (CITY OF EDMONTON)
Total private dwellings Private dwellings occupied by usual residents
314,362
Gap = 16,589 dwellings
Gap = 23,916 dwellings
Gap = 27,122 dwellings
297,773 348,672 324,756 387,950 360,828
% Change
Core 0%
Mature-1%
Established 5%
Developing88%
FIGURE 7.2 OCCUPIED DWELLING UNIT INCREASE BY AREA (2006 TO 2011)
1 According to Statistics Canada, regular private dwellings are further classified into occupied dwellings (occupied by usual residents), dwellings occupied by foreign and/or temporary residents and unoccupied dwellings. Private dwellings occupied by usual residents refers to a private dwelling in which a person or a group of persons is permanently residing.

2017 growth monitoring report Housing in the City 7.0
61
OCCUPIED DWELLING UNITS BY STRUCTURE TYPE
All areas of the city offer different types of housing including single-detached, semi-detached (duplex), row housing and a variety of multi-family dwelling units (one to four, and five or more storey apartments). Additionally, institutional/collective residences and mobile home parks provide space for manufactured housing units (see Figure 7.3).
FIGURE 7.3 OCCUPIED DWELLING UNITS BY STRUCTURE TYPES (2011)
FIGURE 7.4 PERCENTAGE SHARE OF OCCUPIED PRIVATE DWELLINGS BY STRUCTURE TYPES (CITY OF EDMONTON, 2016)
FIGURE 7.5 PRIMARY OCCUPIED DWELLING UNITS BY AREA (2011)
200,000 –
180,000 –
160,000 –
140,000 –
120,000 –
100,000 –
80,000 –
60,000 –
40,000 –
20,000 –
0 –
2016 –
Single-detached Semi-detached Rowhouse Apartment,duplex
Apartment 1-4 storeys
Apartment 5+ storeys
Movable dwelling
Single-detached Semi-detached Rowhouse Apartment,duplex
Apartment 1-4 storeys
Apartment 5+ storeys
Single-detached Semi-detached Rowhouse Apartment,duplex
Apartment 1-4 storeys
Apartment 5+ storeys
Movable dwelling
49.9% 6.2% 10.0% 2.8% 23.2% 7.1% 0.7%
2011 2016
80,000 –
70,000 –
60,000 –
50,000 –
40,000 –
30,000 –
20,000 –
10,000 –
0 –
Core Mature Established Developing
165,765
16,0208,420
74,765
31,25022,215 25,520 25,790
2,840 2,650
180,215
3,39
0
295
420
69,18
0
58,5
70
33,9
05
4,69
5
7,92
0
6,58
0
2,81
0
930
830
50
20,0
85
29,8
70
17,0
30
6,98
0
4,32
5
2,01
5
435
20,6
60
18,6
40
5,79
5
5,21
5
10,010
83,775
36,075
NOTE: Other single-attached and movable dwellings are not included.
% Change
Core 0%
Mature-1%
Established 5%
Developing88%
Source: Statistics Canada
Source: Statistics Canada

62
RESIDENTIAL HOUSING DIVERSITY
Residential housing diversity measures the diversity of housing types using the Simpson Diversity Index (SDI).1 This index produces a score between 0 and 1.0. The closer to 1.0, the more diverse the existing housing stock is.
Vibrant communities require a mix of housing types to attract residents representing different age groups, income levels and housing needs – from singles to families to seniors.
providing a range of housing types within a neighbourhood increases affordability and choices, creating long-term neighbourhood stability.
Edmonton has started promoting higher-density and mixed housing that make for more inclusive and diverse communities.
FIGURE 7.6 HOUSING MIX DIVERSITY IN MAJOR CANADIAN CITIES (2016)
Edmonton housing
diversity index
0.68Vancouver
0.75Toronto
0.71Ottawa
0.73Montreal
0.62Calgary
0.64
1 Simpson's Diversity Index is a measure of diversity which takes into account the number of categories present as well as the relative abundance
in each category. As the richness of categories and evenness increase, so diversity increases. The Simpson Diversity Index (SDI) calculates the
probability that any two randomly selected dwelling units in a project will be of a different type.
Note: This index is used as a means to benchmark Edmonton's housing stock diversity against other Canadian cities.
Single-detached Semi-detached Rowhouse Apartment,duplex
Apartment 1-4 storeys
Apartment 5+ storeys
NOTE: Other single-attached and movable dwellings are not included.
Vancouver 15% 2% 3% 19% 32% 27%
Calgary 56% 6% 10% 5% 16% 7%
Edmonton 50% 6% 10% 3% 23% 7%Montréal 7% 3% 3% 14% 58% 14%
Toronto 24% 6% 6% 4% 15% 44%
Ottawa 42% 5% 21% 2% 10% 18%

2017 growth monitoring report Housing in the City 7.0
63
Year Single-Family Units Multi-Family Units
2009 2,263 1,767
2010 3,192 2,857
2011 2,857 3,801
2012 3,214 5,554
2013 3,710 6,132
2014 4,287 7,198
2015 3,466 8,810
2016 2,603 5,279
1 Not included: secondary suites, garden suites, garage suites and mobile homes. Multi-family units include duplexes, semi-detached homes and apartments.
Source: City of Edmonton
FIGURE 7.7 NET NEW CONSTRUCTION BASED ON CITY OF EDMONTON BUILDING PERMITS1
Building permit activity in Edmonton in recent years shows a solid increase towards construction of multi-family homes (see Figure 7.7). For more information on building permits, please see Section 5.
TRENDS IN OCCUPIED DWELLINGS BY PERIOD OF CONSTRUCTION PER CENSUS YEAR
Aging housing stock can result in high maintenance and operating costs due to lack of energy-efficient design and features, and age-related deterioration. This can create affordability challenges especially for individuals and families on low or fixed incomes. It is important, therefore, to monitor trends in dwellings by period of construction.
nearly 53% of edmonton’s total housing stock was built before 1980. from 1996 to 2011, the total number of occupied
private dwellings built before 1980 decreased by 2.6%.

64
SIZE OF DWELLINGS BY NUMBER OF BEDROOMS
Most housing units in Edmonton either had two or three bedrooms based on the 2011 Federal Census (see Figure 7.8). Together, these units accounted for over 57% of the total units.
Further breakdown shows that established and developing areas have significant shares of units with three bedrooms or more – units attractive to households with children. Conversely, a majority of housing units have one or two bedrooms in central core and mature areas (see Figure 7.9).
FIGURE 7.8 SHARE OF OCCUPIED PRIVATE DWELLINGS BY PERIOD OF CONSTRUCTION (2011)
FIGURE 7.9 OCCUPIED PRIVATE DWELLINGS BY NUMBER OF BEDROOMS BY NEIGHBOURHOOD CLASSIFICATION
1960 or before
17.8%1961 - 1980
35.3%
1981 - 1990
14.7%
1991 - 2000
11.0% 2001 - 2005
10.8%
2006 - 2011
10.5%
TOTAL NUMBER OF OCCUPIED PRIVATE DWELLINGS BY NUMBER OF BEDROOMS (2011)
0-1 bedroom 16.0%
2 bedroom 24.2%
3 bedroom 33.2%
4 or more bedroom 26.6%
CORE MATURE ESTABLISHED DEVELOPING
60% –
50% –
40% –
30% –
20% –
10% –
0 –

2017 growth monitoring report Housing in the City 7.0
65
Household Characteristics
Private household refers to a person or group of persons who occupy the same dwelling and do not have a usual place of residence elsewhere in Canada or abroad. The dwelling may be either a collective dwelling or a private dwelling. The household may consist of a family group such as a census family, of two or more families sharing a dwelling, of a group of unrelated persons or of a person living alone. 1
household sizes in edmonton have remained the same in recent years and included a significant percentage of
one-and two-person households.
1 http://www.statcan.gc.ca/eng/concepts/definitions/household-priv
1 person 2 persons 3 persons 4 persons 5+ persons
35%
30%
25%
20%
15%
10%
5%
0%
FIGURE 7.11 PERSONS PER HOUSEHOLD SIZE
2011 2016 PERCENTAGE OF HOUSEHOLDS
Source: Statistics Canada
29.2%
27.2%
32.6% 32.5%
16.0%13.5%
8.7%
16.3%14.3%
9.8%
FIGURE 7.10 TRENDS IN HOUSEHOLD SIZE (AVERAGE NUMBER OF PERSONS IN PRIVATE HOUSEHOLDS IN THE CITY OF EDMONTON)
Source: Statistics Canada
1986 1991 1996 2001 2006 2011 2016
2.5
2.6 2.6
2.5 2.52.5
2.4
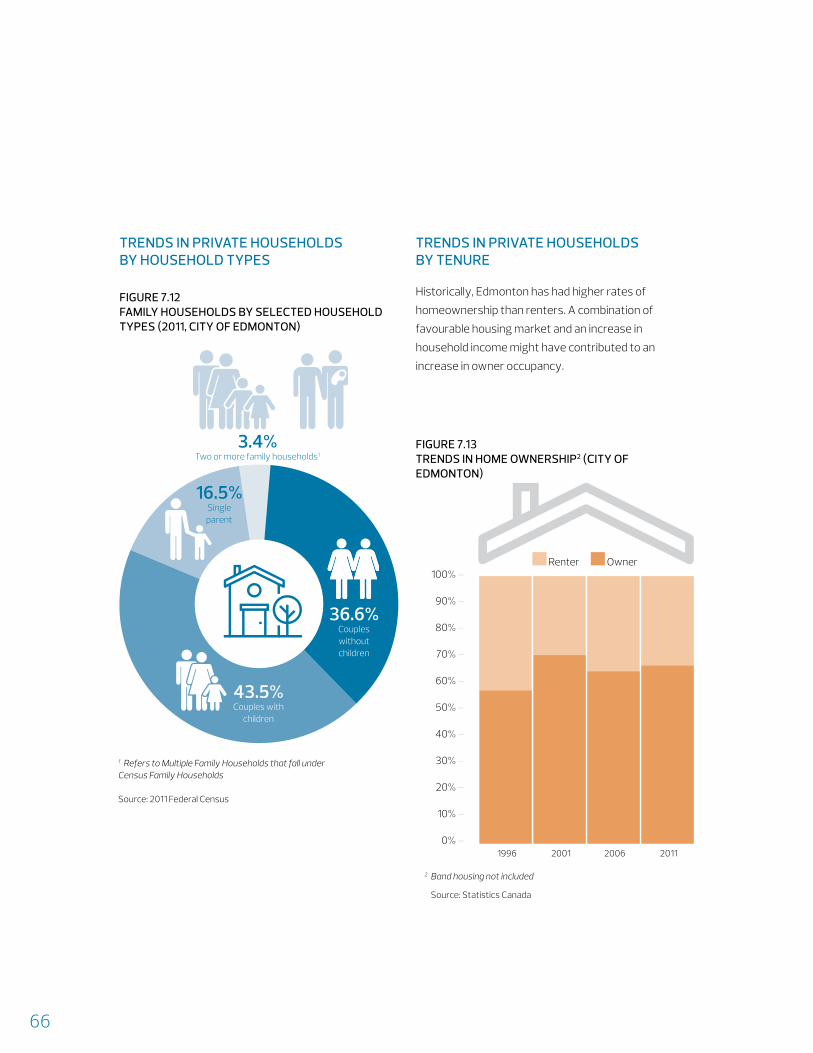
66
TRENDS IN PRIVATE HOUSEHOLDS BY HOUSEHOLD TYPES
TRENDS IN PRIVATE HOUSEHOLDS BY TENURE
Historically, Edmonton has had higher rates of homeownership than renters. A combination of favourable housing market and an increase in household income might have contributed to an increase in owner occupancy.
36.6%Couples without children
43.5%Couples with
children
16.5%Single parent
3.4%Two or more family households1
1 Refers to Multiple Family Households that fall under Census Family Households
Source: 2011 Federal Census
2 Band housing not included
Source: Statistics Canada
FIGURE 7.12 FAMILY HOUSEHOLDS BY SELECTED HOUSEHOLD TYPES (2011, CITY OF EDMONTON)
FIGURE 7.13 TRENDS IN HOME OWNERSHIP2 (CITY OF EDMONTON)
Renter Owner
1996 2001 2006 2011
100% –
90% –
80% –
70% –
60% –
50% –
40% –
30% –
20% –
10% –
0% –

2017 growth monitoring report Housing in the City 7.0
67
Further breakdown based on the 2011 Federal Census shows Edmonton’s central core dwelling units are highly dominated – 71% – by renters (see Figure 7.14). On the other hand, developing and established areas are typically owner occupied. In general, it is relatively easier to rent than own in core areas compared to that of developing and established areas.
RECENT HOUSING SUPPLY ACTIVITY
Housing starts (see Figure 7.15) and completions (see Figure 7.17) provide a good understanding of recent development activities within Edmonton. While trends in dwelling units is one of the better indicators in understanding the housing market, Canada Mortgage and Housing Corporation (CMHC) provides readily available data on monthly, quarterly and annual bases on housing starts, completions and units under construction for different housing categories.
FIGURE 7.14 PRIVATE HOUSEHOLDS BY TENURE (2011)
29.5%
59.5% 73.3%
88.7%
70.5%
40.5% 26.7%
11.3%
Source: Statistics Canada
CORE MATURE ESTABLISHED DEVELOPING
Renter Owner
100% –
90% –
80% –
70% –
60% –
50% –
40% –
30% –
20% –
10% –
0% –

68
FIGURE 7.16 RESIDENTIAL STARTS BY AREA
Source: CMHC Starts and Completion Survey
Developing neighbourhoods, in general, experience most housing starts compared with core, mature and established areas (see Figure 7.16). In 2016, mature neighbourhoods experienced the highest number of housing starts since 2010 whereas housing starts decreased quite significantly in other areas.
FIGURE 7.15 HOUSING STARTS (CITY OF EDMONTON, 2007-2016)
Single Detached Semi-Detached Row Housing Apartments Total
14,000
12,000
10,000
8,000
6,000
4,000
2,000
020102007 2008 2009 2011 2012 2013 2014 2015 2016
8,894
6,1106,135
9,48810,634
9,798
13,311
7,263
3,9113,979
HOUSING STARTS1
from 2007 to 2016, edmonton experienced a total of 79,523 housing starts, or an average of 7,952 housing starts per year for the period.
Housing starts peaked in 2015 at 13,311, an increase of 36% over 2014, followed by a decline of 6,048, or 45%, for a total of 7,263 in 2016 (see Figure 7.15). Although all housing categories (single and multi-units) faced a decrease in housing starts in 2016, the number fell a dramatic 71% for apartments, from 5,981 housing starts in 2015 to 1,762 starts in 2016.
A weaker labour market, slower migration and reduced consumer confidence have softened the demand for new homes in Edmonton. At the same time, elevated inventory on both the new and existing home markets is prompting builders to slow production. These factors led to a reduction of housing starts in 2016.2
1 Housing starts are an economic indicator that reflect the number of privately owned new housing units for which construction has started in a
given period. A “start,” for purposes of the CMHC Starts and Completions Survey, is defined as the beginning of construction work on a building,
usually when concrete has been poured for the foundation footing of the structure or an equivalent stage where a basement will not be part of
the structure.
2 CMHC Housing Market Outlook 2016
2010 2011 2012 2013 2014 2015 2016
Core 206 402 963 825 549 1,188 52
Mature 831 660 948 817 773 1,001 1,039
Established 790 664 849 866 280 902 652
Developing 4,174 4,403 6,727 8,107 8,196 10,220 5,520
TOTAL 6,001 6,129 9,487 10,615 9,798 13,311 7,263

2017 growth monitoring report Housing in the City 7.0
69
HOUSING COMPLETIONS1
Housing completions illustrate a similar trend to housing starts with a decline in completions in 2016. From 2007 to 2016, Edmonton experienced a total of 80,281 housing completions, or an average of 8,028 housing completions per year for the period. Housing completions peaked in 2015 at 12,524, an increase of 26%, followed by the second highest at 11,339 in 2016 (see Figure 7.17).
the housings/structures started in 2015 were completed in 2016 and contributed to the second highest completions in the past ten years.
Apartment completions increased slightly in 2016 compared with 2015, while other categories experienced a decrease in total completions.
FIGURE 7.18 HOUSING COMPLETIONS BY AREA
1 For purposes of the CMHC Starts and Completions Survey, a “completion” is defined as the stage at which all proposed construction work on the
building has been performed, although under some circumstances a building may be counted as completed where up to 10% of the proposed work
remains to be done.
Source: CMHC Starts and Completion Survey
FIGURE 7.17 HOUSING COMPLETIONS (CITY OF EDMONTON, 2007-2016)
14,000
12,000
10,000
8,000
6,000
4,000
2,000
0
7,096 6,115 6,723
9,350 9,279
12,52411,339
5,9006,524
20102007 2008 2009 2011 2012 2013 2014 2015 2016
5,431
Single Detached Semi-Detached Row Housing Apartments Total
Developing neighbourhoods, in general, experienced most housing completions compared with core, mature and established areas since completion is tied to housing starts. However, in 2016, core neighbourhoods experienced the highest number of housing completions since 2010 because housing starts in core areas in 2015 were the highest (1,188) since 2010 (see Figure 7.18).
2010 2011 2012 2013 2014 2015 2016
Core 221 451 307 297 508 334 1,270
Mature 673 490 897 813 922 811 1,027
Established 968 624 341 983 153 759 707
Developing 4,148 3,864 5,174 7,254 7,696 10,620 8,335
TOTAL 6,010 5,429 6,719 9,347 9,279 12,524 11,339

70
RELATIONSHIP BETWEEN PERMITS, STARTS AND COMPLETIONS
The number of units authorized but not started affects the relationship between permits and starts, and the number of housing units ‘still under construction’ affects the relationship between starts and completions. Many times, changes to the status of buildings such as reclassification, abandonment, design changes and misclassification take place after the permit has been issued and affect the start/completion relationship. As well, permit revisions may not have been applied to starts and completions.
Annual growth rates in Edmonton’s total building permits issued, starts and completions share similar trends in terms of increasing and decreasing numbers except in 2013, 2014 and 2015 (see Figure 7.19 ).
in 2016, building permits, starts and completions dropped significantly due to economic slowdown.
The relationship between housing permits, starts and completions is often complex. The differences arise from variances in coverage, timing and definitions. In addition, some housing permits never turn into starts and occasionally a start never reaches completion. In general, for single-family units there is only a short time lag between permit issuance and start. Multi-family permits are more likely than single-family permits to expire or be cancelled, and the lag between starts and permit issuance is somewhat longer on average. In years when the housing market is weaker, that lag may increase. The time between start of construction and completions may vary widely for the individual structure. When there is a sharp rise in housing activities, it is generally assumed the time from start to completion decreases. Some units that are started may never reach completion because construction gets abandoned for many reasons. Abandon rates can fluctuate over time due to conditions in the economy.
Sources: Starts and completions: CMHC Starts and Completions Survey Building permit information: City of Edmonton
FIGURE 7.19 BUILDING PERMITS, STARTS AND COMPLETIONS (% CHANGE, Y-O-Y)
80%
60%
40%
20%
0%
-20%
-40%
-60%2010 2011 2012 2013 2014 2015 2016
Starts Completions Building Permits
56.2%
12.0%
3.6%
-11.2%
23.8%
17.7%9.4%
12.1%
39.1%
-7.9%
-0.8%
20.3%
35%
35.9%
6.3%
-45.4%-18.3%
-9.5%
54.7%
0.4%
2.4%

2017 growth monitoring report Housing in the City 7.0
71
A combination of decreasing rental demand and increasing supply in both primary and secondary markets has resulted in high rental vacancy rates for Edmonton and Calgary, and a record high vacancy rate for Saskatoon. 1
Apartment Vacancy Rates in Canadian Cities
FIGURE 7.20 APARTMENT VACANCY RATES IN CANADIAN CITIES (%, 2016)
1 Rental Market Report – Saskatoon CMA, Fall 2016. Canada Mortgage and Housing Corporation
EdmontonApartment
Vacancy Rate
6.9%Vancouver
0.8%Toronto
1.3%Montreal
4.0%Halifax
2.6Calgary
6.9%Saskatoon
10.3%Winnipeg
2.8%

72
“ affordable housing is about much more than a roof over one’s head. it’s about stability and security. access to affordable housing improves people’s mental and physical health, educational and employment outcomes and reduces demand for other government services. It is a critical element of our city’s health and competitiveness, and key to ending poverty.”
– MAYOR DON IVESON, HOUSING AND HOMELESSNESS IN EDMONTON, ANNUAL UPDATE 2015
Affordable Housing
WHAT DO WE MEAN BY AFFORDABLE HOUSING?
The City defines affordable housing as rental or ownership housing that requires capital subsidies or capital subsidies plus ongoing operating subsidies. Affordable housing also has rents or payments below average market cost, and is targeted for long-term occupancy by households who earn less than median income for their household size. Market housing units and short-term accommodation are not included in this definition of affordable housing.
Housing is considered affordable when a household spends 30% or less of total income on shelter. Housing expenditures exceeding 30% of household income have historically been viewed as an indicator of a housing affordability problem or “housing-cost burden.”
"Affordable Housing" and "Housing Affordability" are not the same thing. But addressing one can impact the other. Many of the households facing affordability issues require affordable housing and/or housing with supports.
FIGURE 7.22 MEDIAN HOUSEHOLD INCOME BEFORE TAXES BY TENURE ($)
Source: Statistics Canada
FIGURE 7.21 PERCENTAGE OF HOUSEHOLDS SPENDING 30% OR MORE OF THIER TOTAL INCOME ON SHELTER COSTS IN EDMONTON
2006
OWNER
16.7%
RENTER
39.3%
2011
OWNER
18.9%
RENTER
41.5%
For renters, shelter costs include rent and payments for electricity, fuel, water and other municipal services. For owners, costs include mortgage
payments (principal and interest), property taxes and any condominium fees, along with payments for electricity, fuel, water and other municipal
services.
20112006
RENTER $34,630
OWNER $74,355
$45,829 32.3%$89,312 20.1%

2017 growth monitoring report Housing in the City 7.0
73
THE IMPORTANCE OF AFFORDABLE HOUSING
The City of Edmonton believes safe, adequate and affordable housing is fundamental to the physical, economic and social well-being of individuals, families and communities, and diversity of housing choices, including the availability of affordable housing, is a core feature of healthy and complete communities. Affordable housing is also a key element of social justice in society.
Safe and adequate housing has long been linked to improved individual health and well-being. A broad range of housing choice provided in all areas of the city helps contribute to more inclusive communities, positive social outcomes and the well-being of children, indigenous households and immigrants. A sufficient supply of affordable housing helps support a healthy labour market and is crucial to enabling long-term financial stability for low income households.
THE CITY’S ROLE IN AFFORDABLE HOUSING
Many Edmonton households are experiencing significant housing affordability challenges and are prone to housing instability and homelessness. While the private market is effective at providing housing for approximately 80% of Edmontonians, 20% of households do not have their needs met by private rental or ownership housing. To address housing needs not met by the private market, the City of Edmonton plays four major roles in affordable housing:
1) policy, planning and research, 2) housing capital project implementation, 3) delivering housing (grant) programs and asset
management, and4) initiatives to address homelessness.
AFFORDABLE HOUSING STRATEGY
The City of Edmonton’s Affordable Housing Strategy guides City involvement in affordable housing through four goals:
1) increase the supply of affordable housing in all areas of the city,
2) maintain the supply of affordable housing and market rental housing,
3) enable stable residential tenancies and transition people out of homelessness, and
4) anticipate, recognize and coordinate action to respond to housing and homelessness needs.
CURRENT HOUSING PRIORITIES
The City of Edmonton has identified several key priorities regarding affordable housing:
develop surplus school sites,
add permanent supportive housing, and
encourage the development of affordable housing in all city neighbourhoods.
Moving forward, the City will continue to strive to achieve diverse, inclusive and complete communities with a range of housing choices through the provision of non-market affordable housing in all areas of the city.

8
74

2017 growth monitoring report Hot Spots for Growth 8.0
75
HOT SPOTS FOR GROWTH
“ as a region we are committed to growing collaboratively through the efficient use of infrastructure, building compact communities, and fostering economic opportunities and healthy lifestyles. “
CAPITAL REGION BOARD
Edmonton continues to experience growth and provide diversity of housing choices for our new and current residents. These developments occur in the core, mature and established neighbourhoods within the city and have the potential to provide new housing units in recently re-zoned land.
For the first time in over thirty years, Edmonton is seeking to extend its municipal boundary (see Map 4.1). The annexation of lands south of the city will give Edmonton room to grow and remain a strong, central city, which helps the region compete in the global market and attract investments, businesses, jobs and a skilled workforce.
Edmonton continues to invest in downtown and has also embarked on a series of transformational projects in or near the core.

76
Nodes and Corridors Planning
WHAT IS NODES AND CORRIDORS PLANNING?
Transforming Edmonton’s urban form requires attention to specific parts of the city that have the most potential for change. Key areas of change include LRT station areas and other destinations – nodes – and streets with frequent transit service and appropriate urban form – corridors. Nodes and corridors planning will focus the City’s redevelopment efforts on these strategic areas, which represents an evolution of land planning for Edmonton.
STADIUM STATION TRANSIT ORIENTED DEVELOPMENT PROJECT
The City is preparing a Transit Oriented Development (TOD) land use plan that will help guide growth and change around the Stadium LRT station over the next fifteen to twenty years. TOD at the Stadium LRT station will help the city become more compact and sustainable, make better use of existing infrastructure and, best of all, be very attractive to future residents.
The project will extend ongoing revitalization north from The Quarters Downtown, offering increased vibrancy and safety within the framework of a new Stadium Station Area Redevelopment Plan (ARP) that is currently under preparation.
One of the major components of the new plan will be a ‘main street’ running east-west across the LRT tracks just south of Stadium Station. This 'main street' will create a gateway through to Jasper Avenue, connecting new and existing housing with the LRT, Commonwealth Stadium, Community Recreation Centre, the river valley and Kinnard Ravine.
The City is taking a collaborative approach with the development industry and is in the process of entering into a cost-sharing agreement with a developer in the area, Brookfield Residential, for the ‘main street’ and other public infrastructure required to support the vision for TOD adjacent to the station. The cost-sharing agreement with Brookfield Residential represents significant progress in the area’s transformation from an underutilized industrial area into a smart, walkable transit-oriented community that will help catalyze development of adjacent properties and make vital connections for residents and businesses.
The Brookfield development will also create economic benefit for the City. Colliers International Consulting estimates it will generate almost $29 million in municipal property taxes during the development period plus residential property taxes of $4.55 million annually after completion.
Careful consideration is being given to ensure both the cost-sharing agreement and Brookfield’s development application align with the vision, objectives and policies of the new Stadium Station ARP.
Adopting the new plan will require amendments to the existing ARPs that apply to the Boyle Street, Cromdale, Parkdale and McCauley neighbourhoods.

2017 growth monitoring report Hot Spots for Growth 8.0
77
planWHYTE
The Strathcona neighbourhood is a key area where change needs to be carefully managed and leveraged to sustain its future prosperity, attractiveness and livability. While celebrated and valued for its unique commercial and historic character, Strathcona continues to experience increased interest and pressure to redevelop within/around its core heritage commercial area.
In consideration of recent development pressure and sensitivity of the area’s heritage and character, City Council Executive Committee on February 2, 2016, supported administration’s proposal to undertake a focused land use study.
EXAMINING THE EXISTING PLAN
In 2015, administration undertook a series of activities to determine the effectiveness of the existing Strathcona Area Redevelopment Plan (ARP). This included meetings with key stakeholders, focus groups, an online survey and review of case studies.
Initial findings indicated that the Strathcona ARP provides for strong heritage preservation but restricts new more intensive redevelopment opportunities.
The City is initiating a land use study for the Whyte Avenue Commercial Area portion of the Strathcona Area Redevelopment Plan (ARP). The goal of this study is to better understand how the area’s heritage, character and livability can be further strengthened while exploring opportunities for additional development over the next twenty to twenty-five years.
This study will examine heritage, land use, urban design, transportation and development opportunities (outside the core heritage commercial area), in order to develop a design vision for the long-term evolution of Whyte Avenue. This work is expected to lead to a series of recommendations that will:
strengthen preservation of the core heritage commercial area,
identify potential opportunities for additional development outside the core area,
enhance the quality of urban design within the Whyte Avenue area, and
lead to amendments to the Strathcona ARP.
phase 1Feb June 2016
Exploring opportunities and constraints
phase 2July Sept 2016
Evaluation of alternatives
phase 3Oct 2016 April 2017
Draft study and recommendations
phase 4May 2017 Sept 2017
Final study and approval
TIMELINE

78
After nearly a decade of planning, engineering and pre-construction work, the City of Edmonton is moving forward this year on the first stage of residential construction in Blatchford. This ambitious redevelopment plan will transform 536 acres in central Edmonton into one of the largest sustainable redevelopment projects in the world.
Blatchford is a once-in-a-lifetime opportunity to design a community for 30,000 people with intentionally different outcomes. With a focus on providing both high social and environmental sustainability outcomes, the community will have:
significant park and green spaces, including urban agriculture, green roofs and rain gardens,
a district energy system that will provide heating, cooling and hot water for the community,
custom-designed streets, including wider sidewalks and protected bike lanes, that emphasizes active transportation,
high-performance homes and buildings that will require less power, heat and water than conventionally constructed buildings, and
retail services located throughout the community that will allow residents to access their daily needs.
The community is also taking a unique approach to increasing density. It will be the first community in Edmonton with only apartments, condominiums and townhomes (no single-detached homes). Increasing density results in a number of benefits including creating a vibrant and safe street life as well as having a population large enough to support a variety of community services and amenities.
stage 1 will create the opportunity for approximately 250 dwelling units, public open space and the first of several urban garden sites in the community.
Construction in 2017 will focus on installing underground utilities such as sanitary sewers, storm sewers, and water lines for the first stage of residential development. In Blatchford’s case, this also involves adding special infrastructure for the District Energy Sharing System, which will provide the heating and cooling for the homes. Once the underground utilities have been installed, roads and laneways (alleys) will start to be built.
For more information on the project, including construction updates, visit BlatchfordEdmonton.ca.
BLATCHFORD

2017 growth monitoring report Hot Spots for Growth 8.0
79
ICE District is located from 101 Street to 104 Street and along 103 Avenue to 106 Avenue. Once completed, the 10.1 hectare district will be a master-planned community connecting Edmonton’s central core to the north, east, west and south through its connections to five LRT stations, pedestrian-friendly streets, promenades and pathways. The district also offers ample parking.
While the focal point is the 18,647-seat Rogers Place arena and public plaza (opened in fall 2016), the district alone is expected to add another 1,000+ residential units in the form of luxury condominiums and premium quality rental. Permitting and construction is currently taking place for several of the residences. The district will also provide the opportunity for individuals to live where they work and play with 1.3 million square feet of rentable office space and over 270,000 square feet of retail being included in phase one alone.
When completed the district will offer an integrated mix of retail, office, hotel, residential and entertainment venue space.
Through this development the City of Edmonton, in partnership with the Edmonton Arena District joint venture, is working towards developing a well-designed, sustainable, vibrant and accessible downtown area that realizes the goals outlined in the Capital City Downtown Plan.
in 2016, the city received building permit applications that equated to 741 residential units in the ice district.
ICE DISTRICT

80
Nestled next to North America's largest stretch of parkland, The Quarters Downtown is positioned to become a vibrant, flourishing community in Downtown Edmonton. With $56 million in infrastructure upgrades and another $43 million allocated to new projects in The Quarters Downtown, the mixed-use urban village is taking shape.
This 40-hectare area extends from 97 Street to 92 Street, and from 103A Avenue to the top of the North Saskatchewan River Valley.
The Quarters Downtown is made up of five distinct districts: the Civic Quarter, Heritage Quarter, McCauley Quarter and Five Corners Quarter each with a unique character and design and centred around The Armature, a pedestrian-focused green street and the defining element for the community.
The City of Edmonton has invested $56 million to improve infrastructure in the area. Ongoing development opportunities include hotels, mixed-use residential properties, and the commercial and retail services that will serve a growing population.
The Stadium Station TOD Project, directly adjacent to The Quarters Downtown, will further enhance the unique character and livability of this impressive development.
DOWNTOWN: THE QUARTERS
Over the next 5, 10 and 20 years, the area will be transformed into a vibrant, diverse and inclusive community well connected to the central business and cultural district and the river valley.

2017 growth monitoring report Hot Spots for Growth 8.0
81
Annexation TIMELINE: 3-7 years SIZE: Approximately 9,270 hectares
BY 2066, edmonton’s population is projected to reach over 2 million people.
That’s a little over a million more people than we have now. We’re responsibly planning to ensure a high quality of life for our residents and a vibrant, strong central city for the region.
EDMONTON IS GROWING, FAST
In just two years, Edmonton grew by 7.4% or more than 60,000 people (see Figure 3.3). That’s 82 people moving to Edmonton every day. To put that in perspective, effectively from 2012 to 2014, we grew almost the size of St. Albert.
ROOM TO GROW
Even with Edmonton’s “Up, In and Out” growth management strategy that uses land efficiently and effectively, we are still running out of room to grow. With Edmonton providing 70% of the region's housing options and nearly 80% of the region's jobs, this is a problem.
not having enough land to meet demand affects land costs, housing affordability, and job creation.
Annexation will allow Edmonton room to grow, and with growth comes opportunity. Growth brings new retailers, restaurants, festivals and international events that add vibrancy and culture. It also helps Edmonton attract and keep a talented workforce, create jobs and attract global leaders in research and innovation. In other words, a strong Edmonton sustains a globally competitive and prosperous region.

82
REGIONAL GROWTH PLAN
Edmonton is a major city in the fastest-growing region in the fastest growing province in Canada.
with the edmonton region projected to have 34% of the provincial population by 2041, careful long-term planning is critical to ensure this growth is accommodated sustainably.
To ensure the Edmonton Metropolitan Region uses resources efficiently and supports the high quality of life we enjoy, the twenty-four municipalities within the Edmonton Metropolitan Region partnered together to form the Capital Region Board (CRB).
The CRB’s regional growth plan describes where people will live and where jobs will be located in the region over the next fifty years. The plan also provides a vision for what growth will look like - the densities of new residential areas and the requirement that new neighbourhoods be developed next to already built-up areas. This ensures land is used efficiently and that development and supporting infrastructure, such as sewer pipes, are aligned.
The plan calls for much of Alberta's growth over the next fifty years to be accommodated within the land south of Edmonton’s existing boundary, in the area Edmonton is proposing to annex (see Map 4.1).
The City of Edmonton’s proposed annexation area is 9,270 hectares of land from Leduc County and the Town of Beaumont, east and west of the Queen Elizabeth II Highway. The proposed annexation area is made up of 6,440 hectares of largely undeveloped land and 2,830 hectares of Edmonton International Airport (EIA) land.

2017 growth monitoring report Hot Spots for Growth 8.0
83
0 1 2 3 4 Km
The information on this map is provided forthe benefit of the user, and while thoughtto be accurate, is provided strictly "as is"and without warranty of any kind, eitherexpress or implied.
Proposed Annexation Area
Edmonton International Airport*
Municipal Boundaries
Section Grid
Waterbodies
Major Highways
Local Roads
A Map Labels
CITY OF EDMONTON
PARKLANDCOUNTY
LEDUCCOUNTY LEGEND
41st Ave
Hwy 625
EDMONTONINTERNATIONALAIRPORT
TOWN OFBEAUMONT
CITY OF LEDUC
STR
ATH
CO
NA
CO
UN
TY
LEDUCCOUNTY
Twp Rd 510
50thS
t
TOWN OF DEVON
*
*Annexation of EIA subject to Airport Accord Discussions
the proposed annexation boundary has changed since the annexation process was initiated.

9
84

2017 growth monitoring report Appendices 9.0
85
2017 growth monitoring report Appendices 9.0
APPENDICES
A references
B definitions
C zoning summary
D methodology notes
E edmonton zoning trends

86
A | ReferencesCanadian Mortgage and Housing Corporation - Housing Starts
Adapted from Canadian Mortgage and Housing Corporation, Edmonton Housing Starts Summary, 1980 through 2015.
Census of Canada - Demographic Information
Adapted from Statistics Canada, Census of Canada, 1940-2011. This does not constitute an endorsement by Statistics Canada of this product.
City of Edmonton –Land Use, Density, Registrations, Servicing, Permits
The City of Edmonton provides this information in good faith. While every effort has been made to ensure the accuracy of information contained in this report, the City of Edmonton provides no warranty, express or implied, regarding the accuracy, completeness or correctness of information contained herein. The City of Edmonton disclaims any liability for the use of this information. No part of this material may be reproduced, in whole or in part, without acknowledgement.
All maps are compiled by Geospatial Services Unit, Urban Planning and Environment Branch. The City of Edmonton disclaims any liability for the use of the maps. No reproductions, in whole or in part, are permitted without express written consent of The City of Edmonton, Sustainable Development Department.
OTHER REFERENCES
Information on neighbourhoods, zoning, and land and
development applications:
City of Edmonton maps: http://maps.edmonton.ca/
For more information on ‘Echo Boomers’ and the sources used in this report please refer to:
Carrillo, A. (2013, January 22). Downtown Toronto population growing and getting younger. Retrieved May 9, 2015, from http://www.condo.ca/downtown-toronto-population-growing-and-getting-younger/
Williams, V. L., & Enriquez, A. B. (2010). Factors for attracting Baby Boomers and Millennials to downtown living: implications for revitalizing Guam's downtown Hagatna. Journal Of International Business Research, (Sl. 2), 61.
For more information on ‘Baby Boomers’ and the sources
used in this report please refer to:
O'Toole, M. (2013, January 22). Downtown Toronto's pace of population growth triples, outpacing suburbs' as Echo Boomers flock towards urban centre: Report. Retrieved from http://www.nationalpost.com/m/wp/blog.html?b=news.nationalpost.com//toronto/downtown-torontos-pace-of-population-growth-triples-outpacing-suburbs-as-echo-boomers-flock-towards-urban-centre-report
Patterson, Z., & Saddier, S. (2012). Are Baby Boomers Likely to Retire to the City in Canada. 1-28. Retrieved from https://www.cirrelt.ca/DocumentsTravail/CIRRELT-2012-62.pdf

2017 growth monitoring report Appendices 9.0
87
2017 growth monitoring report Appendices 9.0
B | DefinitionsArea Structure Plan (ASP) – A statutory plan that identifies future neighbourhoods and where residential, commercial, institutional and recreational sites will be located in a previously undeveloped area and how essential municipal services such as water and sewer systems, roads and fire protection will be provided. These plans also describe the number of people that are expected to live in the new area and how development will be staged over time.
Core Neighbourhoods – Consists of downtown and neighbourhoods that have a strong inter-relationship with the Downtown, as defined by “Central Core” in The Way We Grow.
Density – Density is the spatial concentration of a measure within a geographic area, and is commonly measured by population or dwelling units. Density per net residential hectare refers to the spatial concentration within an area designated for residential purposes. This standardizes neighbourhood comparisons as it accounts for other land uses such as parks, roads, and commercial spaces.
Developing Neighbourhoods – Consists of neighbourhoods with facilities and services that are still under developed, as defined by The Way We Grow. For reporting purposes, this category also includes planned neighbourhoods that experience limited development activity, and is further broken into north, west, and south sectors.
Established Neighbourhoods – Consists of mature neighbourhoods as defined by the Mature Neighbourhood Overlay and established neighbourhoods developed prior to 1995, as defined by The Way We Grow. For reporting purposes, newer neighbourhoods with over 95 % completion of all residential lots are also classed with established as they no longer experience significant servicing activity.
High-Density Residential (HDR) – Includes higher volume multi-unit structures, including residential tower structures.
Infill (Residential) – Residential infill is the development of new housing in established neighbourhoods. This new housing may include secondary suites, garage suites, duplexes, semi-detached and detached houses, row houses, apartments, and other residential and mixed-use buildings.
Low-Density Residential (LDR) – A single-detached house or semi-detached/duplex housing, which may include a secondary suite.
Medium-Density Residential (MDR) – Attached units, except semi-detached dwellings and duplexes, but including row-housing and low and mid-rise apartments/condominiums.
Neighbourhood Area Structure Plan (NASP) – A statutory plan that identifies where future residential, commercial, institutional and recreational will be located in a previously undeveloped area and how essential municipal services such as water and sewer systems, roads and fire protection will be provided. These plans also describe the number of people that are expected to live in the new area and how development will be staged over time. NASPs are a smaller scale than an Area Structure Plan, but larger in area than a normal Neighbourhood Structure Plan. NASPs tend to be used in large, but uniform areas.
Neighbourhood Structure Plan (NSP) – A statutory plan that aligns with a larger Area Structure Plan, but provides greater detail at the neighbourhood-level. An NSP will provide information on where residential, commercial, institutional and recreational sites will be located in a previously undeveloped area and how essential municipal services such as water and sewer systems, roads and fire protection will be provided. These plans also describe the number of people that are expected to live in the new area and how development will be staged over time.
Net Unit growth - refers to the number of units built, minus the number of units demolished.
Residential Dwelling Unit – A single-family dwelling occupied or intended to be occupied by a household. A unit refers to a person's physical home or dwelling. Units include single-detached (standalone), mobile, semi-detached, row, apartment-style and other multi-family dwellings.
Semi-Detached House – A semi-detached house has another unit attached on one of its sides. It is included in single-family housing in this document for consistency.
Single-Detached House – A single-detached house has open space on all sides and is not attached to any other structure (except its own garage or shed). This structure may have a basement suite that does not have a separate private entrance.
Suite Addition – The addition of residential units to existing buildings (with or without the expansion of the building), such as introducing secondary suites into a detached house.
Traffic District –Edmonton is divided into 31 traffic districts.
Urban Growth Area – Areas identified in The Way We Grow for future urban growth.

88
C | Zoning Summary*Please note that this is a summary. Full regulations are available through the Zoning Bylaw 12800 at www.edmonton.ca/zoningbylaw.
RESIDENTIAL ZONES
RF1 - Single Detached Residential Zone
This zone provides the opportunity for single-family housing.
RF2 - Low Density Infill Zone
This zone provides the opportunity for retaining single-family housing, while allowing some duplex development.
RF3 - Small Scale Infill Development Zone
This zone provides the opportunity for single family and duplex housing while allowing some apartment or row housing with up to four units.
RSL - Residential Small Lot Zone
This zone provides the opportunity for single family housing with attached garages on smaller lots.
RSL - Residential Small Lot Zone
This zone provides the opportunity for single family housing with attached garages on smaller lots.
RPL - Planned Lot Residential Zone
This zone provides the opportunity for single family housing on smaller lots and accessed by a rear lane.
RMH - Mobile Home Zone
This zone provides the opportunity for mobile homes developed within a mobile home park or subdivision.
RR - Rural Residential Zone
This zone provides the opportunity for permanent single-family residential development in a rural setting.
RF4 - Semi-Detached Zone
This zone provides the opportunity for primarily semi-detached and duplex housing.
RF5 - Row Housing Zone
This zone provides the opportunity for relatively low to medium density housing, such as row houses or town houses.
RF6 - Medium Density Multiple Family Zone
This zone provides the opportunity for medium density housing, such as row houses or town houses that may have separate second storey units.
RA7 - Low Rise Apartment Zone
This zone provides the opportunity for low-rise apartment buildings up to four storeys.
RA8 - Medium Rise Apartment Zone
This zone provides the opportunity for medium rise apartment buildings up to six storeys in height.
RA9 - High Rise Apartment Zone
This zone provides the opportunity for high-rise apartment buildings.

2017 growth monitoring report Appendices 9.0
89
2017 growth monitoring report Appendices 9.0
DIRECT CONTROL ZONES
DC1 - Direct Development Control Provision
This zone provides the opportunity for detailed, sensitive control of the use, development, siting and design of buildings and disturbance of land. This zone is used to establish, preserve or enhance areas of unique character or environmental concern, or areas of special interest as designated under the Historical Resources Act.
DC2 - Site Specific Development Control Provision
This zone provides the opportunity for direct control over a specific proposed development where the proposed mix of uses or the development regulations cannot be accommodated in a standard zone.
Special Area - Downtown
This is a collection of special areas zones that apply only to the Downtown, and are listed in Section 910 of the Zoning Bylaw. These zones include the CCA, CMU, HA, HDR, JAMSC, RMU, UW, and AED zones.
HDR - High Density Residential
This zone provides the opportunity for high density housing with minor local commercial Uses in a predominantly residential environment where the concept of a livable urban village with a strong sense of identity and place, community activities and amenities are focused on a neighbourhood main street.
JAMSC - Jasper Avenue Main Street Commercial Zone
This zone provides the opportunity for at-grade, predominantly retail commercial, office and service uses suitable for the Downtown’s Main Street, Jasper Avenue, and to ensure that infill developments and the retrofitting and preservation of historical and older buildings incorporate human scale design characteristics to enhance a revitalized, Main Street atmosphere.
CCA - Core Commercial Arts Zone
This zone provides the opportunity for high density and quality development that accommodates office, retail, service, institutional, residential, arts and entertainment Uses and meet the land use objectives for the Commercial Cultural Core.
CMU - Commercial Mixed Use Zone
This zone provides the opportunity for medium intensity development that accommodates a mix of predominantly commercial, office, institutional and business Uses as a secondary office commercial area while emphasizing retail activities, entertainment and service Uses at grade.
INDUSTRIAL ZONES
IB - Industrial Business Zone
This zone provides the opportunity for industrial businesses that carry out their operations such that no nuisance is created or apparent outside an enclosed building, and the use is compatible with any adjacent non-industrial zones.
IM - Medium Industrial Zone
This zone provides the opportunity for manufacturing, processing, assembly, distribution, service and repair uses that carry out part of their operation outdoors or require outdoor storage areas. Any nuisance associated with these uses should not extend beyond the site.

90
COMMERCIAL ZONES
CNC - Neighbourhood Convenience Commercial Zone
This zone provides the opportunity for convenience commercial and personal service uses, intended to serve the day-to-day needs of residents within the neighbourhood.
CSC - Shopping Centre Zone
This zone provides the opportunity for larger shopping centres intended to serve a community or regional area. Residential, office, entertainment and cultural uses may be included in this zone.
CB1 - Low Intensity Business Zone
This zone provides the opportunity for low intensity commercial, office and service uses located along arterial roadways that border residential areas.
CB2 - General Business Zone
This zone provides the opportunity for businesses that require large sites and a location with good visibility and accessibility along, or adjacent to major public roadways.
NON-RESIDENTIAL ZONES
This is a collection of all non-residential zones, and includes commercial, industrial, urban service (AJ, US and PU), and agricultural and reserve zones. Residential development tends to be limited in these zones as it is not their primary purpose.
AJ - Alternate Jurisdiction Zone
This zones purpose is to provide for lands that do not require a Development Permit when operating under the jurisdiction of federal legislation, provincial legislation or the Constitution Act.
UI - Urban Institutional Zone
This zones purpose is to provide for facilities of an educational or institutional nature, within mature areas of the city that could include additional uses that would complement the institutional development.
US - Urban Services Zone
This zones purpose is to provide for publicly and privately owned facilities of an institutional or community service nature.
PU - Public Utility Zone
This zones purpose is provide for a system or works that is used to provide for public consumption, benefit, convenience or use such as water or steam, sewage disposal, public transportation, irrigation, drainage, fuel, electric power, heat, waste management and telecommunications.
AGU - Urban Reserve Zone
This zone provides the opportunity for agricultural and rural land use activities and a limited range of other uses that will not impact future development of the land.
AP - Public Parks Zone
This zone provides the opportunity for an area of public land for recreational uses.
CS1, CS2, and CS3 - Community Services Zones
The four Community Services Zones (CS1, CS2, CS3 and CS4) provide for relatively low to medium density housing generally referred to as row housing on lands that have become surplus to public education needs. In addition, each Community Services Zone has a distinct range of development opportunities.

2017 growth monitoring report Appendices 9.0
91
2017 growth monitoring report Appendices 9.0
REGISTRATION AND SERVICING INFORMATION
Low density lot supply includes single-detached, duplex, and semi-detached building forms. Remaining low density lot supply is the calculated difference between registered lots and total projected lots, based on the most recent neighbourhood plan (or amended plan), up to December 31, 2013
Neighbourhoods are considered complete when low density residential lots reach 95 % completion. Neighbourhoods may not reach 100 % completion due to servicing constraints or small variations between actual and projected unit numbers.
MAPS
All maps are compiled bythe City of Edmonton unless otherwise noted. The City of Edmonton disclaims any liability for the use of this map. No reproduction of this map, in whole or in part, is permitted without express written consent of The City of Edmonton, Sustainable Development Department.
CENSUS INFORMATION
Differences in population statistics may occur due to rounding at the neighbourhood and age group level, and the exclusion of unconventional populations such as hotels and group counts.
PERMIT INFORMATION
Information is based on City of Edmonton building permit data, and may be subject to error. Development that occurs without permits is not included.
Demolished units do not always account for secondary suites, and secondary suites can be removed without permits, so may be undercounted.
Permits referring to “stacked semi’s” are recorded as duplexes. Stacked and side-by-side row housing is recorded as row housing.
D | Methodology Notes

92
E | Edmonton Zoning Trends 2006-2016
Year 2006 2008 2010 2012 2014 2016
City Size in Hectares 69,980 69,980 69,980 69,980 69,980 69,980
Reserve/Agriculture Zoning (ha) 30,399 27,860 26,760 26,160 23,810 17,340
DEVELOPED ZONING (ha)
Residential Hectares 19,052 20,290 20,750 21,090 22,180 22,730
Direct Control Hectares 2,249 2,550 2,790 2,880 2,960 3,080
Commercial Hectares 1,485 1,570 1,610 1,640 1,740 1,770
Industrial Hectares 7,294 7,550 7,630 7,630 8,190 8,800
Institutional Hectares 3,658 4,170 4,360 4,430 4,620 4,790
Parks and Open Space 5,843 5,990 6,080 6,160 6,510 6,940
Total Developed Zoning (ha) 39,581 42,120 43,220 43,830 46,200 48,110
Percent Developed 57% 60% 62% 63% 66% 69%
Percent Reserve/Agriculture 43% 40% 38% 37% 34% 25%
The following Zones are included in each broad zoning category. For more information on each zone, please see Edmonton’s Zoning Bylaw (Bylaw 12800) http://webdocs.edmonton.ca/InfraPlan/zoningbylaw/bylaw_12800.htm
Reserve/Agriculture: AG, AGI, AGU, EETR
Residential: RF1-RF6, RA7-RA9, RSL, RPL, RMD, RMH, RR, RMU, TSDR,TSLR, RPLt, RF4t, RF5t, RA7g, RF5g, RA7w, HDR, GLD, GLG, CCSF, CCLD, CCMD, CCHD, HVLD, UCRH, GHLD
Direct Development Control: DC1, DC2, DC(RDA)
Commercial: CB1, CB2, CB3, CHY, CNC, CSC, CO, CCA, EZ, HA, MSC, TMU, CCNC, GVC, UVCa, CSCa, CSCw, UW, JAMSC, AED, TC-C
Industrial: IB, IL, IM, IH, EIB, EIM, IC, EETB, EETC, EETL, EETM
Institutional: US, PU, AJ, MA, MA1-MA3, CS1-CS4, UI
Parks and Open Space: A, AP, AN, NA
“Developed Zoning” refers to zones with uses that require higher levels of servicing, as well as dedicated park zones. Roadways do not have zoning so roads take on the zoning of surrounding parcels. Note that although land may be zoned with “developable zoning,” actual development may not occur.

2017 growth monitoring report Appendices 9.0
93
2017 growth monitoring report Appendices 9.0
A “start,” is defined by the CMHC as the beginning of construction work on a building, usually when the concrete has been poured for the whole of the footing around the structure, or an equivalent stage where a basement will not be part of the structure.
Information is provided by the Canadian Mortgage and Housing Corporation (CMHC), please see the CMHC for more information, online at www.cmhc.ca/housingmarketinformation
CMHC Edmonton Housing Starts Summary 1980-2016
Source: Adapted from CMHC, Edmonton Housing Starts Summary, 1980 through 2016.
Edmonton: City Edmonton: CMA City as % of CMAYear Single Multiple Total Single Multiple Total Single Multiple Total
1980 2,655 5,791 8,446 3,674 6,293 9,967 72% 92% 85%1981 3,594 6,923 10,517 4,491 7,508 11,999 80% 92% 88%1982 1,683 7,428 9,111 2,204 7,534 9,738 76% 99% 94%1983 2,877 2,244 5,121 3,761 2,692 6,453 76% 83% 79%1984 1,722 155 1,877 2,197 187 2,384 78% 83% 79%1985 1,868 102 1,970 2,424 104 2,528 77% 98% 78%1986 1,710 200 1,910 2,355 206 2,561 73% 97% 75%1987 2,057 309 2,366 3,265 343 3,608 63% 90% 66%1988 2,105 597 2,702 3,469 664 4,133 61% 90% 65%1989 2,173 731 2,904 3,931 886 4,817 55% 83% 60%1990 2,495 937 3,432 4,759 1,162 5,921 52% 81% 58%1991 1,564 988 2,552 3,016 1,269 4,285 52% 78% 60%1992 2,346 1,541 3,887 4,683 2,081 6,764 50% 74% 57%1993 2,148 2,017 4,165 4,202 2,518 6,720 51% 80% 62%1994 1,690 1,461 3,151 3,225 1,781 5,006 52% 82% 63%1995 1,130 763 1,893 2,159 923 3,082 52% 83% 61%1996 1,421 514 1,935 2,944 690 3,634 48% 74% 53%1997 1,945 1,070 3,015 3,685 1,277 4,962 53% 84% 61%1998 2,032 1,559 3,591 4,080 1,867 5,947 50% 84% 60%1999 2,141 1,791 3,932 4,075 2,580 6,655 53% 69% 59%2000 2,137 1,628 3,765 4,072 2,156 6,228 53% 76% 60%2001 2,815 1,996 4,811 4,959 2,896 7,855 57% 69% 61%2002 4,158 4,664 8,822 6,860 5,721 12,581 61% 82% 70%2003 3,857 5,099 8,956 6,391 5,989 12,380 60% 85% 72%2004 4,030 4,129 8,159 6,614 4,874 11,488 61% 85% 71%2005 5,023 4,411 9,434 7,623 5,671 13,294 66% 78% 71%2006 5,363 4,453 9,816 9,064 5,906 14,970 59% 75% 66%2007 3,763 5,131 8,894 7,682 7,206 14,888 49% 71% 60%2008 1,220 2,759 3,979 2,606 4,009 6,615 47% 69% 60%2009 2,206 1,705 3,911 3,897 2,420 6,317 57% 70% 62%2010 3,417 2,963 6,110 6,062 3,897 9,959 56% 76% 61%2011 3,080 3,055 6,135 5,017 4,315 9,332 61% 71% 66%2012 3,517 5,971 9,488 5,658 7,179 12,837 62% 83% 74%2013 3,981 6,653 10,634 5,970 8,719 14,689 67% 76% 72%2014 4,750 5,048 9,798 6,832 7,040 13,872 70% 72% 71%2015 3,957 9,343 13,311 5,683 11,367 17,050 70% 82% 78%2016 3,079 4,184 7,263 4,335 5,701 10,036 71% 73% 72%

FOR MORE INFORMATION, PLEASE CONTACT
Urban Policy, Sustainable Development,
City Planning at:
311
edmonton.ca/growthanalysis