growth and profit opportunities in p&c r/i€¦ · •quota share assumed from a uk general...
TRANSCRIPT
Growth and profit opportunities in P&C R/I
Jürgen Gräber, Member of the Executive Board
20th International Investors' Day
Frankfurt, 19 October 2017
Did you know that ...
1
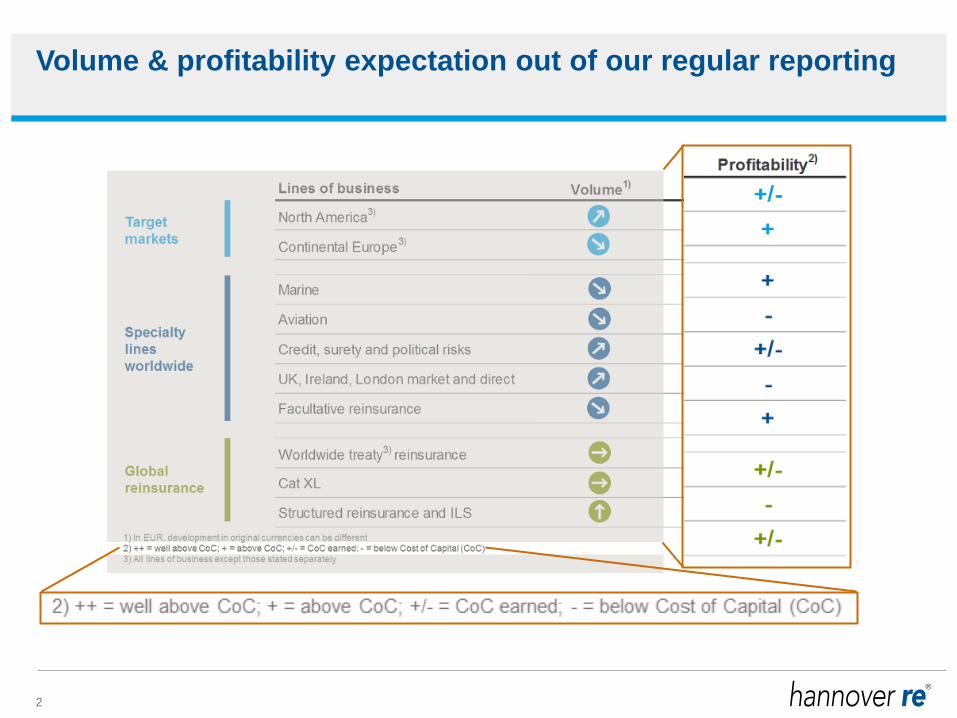
Volume & profitability expectation out of our regular reporting
2
Mid-term
outlook/ plan
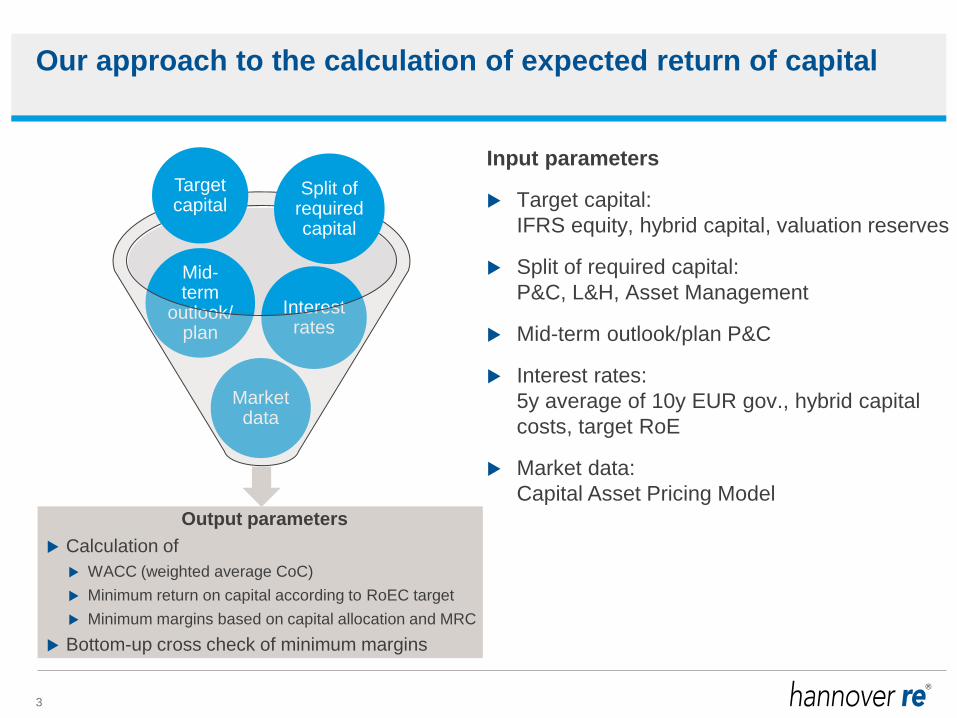
Our approach to the calculation of expected return of capital
3
Input parameters
Target capital:
IFRS equity, hybrid capital, valuation reserves
Split of required capital:
P&C, L&H, Asset Management
Mid-term outlook/plan P&C
Interest rates:
5y average of 10y EUR gov., hybrid capital
costs, target RoE
Market data:
Capital Asset Pricing Model
Interest rates
Market data
Target capital
Split of required capital
Output parameters
Calculation of
WACC (weighted average CoC)
Minimum return on capital according to RoEC target
Minimum margins based on capital allocation and MRC
Bottom-up cross check of minimum margins
Mid-term
outlook/ plan
Our approach to the calculation of expected return of capital
4
Input parameter using examples
Interest rates
Market data
Target capital
Split of required capital
Output
parameters
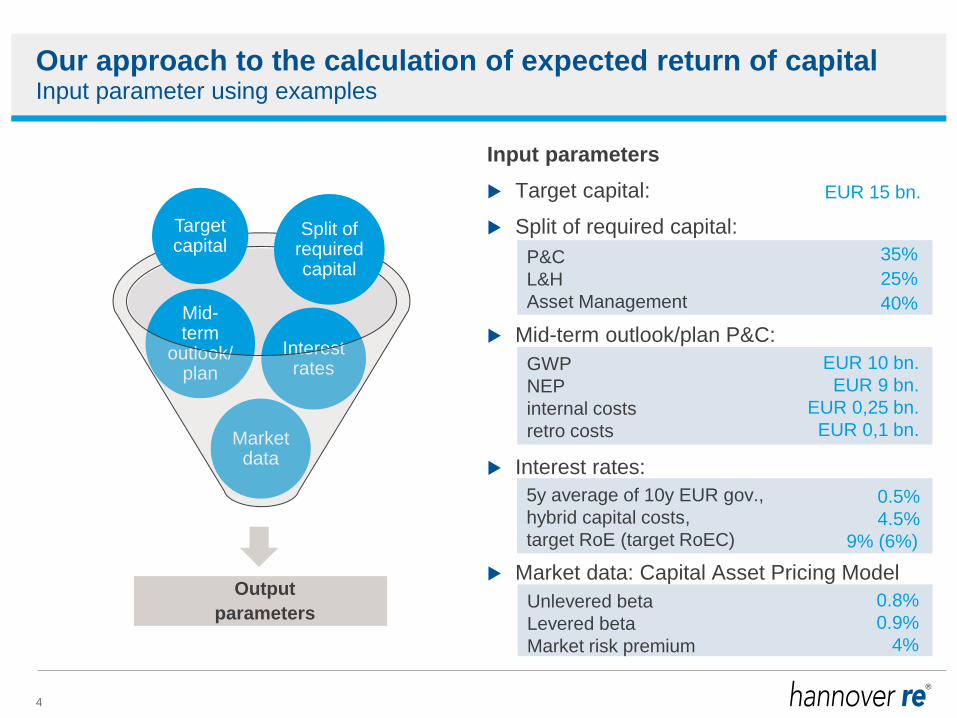
Input parameters
Target capital:
Split of required capital:
Mid-term outlook/plan P&C:
Interest rates:
Market data: Capital Asset Pricing Model
GWP
NEP
internal costs
retro costs
5y average of 10y EUR gov.,
hybrid capital costs,
target RoE (target RoEC)
Unlevered beta
Levered beta
Market risk premium
P&C
L&H
Asset Management
35%
25%
40%
EUR 10 bn.
EUR 9 bn.
EUR 0,25 bn.
EUR 0,1 bn.
0.5%
4.5%
9% (6%)
0.8%
0.9%
4%
EUR 15 bn.
Our approach to the calculation of expected return of capital
5
Output parameter using examples
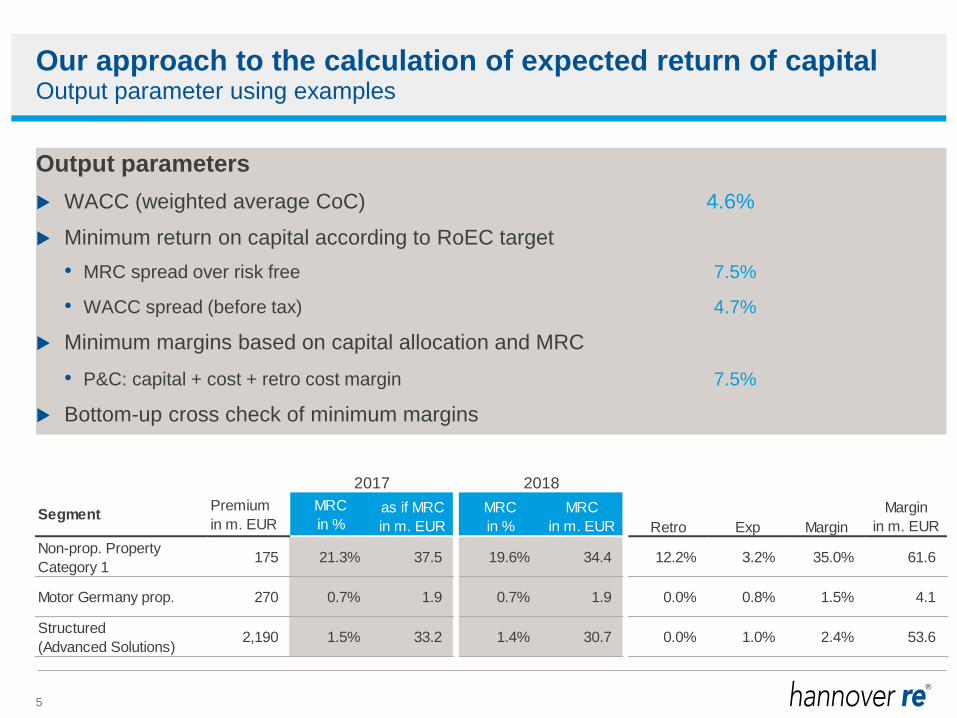
Output parameters
WACC (weighted average CoC) 4.6%
Minimum return on capital according to RoEC target
• MRC spread over risk free 7.5%
• WACC spread (before tax) 4.7%
Minimum margins based on capital allocation and MRC
• P&C: capital + cost + retro cost margin 7.5%
Bottom-up cross check of minimum margins
SegmentPremium
in m. EUR
MRC
in %as if MRC
in m. EUR
MRC
in %
MRC
in m. EUR Retro Exp Margin
Margin
in m. EUR
Non-prop. Property
Category 1175 21.3% 37.5 19.6% 34.4 12.2% 3.2% 35.0% 61.6
Motor Germany prop. 270 0.7% 1.9 0.7% 1.9 0.0% 0.8% 1.5% 4.1
Structured
(Advanced Solutions)2,190 1.5% 33.2 1.4% 30.7 0.0% 1.0% 2.4% 53.6
2017 2018
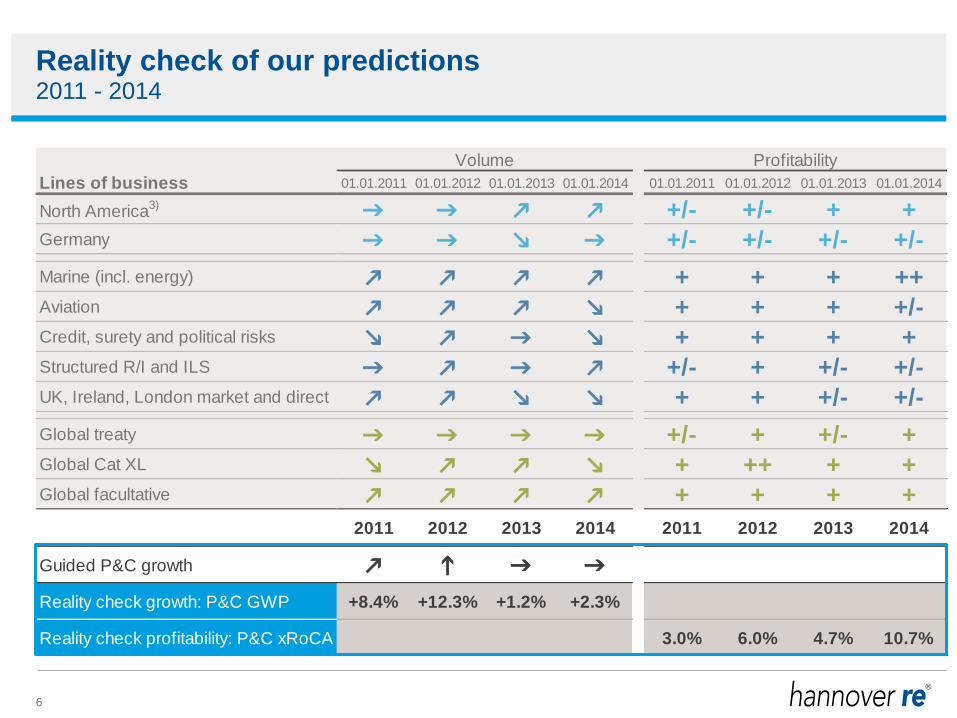
Reality check of our predictions
6
2011 - 2014
Volume Profitability
Lines of business 01.01.2011 01.01.2012 01.01.2013 01.01.2014 01.01.2011 01.01.2012 01.01.2013 01.01.2014
North America3)
g g k k +/- +/- + +Germany g g m g +/- +/- +/- +/-
Marine (incl. energy) k k k k + + + ++Aviation k k k m + + + +/-Credit, surety and political risks m k g m + + + +Structured R/I and ILS g k g k +/- + +/- +/-UK, Ireland, London market and direct k k m m + + +/- +/-
Global treaty g g g g +/- + +/- +Global Cat XL m k k m + ++ + +Global facultative k k k k + + + +
2011 2012 2013 2014 2011 2012 2013 2014
Guided P&C growth k h g g
Reality check growth: P&C GWP +8.4% +12.3% +1.2% +2.3%
Reality check profitability: P&C xRoCA 3.0% 6.0% 4.7% 10.7%
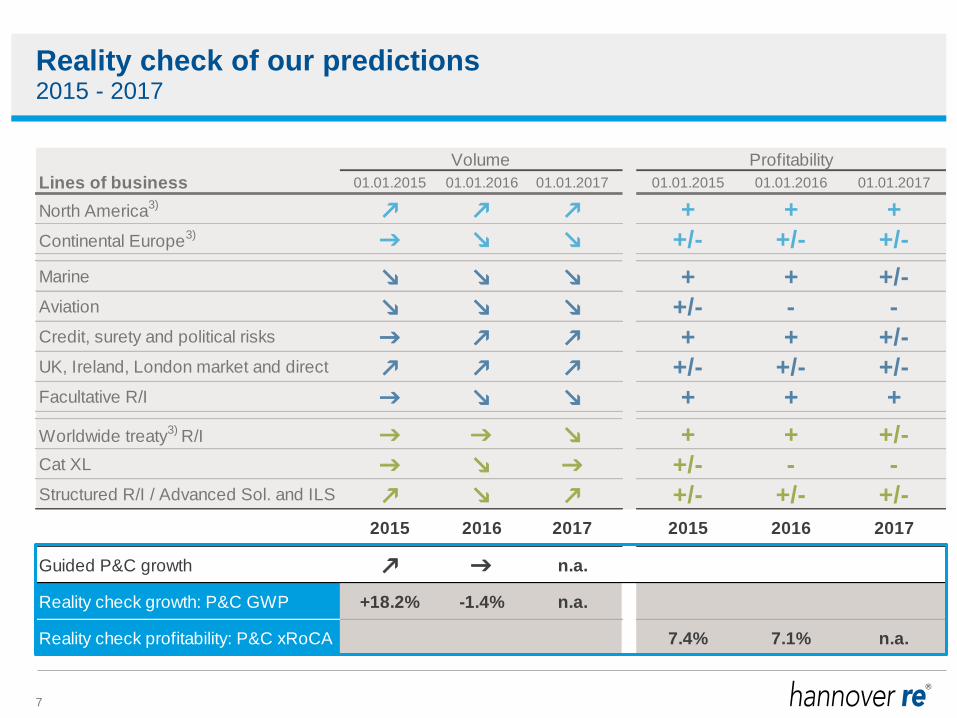
Reality check of our predictions
7
2015 - 2017
Volume Profitability
Lines of business 01.01.2015 01.01.2016 01.01.2017 01.01.2015 01.01.2016 01.01.2017
North America3)
k k k + + +
Continental Europe3)
g m m +/- +/- +/-
Marine m m m + + +/-Aviation m m m +/- - -Credit, surety and political risks g k k + + +/-UK, Ireland, London market and direct k k k +/- +/- +/-Facultative R/I g m m + + +
Worldwide treaty3)
R/I g g m + + +/-Cat XL g m g +/- - -Structured R/I / Advanced Sol. and ILS k m k +/- +/- +/-
2015 2016 2017 2015 2016 2017
Guided P&C growth k g n.a.
Reality check growth: P&C GWP +18.2% -1.4% n.a.
Reality check profitability: P&C xRoCA 7.4% 7.1% n.a.
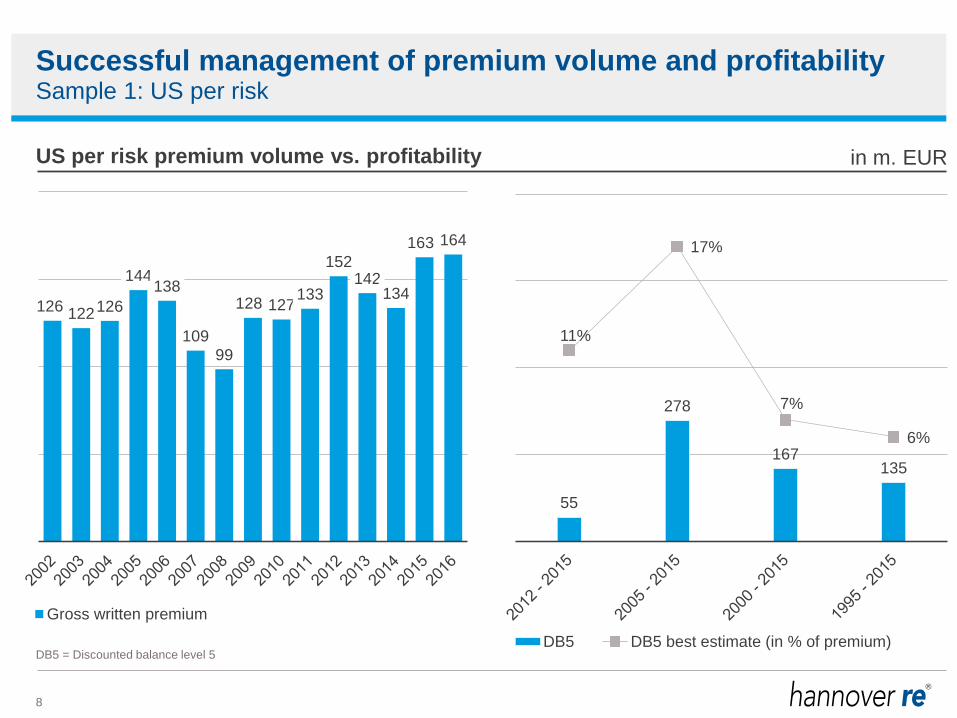
Successful management of premium volume and profitability
8
US per risk premium volume vs. profitability
55
278
167 135
11%
17%
7%
6%
DB5 DB5 best estimate (in % of premium)
Sample 1: US per risk
126 122 126
144 138
109
99
128 127 133
152 142
134
163 164
Gross written premium
in m. EUR
DB5 = Discounted balance level 5
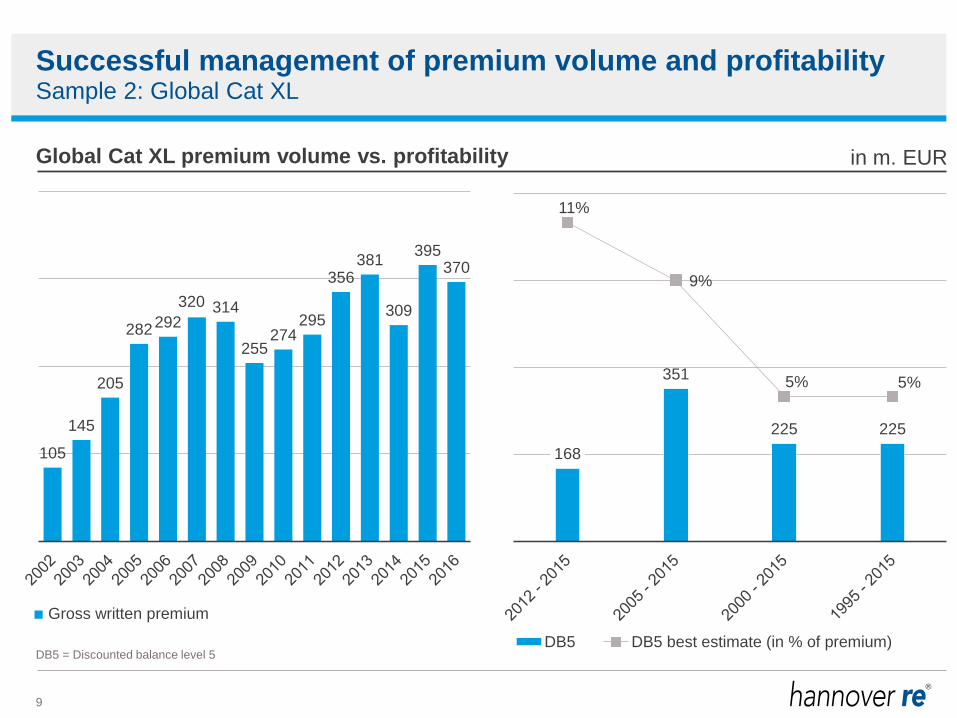
Successful management of premium volume and profitability
9
Global Cat XL premium volume vs. profitability
168
351
225 225
11%
9%
5% 5%
DB5 DB5 best estimate (in % of premium)
Sample 2: Global Cat XL
105
145
205
282 292
320 314
255 274
295
356 381
309
395 370
Gross written premium
in m. EUR
DB5 = Discounted balance level 5
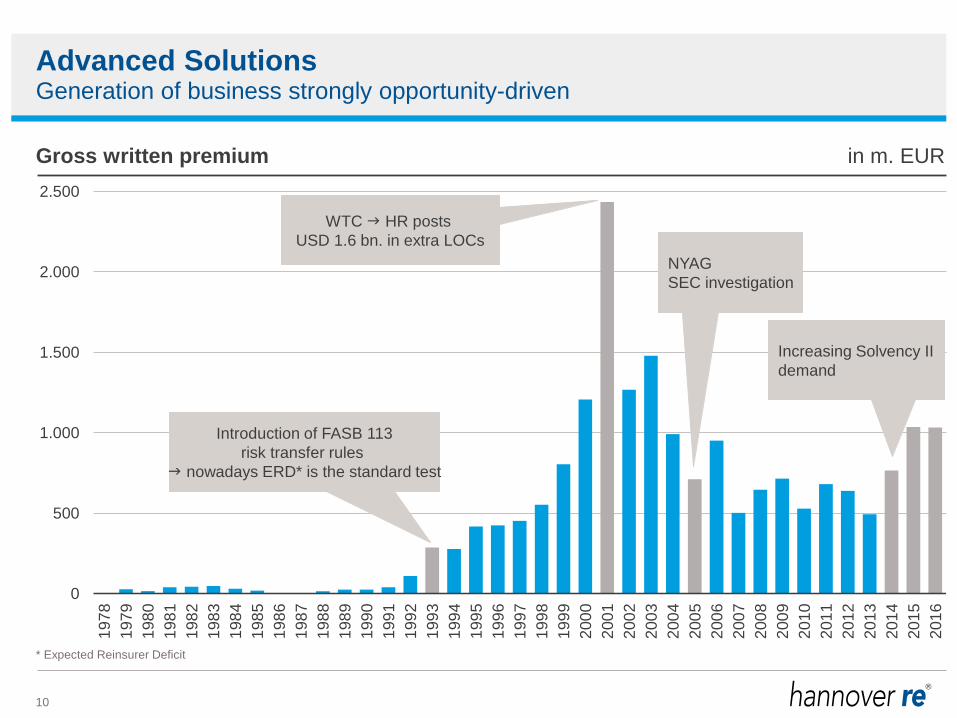
Advanced Solutions
10
0
500
1.000
1.500
2.000
2.500
197
8
197
9
198
0
198
1
198
2
198
3
198
4
198
5
198
6
198
7
198
8
198
9
199
0
199
1
199
2
199
3
199
4
199
5
199
6
199
7
199
8
199
9
200
0
200
1
200
2
200
3
200
4
200
5
200
6
200
7
200
8
200
9
201
0
201
1
201
2
201
3
201
4
201
5
201
6
Gross written premium in m. EUR
Generation of business strongly opportunity-driven
Introduction of FASB 113
risk transfer rules
g nowadays ERD* is the standard test
NYAG
SEC investigation
Increasing Solvency II
demand
WTC g HR posts
USD 1.6 bn. in extra LOCs
* Expected Reinsurer Deficit
Advanced Solutions
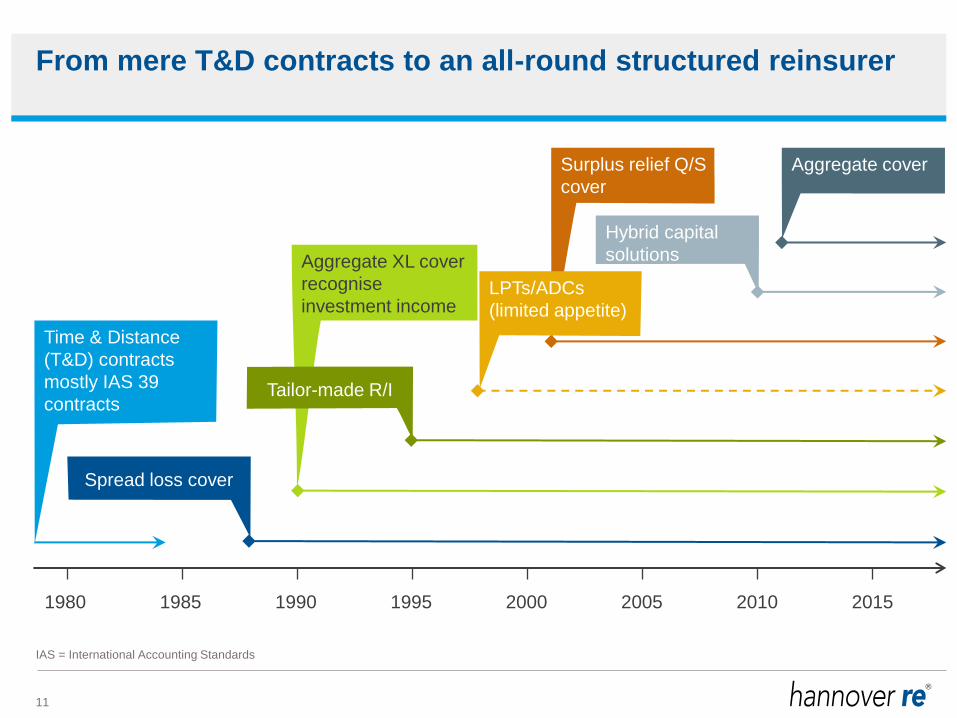
Surplus relief Q/S
cover
From mere T&D contracts to an all-round structured reinsurer
11
1980 1985 1990 1995 2010 2000 2005 2015
LPTs/ADCs
(limited appetite)
Aggregate cover
Time & Distance
(T&D) contracts
mostly IAS 39
contracts
Spread loss cover
Aggregate XL cover
recognise
investment income
Tailor-made R/I
Hybrid capital
solutions
IAS = International Accounting Standards
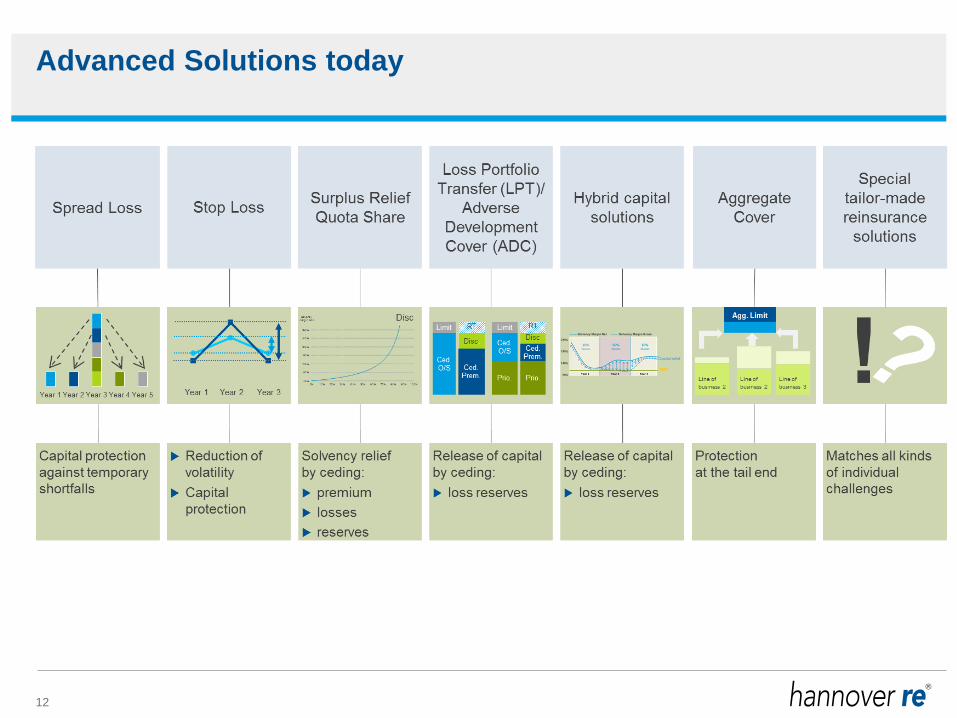
Advanced Solutions today
12
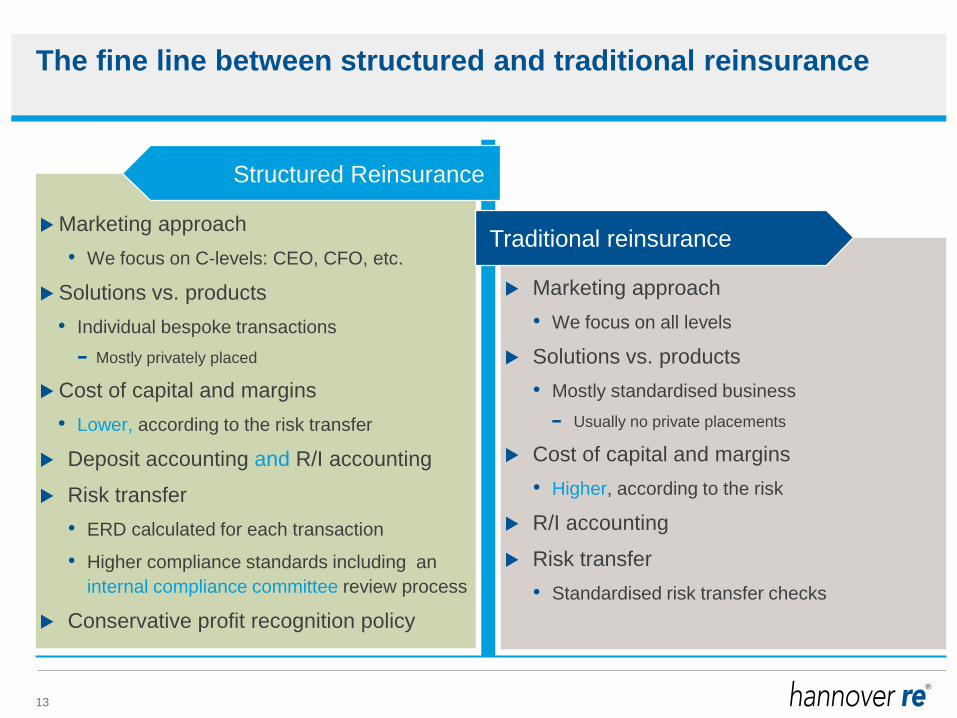
The fine line between structured and traditional reinsurance
13
Marketing approach
• We focus on C-levels: CEO, CFO, etc.
Solutions vs. products
• Individual bespoke transactions
− Mostly privately placed
Cost of capital and margins
• Lower, according to the risk transfer
Deposit accounting and R/I accounting
Risk transfer
• ERD calculated for each transaction
• Higher compliance standards including an
internal compliance committee review process
Conservative profit recognition policy
Marketing approach
• We focus on all levels
Solutions vs. products
• Mostly standardised business
− Usually no private placements
Cost of capital and margins
• Higher, according to the risk
R/I accounting
Risk transfer
• Standardised risk transfer checks
Structured Reinsurance
Traditional reinsurance
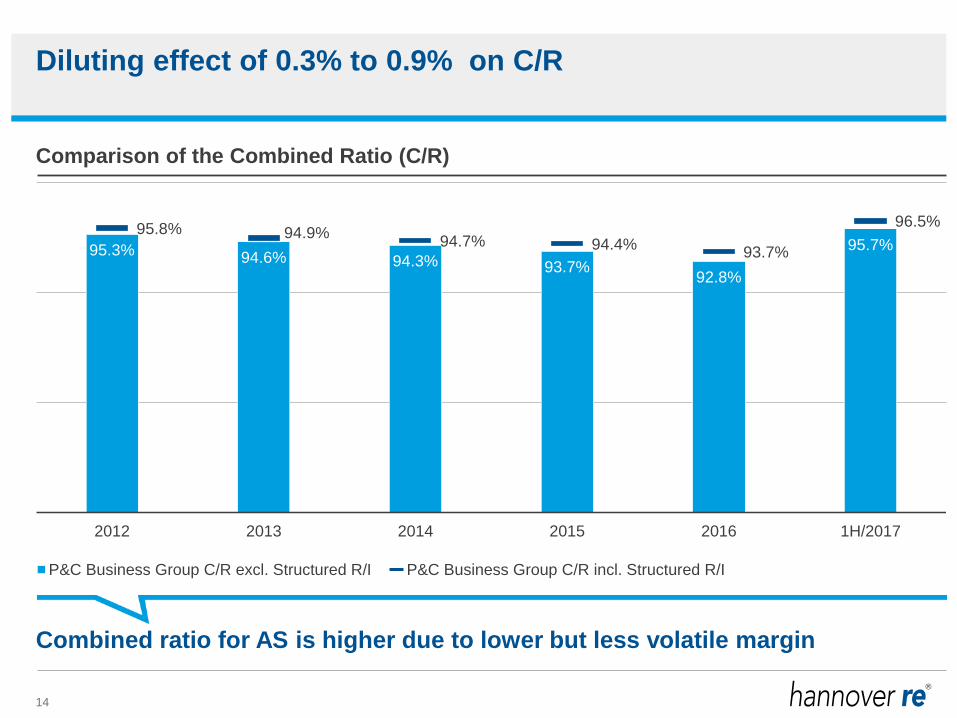
Diluting effect of 0.3% to 0.9% on C/R
14
95.3% 94.6% 94.3% 93.7% 92.8%
95.7% 95.8% 94.9%
94.7% 94.4% 93.7%
96.5%
2012 2013 2014 2015 2016 1H/2017
P&C Business Group C/R excl. Structured R/I P&C Business Group C/R incl. Structured R/I
Comparison of the Combined Ratio (C/R)
Combined ratio for AS is higher due to lower but less volatile margin
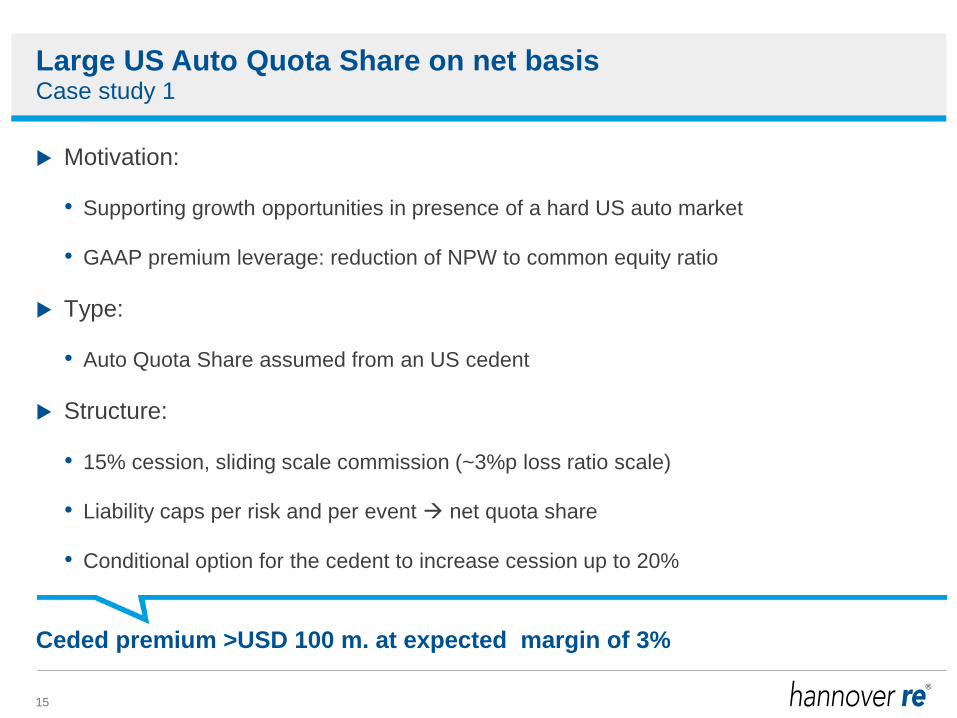
Large US Auto Quota Share on net basis
15
Motivation:
• Supporting growth opportunities in presence of a hard US auto market
• GAAP premium leverage: reduction of NPW to common equity ratio
Type:
• Auto Quota Share assumed from an US cedent
Structure:
• 15% cession, sliding scale commission (~3%p loss ratio scale)
• Liability caps per risk and per event net quota share
• Conditional option for the cedent to increase cession up to 20%
Case study 1
Ceded premium >USD 100 m. at expected margin of 3%
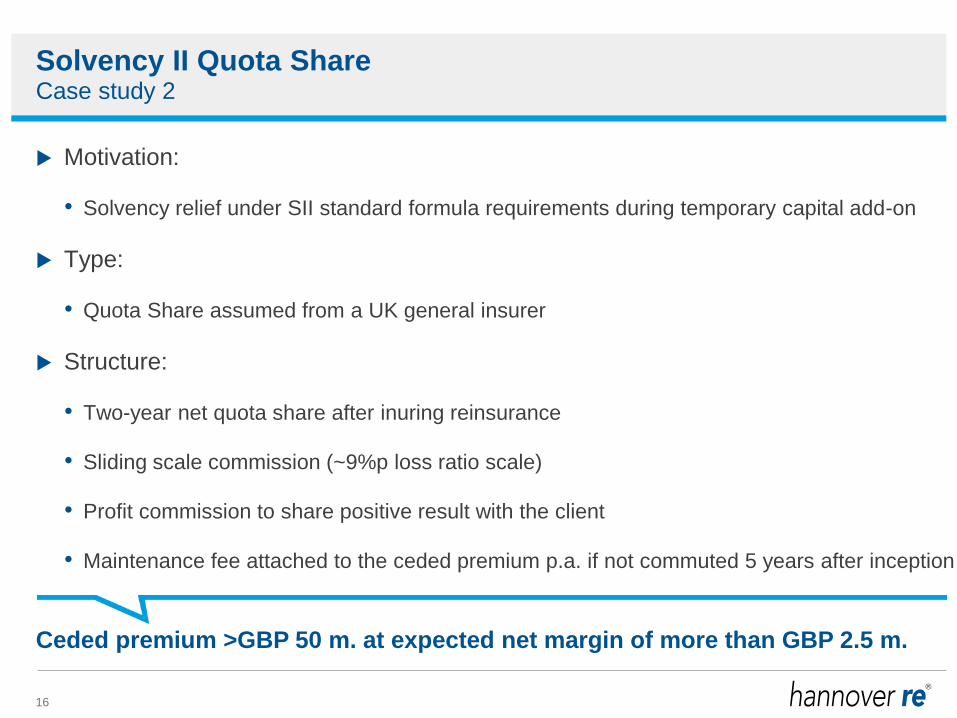
Solvency II Quota Share
16
Motivation:
• Solvency relief under SII standard formula requirements during temporary capital add-on
Type:
• Quota Share assumed from a UK general insurer
Structure:
• Two-year net quota share after inuring reinsurance
• Sliding scale commission (~9%p loss ratio scale)
• Profit commission to share positive result with the client
• Maintenance fee attached to the ceded premium p.a. if not commuted 5 years after inception
Case study 2
Ceded premium >GBP 50 m. at expected net margin of more than GBP 2.5 m.
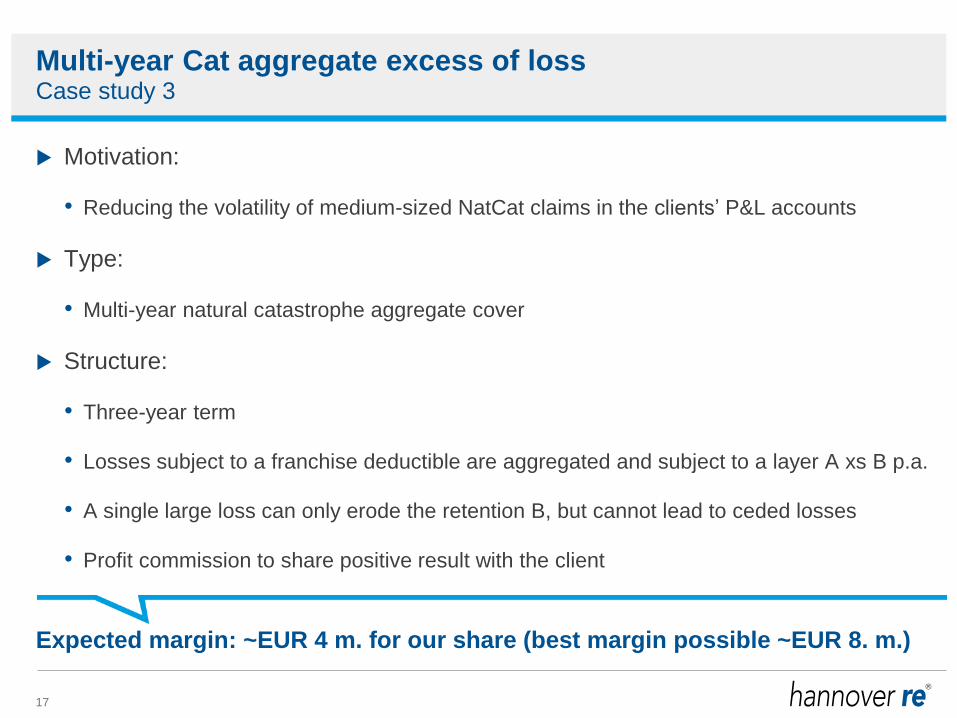
Multi-year Cat aggregate excess of loss
17
Motivation:
• Reducing the volatility of medium-sized NatCat claims in the clients’ P&L accounts
Type:
• Multi-year natural catastrophe aggregate cover
Structure:
• Three-year term
• Losses subject to a franchise deductible are aggregated and subject to a layer A xs B p.a.
• A single large loss can only erode the retention B, but cannot lead to ceded losses
• Profit commission to share positive result with the client
Case study 3
Expected margin: ~EUR 4 m. for our share (best margin possible ~EUR 8. m.)
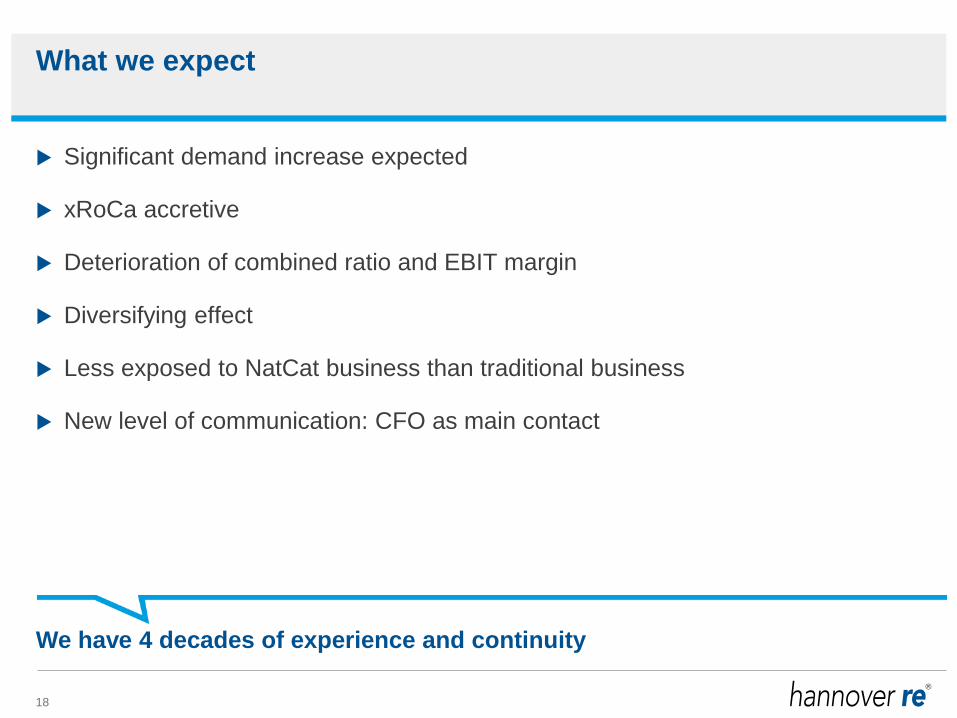
What we expect
18
Significant demand increase expected
xRoCa accretive
Deterioration of combined ratio and EBIT margin
Diversifying effect
Less exposed to NatCat business than traditional business
New level of communication: CFO as main contact
We have 4 decades of experience and continuity
Disclaimer
This presentation does not address the investment objectives or financial situation of any particular person or
legal entity. Investors should seek independent professional advice and perform their own analysis regarding
the appropriateness of investing in any of our securities.
While Hannover Re has endeavoured to include in this presentation information it believes to be reliable,
complete and up-to-date, the company does not make any representation or warranty, express or implied, as
to the accuracy, completeness or updated status of such information.
Some of the statements in this presentation may be forward-looking statements or statements of future
expectations based on currently available information. Such statements naturally are subject to risks and
uncertainties. Factors such as the development of general economic conditions, future market conditions,
unusual catastrophic loss events, changes in the capital markets and other circumstances may cause the
actual events or results to be materially different from those anticipated by such statements.
This presentation serves information purposes only and does not constitute or form part of an offer or
solicitation to acquire, subscribe to or dispose of, any of the securities of Hannover Re.
© Hannover Rück SE. All rights reserved.
Hannover Re is the registered service mark of Hannover Rück SE.