growth and opportunities in the international commercial ... and opportunities in... · growth and...
TRANSCRIPT

Growth and opportunities in the international commercial vehicle industry
Matthias WissmannPresidentGerman Association of the Automotive Industry (VDA)
International Press Workshop“Commercial Vehicles: On the Move for Everyone”18 July 2008, Frankfurt/Main

Commercial Vehicle Markets
I. Global
II. Germany
page 4
page 35
I. Global Commercial Vehicle Markets- Overview- by Region
- USA- Asia- Eastern Europe- Western Europe
page 4
page 9page 13page 24 page 30

4
Navistar JV
Toyota
Hino50.1%
Daihatsu51.1%
HyundaiMotor Company
Kia38.6% Asia Motors
PACCAR
DAFTrucks
LeylandTrucks
KenworthTruck
Ford
Otoyol JV
Nissan Motors44.6%
15%
Cooperation
Naveco(China)
Uralaz(Russia)
GM-Daewoo50.9%
Daimler HyundaiTruck Corp.
Source: Company data, Global Insight, VDA statistics
Volkswagen AG
ScaniaVWN100%
VW Trucksdo Brazil
General MotorsFuji HeavyInd. 8.7%
Isuzu
Opel/ Vauxhall
RenaultTrucks
MackTrucks Volvo BusVolvo Trucks
Renault
Nissan Diesel
Dacia
33.3%
PSA
Peugeot CitroënIveco
50%
Haveco(China)
50%
Otosan(Turkey)
DongfengYueda
Participation
FPT
Fiat
Volvo AB
5%
10%
MAN / ForceJV
MAN
Daimler Truck Group
Freightliner Truck Cooperation
Mercedes-Benz Trucks
Western StarSterling
Hero (India) JVMitsubishi FusoTruck and Bus
85%
Astra(Italy)
22%
34% 13.0%
PeterbiltMotors
30%
30%
Ford Trucks Brazil
100%
Thomas BuildBusses
Volvo Global Trucks
Eichler (India)
5.7%
27%
Fiat Professional
Caterpillar JV with Navistar
‚Blue Diamond‘ 50%
Mahindra & Mahindra JV
50%
50%
Freightliner
Increasing cooperation amongst the most importantcommercial vehicle manufacturers
859
348
1,05
0
354
1,11
0
111
18634
6
646
101
128
92
265
465
95
296
440
153
0
200
400
600
800
1,000
1,200
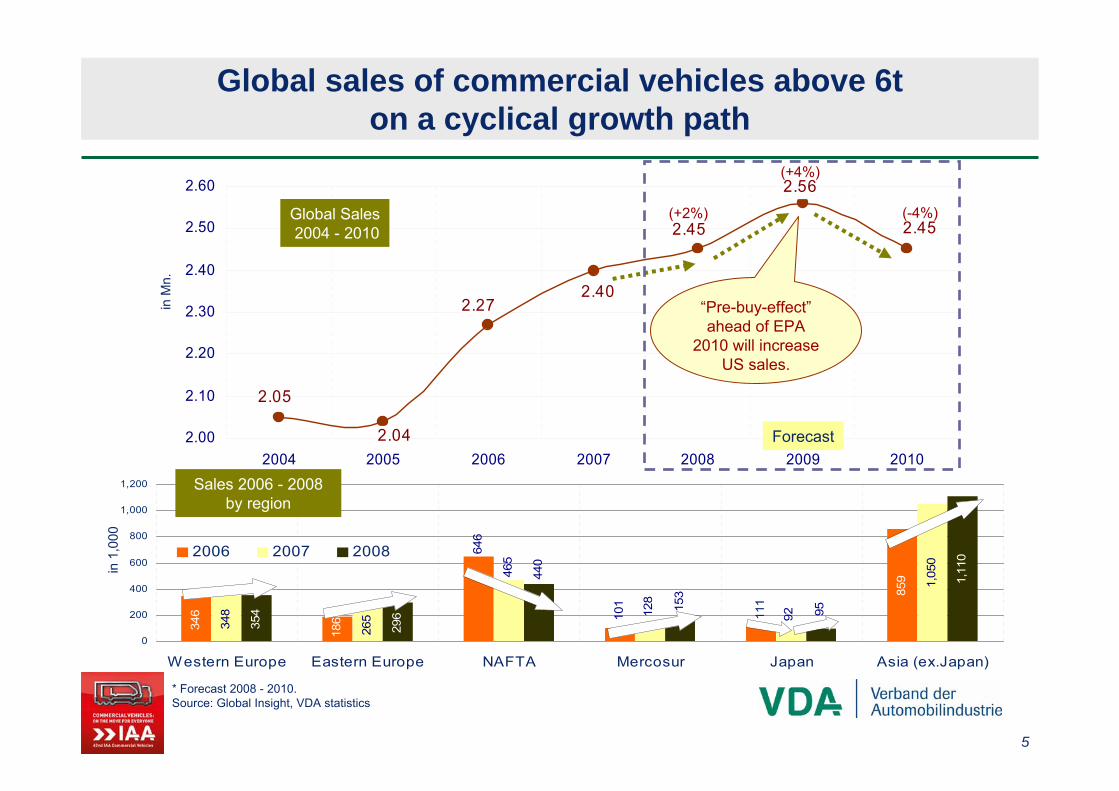
Western Europe Eastern Europe NAFTA Mercosur Japan Asia (ex.Japan)
2006 2007 2008
2.452.45
2.402.27
2.04
2.05
2.56
2.00
2.10
2.20
2.30
2.40
2.50
2.60
2004 2005 2006 2007 2008 2009 2010
Global sales of commercial vehicles above 6t on a cyclical growth path
* Forecast 2008 - 2010.Source: Global Insight, VDA statistics
Sales 2006 - 2008 by region
Global Sales2004 - 2010
(+2%)
(+4%)
(-4%)
“Pre-buy-effect”ahead of EPA
2010 will increase US sales.
in M
n.
in 1
,000
Forecast
5

6
63687075
93101105
155162164166
224350
62
0 100 200 300 400
HinoIsuzu
ScaniaIveco
Ashok Ley.MAN
CNHTCNavistar
FAWDongfeng
TataPaccar
Volvo/RVIDaimler
Major Manufacturers of Medium and Heavy Trucks 2007
Daimler incl. Freightliner, Western Star, Sterling, Mitsubishi Fuso. Volvo incl. Renault/Nissan Diesel and Mack.Source: Company data, VDA statistics
Turnover(in Bn. Euro)
2007 2006Daimler 45.4 40.6Volvo/RVI 21.9 20.3Paccar 11.1 12.3MAN 10.4 8.7Scania 9.1 7.6
Sales in 1,000 unitsDaimler confirms its
position as the worldwide leading
manufacturer of medium and heavy trucks.
7
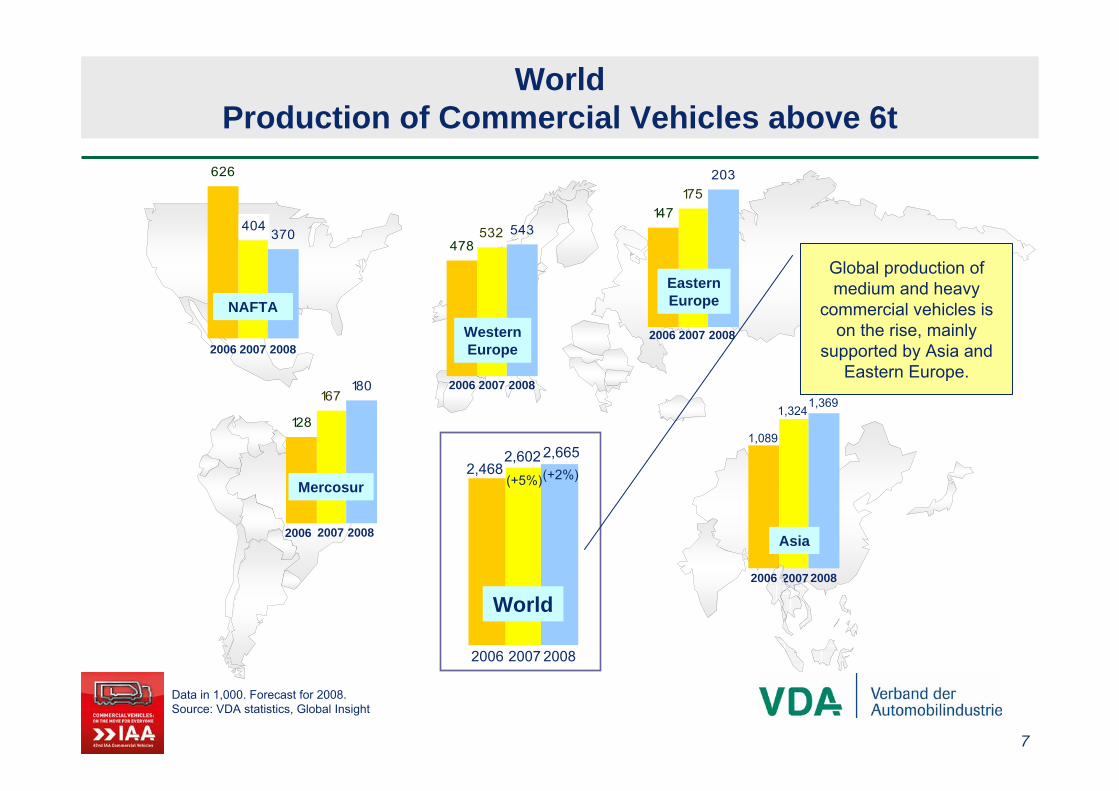
Data in 1,000. Forecast for 2008.Source: VDA statistics, Global Insight
WorldProduction of Commercial Vehicles above 6t
626
370404
NAFTA
2006 2007 2008
128
180167
Mercosur
2006 2007 2008
World
2006 2007 2008
147
203175
EasternEurope
2006 2007 2008
478543532
WesternEurope
2006 2007 2008
Asia
2007
1,089
1,3241,369
2,4682,602 2,665
Global production of medium and heavy
commercial vehicles ison the rise, mainly
supported by Asia and Eastern Europe.
2006 2008
(+5%)(+2%)

8
- Forthcoming increasing freighttransport also in industrial countries.
- Commercial vehicle will keepits No 1 goods carrier position.
- Emerging manufacturers like FAW, Dongfeng (China) or Ashok Leyland and Tata Motors (India) are looking for new
markets beyond their home regions.
- Increasing international cooperationhelps to realize synergy effects and to
challenge emerging markets.
- In many Asian and Eastern European countries growing economy means
growing transport acticity.- Former used vehicle markets like Russia
turn to new vehicle markets.
- Legal pressure for lower emissionsand higher safety will increase.
- Development of new drivetrains and reduction of weight by light construction.
- Improvement of cost structuresand profitability in face of different
international vehicle standards.- Coping with cyclicity of
commercial vehicle business.
Source: Euroforum, KPMG, VDA statistics
Emerging Markets
Transport Needs
International Cooperation
Environment
Costs
Emerging Manufacturers
Opportunities and Challenges for the international Commercial Vehicle Industry
Opp
ortu
nitie
s Challenges
Commercial VehicleIndustry

9
294291311
333346348
354
251279284
299287
258
226
194210
255252249
294
329339
251
213190199 202210
329
235
184
277284264
288312
277249
303
353353
393409
462
322
432
497
545
345
521
221
334
225
328350
424
189
371
150
200
250
300
350
400
450
500
550
80 82 84 86 88 90 92 94 96 98 00 02 04 06 08*
Western Europe USA
* Forecast.Source: Ward‘s, VDA statistics
Rebound of US sales takes longer than expected, slight increase in sales in Western Europe
Trend USA
Trend Western Europe
in 1
,000
Western Europe passesUSA!
Sales of Commercial Vehicles above 6t
Rather flat salescycle in Western
Europe
EPA-Effect
amplifiesUS sales
cycle

8,000
13,000
18,000
23,000
2005 2006 2007 2008
146 142
203
253
284
151 145
0
50
100
150
200
250
300
'02 '03 '04 '05 '06 '07 '08
176 186
228243
261
220200
0
40
80
120
160
200
240
280
'02 '03 '04 '05 '06 '07 '08
Sales of Medium Trucksclasses 4 - 7
Source: Ward‘s, VDA statistics
-47%
in 1,000 in 1,000 Daimler 31.5
Paccar 25.1
Mack 8.8
Volvo 11.1
others 0.1
International 23.4
-4%
Daimler 19.4
International 21.1
Paccar 4.1
Ford 29.0
GM 14.5
others 11.9
Sales of Medium und Heavy Trucks
Medium Trucks
Heavy Trucks
Sales of Medium and Heavy Trucksby manufacturer (Jan. - May 2008)
-10%
Sales of Heavy Trucksclass 8
US truck sales improved recently, but no rebound in 2008
Sales of Medium TrucksJanuary - May 2008:
79,621 (-18%)
Sales of Heavy TrucksJanuary - May 2008:
53,631 (-30%)
US Forecast2008:
345,000 (-7%)
Trend and saisonal adjusted data
10

11
VW29.4
Ford16.3
Iveco7.4
Scania6.0
Volvo7.9
Mercedes31.4
others1.6
VW8.9
Ford17.3
Iveco19.1
Scania5.3
others17.5
Mercedes31.9
13.8
6.1
-5.2-7.0
-9.2 -9.3
14.4
33.531.8
29.1
2.8
9.2
28.2
-15
-10
-5
0
5
10
15
20
25
30
35
40
1.Q.05
1.Q.06
1.Q.07
-05/08
Mercosur: Brazil delivers strong impetusfor increasing sales of medium and heavy trucks
Cha
nge
in %
to p
revi
ous
year
Source: ADEFA, ANFAVEA, VDA statistics
Sales of Medium/Heavy Trucks (January - May 2008 )
Argentina: 12,084 (+21%)Brazil: 50,045 (+35%)
Mercosur: 62,129 (+32%)
Forecast 2008Argentina: 28,000 (+5%)Brazil: 125,000 (+24%)
Mercosur: 153,000 (+20%)
Brazil
Argentina
∑ Germanmanufacturers
60.8%
∑ Germanmanufacturers
40.8%
in %
in %

12
Nissan Diesel12.8
Hino10.9
Isuzu7.8
Tata8.0
Volvo4.8
Mercedes29.3
others26.4
• Sales of medium and heavycommercial vehicles have more
than tripled since 2000.
• Especially mining and construction with high transport
need; further impetus due to FIFA WM 2010.
• Introduction Euro IV in 2010.Source: NAAMSA, VDA statistics
38,500
13,70512,693
11,725
16,327
20,814
27,406
33,080
37,069
0
5,000
10,000
15,000
20,000
25,000
30,000
35,000
40,000
'00 '01 '02 '03 '04 '05 '06 '07 '08
abo ve 8.5 t3.5 to 8.5 t
To tal
For.
in 1
,000
South AfricaSales of Medium and Heavy Commercial Vehicles
Market Share Heavy CVs(Jan. - May 2008, above 8.5 t)
in %
13
2005 20062007 2008*
R3
R4
R5
0
200
400
600
800
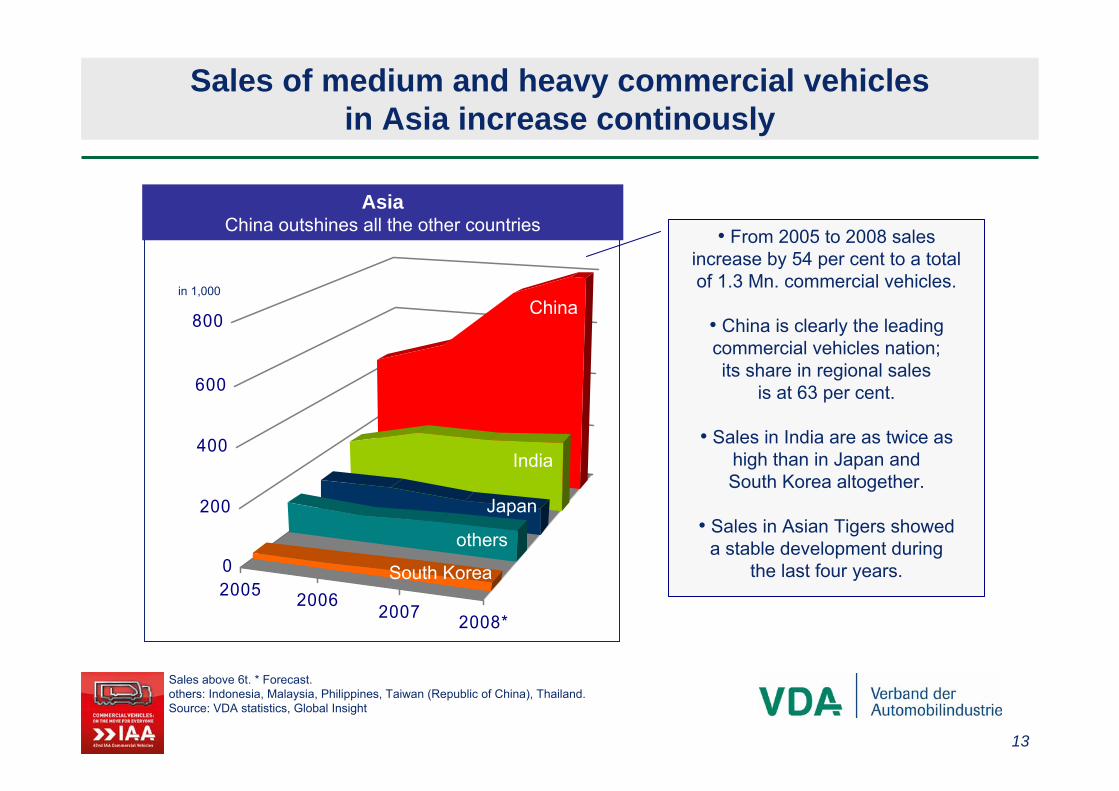
Sales of medium and heavy commercial vehiclesin Asia increase continously
Sales above 6t. * Forecast.others: Indonesia, Malaysia, Philippines, Taiwan (Republic of China), Thailand.Source: VDA statistics, Global Insight
Japan
South Korea
India
Chinain 1,000
others
AsiaChina outshines all the other countries • From 2005 to 2008 sales
increase by 54 per cent to a total of 1.3 Mn. commercial vehicles.
• China is clearly the leadingcommercial vehicles nation; its share in regional sales
is at 63 per cent.
• Sales in India are as twice as high than in Japan and South Korea altogether.
• Sales in Asian Tigers showeda stable development during
the last four years.

14
Source: Global Insight, VDA statistics
85 8377
112106 109 111
9592
0
20
40
60
80
100
120
'00 '01 '02 '03 '04 '05 '06 '07 '08For.
in 1
,000
Sales of Commercial
Vehiclesabove 6t
Japan: Sales of commercial vehiclesabove 6t with slight rebound
Ø 97k
Sales decrease in 2007 after pre-buy due to
new emission standard; in 2008 sales will increase slightly.
-17% +3%
Hino30.9%
Isuzu28.7%
others1.8%Nissan
Diesel15.4%
Mitsubishi Fuso
23.2%
Market share CV sales above 6t

15
Truck sales above 6 t.Source: VDA statistics, J.D. Power
BRICs: Commercial vehicle marketswith strong potential
ChinaSales 2008: 820k (+13%)
- 67% heavy trucks- Local production
meets demand- Population: 1.3 Mn.
IndiaSales 2008: 250k (+6%)
- 50% heavy trucks- Local production
meets demand- Population: 1.2 Mn.
BrazilSales 2008: 125k (+24%)
- 62% heavy trucks- net exporter
- Population: 192 Mn.
152174
236250 724
820
101
125
2007 2008
2007 2008
2007 20082007 2008
+24%
+14%
+6%+13%
RussiaSales 2008: 174k (+14%)
- 70% heavy trucks- net importer
- Population: 141 Mn.
16
4,456
26,308
37,317
60,314
65,065
73,908
32,972
365
1,13632,679
0 20,000 40,000 60,000 80,000
Beiqi Foton
Shaanxi
CNHTC
Dongfeng
FAW
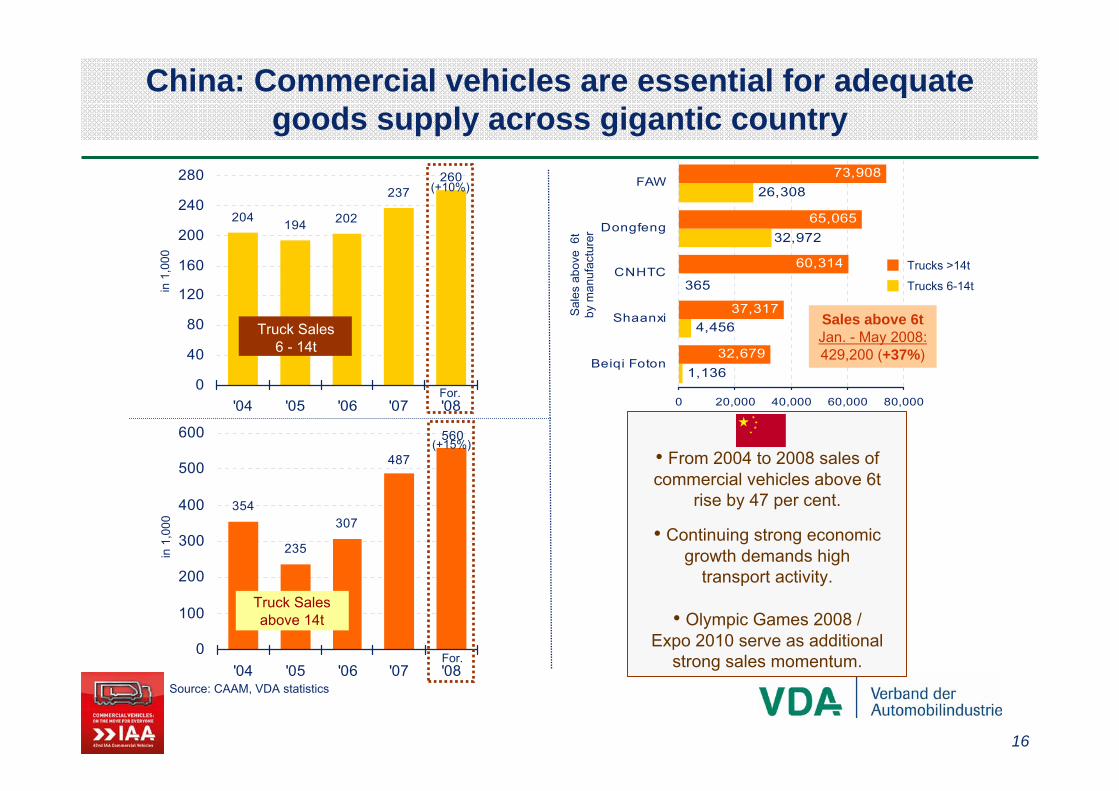
204 194 202
237260
0
40
80
120
160
200
240
280
'04 '05 '06 '07 '08
Truck Sales6 - 14t
354
235
307
487
560
0
100
200
300
400
500
600
'04 '05 '06 '07 '08
China: Commercial vehicles are essential for adequategoods supply across gigantic country
Truck Sales above 14t
Source: CAAM, VDA statistics
in 1
,000
in 1
,000
For.
For.
Trucks >14t
Trucks 6-14t
Sale
s ab
ove
6tby
man
ufac
ture
r
(+10%)
(+15%)
Sales above 6tJan. - May 2008:429,200 (+37%)
• From 2004 to 2008 sales of commercial vehicles above 6t
rise by 47 per cent.
• Continuing strong economicgrowth demands high
transport activity.
• Olympic Games 2008 / Expo 2010 serve as additional
strong sales momentum.
17
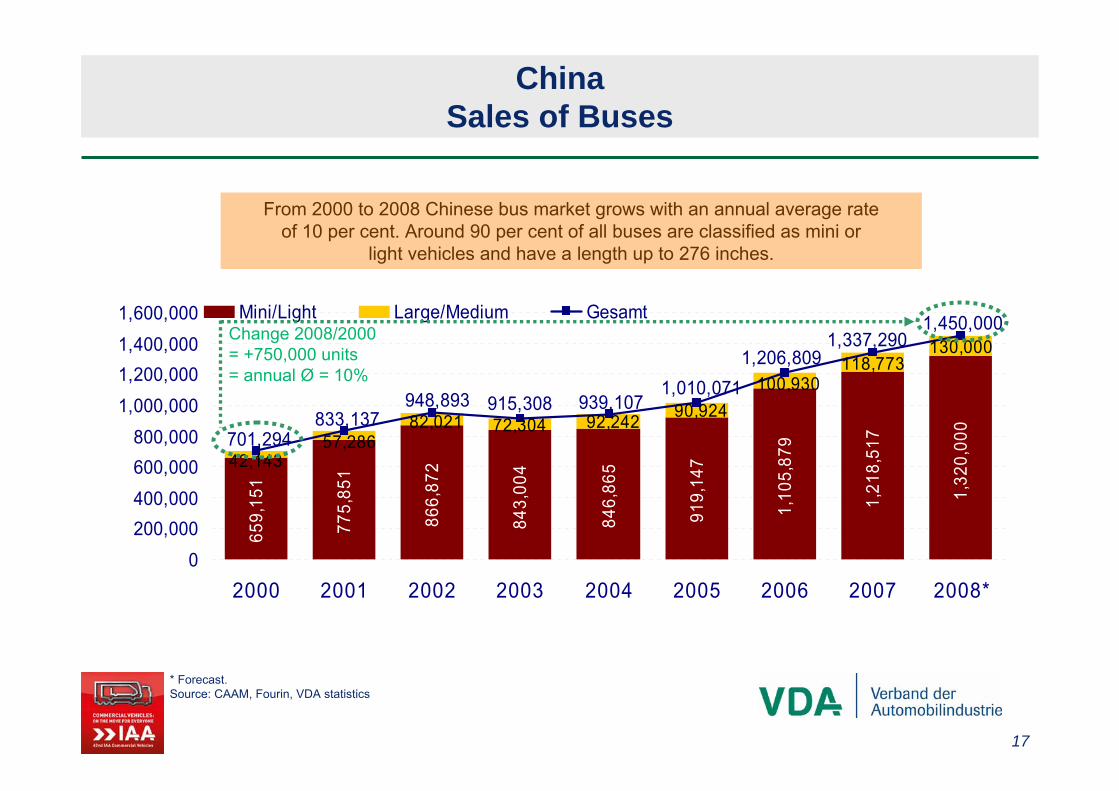
659,
151
775,
851
866,
872
843,
004
846,
865
919,
147
1,10
5,87
9
1,21
8,51
7
1,32
0,00
0
130,000118,773
100,93090,924
42,14357,286
82,021 72,304 92,242
1,010,071939,107915,308948,893
833,137701,294
1,206,8091,337,290
1,450,000
0200,000400,000600,000800,000
1,000,0001,200,0001,400,0001,600,000
2000 2001 2002 2003 2004 2005 2006 2007 2008*
Mini/Light Large/Medium GesamtChange 2008/2000 = +750,000 units= annual Ø = 10%
From 2000 to 2008 Chinese bus market grows with an annual average rate of 10 per cent. Around 90 per cent of all buses are classified as mini or
light vehicles and have a length up to 276 inches.
* Forecast.Source: CAAM, Fourin, VDA statistics
ChinaSales of Buses

18
Production of heavy commercial vehiclesin China is skyrocketing
Trucks above 14t, Buses above 394 ins. length.Source: Fourin, CAAM, VDA statistics
41 5590
169
270 281
379
254
335
531
700
0
100
200
300
400
500
600
700
800
'98 '99 '00 '01 '02 '03 '04 '05 '06 '07 '08For.
in 1
,000
(+59%)
Production of Heavy Commercial Vehicles
1998 - 2008
(+32%)
(+32%) • Production of heavycommercial vehicles in
China recently moves withan average annual growth
rate of 40 per cent.
• In 2007 Euro III was introduced. Euro IV will be established in 2010 and should accelerate
demand and productionof new and more efficient
commercials.
Change 2008/2005
= annual Ø 40%

19
* Forecast.Source: CAAM, SIAM, VDA statistics
29,636
78,313
148,591
500,000
221,022
361,624
64,00055,27748,20638,34725,977
16,8810
60,000
120,000
180,000
240,000
300,000
360,000
420,000
480,000
540,000
'03 '04 '05 '06 '07 '08*
China India
AsiaExport of Commercial Vehicles
Export of Commercial Vehicles
2003 - 2008
Export quota: 13%
Export quota: 11%
China‘s exports areeight times high as
India‘s exports, whereas exportquota is nearly
equal.
20
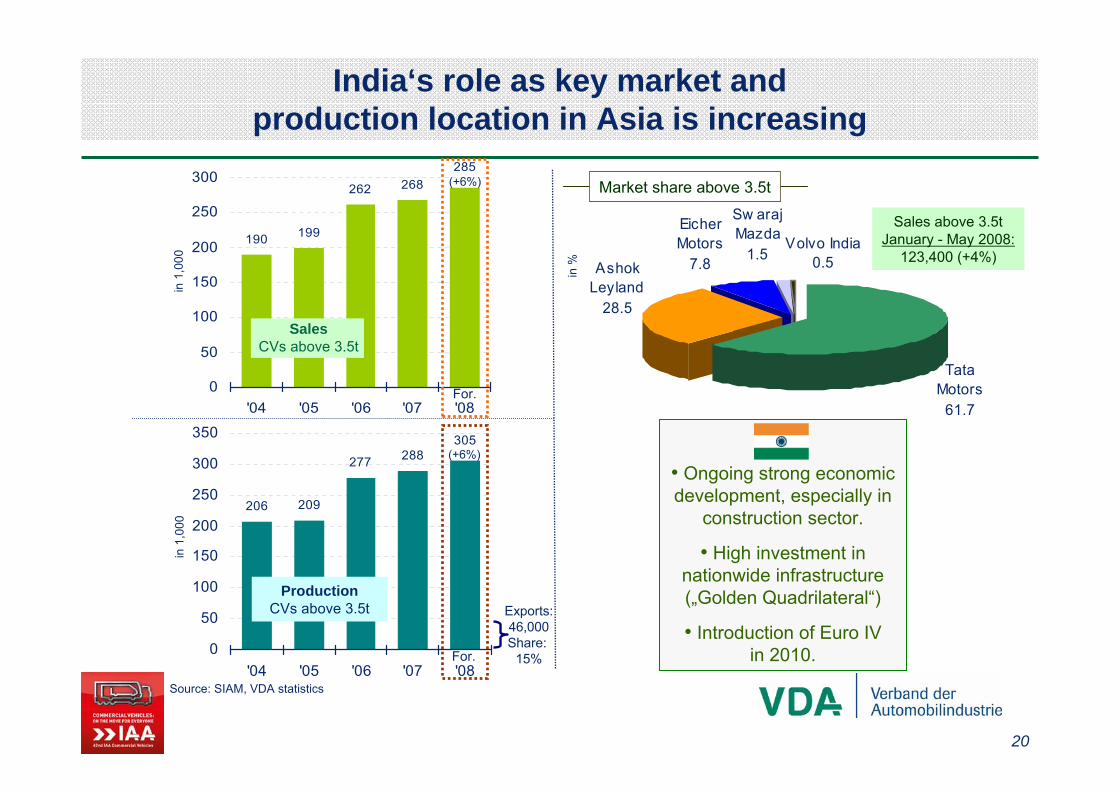
Exports:46,000Share:
15%
Tata Motors
61.7
Ashok Leyland
28.5
Sw araj Mazda
1.5Volvo India
0.5
Eicher Motors
7.8
190 199
262 268285
0
50
100
150
200
250
300
'04 '05 '06 '07 '08
SalesCVs above 3.5t
206 209
277 288305
0
50
100
150
200
250
300
350
'04 '05 '06 '07 '08
India‘s role as key market and production location in Asia is increasing
ProductionCVs above 3.5t
Source: SIAM, VDA statistics
in 1
,000
in 1
,000
Sales above 3.5tJanuary - May 2008:
123,400 (+4%)
in %
For.
For.
(+6%)
(+6%)
• Ongoing strong economicdevelopment, especially in
construction sector.
• High investment in nationwide infrastructure(„Golden Quadrilateral“)
• Introduction of Euro IV in 2010.
Market share above 3.5t

21
19,7
80
24,7
13
25,8
25
27,8
13
28,9
26
37,3
37
46,0
00
26,1
65
25,6
73
23,0
87
20,9
88
21,2
43
27,0
59 28,0
00
41,02345,701 48,912
53,486 55,091
64,396
74,000
0
10,000
20,000
30,000
40,000
50,000
60,000
70,000
80,000
2002 2003 2004 2005 2006 2007 2008*
bis 3,5 t ab 3,5 t GesamtChange 2008/2002= annual Ø = 10%
Sales of buses in India expanded quite well during the last years. Buses as an important means of transportation clearly benefit from the extension
and advancement of nationwide infrastructure.
* Forecast.Source: SIAM, VDA statistics
IndiaSales of Buses

22
IndiaProduction of Commercial Vehicles
Source: SIAM, VDA statistics
57 57 63 57 80 100 130169
208250
295
72111 92 92
117154
206209
277
288
305
0
100
200
300
400
500
600
'98 '99 '00 '01 '02 '03 '04 '05 '06 '07 '08
CVs above 3.5tCVs up to 3.5t
For.
in 1
,000
(+4%)
Production of Commercial Vehicles
1998 - 2008
(+33%)
(+6%)
• Since 2002 productionof light and heavy
commercial vehicles has increased steadily.
• In 2010 Euro IV will beintroduced and shouldprovide production with
further impetus.
• Investment of foreignmanufacturers like Volvo,
MAN or Daimler are a clear evidence for India‘srising attractiveness as
production location.
(+23%)(+20%)
(+18%)

23
Manufacturers strengthen their position in BRICs
MAN Force Trucks, a jointventure set up by MAN and
Force Motors, recently startedserial production of heavy
commercial vehicles in India.
Daimler and Hero Group start Indian joint venture Daimler Daimler Hero Commercial
Vehicles. First vehicles shall beassembled in 2010.
Volvo buys stake in Indian manufacturer Eicher Motors.
Both companies intend to set up a joint venture for
common commercialvehicles production.
Daimler is checkingpossibilities for an assembly plant in
Russia. Scania intendsto build up a plant withan annual capacity of
10,000 units.
MAN intends to enterBrazilian market in
cooperation with VW, which has considerablemarket share in Brazil.
MAN sees high potential in closer cooperation, especially regarding
components and engines.
Volvo is building up a plant in Russia with an annualcapacity of 15,000 trucks,
completion in 2009.
MAN produces trucksclose to Krakow (Poland) since 2007. This facilityalso delivers to Russia
and other CIS countries.

24
* Forecast.Source: VDA statistics, Global Insight
265
186
296
140146
117
100
125
150
175
200
225
250
275
300
'03 '04 '05 '06 '07 '08*
Eastern EuropeSales of Commercial Vehicles above 6t
Sales of Commercial Vehicles above 6t
2003 - 2008
Change 2008/2003 = +179,000 units
= annual Ø = 20%
in 1,000
10
152
73
24
8
11
24
77
174
8
0 50 100 150 200
Belarus
Ukraine
Turkey
New EU
Russ ia 20082007
Russia is heavyweightchampion in sales
of commercialvehicles above 6t in Eastern Europe.
in 1
,000

25
59 6371 71
86
111
125
0
20
40
60
80
100
120
'02 '03 '04 '05 '06 '07 '08
67 7082 83
103
152
174
0
30
60
90
120
150
180
'02 '03 '04 '05 '06 '07 '08 3.8%3.3%
3.3%3.2%
61.1%
1.6%5.9%
10.0%
17.4%
26.2%22.1%
3.2%
Source: VDA statistics, Global Insight
in 1
,000
in 1
,000
For.
Production CVs >6t
SalesCVs >6t
For.
• From 2002 to 2008 sales of commercial vehicles above 6t
rise by 160 per cent.
• Domestic manufacturers still play an important role in Russian
commercial vehicle business.
• Sales clearly exceedproduction.
KAMAZ
GAZ
MAZUralAz
ZIL
others
MANHyundai
CNHTC
ScaniaVolvo
Market share > 6 t(+14%)
(+12%)
RussiaProduction and Sales of Commercial Vehicles above 6t

26
7.2%
4.8%
4.5%
3.3%60.8%
3.1%10.5%
21.6%
25.6%16.1%
3.3%
1.4
0.8
2.0
3.43.7
4.64.8
0
1
2
3
4
5
'02 '03 '04 '05 '06 '07 '08
4.23.1
7.78.8
10.610.1
10.5
0
2
4
6
8
10
12
'02 '03 '04 '05 '06 '07 '08
in 1
,000
in 1
,000
Production CVs >6t
SalesCVs >6t
• Sales of commercial vehiclesabove 6t clearly benefit fromincreasing economic activity,
especially in industrial production.
• High transport activity in goodsexchange with most important
trade partner Russia.
• Local manufacturers gain a market share of 61 per cent.
UkraineProduction and Sales of Commercial Vehicles above 6t
Source: VDA statistics, Global Insight
MAZ
KAMAZ
KRAZ
ZIL
TATA
Dongfeng
Daimler
FAW
Volvo
others
(+4%)
(+4%)Market share > 6 t
For.
For.

27
* Forecast. Including pre-assembled vehicles.Source: ASM Holding, UkrAutoprom, VDA statistics
19,549
22,50824,267
28,000
24,389
26,760
6,2005,597
3,986
6,1235,536
2,484
0
5,000
10,000
15,000
20,000
25,000
30,000
'03 '04 '05 '06 '07 '08*
Russia
Ukraine
Russia and UkraineExport of Commercial Vehicles
Export of Commercial Vehicles
2003 - 2008• Russian exports aremore than four timeshigh than exports of
the Ukraine.
• Around 85 per centof all Russian exportsgoes to CIS countries.
• Russian export valuefor commercial
vehicles amounted to 560 Mn. Euro in 2007.
• The Ukraine deliversmainly to Russia
and Central Asiancountries.

28
2,210
3,306
6,935
142
240
379426 442
465 500
88134
203233
266
315
368
0
100
200
300
400
500
'02 '03 '04 '05 '06 '07 '08*
Source: OSD, VDA statistics
Production
Exports
TurkeyProduction, Sales and Exports of Commercial Vehicles
Productionand Exports
of CVs
Productionof Heavy Trucks
(January - May 2008)
in 1
,000
17
36
4853 52
47 47
0
10
20
30
40
50
60
'02 '03 '04 '05 '06 '07 '08*
Sales of CVs above
3.5t
in 1
,000
Ø 43k
For.
• In 2007 sales of commercial vehiclesslipped due to weaker economic
development and higher interest rates.
• For this year a stable developmentis expected.
• Turkish production and exports of commercial vehicles still rising.
Mercedes is leading manufacturerin heavy truck business.
Truc
ks a
bove
12t Mercedes
Ford
B.M.C.
(+1%)
For.
Export-quota:74%
29
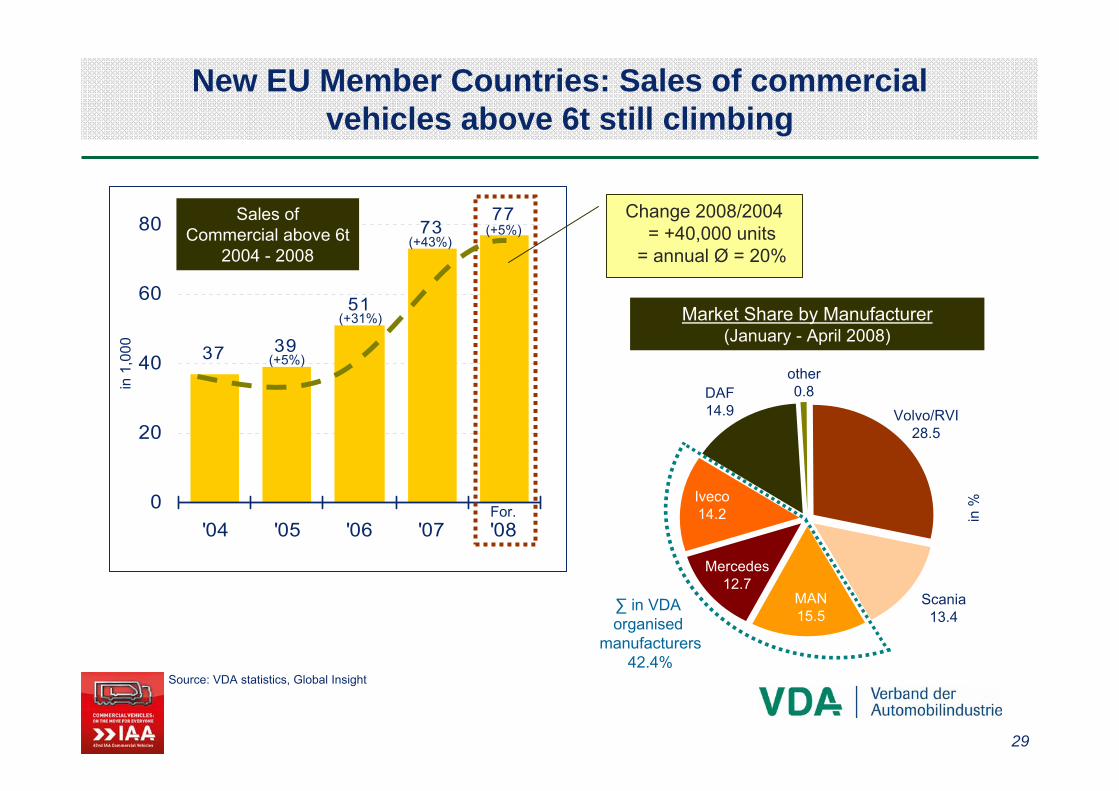
37 39
51
7377
0
20
40
60
80
'04 '05 '06 '07 '08
New EU Member Countries: Sales of commercialvehicles above 6t still climbing
For.
Source: VDA statistics, Global Insight
in 1
,000
Sales ofCommercial above 6t
2004 - 2008
Market Share by Manufacturer(January - April 2008)
∑ in VDA organised
manufacturers42.4%
(+5%)
(+31%)
(+43%)(+5%)
Change 2008/2004 = +40,000 units
= annual Ø = 20%
in %
Volvo/RVI28.5
Scania13.4
MAN15.5
Mercedes12.7
Iveco14.2
DAF14.9
other0.8

30
13.2%
28.2%
14.9% 1.0%
42.7%
8.2%
16.4%
18.1%
11.4%
26.0%
14.4%1.9%
46.3%
10.3%
16.9%
19.1%
294 291311
333 346 348 354
0
50
100
150
200
250
300
350
400
'02 '03 '04 '05 '06 '07 '08
Sales of CVs >6t
213 216233
252 263 270 277
0
50
100
150
200
250
300
'02 '03 '04 '05 '06 '07 '08
Western Europe: Slight increase in sales of commercial vehicles above 6t in 2008
Sales of CVs >16t
Source: VDA statistics
in 1
,000
in 1
,000
Market share above 6t(January - May 2008)
Mercedes
MAN
Iveco
DAFothers
Volvo/RVI
Scania
Mercedes
MAN
Iveco
DAF others
Volvo/RVI
Scania
For. For.
(+2%)(+3%)
Market share above 16t(January - May 2008)
31
1.2
-18.7
-24.2
5.6
5.6
9.0
0.9
-2.6
-30 -20 -10 0 10
Total
Belgium
Portugal
UK
Spain
Italy
France
Germany
5.3
21.7
-7.0
14.6
26.4
-3.8
39.3
11.7
-10 0 10 20 30 40 50
Total
Belgium
Portugal
UK
Spain
Italy
France
Germany
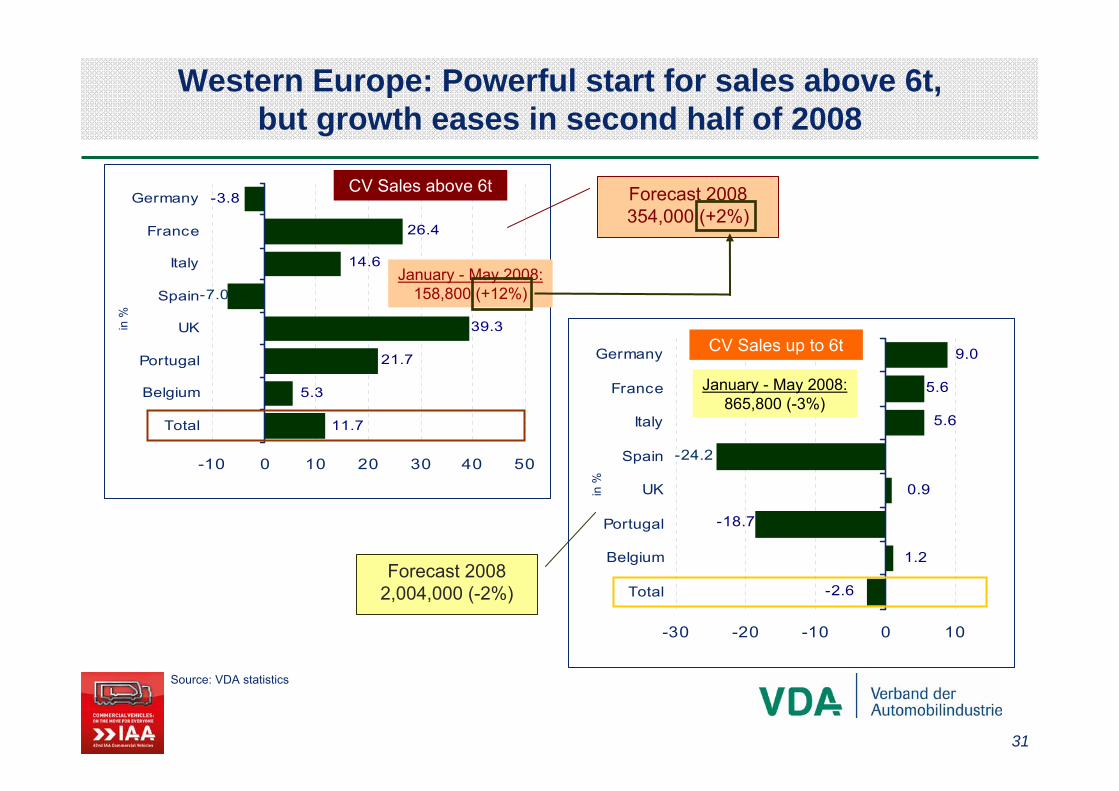
Western Europe: Powerful start for sales above 6t, but growth eases in second half of 2008
January - May 2008:158,800 (+12%)
Source: VDA statistics
in %
CV Sales above 6t
in %
January - May 2008:865,800 (-3%)
CV Sales up to 6t
Forecast 2008 354,000 (+2%)
Forecast 2008 2,004,000 (-2%)

32
20.8 16.7 20.1 20.0
34.8 34.8 32.4 31.0
4.6 5.3 6.6 5.7
31.836.5 34.3 36.5
2.01.81.92.4
4.84.84.85.6
0
10
20
30
40
50
60
70
80
90
100
1997 2002 2007 -05/2008
Large PickupCompact VanFullsize VanHeavy VanMidsize VanSmall Van/ Micro Van/ Small Pickup
Western EuropeSales of Commercial Vehicles up to 6t by Segment
* Forecast.Source: VDA statistics
in %
• From 1997 to 2007 sales up to 6t increasedby 36 per cent to over
2 Mn. units. In 2008 there will
be a slight decreasein light commercial
vehicle sales.
• Compact/Fullsize and Heavy Vans compile
a market shareof 38 per cent.
• 37 per cent of all sold vehicles up to 6t
are small vehiclesup to 2t.
19971,507,000
20021,834,000
20072,048,000
2008*2,004,000 (-2%)

33
26.3
25.2
39.3
5.4
5.3
-25.9
23.8
-24.3
2.1
-35 -25 -15 -5 5 15 25 35 45
B elgium
Sweden
Danemark
A ustria
Netherlands
P o rtugal
Spain
Italy
UK
France
Germany
Loser Winner
+12.7%
Sales of buses above 8t in Western Europe 2008 with the highest increase in the last four years
Sales of Busesabove 8t
Jan. - May 2008: 12,700 (+13%) 5.5 5.3 4.9 4.8 4.5 4.6 4.9 4.94.8
26.7 26.724.7 24.8
25.9 26.3 26.5 26.6 27.5
0
4
8
12
16
20
24
28
'00 '01 '02 '03 '04 '05 '06 '07 '08For.
Source: VDA statistics, Analyse & Prognose GmbH
Western Europe
Germany
in 1,000
(+3%)
(+2%)
Sales of Buses above 8t 2000 - 2008
180.4
68.7

II. Germany- Domestic Market- Exports- Production- Trailerindustry- Key Figures- Freight Transport Market - Technics and emissionen
page 54 page 59page 65 page 70 page 78
page 35
page 85

35
GermanyProduction and Sales of Commercial Vehicles
units ±% units ± %
Commercial vehiclesNew registrations *) 30,325 6.6 170,000 5 CV up to 6 t GVW 21,349 8 117,500 9 CV up to 2 t GVW 2,477 20 13,000 28 CV over 2 up to 3,5 t GVW 18,210 6.5 101,000 7 CV over 3,5 up to 6 t GVW 662 3,500 5 CV over 6 t GVW 8,530 2 49,600 -3 CV over 6 up to 16 t GVW 2,755 -1 14,900 -4 CV over 16 t GVW 5,775 4 34,700 -2 Buses 446 52 2,900 13
Export 39,380 23 206,300 18 CV up to 6 t GVW 24,720 30 129,100 20 CV over 6 t GVW 13,950 14 73,700 15 Buses 710 -11.1 3,600 -3
Produktion 48,390 10 278,500 13 CV up to 6 t GVW 29,100 13 168,100 15 CV over 6 t GVW 18,500 6 106,000 9 Buses 790 3 4,500 7
June 2008 up to June 2008
Source: VDA statistics, Kraftfahrt-Bundesamt

36
GermanySales of Commercial Vehicles by Owner Class
33,792
26,099
20,276
16,550
9,682
10,044
9,803
10,962
34,228
22,957
20,113
15,285
9,298
8,451
8,195
12,403
0 7,000 14,000 21,000 28,000 35,000
other public and privateservices
trade, repair of motor vehiclesand consumer goods
employees and non-activepersons
traffic, telecommunication
renting
manufacturing industry
construction
others
1-6 2007
1-6 2008
units
-1%
+14%
+1%
+8%
+4%
-12%
+20%
+20%
Sales up to June 2008
Source: VDA statistics, Kraftfahrt-Bundesamt
renting7%
manufacturing industry7%
construction8%
others7%
traffic, telecommunication12%
trade, repair of motor vehicles and consumer
goods19%
other public and private services
25%
employees and non-active persons
15%

37
7.98.3
8.88.4
9.2
7.87.7
6.4
0.90.70.70.90.91.11.3
1.7
0.0
2.0
4.0
6.0
8.0
10.0
2002 2003 2004 2005 2006 2007 1-6 2007 1-6 2008
cv over 10 to 12 t cv over 12 to 14 t
GermanySales of Commercial Vehicles over 10 to 14 t
shar
eof
cv
over
10 to
14
t in
sale
sof
cv
over
6 t
Source: VDA statistics, Kraftfahrt-Bundesamt

38
20,4
86
20,5
71
39,7
82
35,6
89
32,4
60
30,6
82
25,6
30
23,7
51
23,3
43
21,1
33
41,2
69
34,2
58
26,6
32
25,3
69
19,6
33
18,4
58
0
7,000
14,000
21,000
28,000
35,000
42,000
2002 2003 2004 2005 2006 2007 Jan.-Jun.2007
Jan.-Jun.2008
semitrailer tractors
semitrailers
GermanySales of Semitrailer Tractors and Semitrailers
units
+124%+67%
Source: VDA statistics, Kraftfahrt-Bundesamt
-0.4%+10.5%
39
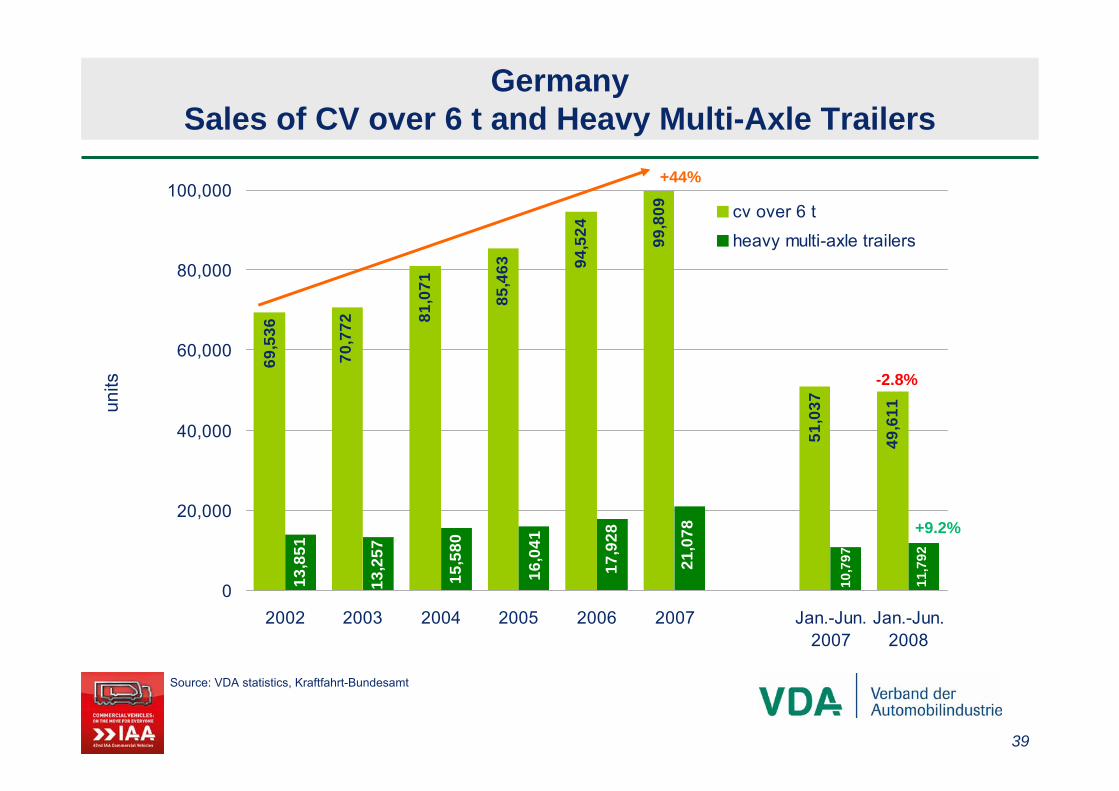
GermanySales of CV over 6 t and Heavy Multi-Axle Trailers
units
Source: VDA statistics, Kraftfahrt-Bundesamt
69,5
36
70,7
72 81,0
71
85,4
63 94,5
24 99,8
09
51,0
37
49,6
11
13,8
51
13,2
57
15,5
80
16,0
41
17,9
28
21,0
78
10,7
97
11,7
92
0
20,000
40,000
60,000
80,000
100,000
2002 2003 2004 2005 2006 2007 Jan.-Jun.2007
Jan.-Jun.2008
cv over 6 t
heavy multi-axle trailers
+44%
-2.8%
+9.2%

40
GermanyNew Registrations of Tippers
units
1,25
3
1,03
0
2,03
3
2,04
0
2,13
2
2,22
8
2,23
4
2,35
0
4,53
1
4,88
25,85
6
5,55
3
5,96
0 6,84
7
7,99
5
8,73
6
0
3,000
6,000
9,000
2002 2003 2004 2005 2006 2007 Jan.-Jun.07
Jan.-Jun.08
up to 6 t over 6 t
-7.2%
+21.7%
Source: VDA statistics, Kraftfahrt-Bundesamt

41
GermanySales of Heavy Trucks and Trailers with Tanker Body
units
Source: VDA statistics, Kraftfahrt-Bundesamt
307
162
54660
0
533
53357
0
577
545
553
551
720 740
752
856
856
1,17
1
1,13
1
0
200
400
600
800
1,000
1,200
2002 2003 2004 2005 2005 2006 2007 Jan.-Jun. 07
Jan.-Jun. 08
Trucks over 6 t with tanker body (haz. goods)
Trailers over 6 t with tanker body (haz. goods)
-0.4%
-47.2%

42
13,8
39 15,6
65
18,3
48
18,9
46
17,7
33
17,8
02 19,3
63 20,6
06
21,2
36
19,6
58
12,9
72 14,7
36
0
5,000
10,000
15,000
20,000
25,000
1998
1999
2000
2001
2002
2003
2004
2005
2006
2007
1-6
2007
1-6
2008
units
26.0
38
25.6
58
26.2
00
24.5
85
22.6
73
22.6
04
21.5
72
21.6
72
22.4
21
19.0
84
12.0
03
12.0
75
0
5.000
10.000
15.000
20.000
25.000
30.000
1998
1999
2000
2001
2002
2003
2004
2005
2006
2007
1-6
2007
1-6
2008
Motor Caravans Caravans
+0,6%
+13.6%
GermanyNew Registrations of Motor Caravans and Caravans
Source: VDA statistics, Kraftfahrt-Bundesamt
43
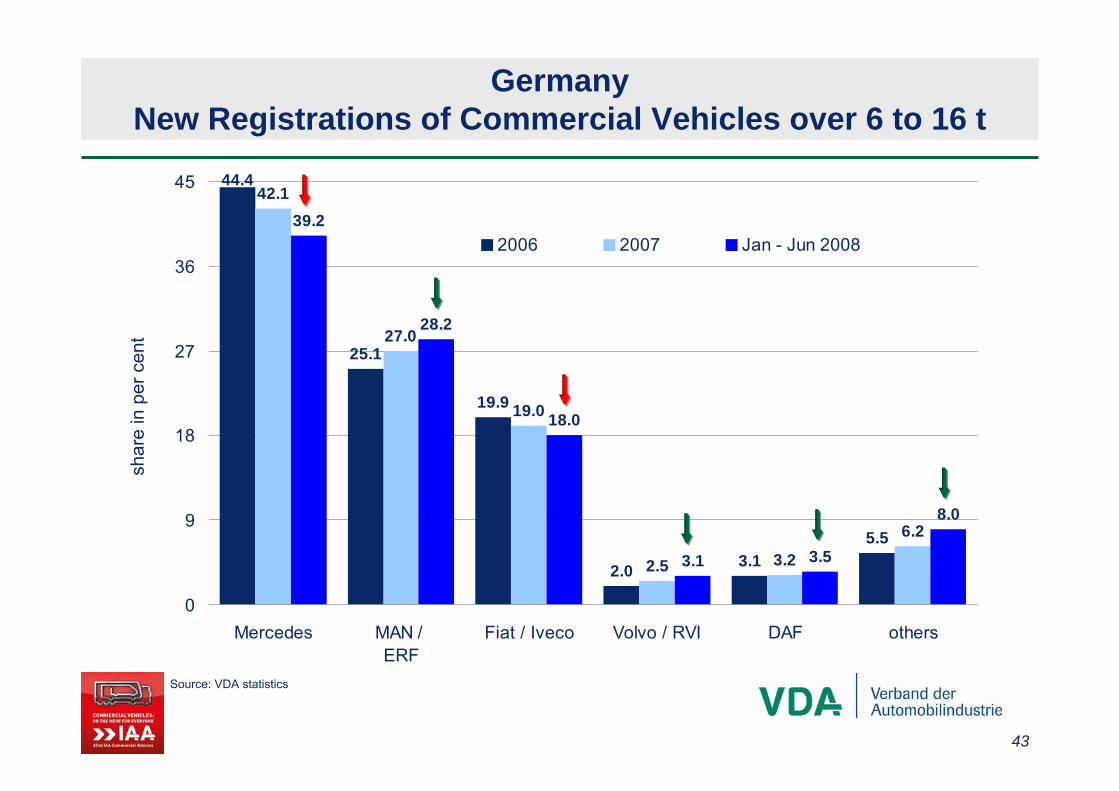
44.4
25.1
19.9
2.0 3.15.5
42.1
27.0
19.0
2.5 3.2
6.2
39.2
28.2
18.0
3.1 3.5
8.0
0
9
18
27
36
45
Mercedes MAN / ERF
Fiat / Iveco Volvo / RVI DAF others
2006 2007 Jan - Jun 2008
GermanyNew Registrations of Commercial Vehicles over 6 to 16 t
shar
ein
per
cen
t
Source: VDA statistics

44
GermanyNew Registrations of Commercial Vehicles over 16 t
shar
ein
per
cen
t
Source: VDA statistics
38.5
27.3
9.6 9.07.2 6.5
1.9
24.9
10.8 9.8
7.1 7.1
1.8
32.8
27.3
12.510.5
7.7 6.8
2.4
38.5
0
10
20
30
40
Mercedes MAN / ERF Volvo / RVI DAF Scania Fiat / Iveco others
2006 2007 Jan - Jun 2008

45
21.5
8.27.3
8.5
6.4 6.1
25.4
8.6
6.17.6 8.3
5.7
24.0
5.9
7.99.2
3.02.7
11.8
27.5
22.0
2.8
13.5
21.0
12.8
5.5
10.7
0
5
10
15
20
25
30
VW-Group Mercedes Fiat / Iveco Ford Opel Renault PSA jap. brands others
2006 2007 Jan - Jun 2008
GermanyNew Registrations of Commercial Vehicles up to 6 t
shar
ein
per
cen
t
Source: VDA statistics

46
774,
000
888,
000
883,
000
965,
300
906,
600931,
900
926,
000
914,
900
905,
400
899,
500
906,
700
908,
400
896,
000
710,000
740,000
770,000
800,000
830,000
860,000
890,000
920,000
950,000
980,000
1996 1997 1998 1999 2000 2001 2002 2003 2004 2005 2006 2007 2008
GermanyParc* of CV over 6 t (excl. buses)
*reference date: 1.1.; 2008 without temporary unregistered vehicles
units
Exports of used CV brings a low level of the parc of heavy trucks
Source: VDA statistics

47
6,4
7,9
8,5 8,4
6,7 6,9
7,6
8,8
9,7
8,3
7,1
7,9
4,0
5,0
6,0
7,0
8,0
9,0
10,0
11,0
bis 3,5t 3,5t-6t 6t-12t 12t-16 >16t total
01.07.1998 01.01.2003 01.01.2008 *)
GermanyAverage age of Commercial Vehicle Parc
In y
ears
In the last 10 years the average age of commercial vehicle parc is increased by one year
*) incl. teporary unregistered vehiclesSource: KBA, VDA statistics.

48
11,344
1,462
6,555
2,852
3,798
848
850
0
5,000
10,000
15,000
20,000
25,000
Western Europe Eastern Europe
buses
semitrailertractors
cv over 5 t
cv up to 5 t
5,471 (-1%)
22,547 (+1%)
(+6%)
(+2%)
(-7%)
(-13%)
(-
(+31%)(-19%)
(+7%) 91.4
23.0
196.2
90.4
128.6
34.6
46.6
25.4
0
100
200
300
400
500
Western Europe Eastern Europe
173.5 (+8%)
462.9 (+10%)
(+19%)
(+16%)
(+5%)
(-11%)
(-5%)
(+17%)
(-9%)(+14%)
GermanyExports of Used Commercial Vehicles up to April 2008
units
Total Exports:up to 5 t: 14,800 (+6%)over 5 t: 14,800 (+4%)Semitrailer tractors: 8,100 (+3%)Buses: 1,540 (-26%)Total: 39,200 (+3%)
Exports units
in million
euro
Export value
Export value per unit:W. Europe: 31,700 € (+9%)E. Europe: 20,500 € (+9%)Asia: 12,100 € (+26%)Africa: 8,600 € (+18%)
Source: VDA statistics
49
0
14,600
29,200
43,800
58,400
73,000
Jan Feb Mrch Apr May Jun Jul Aug Sep Oct Nov Dec
2006 2007 2008
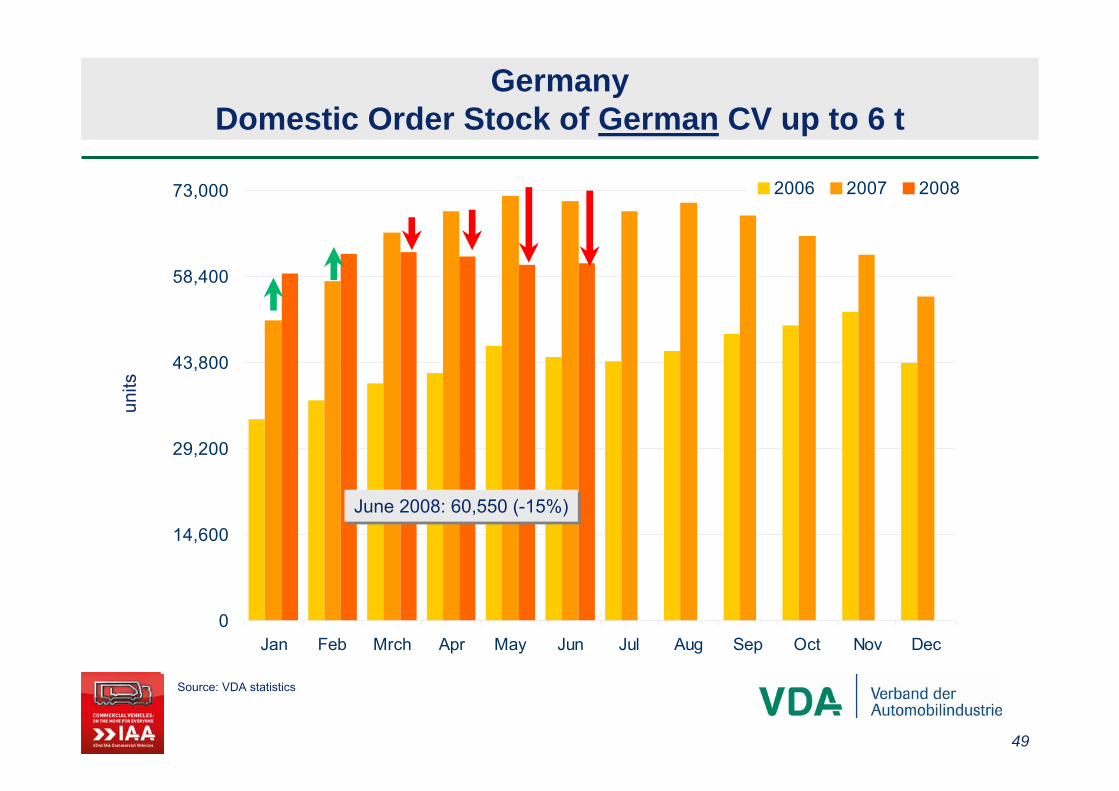
GermanyDomestic Order Stock of German CV up to 6 t
units
June 2008: 60,550 (-15%)June 2008: 60,550 (-15%)
Source: VDA statistics
50
0
10,800
21,600
32,400
43,200
54,000
Jan Feb Mrch Apr May Jun Jul Aug Sep Oct Nov Dec
2006 2007 2008
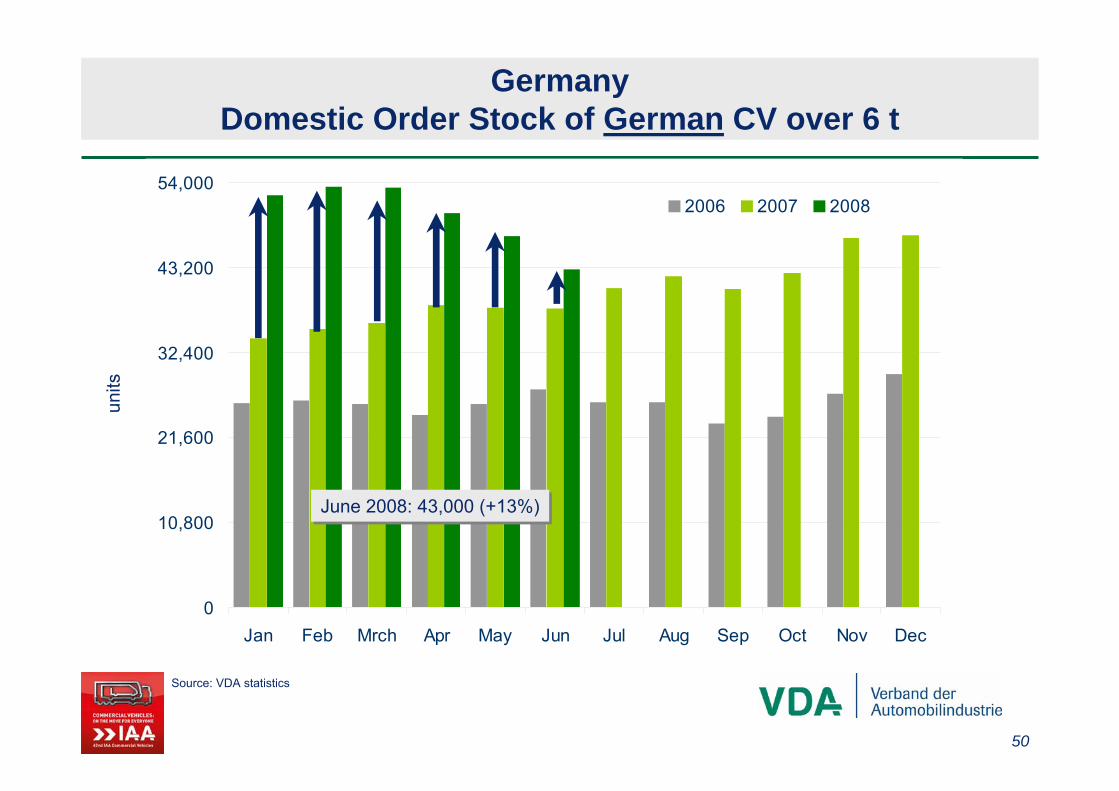
GermanyDomestic Order Stock of German CV over 6 t
units
June 2008: 43,000 (+13%)June 2008: 43,000 (+13%)
Source: VDA statistics

51
4,000
7,000
10,000
13,000
16,000
19,000
22,000
2006 2007 2008
units
Nfz bis 6 t
Nfz über 6 t
2008: 235 Tsd. (+3%)
2008: 95-98 Tsd. (-5% /-2%)
Jan.-Jun. 2008: +9%
2007: +12%
Jan.-Jun. 2008: -3%2007: +6%
Prognoses
Trends and seasonally-adjusted monthly figures
Source: VDA statistics
The elevated stock of orders of commercial vehiclessuggests a high new registration level for 2008

52
0
1,000
2,000
3,000
4,000
5,000
6,000
7,000
2004 2005 2006 2007 2008
Trendkomponente und saisonbereinigte Monatszahlen
Jan.-Jun. 2008: -2%
Jan.-Jun. 2008: -4%
units
2007: 68 Tsd. (+9%)
2007: 31 Tsd. (-1%)
2008: 65-68 Tsd. (-5% / -1%)
2008: 30 Tsd. (-4%)
Quelle: VDA Statistik, Kraftfahrt-Bundesamt
Prognoses
GermanySales of Commercial Vehicles over 6 t
cv over 16 t
cv over 6 to 16 t

53
GermanySales of Commercial Vehicles
in E
inhe
iten
Quelle: VDA-Statistiken, Kraftfahrt-Bundesamt
0
50.000
100.000
150.000
200.000
250.000
1993 1994 1995 1996 1997 1998 1999 2000 2001 2002 2003 2004 2005 2006 2007 2008
Nfz bis 6 t Nfz über 6 t
In the last 15 years sales of lightcommercial vehicle increased by 31%
In the last 15 years sales of lightcommercial vehicle increased by 31%
In the last 15 years sales of heavy commercial vehicles increased by38% (34%)In the last 15 years sales of heavy commercial vehicles increased by38% (34%)
182,500
95,000bis
98,00070,800
235,000

54
15.676
10.821
10.640
10.168
9.101
6.600
5.635
5.320
3.655
3.640
1.896
1.192
0 2.000 4.000 6.000 8.000 10.000 12.000 14.000 16.000 18.000
Frankreich
OPEC
Spanien
Großbritannien
Italien
Polen
Russland
Südafrika
Tschechien
Rumänien
China
Südkorea
German Exports of CV > 6 t into selected countries, 2007 and Jan.-May 2008
Exp
orts
uni
ts(C
hang
e ag
ains
tpre
viou
sye
arin
bra
cket
s)
Jan.-June 08: 73.700 (+15%)
Jan.-May 08 vs. previous year
(-5%)
(+31%)
(+3%)
(-12%)
(-22%)
(+52%)
(+121%)
(+33%)
(+29%)
(+116%)
(+39%)
(+139%) -2%
-5%
+19%
-1%
+6%
+76%
±0%
+29%
+23%
+22%
-2%
+6%
Russia
Romania
Source: VDA statistics
South Korea
Czech Rep.
South Africa
Poland
Italy
UK
Spain
France

55
71
86 87
98 99 9688
105
116 118
132136
64
74
61%
78%
68%
66%
70%
67%67%
69%
61%61%
69%
65%
75%
0
20
40
60
80
100
120
140
1997 1998 1999 2000 2001 2002 2003 2004 2005 2006 2007 2008* Jan .- Jun.2007
Jan .- Jun.2008
60%
65%
70%
75%
80%Export Exportquote
Commercial Vehicles over 6t:Exports rising continually
*) ForecastSource: VDA statistics
thou
sand
s
shareof exports
in production
+15%
The German exports of CV over 6 t haveincreased by 85% in the last ten years..
exports export ratio

56
38.234
23.532
18.998
15.564
13.750
11.921
7.833
6.741
6.237
4.135
3.364
3.094
1.731
1.680
0 5.000 10.000 15.000 20.000 25.000 30.000 35.000 40.000
GroßbritannienFrankreich
SkandinavienNiederlande
SpanienItalienTürkei
USAPolen
MexikoRumänienRusslandSüdafrika
Israel
German Exports of CV up to 6 t into selected regions, 2007 und Jan.-May 2008
Jan.-June 08: 129.100 (+20%)
Jan.-May 08 vsprevious year
(+187%)
(+15%)
(+110%)
(+36%)
(+33% )
(+38%)
(+44%)
(+216%)(+23%)
(+26%)
(+43%)
(+27%)
(+19%)
(+18%)
Exp
orts
uni
ts(C
hang
e ag
ains
tpre
viou
sye
arin
bra
cket
s)
+54%
+21% +53%
+178% +3%
+55%
+20%
+1%
+23%
-1%
-5%
+3%
+13%
+21%
Source: VDA statistics
South Africa
Russia
RomaniaMexico
Poland
Turkey
Italy
Spain
Netherlands
Scandinavia
France
UK

57
141 147 143
160170
145152
145
163 164
222233
107
129
64%
68%
74% 74%
77%
69%
70% 71%
65% 66%
67%
70%69%
0
40
80
120
160
200
240
1997 1998 1999 2000 2001 2002 2003 2004 2005 2006 2007 2008 Jan .- Jun.2007
Jan .- Jun.2008
60%
65%
70%
75%
80%Export Exportquote
Commercial vehicles up to 6t: Dynamic export growth
thou
sand
s
shareof exports
in production
+20%
In the first six months of 2008 the export ratioattained a 77% peak.
*) ForecastSource: VDA statistics
exports export ratio

58
64,286
11,534 10,657
1,779
12,902
1,402
31,059
9,760 7,449
6,230
513
3,823
0%
10%
20%
30%
40%
50%
60%
70%
80%
90%
100%
EU-15 EU-12 Rest ofEurope
Asia America
trucks > 6 t:59,700 (+16%)
trucks < 6 t:104,300 (+18%)
(+18%)
(+5%) (+51%)
(+5%)
(+45%)
(+2%)
(+11%)(+61%) (+25%)
(+101%)
(+16%)
(+96%)
Exports of German Commercial Vehicles by Region,up to May 2008
shar
ein
per
cen
tex
ports
units
(cha
nge
in p
er c
ent)
Source: VDA statistics

59
GermanyDomestic Production of Commercial Vehicles by GWR
25,204
22,948 22,94622,334 9,037
5,051
6,106 6,6736,265 2,738
101,877139,719 146,814 165,711 75,688
138,969300,926235,383229,960
246,416
0%
10%
20%
30%
40%
50%
60%
70%
80%
90%
100%2001 2005 2006 2007 up to May 2008
cv up to 6 t cv over 6 up to 12 t cv over 12 up to 16 t cv over 16 t
shar
ein
per
cen
tun
its
(+13%)
(-18%)
(-5%)
cv up to 6 t138,969
62%
cv over 6 up to 12 t9,037
4%
cv over 12 up to 16 t2,738
1%
cv over 16 t75,688
33%
up to May 2008
+
-
cv up to 6 t246,416
65%
cv over 6 up to 12 t25,204
7%
cv over 12 up to 16 t5,051
1%
cv over 16 t101,877
27%
2001

60
Domestic Production close to capacity limit –Foreign Production booming
2629
0
5
10
15
20
25
30
Ausland: Mai Inland: Jun.
2007 2008
+13%+12%
30
19
05
101520253035
Ausland: Mai Inland: Jun.
2007 2008
+12%
+6%106
153
0
40
80
120
160
Ausland: Jan-Mai Inland: Jan-Jun.
2007 2008
+3%
+9%
Source: VDA statistics
130
168
0
30
60
90
120
150
180
Ausland: Jan-Mai Inland: Jan-Jun.
2007 2008
+17%
+15%
Production CV up to 6t
Production CV over 6t* **
*) without NAFTA: +25% **) without NAFTA: +5%
Foreign: Jan-May Domestic: Jan-Jun Foreign: May Domestic: Jun
Foreign: Jan-May Domestic: Jan-Jun Foreign: May Domestic: Jun

61
GermanyProduction of Buses
units
Source: VDA statistics
3,44
2
2,45
2
2,42
7
3,09
0
1,38
9
1,32
4
939
941
1,94
6
2,07
62,39
9
2,11
7
991
638
2,41
6
3,01
4
2,36
3
2,45
5
424
426
1,63
3
1,77
3
1,57
61,73
1
0
500
1,000
1,500
2,000
2,500
3,000
3,500
2002 2005 2006 2007 Jan.-Mai 2007 Jan.-Mai 2008
coachesurban public-transit busesoverland buseschassis
0%
+8%
+6%
0%
-5%
+55%
62
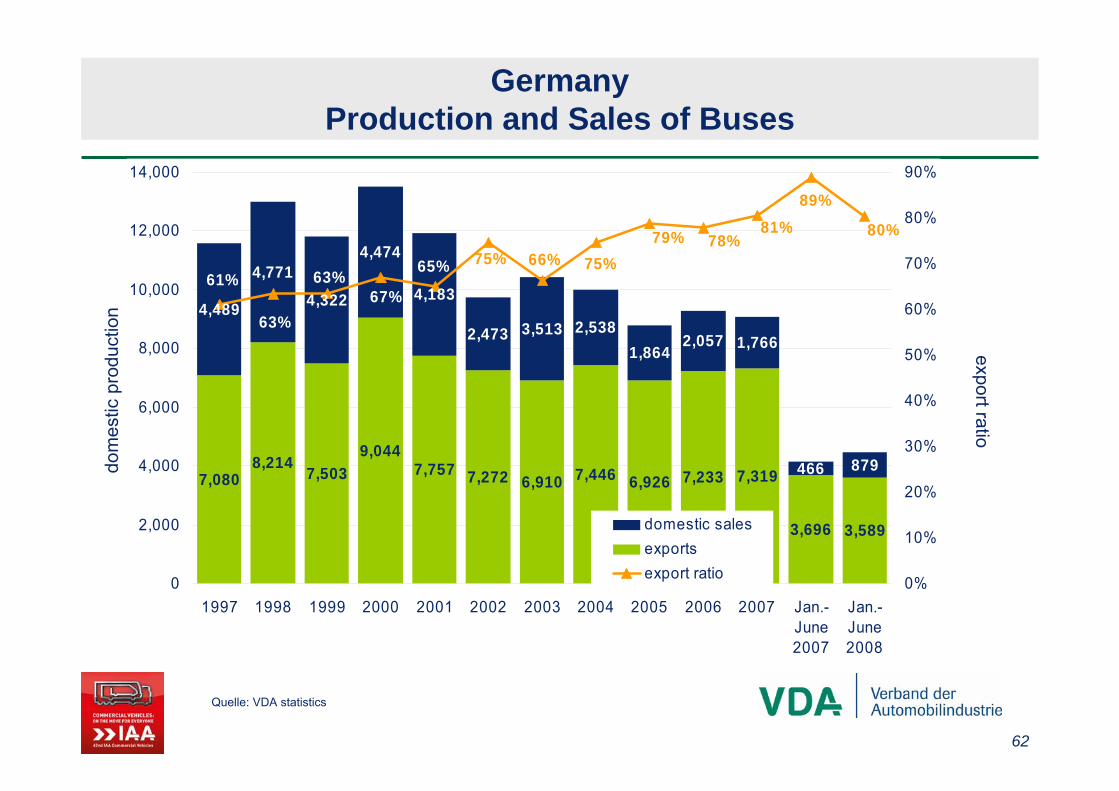
7,0808,214 7,503
9,0447,757 7,272 6,910 7,446 6,926 7,233 7,319
3,696 3,589
4,489
4,771
4,322
4,474
4,183
2,473 3,513 2,5381,864
2,057 1,766
466 879
80%
89%81%
78%79%75%66%75%65%
67%63%
63%
61%
0
2,000
4,000
6,000
8,000
10,000
12,000
14,000
1997 1998 1999 2000 2001 2002 2003 2004 2005 2006 2007 Jan.-June2007
Jan.-June2008
0%
10%
20%
30%
40%
50%
60%
70%
80%
90%
domestic salesexportsexport ratio
GermanyProduction and Sales of Buses
dom
estic
prod
uctio
nexportratio
Quelle: VDA statistics

63
29.2
0.6
46.3
0.0
21.7
16.4
10.6
25.36.9
12.5
10.6
5.0
47.1
34.2
6.1
14.1
3.5
5.4
5.7
0.7
2.2
0
2.2
0.4
0.6
0.1
5.6
0 10 20 30 40 50 60 70 80
USA
Turkey
Czech Rep.
Spain
Portugal
Poland
Austria
Mexico
Canada
Japan
Brazil
Argentina
Jan.-May 2008: 129,600 CV up to 6t (+17%)
Jan.-May 2008: 153,000 CV over 6t (+3%)
Jan.-May 2008 32,100 buses (+13%)
Production Abroad: 314,700 (+9%)
German CV Production abroad Jan.-May 08booming except in NAFTAin 1,000
Source: VDA statistics
Share in world-wide production of German groups:CV up to 6 t: 50%CV over 6 t: 63%Buses: 90%CV tot.: 58%
11,000 (+23%)
64,700 (+26%)
74,900 (+11%)
5,000 (-50%)
12,800 (-14%)
12,600 (+1%)
52,500 (+36%)
29,800 (+3%)
9,100 (+8%)
30,900 (-26%)
6,100 (+8523%)
3,500 (+158%)
Forecast CV 2008: 732,000 (+5%)
64
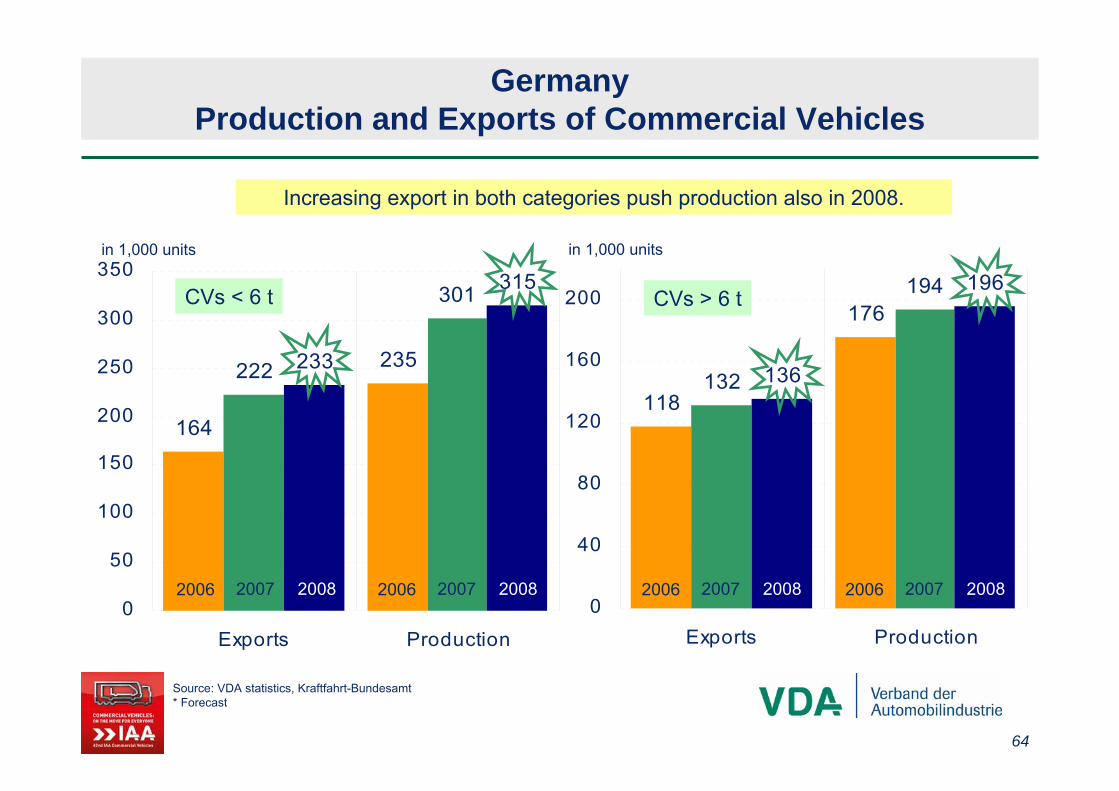
118
176
132
194
136
196
0
40
80
120
160
200
Exports Production
164
235222
301
233
315
0
50
100
150
200
250
300
350
Exports Production
GermanyProduction and Exports of Commercial Vehicles
Source: VDA statistics, Kraftfahrt-Bundesamt* Forecast
in 1,000 units
CVs < 6 t
Increasing export in both categories push production also in 2008.
CVs > 6 t
in 1,000 units
2006 2007 2008 2006 2007 2008 2006 2007 2008 2006 2007 2008

65
300
380
460
540
620
700
2005 2006 2007 2008
trend cycle and seasonally adjusted monthly figures *) change of statistical coverage from 2006 on
in M
io. E
uro
Turnover (domestic and abroad) in the trailer and body building industry*)
The trade surplus= balance of exports and importsincreased by 39% to 1.2 bn. €in the first four months of 2008.
domestic turnoverturnover abroad
Almost 60% of the turnover are export-
generated.
Almost 60% of the turnover are export-
generated.
1-4 2008:2,7 Bn. (+21%)
1-4 2008: 1,8 Bn. (+18%)
1-4 2008:Total: 4,5 Bn. (+19%)
Source: Statistisches Bundesamt
66
35,000
37,000
39,000
41,000
43,000
2005 2006 2007 2008
pers
ons
empl
oyed
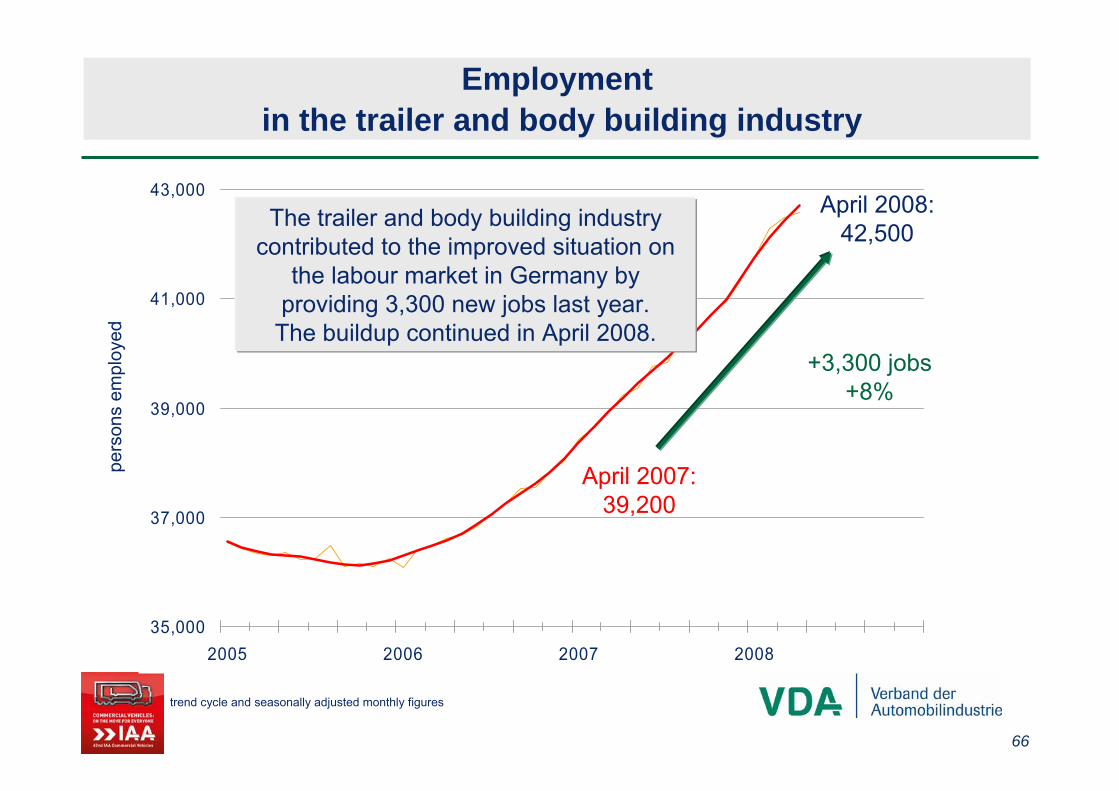
Employmentin the trailer and body building industry
trend cycle and seasonally adjusted monthly figures
April 2008:42,500The trailer and body building industry
contributed to the improved situation on the labour market in Germany by
providing 3,300 new jobs last year.The buildup continued in April 2008.
April 2007: 39,200
+3,300 jobs+8%

67
New Registrations of heavy Trailers >6 t vs. Ifo-Sentiment Indicator
1000
1100
1200
1300
1400
1500
1600
1700
1800
1900
2000
Jan98
Jan99
Jan00
Jan01
Jan02
Jan03
Jan04
Jan05
Jan06
Jan07
Jan08
80
85
90
95
100
105
110
115
Neuzulassungen Mehrachen-Anhänger >6t ifo Geschäftsklima
1000
1200
1400
1600
1800
2000
2200
2400
2600
2800
3000
3200
3400
3600
Jan98
Jan99
Jan00
Jan01
Jan02
Jan03
Jan04
Jan05
Jan06
Jan07
Jan08
80
85
90
95
100
105
110
115
Neuzulassungen Sattelanhänger ifo GeschäftsklimaSemi-TrailerHeavy Multi Axle Trailer >6 t
The slowdown of the business sentiment since summer of 2007 is not reflected in the new registrations of heavy trailers.
Quelle: VDA-Statistiken
New RegistrationsNew Registrations

68
80
100
120
140
160
180
200
220
240
2000 2001 2002 2003 2004 2005 2006 2007 2008
Auftragseingang Produktion
Production and New Orders in the manufacturer group II: Normalisation trend is under way
Since 2006 orders havebeen increasingstrongly while
production has beenlagging behind
because of fully utilisedcapacities in the
manufacturer group II!
The arithmetical stock of ordersin the trailer, body & container
industry ensures a high production growth in 2008
Source: Statistisches Bundesamt.

69
170246
252252
273280281
302316
342346
353355
382398
403432
467491
507522
538
0
100
200
300
400
500
600
1990
1992
1994
1996
1998
2000
2002
2004
2006
2008
2010
Transportation in GermanyTransport Performance in Million Ton Kilometer
Significant enlivement of road transport
2005: +1.1 %2006: +7.3 %2007: +8.0 %2008: +5.3 %2009-2011*: +3.1
* Forecast.
Quelle: BVU/BMVBS
Until the year 2025 long distance roadtransport should increase by 84 per cent, short-haul road transport should grow by
11 per cent. (Transport Performance)

70
10,0 13,3 15,319,3
24,0 24,528,2
33,56,0
5,34,8
5,9
6,5 6,8
9,0
12,0
5,04,4
7,5
9,2
11,5 12,1
13,8
16,5
0
10
20
30
40
50
60
1993 1995 1997 1999 2001 2003 2005 2007
CV parts industry
Trailers and bodies
CV manufacturers
21,0 23,0
27,6
34,4
42,0 43,4
51,0
62,0
GermanyTurnover of the German Commercial Vehicle Industry
in b
illio
neu
ro 2007/1993: +195%
2007/1993: +195%
Source: VDA statistics

71
GermanyEmployment Situation in the German CV Industry April 2008 *
In Germany 2.5 million jobs depend on the production,sales and use of commercial vehicles.
Source: VDA statistics
car manufacturers 538,80071.3%
CV industry217,00028.7%
CV parts industry 91,100
Trailers and bodies42,500
CV manufacturers 84,400
* Data in brackets: april 2008
(532,800) 207,700)(39,200)
(87,100)
(81,600)

72
191.880
269.798
220.447
128.852
173.719
139.510
177.320
237.513
167.797
295.238
390.433
267.007
0
50.000
100.000
150.000
200.000
250.000
300.000
350.000
400.000
Manufacturing industry Automotive industry total Commercial vehicle industry
1995 19992003 2007
Productivity trend in the German industry– Turnover per employee –
Turn
over
in e
uro
per e
mpl
oyee
Source: VDA statistics
2007/1995: +91%
2007/1995: +91%
2007
/1995
: +12
5%
2007
/1995
: +12
5%
2007
/1995:
+129%
2007
/1995:
+129%
The productivity in the German commercial vehicle industry rose above-average.

73
194.161
124.706
65.185
187.075
302.513
408.049
0
50.000
100.000
150.000
200.000
250.000
300.000
350.000
400.000
450.000
CV manufacturers Trailers and bodies CV parts industry
1995 1999 2003 2007
Produktivity rise in the German commercial vehicle industry– Turnover per employee –
Turn
over
in E
uro
per E
mpl
oyee
Source: VDA statistics
High productivity by manufacturers and strong increase concerning parts.
2007
/1993
: +11
0%
2007
/1993
: +11
0%
2007
/1993
: +14
3%
2007
/1993
: +14
3%
2007/1993: +187%
2007/1993: +187%

74
28,611
30,968
35,044
20,000
22,000
24,000
26,000
28,000
30,000
32,000
34,000
36,000
1997 2002 2007
Production value trend oftrucks and semi-trailer trucks in Germany
aver
age
valu
epe
r sem
i-tra
ilert
ruck
in e
uro
Source: VDA statistics
Rising standards for environment and security lead to a pronounced qualitative growth (2007/1997: +32%),
but increasing share of vans beat down the average value

75
Trend of production value ofbuses in Germany
aver
age
valu
epe
r bus
in e
uro
Source: VDA statistics
179,530
206,497
251,140
0
50,000
100,000
150,000
200,000
250,000
300,000
1997 2002 2007
Rising standards for environment and security lead to a pronounced qualitative growth (2007/1997: +40%)

76
7,9
1,3
5,8
10,0
2,2
8,3
12,6
3,1
11,1
19,1
5,7
16,2
0,0
5,0
10,0
15,0
20,0
25,0
CV manufacturers Trailers and bodies CV parts industry
1995 1999 2003 2007
GermanyExports of the German Commercial Vehicle Industry
in b
illio
neu
ro
2007/1995: +338%
2007/1995: +338%
2007
/1995
: +14
2%
2007
/1995
: +14
2%
2007
/1995
: +17
5%
2007
/1995
: +17
5%
Source: VDA statistics

77
Germany: Foreign Trade Balance of the Commercial VehicleIndustry* in 2007: 11.1 billion € (+12%)
in b
illio
neu
ro
*Overall commercial vehicle exports - imports (excl. used vehicles)
1.120.873
1.097.123
794.636
581.851
366.476
280.733
243.798
657.330
769.188
541.377
118.729
183.742
0 200.000 400.000 600.000 800.000 1.000.000 1.200.000
France
United Kingdom
Spain
Italy
Poland
Czech Republic
Romania
Russia
Africa
NAFTA
Latin America
China
Source: Destatis, VDA statistics

78
Freight Transport in Germany until 2050

79
Freight Transport in the EU-27 until 2030

80
Germany – share of empty kilometers in all kilometersdriven of German lorries
source: Bundesamt für Güterverkehr
28.628.2
27.6
26.625.9
24.7
23.622.7
21.9
20.820.1
19.6 19.4
15
17
19
21
23
25
27
29
1995 1996 1997 1998 1999 2000 2001 2002 2003 2004 2005 2006 2007
%

81
Germany tax burden of a 40-tons-truck-trailer-combination per year
source: BGL
(Euro II with air suspension, German inland transport) vehicle kilometers per year: 135.000 km; fuel consumption: 34 l/100 km
Source: EC-Commission, EC-Member States, BGL* date: august 2004** date: january 2006 (in B, L, PL on sulfur reduced diesel; in D, H, NL on sulfur free diesel; in DK including CO2-tax*** with consideration of petroleum tax reduction on commercially used diesel in B=3,64 cent/l, in F=2,5 cent/l

82
Germany – truck toll substitutes tax financing(origin of highway investment)
3,8 3,8 3,8 3,63,1
1,4 1,3 1,1 1,3 2,2
4,44,2
4,7 4,7 4,74,9
0
1
2
3
4
5
6
1999 2000 2001 2002 2003 2004 2005 2006 2007 2008 2009
Bill
ion
€
road chargetax
(liability) (plan)
5,2 5,14,9 4,9
5,3
§ 11 toll act
The... toll revenue is subjected in addition to the public budget for transport and iscompletely earmarked for improving transportinfrastructure, mainly for highways.
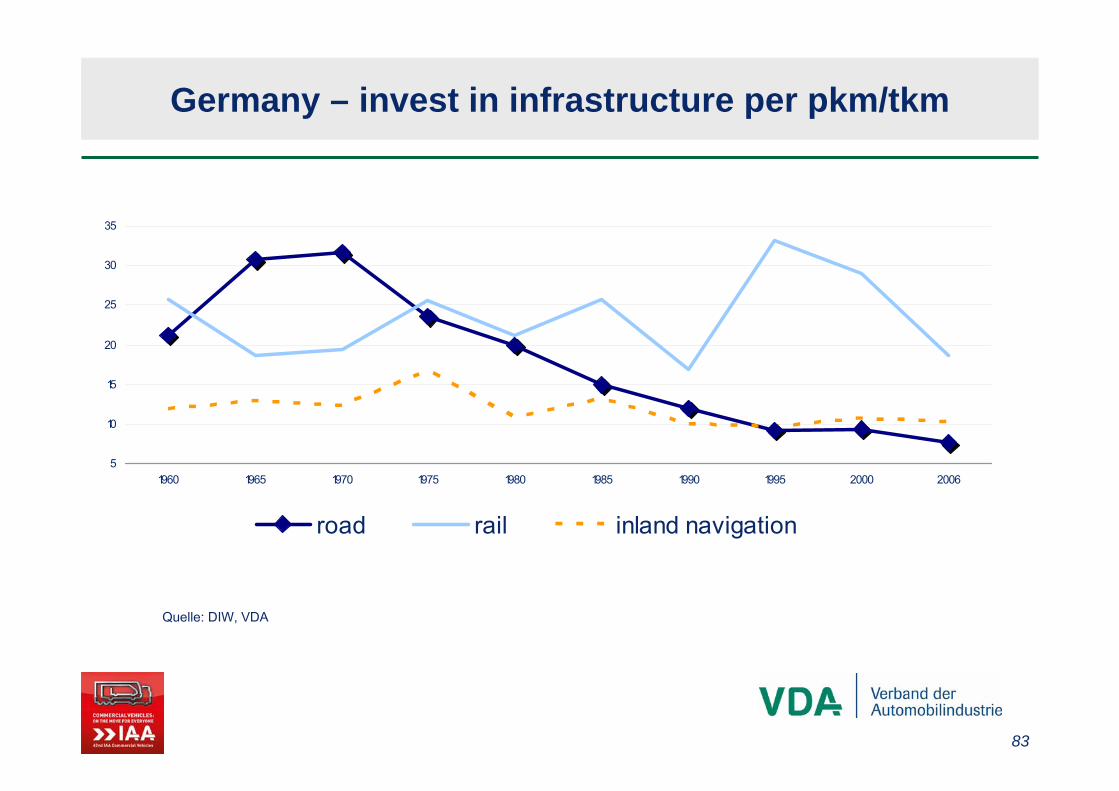
83
Germany – invest in infrastructure per pkm/tkm
5
10
15
20
25
30
35
1960 1965 1970 1975 1980 1985 1990 1995 2000 2006
road rail inland navigation
Quelle: DIW, VDA
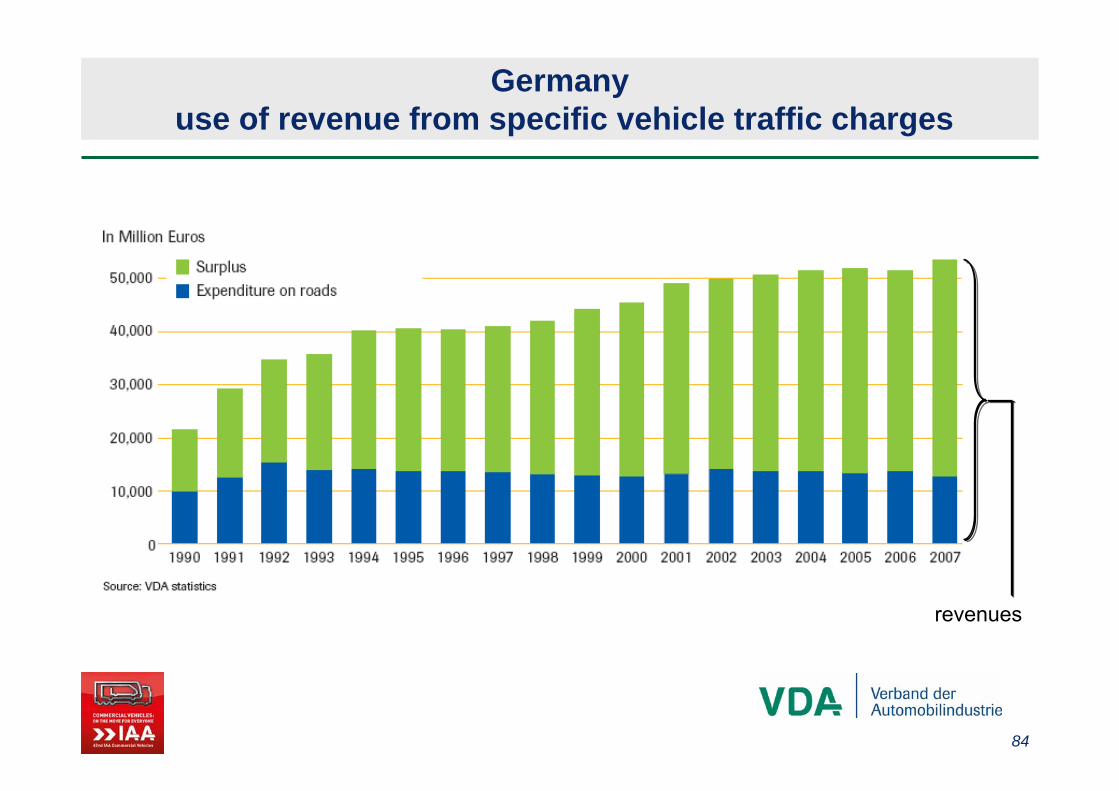
84
Germany use of revenue from specific vehicle traffic charges
revenues
85
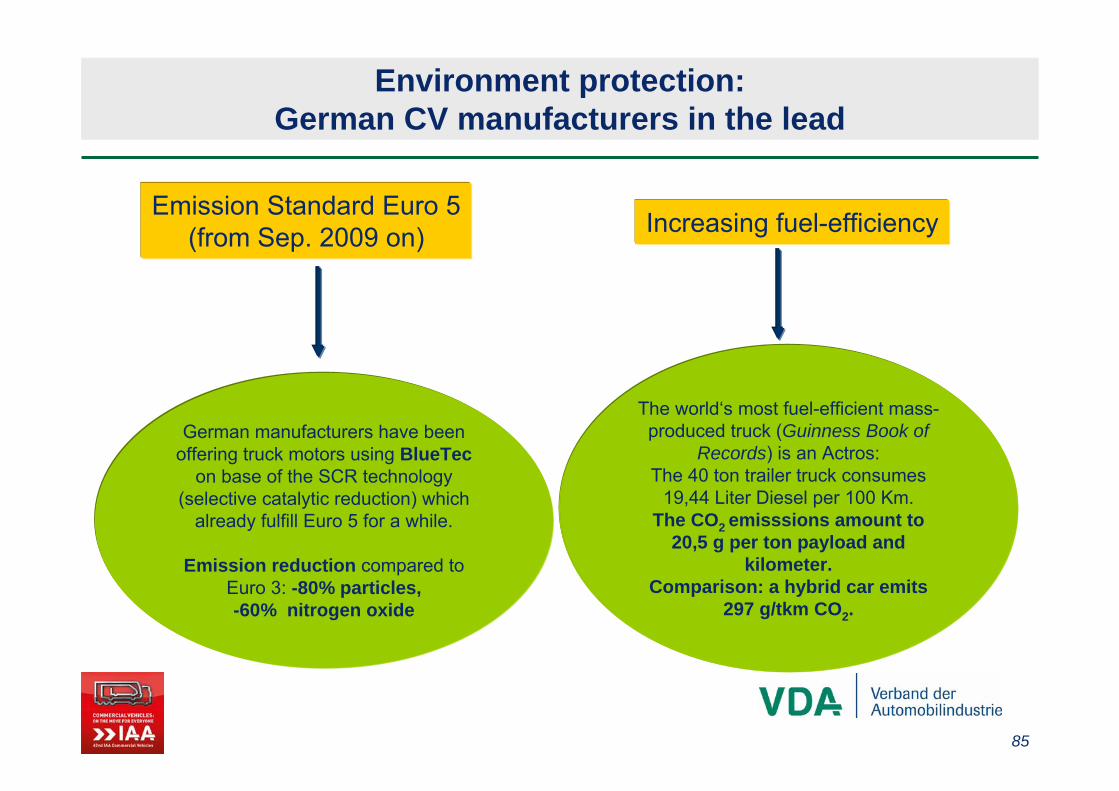
Environment protection: German CV manufacturers in the lead
German manufacturers have beenoffering truck motors using BlueTec
on base of the SCR technology (selective catalytic reduction) which
already fulfill Euro 5 for a while.
Emission reduction compared to Euro 3: -80% particles, -60% nitrogen oxide
Emission Standard Euro 5(from Sep. 2009 on) Increasing fuel-efficiency
The world‘s most fuel-efficient mass-produced truck (Guinness Book of
Records) is an Actros:The 40 ton trailer truck consumes
19,44 Liter Diesel per 100 Km. The CO2 emisssions amount to
20,5 g per ton payload and kilometer.
Comparison: a hybrid car emits297 g/tkm CO2.

86
Development of Exhaust Gas Emissions for Heavy Commercial Vehicles
With the upcomingEuro V emission
legislation since 1990 harmful emissions arereduced by 88 per cent
on the average.

87
Development of Exhaust Gas Emissionsof ligth commercial vehicles
With the upcoming Euro 5 emission legislation since 1990 harmful emissions are reduced by 97 per cent on the average.
Source: VDA
88
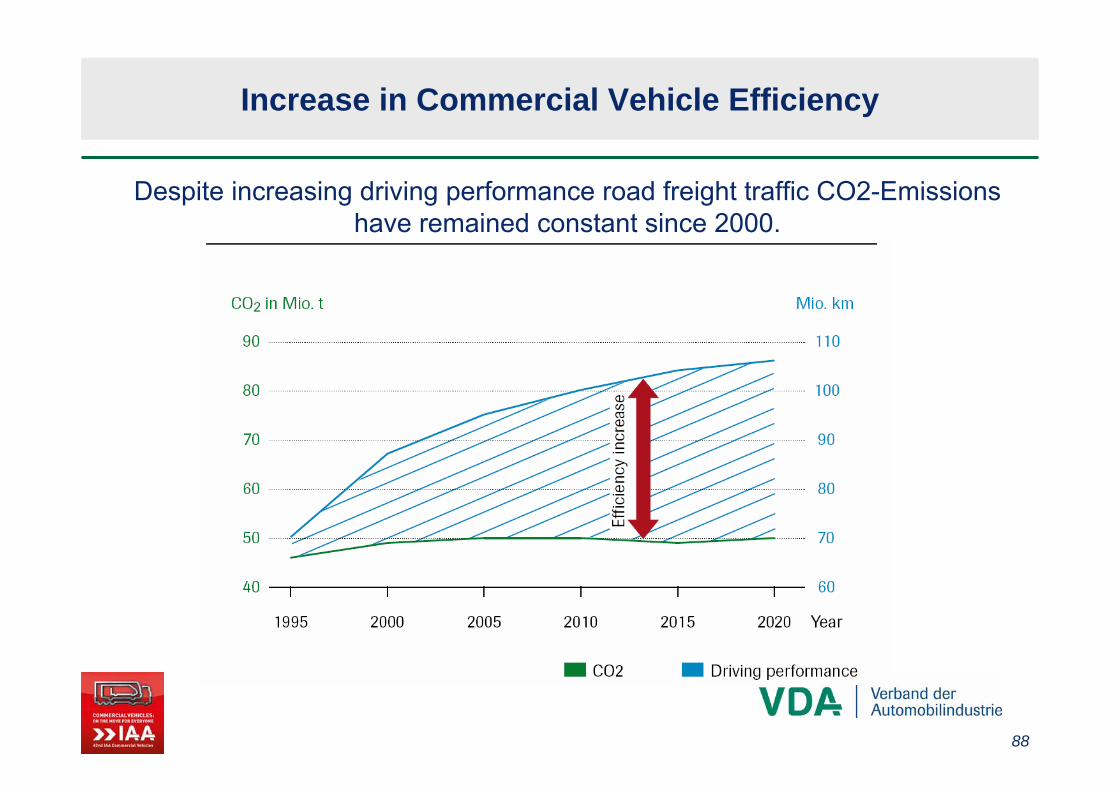
Increase in Commercial Vehicle Efficiency
Despite increasing driving performance road freight traffic CO2-Emissions have remained constant since 2000.
89
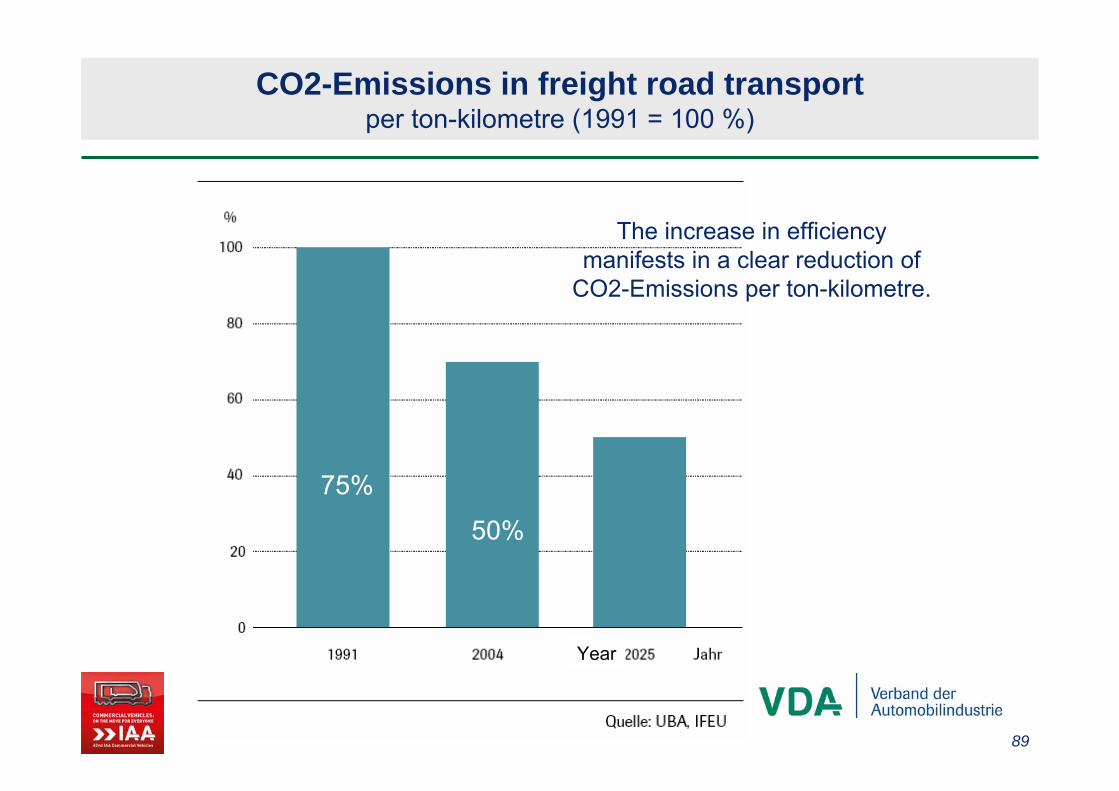
CO2-Emissions in freight road transportper ton-kilometre (1991 = 100 %)
The increase in efficiencymanifests in a clear reduction of
CO2-Emissions per ton-kilometre.
100%
75%
50%
Year

90
Development of CO2-Emissions of light commercial vehicles
Today a van consumes one thirdless than as recently as 1980

91
CO2-Emissions per ton-kilometre depending on average loadfaktor
Because of the fact that each carrier today isoptimally utilised in the market, big shifts fromroad transport to other carriers are not expected.
92
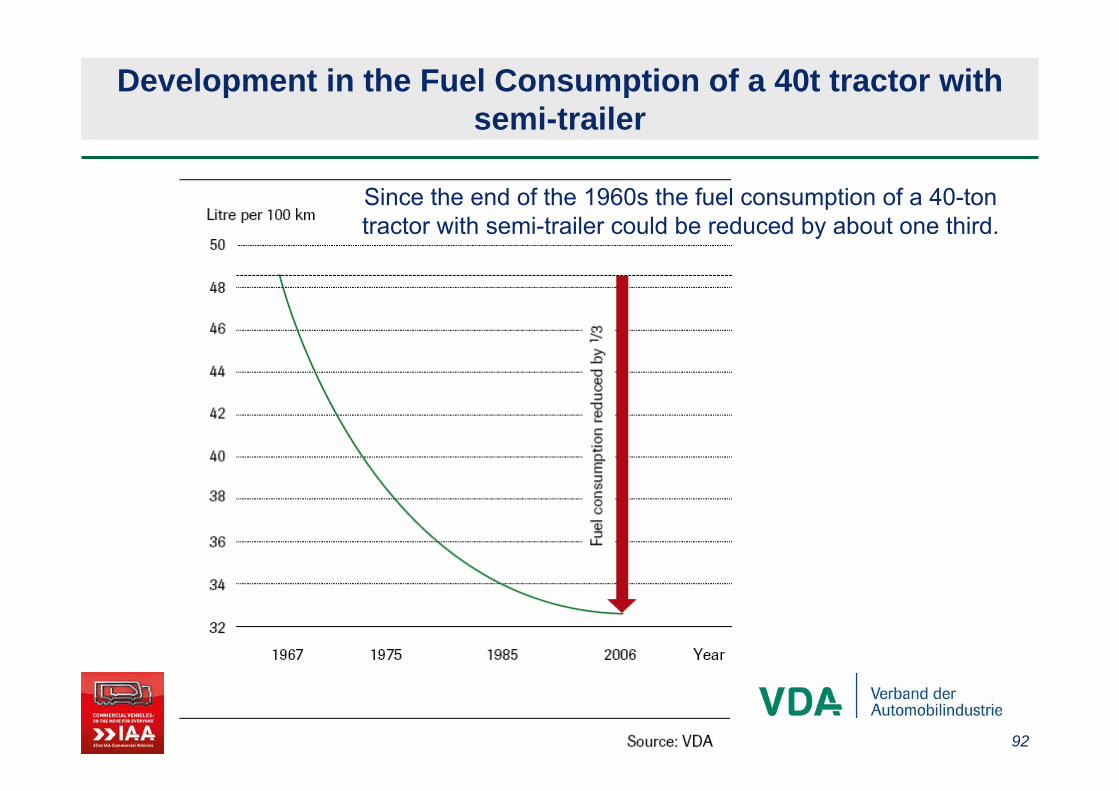
Development in the Fuel Consumption of a 40t tractor withsemi-trailer
Since the end of the 1960s the fuel consumption of a 40-ton tractor with semi-trailer could be reduced by about one third.
93
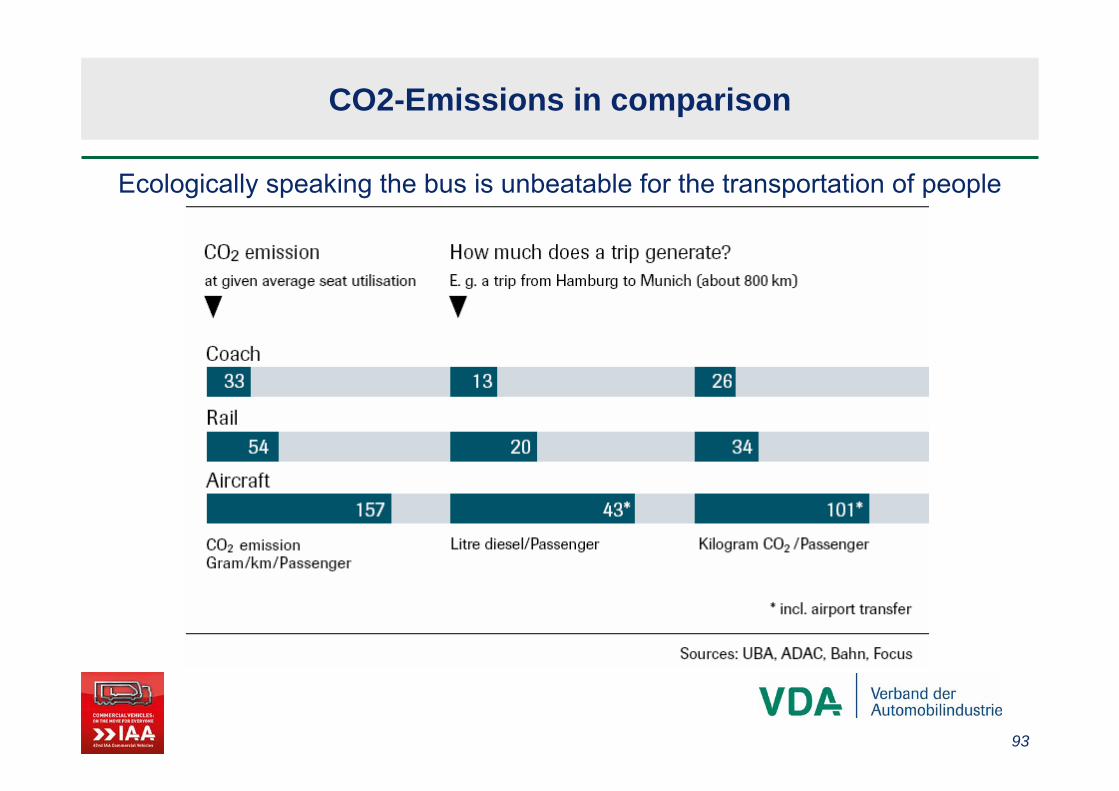
CO2-Emissions in comparison
Ecologically speaking the bus is unbeatable for the transportation of people

94
Buses by Euro Categories in Germanyparc new registrations
Source: VDA statistics, Kraftfahrt-Bundesamt
66%
49%
26%
32% 31%29%
2%
20%
31%
0% 0%
9%
0%
10%
20%
30%
40%
50%
60%
70%
1.1.2002 1.1.2005 1.1.2008
not reduced Euro I/II Euro III Euro IV/V
98%
5%2%
0% 0%1%
94%
60%
12%
5%
0% 1%
36%
87%
95%
0%
20%
40%
60%
80%
100%
2000 2003 2006 2007 1.H.2008
95
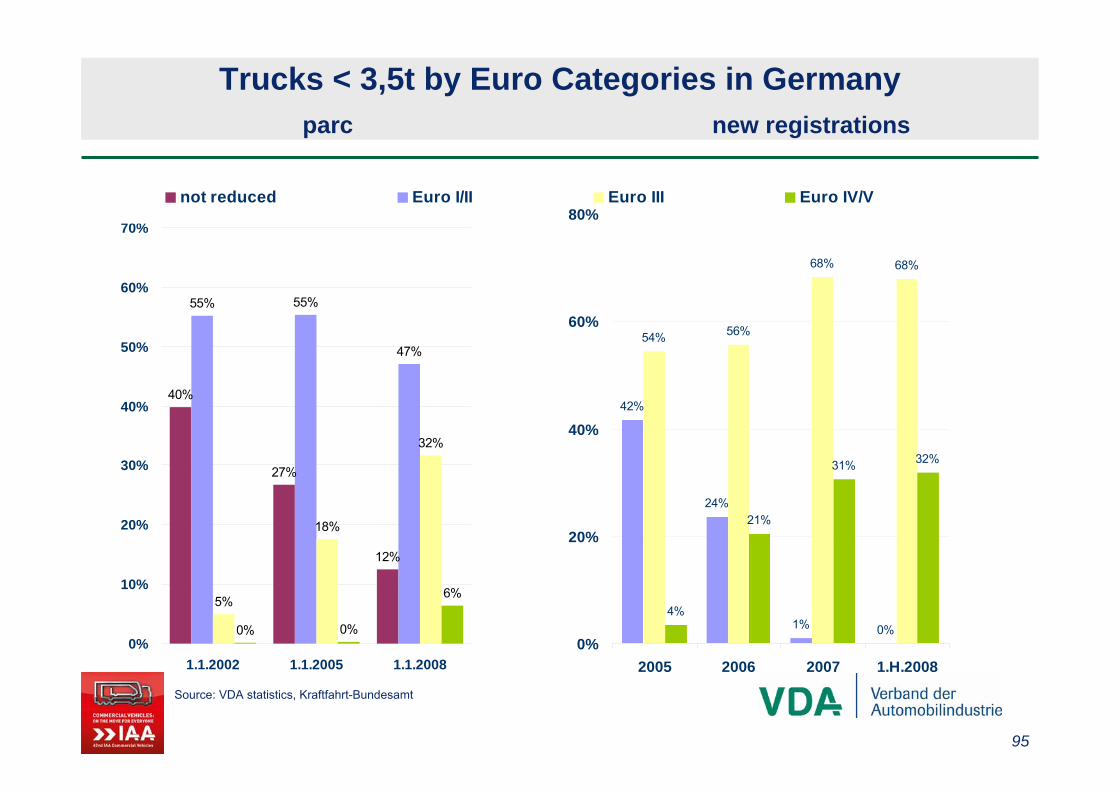
Trucks < 3,5t by Euro Categories in Germanyparc new registrations
Source: VDA statistics, Kraftfahrt-Bundesamt
40%
27%
12%
55% 55%
47%
5%
18%
32%
0% 0%
6%
0%
10%
20%
30%
40%
50%
60%
70%
1.1.2002 1.1.2005 1.1.2008
not reduced Euro I/II Euro III Euro IV/V
42%
24%
1% 0%
54% 56%
68% 68%
4%
21%
31% 32%
0%
20%
40%
60%
80%
2005 2006 2007 1.H.2008

96
Truck parc by Euro Categories in Germanytrucks 3,5 – 12t * trucks over 12 t *
38%
34%
28%
22%
40%37%
34%32%
22%
28%
33% 33%
0% 0%1%
9%
0%
5%
10%
15%
20%
25%
30%
35%
40%
45%
50%
1.1.2005 1.1.2006 1.1.2007 1.1.2008
not reduced Euro I/II
Source: VDA statistics, Kraftfahrt-Bundesamt* incl. truck tractors
16%13%
9%6%
38%
31%
22%
39%
0%2%
9%
45% 47% 47%50%
25%
0%
5%
10%
15%
20%
25%
30%
35%
40%
45%
50%
55%
1.1.2005 1.1.2006 1.1.2007 1.1.2008
Euro III Euro IV/V

97
1% 0% 0% 0%
96%
7%4%3%
17%
84%
72%
0% 1%
9%
24%
81%
0%
10%
20%
30%
40%
50%
60%
70%
80%
90%
100%
2005 2006 2007 1.H.2008
Euro I/II Euro III Euro IV Euro V
Registrations by Euro Categories in Germanytrucks 3,5 – 12t * trucks over 12 t *
Source: VDA statistics, Kraftfahrt-Bundesamt* incl. truck tractors
82%
56%
2% 0%
5%9%
30%
24%
9%
33%
68%
75%
0%
10%
20%
30%
40%
50%
60%
70%
80%
90%
100%
2005 2006 2007 1.H.2008