growth and change in u.s. cities and suburbs · common factors affecting both cities and suburbs,...
TRANSCRIPT

Growth and ChangeVol. 32 (Summer 2001), pp. 326-354
Growth and Change in U.S. Cities and Suburbs
ROBIN M. LEICHENKO
ABSTRACT Differential rates of growth and decentralization are processes thatcharacterized U.S. urban areas over the past three decades. This paper examines thedeterminants of growth in cities and suburbs during the 1970s, the 1980s, and the1990s. The modeling approach adopted in the study allows for simultaneity betweenpopulation and employment, and between cities and suburbs, while also taking intoaccount a range of other explanatory factors. Results indicate that population andemployment growth in cities tend to be jointly determined, but that growth ofemployment in the suburbs tends to drive growth of suburban population. Resultsalso suggest that suburban and city growth are interrelated, but that the nature ofthese interrelationships varies over time: suburban growth promoted city growthduring the 1970s and 1980s, while city and suburban growth were jointly determinedduring the 1990s. Other factors that consistently explain variation in city growthinclude demographics, population density, crime rates, and income inequality.Factors consistently explaining suburban growth include regional location andclimate.
Introductionrban growth has received considerable scholarly attention within the urbanand regional literature. There is also strong public sector interest in this
subject. Policy makers have long been concerned about central city decline,inter-city competition for jobs, state and local public finance, and the role of thefederal government in urban development policy (HUD 1997; Bartik 1991). Therecent revitalization of central cities has also received much attention, althoughimportant questions remain about the spatial extent of the current wave of urban
Robin Leichenko is an assistant professor of geography at the Center for Urban PolicyResearch, Rutgers University, New Brunswick, NJ 08901. She thanks Norman Glickmanfor advice and suggestions on this study. She also thanks Michael Lahr, Elvin Wyly, PatNorton, Janice Madden, and three anonymous reviewers for helpful comments on anearlier version. She thanks Andy Haughwout for providing corrected central cityannexation data, and Brian Schmitt for assistance with database construction. Theresearch for this paper was carried out under HUD Contract No. DU100C000005967,Task Order 8. The views expressed here are those of the author only.
Submitted May 1999, revised Jul., Nov. 2000.© 2001 Gatton College of Business and Economics, University of Kentucky.Published by Blackwell Publishers, 350 Main Street, Malden MA 02148 US,and 108 Cowley Road, Oxford OX4 1JF, UK.
U

U.S. CITIES AND SUBURBS 327
redevelopment and about the degree to which traditional urban residents arebenefiting from these changes (Wyly and Hammel 1999; Hackworth 2000).Much research on urban growth has been devoted to three overlapping areas ofinquiry: (1) understanding the reasons that cities and urban regions grow anddecline; (2) examining the economic linkages between cities and suburbs and thedecentralization of metropolitan areas; and (3) investigating the factors that bestexplain the convergence or divergence of per capita income among cities andregions.1 This research emphasizes the first and second of these areas.
This study speaks to significant, broad-based trends of urban change in theUnited States between 1970 and 1997. It focuses in particular on two issues:differential growth across cities, and decentralization of population andemployment from cities into surrounding suburban areas. Differential rates ofgrowth across cities since 1970 are apparent in Table 1, which illustratespopulation growth rates across large cities in each major region between 1970and 1997.2 Between 1970 and 1997, large and Frostbelt cities declined relative tomid-sized and Sunbelt cities. Population in the Northeastern cities included inthe study declined by nearly 0.5 percent per year while city populations in theMidwest declined by over 0.6 percent per year. Within the South and West, bycontrast, city population grew by 0.5 percent and 1.23 percent per year,respectively, over the twenty-seven year study period. These patterns reflectboth long-term shifts of population from the Northeast and Midwest to the Southand West, as well as decentralization from cities to suburbs.
City growth rates also varied over time (Table 1). As a consequence ofindustrial restructuring within the manufacturing belt, rates of city populationdecline were much more rapid during the 1970s in the Midwest and Northeastthan during the 1980s or 1990s. Cities in the South and West, on the other hand,experienced their most rapid growth during the Sunbelt boom period of 1980s.Growth in the West slowed somewhat during the 1990s, although much of theWest’s slowdown centered in California, which was hit by defense cutbacks andother problems early in the decade.
TABLE 1. RATES OF POPULATION GROWTH IN LARGE U.S. CENTRAL CITIES,AGGREGATED BY REGION.
1970-1997 1970-1980 1980-1990 1990-1997
Midwest -0.63 -1.31 -0.41 0.04Northeast -0.48 -1.24 0.04 -0.12South 0.54 0.62 0.67 0.26West 1.23 1.12 1.76 0.64
Sources: U.S. Bureau of the Census (2000), State of the Nation's Cities (1998).

328 GROWTH AND CHANGE, SUMMER 2001
These interregional changes across the system of U.S. cities wereaccompanied by decentralization within metropolitan areas, as people and jobsleft central cities for the suburbs and exurbs. Among the metro areas included inthe study, the share of central city residents declined rapidly, from 43 percent ofthe total metro population in 1970 to 35 percent of the total metro population in1997 (Table 2). Rates of population shift from city to suburb also varied amongthe four major regions of the country. The most dramatic shifts in central citypopulation shares of total metro populations occurred in the South and Midwest:the share of central city residents decreased from 43 to 31 percent in the Southand from 42 to 32 percent in the Midwest. Slower relative shifts in metropopulations occurred in the Northeast and the West. Central city populationshares declined from 45 to 40 percent in the Northeast and from 41 to 37 percentin the West over the study period.
Uneven growth within and across cities and population decentralization arethus two hallmarks of U.S. urban development in recent decades. Previousresearch on the determinants of city growth has emphasized a number ofimportant factors from both the supply and demand sides of economicdevelopment.3 From the demand side, a region’s exports help determine itsgrowth. In turn, this means that the composition of industry partly determinesregional development—the more vibrant the national and international marketsfor the region’s key products, the faster is the likely growth. There are manysupply-side determinants of growth too. First, are the endowments of the region:its stock of human and physical capital, technical infrastructure, schools anduniversities, and the like. Regions with more productive stocks of human capitaland public infrastructure will be favored over those less endowed. Second, thereis an array of locational factors that make places attractive to both firms andmigrants: labor costs, unionization rates, climate, taxes, and fiscal conditions.This study draws on both streams of research, considering the effects of bothdemand and supply-side factors on urban growth.
TABLE 2. RATIOS OF CENTRAL CITY POPULATION TO METRO POPULATION, AGGREGATED
BY REGION
1970 1980 1990 1997
Midwest 0.42 0.36 0.34 0.32Northeast 0.45 0.41 0.40 0.40South 0.43 0.38 0.34 0.31West 0.41 0.38 0.37 0.37Total 0.43 0.38 0.36 0.35
Sources: U.S. Bureau of the Census (2000); State of the Nation's Cities (1998).

U.S. CITIES AND SUBURBS 329
Among the recent empirical studies of urban growth determinants,researchers have found that educational attainment, industry structure, andregion are consistently significant predictors of urban growth.4 None of theserecent studies, however, provide an assessment of the determinants of urbangrowth after 1990. Assessments of how urban growth determinants havechanged over time are also somewhat limited.5 Crandall (1993), for example,contrasts factors in the 1970s and the 1980s, but his analysis is limited to a fewexplanatory variables and does not incorporate social or demographic factors.Other recent studies observe how initial conditions influence change over longertime periods (e.g., 1960 to 1990), or focus more narrowly on specific issues suchas the influence of higher education on urban growth or the relationship betweenindustry structure and urban income inequality.6
While most studies of urban change focus on either cities or metropolitanareas, explicit investigation of linkages between city conditions and suburbanarea growth are also relatively limited.7 In particular, an important questionremains: whether a healthy central city is necessary for suburban or metropolitaneconomic development over the long term (Ihlanfeldt 1995; Adams et al. 1996;Downs 1997; Mills and Lubuele 1997).8 Most empirical investigations of city–suburban growth find that central city growth is significantly and positivelyrelated to that of the suburbs (Voith 1992, 1996; Savitch et al. 1993; Ledeburand Barnes 1992). Voith (1992) finds that city and suburban population, income,and employment change are positively correlated during the 1970s and 1980s.He concludes that central city decline is a “long-run, slow drain on the economicand social vitality of the region” (Voith 1992, 31). Hill et al. (1995) raise someimportant caveats about this work, however, suggesting that positive correlationbetween city and suburban growth patterns may simply reflect underlyingcommon factors affecting both cities and suburbs, such as state policies orshared labor market dynamics. This ongoing debate suggests that additionalattention should be paid to the role of central city conditions in influencing thegrowth of suburban areas and vice versa.
In light of the issues raised above, this study focuses on three interrelatedquestions: (1) what factors account for the differential rates of growth of citiesand suburbs? (2) are city and suburban growth interrelated? and (3) how havethe determinants of city and suburban growth changed over time? In examiningthese questions, the study draws from a 2,000-variable database developed for aU.S. Department of Housing and Urban Development project, State of theNation’s Cities, or “SONC” 9 (Glickman et. al. 1996; Wyly et al. 1998). Thedatabase includes the nation’s 50 largest cities as well as a number of smallerurban areas. In total, the SONC database includes data for 77 large cities and 74Metropolitan Statistical Areas (MSAs).10

330 GROWTH AND CHANGE, SUMMER 2001
Modeling City and Suburban GrowthNumerous studies of the determinants of U.S. urban and regional growth
have indicated that population growth and employment growth in cities andregions tend to be jointly determined.11 The theoretical basis for jointdetermination between population and employment, as articulated by Steinnesand Fisher (1974), is the idea that households and firms are both mobile and thathousehold location decisions maximize utility while firm location decisionsmaximize profits. According to the proposition of utility maximization,household location decisions are expected to be influenced by location of jobopportunities and other factors such as provision of public services, amenities(and disamenities), demographic factors, and regional location. The locationdecisions of firms are expected to be influenced by the need for proximity togrowing consumer markets (i.e., population), as well as factors including localbusiness climate, tax rates, and regional location.
In addition to the potential for simultaneity between population andemployment, simultaneity may also exist between central cities and suburbanareas within a metro region (Voith 1998; Savitch et al. 1993; and Ledebur andBarnes 1992). Two contrasting hypotheses are commonly cited to account forthe interdependencies between cities and suburbs (Adams et al. 1996;Mieszkowski and Mills 1993). The first, the ‘flight from blight hypothesis,’suggests that suburban growth is the result of social and fiscal problems incentral cities. Firms and residents who can afford to do so, move out of cities toescape high taxes, congestion, high crime rates, concentrated poverty, racialtensions, and other problems. The second, the hypothesis of ‘natural evolution,’indicates that suburban growth is a function of demand for land by firms andhigher-income households and is fostered by innovations in transportationtechnology (Adams et al. 1996; Mieszkowski and Mills 1993).12
The modeling approach adopted in this study takes into account both of thesepotential sources of simultaneity: 1) between population and employment, and2) between cities and their suburbs. Following from Mills (1986), a fourequation simultaneous model is proposed:
∆CPOP = f(∆CJOB, ∆SPOP, ∆SJOB, Xci, R) (1)
∆CJOB = f(∆CPOP, ∆SPOP, ∆SJOB, Xci, R) (2)
∆SPOP = f(∆SJOB, ∆CPOP, ∆CJOB, Xci, R) (3)
∆SJOB = f(∆SPOP, ∆CPOP, ∆CJOB, Xci, R) (4)
where ∆CPOP is the change in the natural log of city population; ∆CJOB is thechange in the natural log of city employment; ∆SPOP is the change in thenatural log of suburban population; and ∆SJOB is the change in the natural logof suburban employment; Xci is a vector of initial characteristics for city i; and Ris a vector of regional dummy variables. In each equation, growth of the
U.S. CITIES AND SUBURBS 331
dependent variable is a function of growth of the other endogenous variables, aset of exogenous variables, and regional location. In equation (1), for example,growth of city population (∆CPOP) is a function of growth of city employment(∆CJOB), growth of suburban population (∆SPOP) and growth of suburbanemployment (∆SJOB), initial city characteristics (Xci), and regional locationaldummy variables (R).
The exogenous variables (Xci) include a broad array of factors representingagglomeration economies, demographics, local amenities, local businessclimate, taxes, and regional location, all of which may contribute to growth ofpopulation and/or employment in cities and suburbs. The exogenous variablesmay be divided into nine major categories (Table 3).
Demographic characteristics. Three measures of demographic conditionsare included: percentage of the population over age sixty-four (OVER64),percentage of the population that is non-white (NONWHITE), and percentage ofthe population that is foreign-born (IMMIG). OVER64 reflects older or retireepopulations. Cities with higher proportions of older residents and retirees havesmaller endowments of productive labor relative to total population and maythus be less attractive to firms. This could result in slower employment growth.For population growth, however, the sign of the coefficient is indeterminate.Cities with large populations of retirees may experience population declinebecause of retiree out-migration, but a large older population may also reflectattractiveness of a city to retirees, resulting in a positive sign. The seconddemographic indicator is percentage nonwhite.13 Central cities often representplaces of diversity, with higher populations of African-Americans, Hispanicsand Asians. Higher proportions of NONWHITE may indicate the presence ofdiscrimination or racial conflict within a city, each of which may result in slowercity growth, but more rapid suburban growth. The third demographic variable,percentage foreign-born (IMMIG), reflects a city’s attractiveness to internationalmigrants. Cities with larger current populations of foreign-born residents maytend to draw additional migrants resulting in faster population growth. Becauseimmigrants and guest workers may also provide an inexpensive labor pool,which would be attractive to firms, IMMIG is expected to have a positive effecton employment growth.14
Human capital. Educational attainment reflects an area’s endowment ofhuman capital. Cities with better-educated populations are expected to bothretain and attract firms and thus grow more quickly. Two measures ofeducational attainment of the population are used, both of which are expected tohave a positive effect on growth of cities and suburbs. The first is percentage ofthe population with only a high school education (HSED), high school graduateswho did not attend college. This is a basic indicator of the educationalattainment of the population. The second is percentage of the population with a

332 GROWTH AND CHANGE, SUMMER 2001
TABLE 3. DESCRIPTION OF THE VARIABLES
Variable Description
Growth Variables∆CPOP Change in the natural log of city population∆CJOB Change in the natural log of city employment∆SPOP Change in the natural log of suburban population∆SJOB Change in the natural log of suburban employment
Demographic CharacteristicsNONWHITE Percent of city population that is either African American,
Hispanic, or AsianIMMIG Percent of city population that is foreign-bornOV64 Percent of city population that is over 64Human CapitalHSED Percent of city population that has completed high school,
excluding those who also completed collegeCOLLED Percent of city population that has completed collegeIncome Inequality
INEQ: Income inequality in the city, calculated as a ratio ofaverage family income in the 90th income percentile toaverage family income in the 10th percentile.
CSINEQ: Income inequality between the city and surroundingsuburbs, measured as a ratio of suburban income percapita divided by city income per capita
DensityDENSITY City population/city land areaAmenitiesCOOLDEG Number of cooling degree daysHEATDEG Number of heating degree daysPRECIP Annual precipitationCRIME Crime rate in the central city/crime rate in the suburbsIndustrial StructureMANUF Share of nonfarm earnings in manufacturing in the central
countyPROD Share of nonfarm earnings in business services in the
central countyMILITARY Share of nonfarm earnings in military in the central countyBusiness ClimateUNION State unionization ratePCAP Natural log of central city per capita incomeTAXDIFF Property tax revenue per capita in the central county
/property tax revenue per capita in the suburban countiesAnnexationANNEX Percent change in city land areaRegion
MIDWEST, SOUTH, Dummy variables for location in Midwest, South and West
AND WEST (=1, Northeast=0)
U.S. CITIES AND SUBURBS 333
college education (COLLED), a measure of the importance of higher educationfor growth.15
Inequality. Two indicators of income inequality are used. The ratio offamily income for those in the 90th percentile to those in the 10th (INEQ)captures disparities within cities (INEQ), while the ratio of per capita income inthe suburbs to that in the city (CSINEQ) gauges differences between the twotypes of jurisdictions. Recent concerns over rising levels of income inequalitywithin cities and between cities and suburbs have led to speculation that urbangrowth patterns may be linked with patterns of income inequality. Particularly,high levels of income inequality within the central city and large inequitiesbetween cities and suburbs may detract from overall metropolitan economicgrowth, suggesting negative signs on both inequality coefficients.
Density. Population density (DENSITY) serves as a proxy for economies ofagglomeration. The expected sign of this variable is indeterminate a priori.Higher density cities may benefit from external economies of urbanizationmaking them more attractive to residents and firms. The resulting coefficientwould then be positive. However, denser cities also tend to be older cities.Higher densities may also indicate the existence of diseconomies ofagglomeration in a city (e.g., high costs of doing business, negative externalitiesassociated with congestion, or older infrastructure). The presence ofdiseconomies of agglomeration within a city suggests slower growth and anegative coefficient within the equations for city growth but positive coefficientsin the equations for suburban growth as firms and residents relocate to lesscongested suburban areas.
Amenities. Positive and negative amenities may also influence growth ofcities and suburbs. Two types of amenity variables are included in the analysis:climatic conditions and crime rates. Urban areas with warmer and dryer climatesare attractive to residents, and thus cities and suburbs with these attributes areexpected to experience faster population growth. To capture these climaticeffects, three climate variables are included: cooling degree-days (COOLDEG),heating degree-days (HEATDEG), and total annual precipitation (PRECIP).Crime represents a negative amenity. High crime rates in cities, holdingsuburban crime rates constant, would be expected to drive middle-incomeresidents from the cities to the suburbs. The variable CRIME, which is the ratioof the city’s crime rate to the suburban crime rate, captures differences in crimerates between cities and suburbs. CRIME is expected to have a negative effect onpopulation growth in the city and a positive effect on population growth in thesuburbs.
Industrial structure. Industrial structure reflects urban linkages to thenational and international economy. Three variables intended to represent theshares of essential sectors of the city economy are included. The first is
334 GROWTH AND CHANGE, SUMMER 2001
manufacturing share of total earnings (MANUF). The second is producerservices share (PROD); this variable encompasses several service sectorsincluding FIRE (finance, insurance, and real estate), business services, and legalservices. The third is the military share of total earnings (MILITARY). Changesin national and international demand for goods and services may harm certaintypes of cities and help others (Drennan et al. 1996). Deindustrialization and theconcomitant shift to services suggest that cities with higher initial manufacturingshares will probably grow more slowly. At the same time, cities specialized inproducer and other services are expected to grow more rapidly. Military baseclosings in recent decades have taken a substantial economic toll on local andregional economies; cities with higher military shares are thus expected to growmore slowly.
Business and fiscal climate. Business climate reflects the attractiveness of acity or metro area to firms, while fiscal climate may influence location decisionsof both firms and residents. Two measures of business climate are included:state unionization rates (UNION)16 and per capita income (PCAP). Higher stateunionization rates are expected to have negative effects on employment growthin both cities and suburbs. In investigating this, the log of per capita income(PCAP) may be used as a proxy for average labor costs in a city. Cities withhigher labor costs are expected to experience slower growth of jobs as the resultof firms leaving central cities for lower cost locations, either in the suburbs orelsewhere. Fiscal climate is measured by the ratio of central city to suburbanproperty tax revenues per capita (TAXDIFF). 17 The overall effect of differencesin the ratio of city to suburban property tax revenues on growth in cities andsuburbs is uncertain. Higher taxes in the city relative to the suburbs may be areflection of higher quality public services that would draw people to cities, resultingin growth. However, higher taxes may also drive residents and firms to move to thesuburbs resulting in negative city growth, but positive suburban growth.
Annexation. A measure of city land area growth (ANNEX) controls forannexation of surrounding suburban areas by the central city. For central citiesthat are either landlocked or cannot grow due to growth control regulations, thisvariable takes on a value of zero. In addition to controlling for changes in thesize of the central city, the annexation variable provides a way to test the“flexibility” thesis offered by Rusk (1993). Rusk’s thesis suggests that growth ofcentral city land area through annexation is necessary for overall metropolitaneconomic health. Based on this thesis, annexation is expected to have a positiveeffect on growth of both cities and suburbs.
Region. Regional dummy variables representing the four main regions ofthe country are also included. (The Northeast is represented by the interceptterm, the others by dummies.) Regional dummy variables take into accountunobserved differences between regions that may influence rates of both cityand suburban growth. In light of population dispersion from the Northeast and

U.S. CITIES AND SUBURBS 335
Midwest (MIDWEST) to the South (SOUTH) and West (WEST) over the pastthree decades, city and suburban areas in the South and West are expected togrow faster than those in the Northeast and Midwest. Thus, the dummy variablesfor the South and West should have positive signs.
Taken together, these nine types of variables take account of majordeterminants of urban development and allow examination of the effects of awide range of factors during the different time periods.
The four-equation model is estimated for three different time periods, 1970to 1980, 1980 to 1990, and 1990 to 1997. The exogenous variables in each case(Xci) represent conditions in the initial year. In the model of city and suburbangrowth between 1970 and 1980, for example, the exogenous variables describeconditions in 1970. This type of lag specification, which is commonly used inanalyses of urban and regional growth [e.g., Carlino and Mills (1987), Glaeser etal. (1995), and Palumbo et al. (1990)], helps to minimize problems ofendogeneity that might be encountered when modeling changes in the dependentvariables as a function of contemporaneous changes in the exogenous variables.To facilitate comparisons over time, the metro area definitions are consistent forall periods, using the 1993 Census definitions of metro areas. One importantdifference between the models for the 1970s and 1980s versus the model for the1990s is that the 1970s and 1980s models use formal central city and suburbanboundaries, while the 1990s models use central county and suburban counties asa proxy for central cities and suburbs.17 The models for the 1990s thus are notstrictly comparable to the earlier decades, but, nonetheless, provide a reasonableapproximation of the interactions between central cities and suburbs.
The models are estimated using two-stage least squares (2SLS) regression.Endogenous variables include ∆CPOP, ∆CJOB, ∆SPOP, ∆SJOB. Tests for thepresence of heteroscedasticity indicted evidence of heteroscedasticity in allcases. A correction for heteroscedasticity was performed using White’scorrected covariance matrix (White 1980).
Tests were also conducted for multicollinearity using the method of varianceinflation factors. The tests indicated problems of multicollinearity betweenseveral of the variables. In particular, PCAP, HSED, and HEATDAYS werefound to be strongly correlated with other variables or combinations of othervariables during all three of the time periods. To pinpoint the sources ofmulticollinearity, regressions of all other independent variables on thesevariables were performed. Results indicated that PCAP was strongly correlatedwith COLLED during all three decades. PCAP was also correlated with CSINEQduring the 1970s and 1980s, and with HSED and INEQ during the 1990s. Inaddition, HSED was strongly correlated with NONWH during all three decades,with CRIME during 1970s, with OVER64 during the 1980s, and with OVER64,IMMIG and INEQ during the 1990s. HEATDAYS days was strongly correlated

336 GROWTH AND CHANGE, SUMMER 2001
with COOLDAYS during all time periods (the values for the climatic variablesdo not change between the decades). Additional problems with multicollinearityfor the variables CSINEQ and INEQ were also found in some of the timeperiods. Regressions of all other independent variables on CSINEQ and INEQindicated that, during the 1980s, CSINEQ was strongly correlated with NONWHand COLLED, and that during the 1990s, INEQ was strongly correlated withNONWH, OVER64, and IMMIG. The presence of high degrees ofmulticollinearity indicates that variables tend to be explaining similarphenomena and thus may be redundant. In order to reduce problems ofmulticollinearity, PCAP, HSED, and HEATDAYS were dropped from all of theregressions, while CSINEQ was dropped from the 1980s regressions and INEQwas dropped from the 1990s regressions.19
The next section presents results of the 2SLS models for each of the threetime periods. In interpreting the results, one important caveat is that the analysisdoes not directly distinguish between suburban and city growth that occur as theresult of decentralization out of the central city versus growth that occurs as theresult of regional shifts in population and employment. Suburban growth, inparticular, may result from a combination of decentralization out of the centralcity and in-migration from other areas of the country (Adams et al. 1996).Although the regional dummy variables partially control for regional differencesin population and employment growth rates, which would affect both cities andsuburbs, these controls may not fully separate the different sources of suburbangrowth.
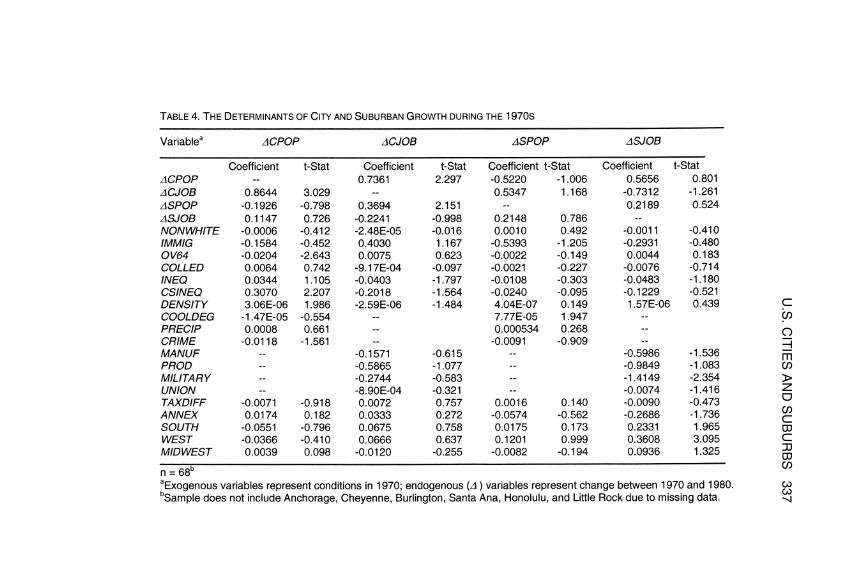
Empirical ResultsThe 1970s. Table 4 presents results of the models for the 1970s. The results
indicate the presence of both types of postulated simultaneity: betweenpopulation and employment and between cities and suburbs. In the cityequations, there is strong evidence of simultaneity between population andemployment. Because many cities experienced population and employmentdecline during the 1970s (and during later decades), the positive feedbackbetween population and employment indicates that population and job losseswithin cities tended to reinforce each other. For suburbs, by contrast, there is noevidence of simultaneity between population and employment during the 1970s.Rather, growth of suburban employment and population tended to occurindependently. Concerning the question of simultaneity between city andsuburban growth, the strongest evidence appears in the city employmentequation, where growth of suburban population is found to have a positive andsignificant effect on city employment growth. This finding indicates that duringthe 1970s, growth of suburban populations, rather than detracting from centralcities, actually helped to create jobs within cities.
U.S
.CIT
IES
AN
DS
UB
UR
BS
337
338 GROWTH AND CHANGE, SUMMER 2001
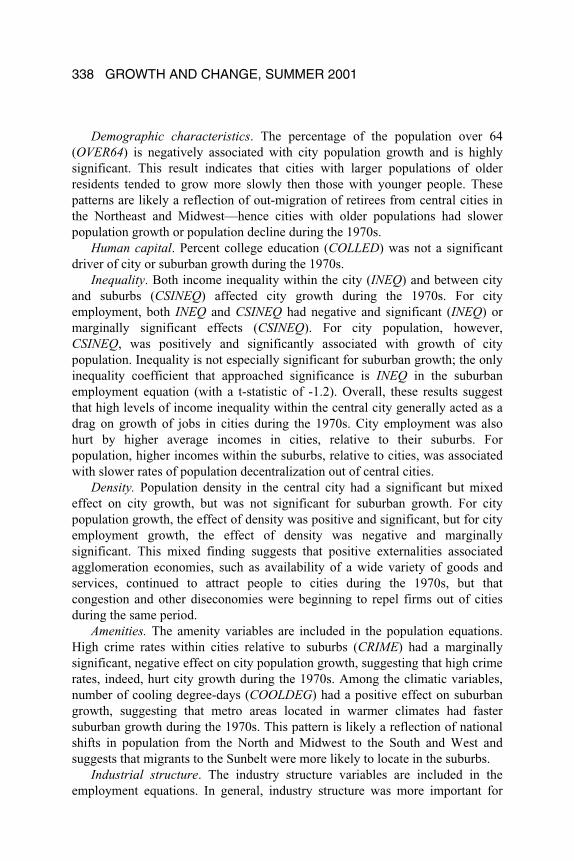
Demographic characteristics. The percentage of the population over 64(OVER64) is negatively associated with city population growth and is highlysignificant. This result indicates that cities with larger populations of olderresidents tended to grow more slowly then those with younger people. Thesepatterns are likely a reflection of out-migration of retirees from central cities inthe Northeast and Midwest—hence cities with older populations had slowerpopulation growth or population decline during the 1970s.
Human capital. Percent college education (COLLED) was not a significantdriver of city or suburban growth during the 1970s.
Inequality. Both income inequality within the city (INEQ) and between cityand suburbs (CSINEQ) affected city growth during the 1970s. For cityemployment, both INEQ and CSINEQ had negative and significant (INEQ) ormarginally significant effects (CSINEQ). For city population, however,CSINEQ, was positively and significantly associated with growth of citypopulation. Inequality is not especially significant for suburban growth; the onlyinequality coefficient that approached significance is INEQ in the suburbanemployment equation (with a t-statistic of -1.2). Overall, these results suggestthat high levels of income inequality within the central city generally acted as adrag on growth of jobs in cities during the 1970s. City employment was alsohurt by higher average incomes in cities, relative to their suburbs. Forpopulation, higher incomes within the suburbs, relative to cities, was associatedwith slower rates of population decentralization out of central cities.
Density. Population density in the central city had a significant but mixedeffect on city growth, but was not significant for suburban growth. For citypopulation growth, the effect of density was positive and significant, but for cityemployment growth, the effect of density was negative and marginallysignificant. This mixed finding suggests that positive externalities associatedagglomeration economies, such as availability of a wide variety of goods andservices, continued to attract people to cities during the 1970s, but thatcongestion and other diseconomies were beginning to repel firms out of citiesduring the same period.
Amenities. The amenity variables are included in the population equations.High crime rates within cities relative to suburbs (CRIME) had a marginallysignificant, negative effect on city population growth, suggesting that high crimerates, indeed, hurt city growth during the 1970s. Among the climatic variables,number of cooling degree-days (COOLDEG) had a positive effect on suburbangrowth, suggesting that metro areas located in warmer climates had fastersuburban growth during the 1970s. This pattern is likely a reflection of nationalshifts in population from the North and Midwest to the South and West andsuggests that migrants to the Sunbelt were more likely to locate in the suburbs.
Industrial structure. The industry structure variables are included in theemployment equations. In general, industry structure was more important for

U.S. CITIES AND SUBURBS 339
suburban growth than for city growth during the 1970s. The share of theeconomy in the military (MILITARY) was negative and highly significant forsuburban employment growth. Manufacturing shares also have a negative effecton suburban employment growth, but the coefficient was only marginallysignificant with a t-statistic of -1.54. These results indicate that cities with highconcentrations of employment in the military and in manufacturing tended toexperience slower rates of employment decentralization.
Business and fiscal climate. Unionization (UNION) is included in theemployment equations. As expected, unionization is negative in both cases, butit is not significant at conventionally accepted levels (though it is marginallysignificant for suburban growth, with a t-statistic of -1.4). City-suburban taxdifferentials (TAXDIFF), which may affect the location choices of both firmsand individuals, are included in both the population and the employmentequations. The city-suburban tax differential variables are not statisticallysignificant in any of the equations.
Annexation. According the Rusk’s thesis, annexation of land by the centralcity is expected to have a positive effect on city growth and suburban growth.The signs on the annexation variables do not support this thesis. For cities,annexation control variables have positive signs, an indication that growth ofcity land area was positively associated with growth of city population andemployment. For suburbs, however, the annexation controls have negative signs,indicating that annexation of land by cities occurred at the expense of jobs andpopulation in the suburbs. Notwithstanding its sign pattern, the annexationvariable is only significant as a determinant of suburban employment:annexation of land by the central city had a significant, negative effect onsuburban employment during the 1970s.
Region. The regional dummy variables are significant for suburbanemployment growth. In particular, the values for the WEST and SOUTH, arepositive and strongly significant, a result which is consistent with the conclusionthat suburban growth patterns during the 1970s tended to be influenced bynational shifts in the location of economic activity.
The 1980s. Table 5 presents results of the model for the 1980s. As was thecase during the 1970s, there is strong evidence of simultaneity betweenemployment and population growth within cities during 1980s: populationgrowth (decline) is associated with employment growth (decline) and vice versa.For suburbs, results for the 1980s reveal emerging linkages between suburbanemployment and suburban population. During the 1980s, suburban employmentgrowth had a positive and significant effect on suburban population growth,suggesting that people were following jobs into the suburbs. Concerninginteractions between cities and suburbs, the only statistically significant effect

340G
RO
WT
HA
ND
CH
AN
GE
,SU
MM
ER
2001

U.S. CITIES AND SUBURBS 341
during the 1980s is that suburban employment growth had a positive effect oncity employment growth. As was evidenced during the 1970s, this resultindicates complementary between suburbs and cities: job growth in the suburbscontributed to job growth in cities in the 1980s.
Demographic characteristics. During the 1980s, percentage nonwhite isnegatively associated with city employment but positively associated withsuburban employment (both effects are significant or marginally significant).This result indicates that cities with higher concentrations of minoritypopulations were losing jobs to the suburbs at a faster rate than other cities.Population over 64 is also positively associated with growth in suburbanemployment, suggesting that cities with older populations experienced morerapid decentralization of jobs to suburbs.
Human capital. As was the case during the 1970s, COLLED is not asignificant driver of city or suburban growth in the 1980s.
Inequality. High levels of income inequality within cities had a negativeeffect on city population growth during the 1980s, a result that suggests thathighly unequal cities grew more slowly than other cities during the 1980s.Inequality was not a significant driver of suburban growth during the 1980s.
Density. Results for the population density variable provide evidence of thepresence of diseconomies of agglomeration within cities during the 1980s.DENSITY is negatively associated with city population growth but is positivelyassociated with suburban population growth. Although the coefficient onDENSITY in the suburban model is only marginally significant, these resultssuggest that congestion and other negative externalities within cities contributedto decentralization of populations from cities to suburbs during the decade of the1980s.
Amenities. Results for the amenity variables during the 1980s are similar tothose found during the 1970s. High rates of crime in cities, holding suburbancrime constant, were negatively associated with city population growth duringthe 1980s, suggesting that CRIME contributed to decentralization of citypopulations. (CRIME is positively associated with suburban population growthduring the 1980s, but the coefficient is not statistically significant.) Results forthe climatic variables indicate that, as during the 1970s, metropolitan areas withwarmer climates (high numbers of cooling degree-days) experienced fastersuburban population growth than did other cities. As discussed above, this resultis mostly likely a reflection of migration of population to suburban areas ofSunbelt cities from other parts of the country.
Industrial structure. During the 1980s, cities with higher shares of producerservices grew faster than other cities, a finding that confirms that producerservices were an important driver of city growth during the 1980s. Industry

342 GROWTH AND CHANGE, SUMMER 2001
structure is not significant as a determinant of suburban employment growthduring the 1980s.
Business and fiscal climate. Business and fiscal climate were generally notsignificant during the 1980s. The only variable in this category that is evenmarginally significant is percent unionization, which was negatively associatedwith suburban employment growth during the 1980s (but with a t-statistic ofonly -1.3).
Annexation and region. As in the 1970s, the annexation controls havepositive signs on city growth and negative signs on suburban growth. However,the coefficients on ANNEX are not statistically significant in any of theequations. The regional controls are also not statistically significant in any of theequations for the 1980s.
The 1990s. The results of the 1990s model are presented in Table 6.Evidence of both types of simultaneity also appears during the 1990s. For cities,population and employment are, once again, jointly determined. For suburbs, asin the 1980s, employment growth is a significant driver of population growth,suggesting that people continued to follow jobs into the suburbs. Concerning theissues of simultaneity between cities and suburbs, one of the most interestingresults that emerges in the 1990s model, is the strong, but inverse relationshipbetween suburban employment growth and city population growth. In theequation for city population, growth of suburban employment has a significant,but negative effect on city population growth. Similarly, in the equation forsuburban employment, city population growth has a negative and significanteffect on growth of suburban employment. This negative feedback relationshipbetween growth of suburban jobs and decline of city population suggests thatgrowth of job opportunities in the suburbs drew people out of the central citiesduring the period from 1990 to 1997. Results for the 1990s also reveal someevidence of complementarity between city and suburban employment. Growthof city employment had a positive effect on suburban employment, while growthof suburban employment had a positive effect on city employment, though inboth cases the coefficients are only marginally significant.
Demographic characteristics. NONWHITE is significant in both of the cityequations, but the sign changes between them. As in the 1980s, NONWHITE isnegatively associated with growth of city employment, suggesting that citieswith high concentrations of minority residents were losing jobs to the suburbsmore rapidly than other cities. However, high populations of nonwhite residentsin central cities are positively associated with growth of city population, apossible indication of the continued tendency for new minority residents toconcentrate in central cities. City demographic conditions are not significantdrivers of suburban growth during the 1990s.
Human capital. As was the case during the 1970s and 1980s, COLLED isnot a significant determinant of city or suburban growth in the 1990s.

U.S
.CIT
IES
AN
DS
UB
UR
BS
343
344 GROWTH AND CHANGE, SUMMER 2001
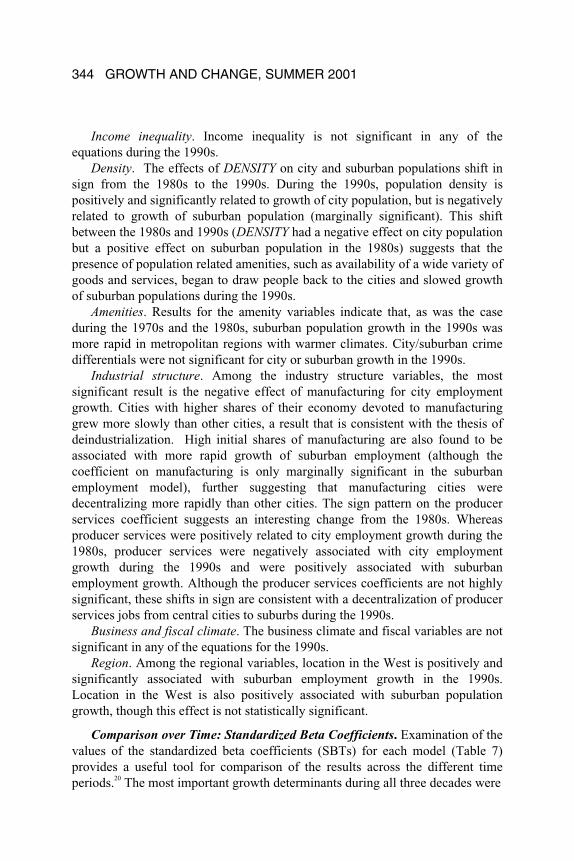
Income inequality. Income inequality is not significant in any of theequations during the 1990s.
Density. The effects of DENSITY on city and suburban populations shift insign from the 1980s to the 1990s. During the 1990s, population density ispositively and significantly related to growth of city population, but is negativelyrelated to growth of suburban population (marginally significant). This shiftbetween the 1980s and 1990s (DENSITY had a negative effect on city populationbut a positive effect on suburban population in the 1980s) suggests that thepresence of population related amenities, such as availability of a wide variety ofgoods and services, began to draw people back to the cities and slowed growthof suburban populations during the 1990s.
Amenities. Results for the amenity variables indicate that, as was the caseduring the 1970s and the 1980s, suburban population growth in the 1990s wasmore rapid in metropolitan regions with warmer climates. City/suburban crimedifferentials were not significant for city or suburban growth in the 1990s.
Industrial structure. Among the industry structure variables, the mostsignificant result is the negative effect of manufacturing for city employmentgrowth. Cities with higher shares of their economy devoted to manufacturinggrew more slowly than other cities, a result that is consistent with the thesis ofdeindustrialization. High initial shares of manufacturing are also found to beassociated with more rapid growth of suburban employment (although thecoefficient on manufacturing is only marginally significant in the suburbanemployment model), further suggesting that manufacturing cities weredecentralizing more rapidly than other cities. The sign pattern on the producerservices coefficient suggests an interesting change from the 1980s. Whereasproducer services were positively related to city employment growth during the1980s, producer services were negatively associated with city employmentgrowth during the 1990s and were positively associated with suburbanemployment growth. Although the producer services coefficients are not highlysignificant, these shifts in sign are consistent with a decentralization of producerservices jobs from central cities to suburbs during the 1990s.
Business and fiscal climate. The business climate and fiscal variables are notsignificant in any of the equations for the 1990s.
Region. Among the regional variables, location in the West is positively andsignificantly associated with suburban employment growth in the 1990s.Location in the West is also positively associated with suburban populationgrowth, though this effect is not statistically significant.
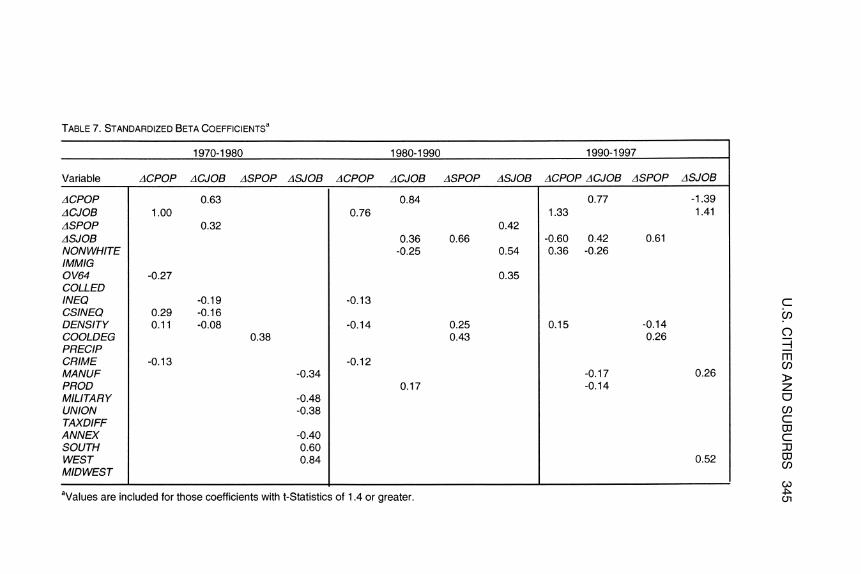
Comparison over Time: Standardized Beta Coefficients. Examination of thevalues of the standardized beta coefficients (SBTs) for each model (Table 7)provides a useful tool for comparison of the results across the different timeperiods.20 The most important growth determinants during all three decades were
U.S
.CIT
IES
AN
DS
UB
UR
BS
345

346 GROWTH AND CHANGE, SUMMER 2001
the endogenous city growth variables (all of which are highly statisticallysignificant). In each of the city population equations, changes in cityemployment have the largest effect (i.e., the largest standardized coefficients).Similarly, in each of the city employment equations, city population growth hadthe largest effect. These results further reinforce the finding of strong feedbackrelationships between population and employment growth in cities. For citiesthat experienced in-migration of people or jobs over the study period, thesefeedback linkages suggest that these gains tended to be self-reinforced. For citieslosing population or employment, however, these results indicate the existenceof a downward spiral of urban decline, with population losses exacerbating joblosses and vice versa.
For suburbs, the key determinants of growth varied over the three decades.During the 1970s, climate and region were the key drivers of suburbanpopulation and employment growth, respectively. During the 1980s and 1990s,the linkages between population and employment, and connections to the centralcity become more important for suburban growth. In the suburban populationequations for both the 1980s and the 1990s, suburban employment growth is themost important growth determinant. Clearly, growth of job opportunities in thesuburbs was drawing people to suburban areas during these two decades. Forsuburban employment growth, central city demographics, includingNONWHITE and OVER64, were key variables during the 1980s. In the 1990s,the most important determinant of suburban employment growth is growth incity employment. Decline in city population, which had a positive effect onsuburban employment, was also a leading determinant of suburban employmentgrowth in the 1990s.
ConclusionsDifferential rates of growth and decentralization are processes that
characterized U.S. urban areas over the past three decades. Efforts to account forthese processes have emphasized factors such as differences in endowments,industrial structure, and fiscal policies across cities, as well as regional location.Recent work in this area has also paid increasing attention to the role of centralcity conditions in influencing the overall economic health of metropolitan areas,and particularly the growth of suburban areas. This paper considered thedeterminants of city and suburban growth and interrelationships between cityand suburban growth during each decade between 1970 and 1997.
The modeling approach adopted in the study allowed for two types ofsimultaneity, between population and employment, and between cities andsuburbs, while also taking into account a range of other factors. Concerning thequestion of simultaneity between population and employment, the evidence forsimultaneity was very strong for cities, but less so for suburbs. There wasevidence of bidirectionality between population growth and employment growth

U.S. CITIES AND SUBURBS 347
in cities during all three decades. Given that many cities experienced both joband population losses over the study period, this finding indicates that thesephenomena were interrelated: job losses in the central city led to population out-migration from the central city, but population out-migration also led to joblosses. For suburbs, growth of employment had a positive effect on suburbanpopulation growth during both the 1980s and 1990s. During these two decades,people were following jobs into the suburbs. In the 1970s, suburban populationand employment growth occurred relatively independently, and instead wereprimarily influenced by larger-scale, national shifts in population andemployment.
Regarding the question of simultaneity between cities and suburbs the resultssuggest that suburban growth had an important effect on cities during all threedecades, while city growth was most important for suburbs during the 1990s.Concerning the effects of suburban growth on cities, results indicated that duringthe 1970s, suburban population growth had a positive effect on growth of cityemployment. Similarly, during the 1980s and 1990s, growth of suburbanemployment had a positive effect on city employment growth. Overall, thesefindings suggest that growth in suburban population and suburban jobs tended toenhance city employment opportunities. These enhancements may haveoccurred through income and industry-related linkages: income generated viasuburban employment growth led to increased spending in cities, therebycreating city jobs; similarly, growth of suburban industries increased demand forinputs produced in the city, thereby generating increased city employment.Although growth of suburban employment had a positive effect on cityemployment, it generally had the opposite effect city population. During 1990s,and to some extent during the 1980s, growth of suburban employment wasassociated with declining city population. This result indicates that jobopportunities in the suburbs were drawing people out of the cities during bothdecades.
This finding — that growing job opportunities in the suburbs contributed todecentralization of population out of the central cities — is reinforced by the factthat city population growth during the 1990s was also inversely related tosuburban employment growth. Concerning the other effects of city growth onsuburbs, the most noteworthy effect occurred during the 1990s when cityemployment growth contributed to suburban employment growth. This resultindicates the presence of a positive feedback between cities and suburbs duringthe 1990s, since suburban employment growth was also found to have a positiveeffect on city employment growth in this decade. The existence of positivefeedback linkages between cities and suburbs during the 1990s suggests that therelative economic prosperity experienced by urban areas during the 1990s was

348 GROWTH AND CHANGE, SUMMER 2001
felt by both cities and suburbs, with job growth in either location enhancing thejob opportunities in the other location.
With regard to the other determinants of city and suburban growth, theresults suggest that city growth tended to be strongly tied to conditions withinthe city, particularly demographics, population density (which had both positiveand negative effects), crime rates, and income inequality. Industry structure wasalso important for cities, especially during the 1980s and 1990s. Suburbangrowth, by contrast, tended to be strongly influenced by national and regionalfactors, such as climate and regional location, although city demographics andcity population density were also important during the 1980s and 1990s.
Several interesting “negative” findings also emerged from the analysis. Onenotable result was the lack of significance of the human capital variable(COLLED) in any of the city or suburban models. Although other studies havefound that educational attainment influences long-run patterns of urban growth(e.g., Glaeser et al. 1995), results of the present study suggest that factors suchas demographics, industry structure, and regional location tend to be moreimportant as drivers of growth during shorter time periods. Another negativeresult was the lack of significance of city-suburban tax differentials as adeterminant of either city or suburban growth during any of the decades.Although this finding runs counter to the expectation that differential tax rateswould influence the location decisions of households and firms, the finding isconsistent with other studies that have found that tax differentials haveinsignificant effects on city and suburban growth. Finally, one of the mostsurprising negative results concerns the role of annexation in metro growth.21
Contrary to the thesis proposed by Rusk (1993), which suggests that growth ofcity land area is necessary for overall metropolitan economic health, there wasno evidence that annexation of suburban areas by cities leads to more rapidgrowth of metros overall. Annexation generally was not significant as adeterminant of either city or suburban growth, though it did act as a deterrent togrowth of suburban employment during the 1970s.
NOTES1. Recent analyses include Carlino and Mills (1987), Clark and Murphy (1996), Crihfield
and Panggabean (1995), Dalenberg and Partridge (1995), Drennan et al., (1996),Glaeser, et. al. (1992), Glaeser et al. (1995), Frey and Fielding (1995), Leichenko andErickson (1997), Mills (1986), Mills and Lubuele (1995), Mulligan et al. (1997),O’Huallachain (1992), and O’Huallachain and Satterthwaite (1992). For studies ofregions in Europe, many in parallel with those concerning the United States seeCheshire and Carbonaro (1996), Dignan (1995), Dunford (1993), Hall (1993), andRodriguez-Pose (1997). A related stream of research involves the narrowing gapbetween rich and poor regions. See Barro (1991) and Barro and Sala-i-Martin (1991),Bauer and Mason (1992), Fan and Casetti (1994), Glickman (1997), Romer (1990),Sala-i-Martin (1996) and others.
U.S. CITIES AND SUBURBS 349
2. See footnote 9 for a description of the cities included in the study.3. Bartik (1991) and Kusmin (1994) provide reviews of the empirical literature published
before 1992.4. On educational attainment see Crandall (1993), Glaeser et al. (1995), and Beeson and
Montgomery (1993). Drennan et al. (1996), and Glaeser et al. (1995) discuss industrialstructure.
5. Glaeser et al. (1995), for example, modeled metro growth between 1960 and 1990 as afunction of city conditions in 1960. See also Bradford and Kelejian (1973), Ledeburand Barnes (1992), Savitch et al. (1993), and Voith (1992).
6. See Glaeser et al. (1995), Beeson and Montgomery (1993), and Drennan et al. (1996)for examples of these three types of analysis.
7. Some important recent studies of the relationships between central cities and thesuburbs include Voith (1998), Downs (1997), Hill and Wolman (1997), Mieszkowskiand Mills (1993), Mills (1992), Orfield (1997), and Rusk (1993).
8. Hill et al. (1995) provide a detailed review and critique of the empirical literature onthe “suburban dependence” hypothesis.
9. The State of the Nation’s Cities or SONC database was constructed at the Center forUrban Policy Research (CUPR) at Rutgers University for the U.S. Department ofHousing and Urban Development in anticipation of the 1996 United Nations “HabitatII” Conference in Istanbul. The database consists of more than 2,000 variables on 77cities and 74 metropolitan areas. The database includes the Nation’s 50 largest cities aswell as a number of smaller urban areas. Categories of variables in the data setinclude: employment and economic development, demographic factors, housing andland use, poverty and income distribution, fiscal conditions and the public sector, andsocial, health, environment and other indicators of urban life. The database can befound on at the CUPR Web site at http://policy.rutgers.edu/cupr/.
10. Three of the metro areas in the database contain two central cities. Theseinclude the Los Angeles metro area, which contains Los Angeles and LongBeach, the Minneapolis metro area, which contains Minneapolis and St.Paul, and the Kansas City metro area which contains Kansas City, Missouriand Kansas City, Kansas. Several of the cities in the SONC database werenot included in the final regression analyses due to missing data for certainvariables.
11. Studies demonstrating the interdependence between population and employment bothwithin and across U.S. cities and counties include Mills (1986), Carlino and Mills(1987), Clark and Murphy (1996), Glavac et al. (1998), Mulligan et al. (1997),Boarnot (1994), and Levernier and Cushing (1994), among others.
12. “Natural evolution” is a phrase used by Mieszkowski and Mills (1993) to summarizea broad category of models that regard suburbanization as a natural outcome ofprocesses of residential filtering, reinforced by transportation innovations which havereduced commuting times and costs.
13. In the model for the 1970s, nonwhites include blacks and non-black Hispanics; aseparate Asian category was not available for 1970. In models for the 1980s and1990s, nonwhites include blacks, Hispanics and Asians.

350 GROWTH AND CHANGE, SUMMER 2001
14. It is important to note that international migrants concentrate in a few “gateway”metropolitan areas. Nearly half of all international migrants went to just five of theSONC metros: Chicago, Los Angeles, Miami, New York, and Washington DC.These migrants settled primarily in central cities (Glickman et al. 1996).
15. Note that the high school and college education variables are not strictly comparableover time for two reasons. First, decennial census tabulations of city and metro highschool education report high school educational attainment of persons aged 18 andover. For the 1970 census tabulations the universe is persons aged 25 and over.Second, 1980 and 1990 decennial census figures reflect changes to the censusquestionnaire in 1990. For 1980, “high school graduates” refers to those personscompleting four years of high school. For 1990, tabulations distinguish betweenpersons earning a degree (or equivalency) and those completing grades 9 to 12without receiving a degree. For 1990, the city and metro high school educationvariables report the percentage of all persons aged 18 and over who earned a highschool diploma or equivalency (including all persons attaining higher levels ofeducation). For 1980, “college graduates” refers to those persons completing four ormore years of college; for 1990, the tabulations distinguish between persons whoearned a bachelor’s degree and those completing one or more years of collegewithout receiving a degree. In 1990, COLLED reports the percentage of all personsaged 18 and over who earned bachelor’s degrees (including those completinggraduate or professional degrees).
16. State unionization rates were used because these data are not available for cities.17. Data on tax revenues are based on the central county and suburban counties in each
metropolitan area.18. Because employment data by place of work are not available for cities in 1997 (an
off-census year), central county employment totals were used for the 1990s analysis.Use of central city and suburban county data during the 1990s meant that metro areaswhere the central city and suburbs are located in only one county were excluded fromthe analysis. Other studies that use central and suburban counties to approximatecentral cities and suburbs include Voith (1998) and Levernier and Cushing (1994).
19. Dropping the multicollinear variables does not, of course, solve the problem of highcorrelations between explanatory variables; rather the variables that were retainedmay be interpreted as partially representing the phenomenon measured by thosevariables that were dropped.
20. While the actual values of the standardized coefficients are not comparable acrossmodels, it is possible to compare which variables have the highest values during eachtime period.
21. One limitation of Rusk’s thesis which was not directly addressed in the present studywas the need to distinguish between cities that are landlocked, cities that are unable togrow due to growth control legislation, and cities that are, essentially, unbounded.One direction for further research might involve partitioning the MSA sample basedon these types of geographical differences. This type of partitioning would allowisolation of differences in city and suburban growth determinants and in the linkagesbetween cities and suburbs, based on the geographic structure of the metro area.

U.S. CITIES AND SUBURBS 351
REFERENCESAdams, C.F., H.B. Fleeter, Y. Kim, M. Freeman, and I. Cho. 1996. Flight from blight
and metropolitan suburbanization revisited. Urban Affairs Review 31: 529-543.Bartik, T.J. 1991. Who benefits from state and local economic development policies?
Kalamazoo, Michigan: W.E. Upjohn Institute.Barro, R. 1991. Economic growth in a cross-section of countries. Quarterly Journal of
Economics 106: 407-433.Barro R., and X. Sala-i-Martin. 1991. Convergence across states and regions. Brookings
Papers on Economic Activity I: 107-182.Bauer, J., and A. Mason. 1992. The distribution of income and wealth in Japan. Review
of Income and Wealth 38: 403-428.Beeson, P., and E. Montgomery. 1993. The effects of colleges and universities on local
labor markets. The Review of Economics and Statistics 75.4: 753-766.Boarnot, M.G. 1994. An empirical model of intrametropolitan population and
employment growth. Papers in Regional Science 73.2: 135-152.Bradford, D.F. and H.H. Kelejian. 1973. An econometric model of the flight to the
suburbs, Journal of Political Economy 81: 566-589.Carlino, G.A., and E.S. Mills. 1987. The determinants of county growth. Journal of
Regional Science 27: 39-54.Center for Urban Policy Research. 1998. State of the nation’s cities: A comprehensive
database on American cities and suburbs. Rutgers University. New Brunswick, NJ.Cheshire, P., and G. Carbonaro. 1996. Urban economic growth in Europe: Testing
theory and policy prescriptions. Urban Studies 33:111-1128.Clark, D.E., and C.A. Murphy. 1996. Countywide employment and population growth:
An analysis of the 1980s. Journal of Regional Science 36.2: 235-256.Crandall, R.W. 1993. Manufacturing on the move. Washington DC: The Brookings
Institute.Crihfield, J.B., and M.P.H. Panggabean. 1995. Growth and convergence in U.S. cities.
Journal of Urban Economics 38.2: 138-165.Dalenberg, D.R., and M.D. Partridge. 1995. The effects of taxes, expenditures, and
public infrastructure on metropolitan area employment. Journal of RegionalScience 35.4: 617-640.
Dignan, T. 1995. Regional disparities and regional policy in the European Union.Oxford Papers of Economic Policy 11:64-92.
Downs, A. 1997. The challenge of our declining big cities. Housing Policy Debate 8.2:359-408.
Drennan, M., E. Tobier, and J. Lewis. 1996. The interruption of income convergenceand income growth in large cities in the 1980s. Urban Studies 33.1: 63-82.
Dunford, M. 1993. Regional disparities in the European Economic Union: Evidencefrom the REGIO databank. Regional Studies 27: 727-743.
Fan, C.C., and E. Casetti. 1994. The spatial and temporal dynamics of U.S. regionalincome inequality, 1950-1989. Annals of Regional Science 28: 177-198.
Frey, W.H., and E.L. Fielding. 1995. Changing urban populations: Regionalrestructuring, racial polarization, and poverty concentration. Cityscape: A Journalof Policy Development 1.2: 1-66.

352 GROWTH AND CHANGE, SUMMER 2001
Glaeser, E.L., H.D. Kallal, J.A. Scheinkman, and A. Shleifer. 1992. Growth in cities.Journal of Political Economy 100: 1126-1152.
Glaeser, E.L., J.A. Sheinkman, and A.Shleifer. 1995. Economic growth in a cross-section of cities. Journal of Monetary Economics 36:117-143.
Glavac, S.M., A.C. Vias, and G.F. Mulligan. 1998. Population and employmentinteractions in the growth of United States micropolitan centers. Urban Geography19.7: 632-656.
Glickman, N.J. 1997. Prosperity and inequality among America’s cities and regions,written for a Carnegie Corporation conference on Restoring Broadly SharedProsperity, Washington DC (May); forthcoming in conference volume edited byRay Marshall.
Glickman, N.J., M.L. Lahr, and E.K. Wyly. 1996. The state of the nation’s cities:America’s changing urban life. Washington DC: U.S. Department of Housing andUrban Development.
Hackworth, J.H. 2000. Third wave gentrification. Ph.D. Dissertation. Department ofGeography, Rutgers University. New Brunswick, NJ.
Hall, P. 1993. Forces shaping urban Europe, Urban Studies 30:883-898.Hill, E.W. and H.L. Wolman. 1997. Accounting for the change in income disparities
between U.S. central cities and their suburbs from 1980 to 1990. Urban Studies34.1: 43-60.
Hill, E.W., H.L. Wolman, and C.C. Ford III. 1995. Can suburbs survive without theircentral cities? Examining the suburban dependence hypothesis. Urban AffairsReview 31.2: 147-174.
Ihlanfeldt, K.R. 1995. The importance of the central city to the regional and nationaleconomy: A review of the arguments and empirical evidence. Cityscape: A Journalof Policy Development and Research 1.2: 125-150.
———. 1994. The spatial mismatch between jobs and residential locations within urbanareas. Cityscape: A Journal of Policy Development and Research 1.1: 219-244.
Kusmin, L.D. 1994. Factors associated with the growth of local and regionaleconomies: A review of selected empirical literature. Washington DC: U.S.Department of Agriculture, Economic Research Service.
Ledebur, L.C., and W.R. Barnes. 1992. City distress, metropolitan disparities andeconomic growth. National League of cities: Washington DC.
Leichenko, R.M., and R.A. Erickson. 1997. Foreign direct investment and state exportperformance. Journal of Regional Science 37:307-329.
Levernier, W., and B. Cushing. 1994. A new look at the determinants of theintrametropolitan distribution of population and employment. Urban Studies 31.8:1391-1405.
Mieszkowski, P., and E.S. Mills. 1993. The causes of metropolitan suburbanization.Journal of Economic Perspectives 7 (3): 135-147.
Mills, E.S. 1986. Metropolitan central city population and employment growth duringthe 1970s, in M. H. Preston and R. E. Quandt (eds.), Prices, competition andequilibrium. Totowa, NJ: Barnes and Noble, 268-284.
________. 1992. The measurement and determinants of suburbanization. Journal ofUrban Economics 32: 377-387.

U.S. CITIES AND SUBURBS 353
Mills, E.S. and L.S. Lubuele. 1997. Inner Cities. Journal of Economic Literature 35:727-756.
Mills, E.S., and L.S. Lubuele. 1995. Projecting growth of metropolitan areas. Journal ofUrban Economics 37: 344-360.
Mulligan, G.F., Alexander C. Vias, and Sonya M. Glavac. 1997. Initial diagnostics of aregional adjustment model. Discussion Paper, Department of Geography andRegional Development, University of Arizona.
O’Huallachain, B. 1992. Economic structure and growth of metropolitan areas, in EdwinS. Mills and John F. McDonald (eds.), Sources of metropolitan growth. NewBrunswick, NJ: Center for Urban Policy Research, 51-85.
O’Huallachain, B., and M.A. Satterthwaite. 1992. Sectoral growth patterns at themetropolitan level: An evaluation of economic development incentives. Journal ofUrban Economics 31: 25-58.
Orfield, M. 1997. Metro politics: A regional agenda for community and stability.Washington DC: The Brookings Institution.
Palumbo, G., S. Sacks and M. Wasylenko. 1990. Population decentralization withinmetropolitan areas: 1970-1980. Journal of Urban Economics 27: 151-167.
Rodriguez-Pose, A. 1997. Convergence or divergence? Regional responses to socio-economic change in Western Europe. Research Papers in Environmental andSpatial Analysis #46. London: London School of Economics, Department ofGeography.
Romer P.M. 1990. Capital, labor, and productivity. Brookings Papers on EconomicActivity, 337-367.
Rusk, D. 1993. Cities without suburbs. Washington DC: Woodrow Wilson Center Press.Savitch, H.V., D. Collins, D. Sanders, and J. Markham. 1993. Ties that bind: central
cities, suburbs, and the new metropolitan region. Economic Development Quarterly7.4: 341-357.
Sala-i-Martin X. 1996. Regional cohesion: Evidence and theories of regional growth andconvergence. European Economic Review 40: 1325-1352.
Steinnes, D., and Fisher, W. 1974. An econometric model of intraurban location.Journal of Regional Science 14: 65-80.
U.S. Bureau of the Census. 2000. Population estimates program. Metropolitan areas.(http://www.census.gov/population/www/estimates/metropop.html).
———. 2000. Population estimates program. Populations of cities.(http://www.census.gov/population/www/estimates/citypop.html).
U.S. Department of Housing and Urban Development. 1997. The state of the cities.Office of Policy Development and Research, June.
Voith, R. 1992. City and suburban growth: Substitutes or complements? BusinessReview (Federal Reserve Bank of Philadelphia) (September/October): 21-31.
———. 1996. Central city decline: Regional or neighborhood solutions? BusinessReview (Federal Reserve Bank of Philadelphia) (March/April): 3-6.
———. .1998. Do suburbs need cities? Journal of Regional Science 38: 445-464.Wasylenko, M. 1997. Taxation and economic development: The state of the economic
literature. New England Economic Review (March/April): 37-52.

354 GROWTH AND CHANGE, SUMMER 2001
White, H. 1980. A heteroskedasticity-consistent covariance matrix estimator and a directtest for heteroskedasticity. Econometrica 48: 817-838.
Wilson, W.J. 1987. The truly disadvantaged: The inner city, the underclass and publicpolicy. Chicago: University of Chicago Press.
Wyly, E.K., N.J Glickman, M.L. Lahr. 1998. A top ten list of things to know aboutAmerican cities. Cityscape 3: 7-32.
Wyly, E.K., and D.J. Hammel. 1999. Islands of decay in seas of renewal: Housingpolicy and the resurgence of gentrification. Housing Policy Debate 10.4: 711-771.
