growing trends in canadian society - weebly
TRANSCRIPT

Growing Trends in Canadian Society
Current Trends s
Immigration Education Rates are continuing at about ¼
million people per year since 2006. The ratio for 2012 is a mix of around 62% economic, 26% family, and 13% refugee class.
Most immigrants settle in Toronto, Montreal & Vancouver.
Today most new immigrants come from Africa & Asia; in the past century most came from Europe & the UK.
Canada has a knowledge based economy – to be qualified to work in this economy additional post secondary training is required for many.
Average tuition costs in 2010 were $5,138.00 – $10,000; International students pay $20,000.00 – $40,000. Access in not equal to all Canadians.
Income is related to level of education, in 2009 employment rate was 55% for not finishing high school; 77% high school diploma; 81% college; 82% university.
Current Trends s
Economy & Youth Overall Economy In 2006 34% boys & 40%
girls age 15 – 18 had a job more girls work but boys work longer hours (working over 20 hours negatively affects students).
Employment Standards Act 2000 limits the work day to 8 hours with a mandatory 30 minute break within 5 hours; max 44 hours /week
2012 youth unemployment rates 15-24 was 14.7%; ½ of all job losses during recession even though they only make up 16.5% of the workforce
In 2012, 7.4% Canadians were unemployed; job loss is not limited to working classes either
Debt levels are on the rise; debt to income ratio has risen 150% in the last decade (for every after tax $ we make we typically owe 1.51) – mortgage, education, car, credit
Debt levels tend to peak between 31 & 35 and then level off; younger Canadian debt is linked to credit cards & education, older owe mortgage &lines of credit
Current Trends s Generations of Canadians
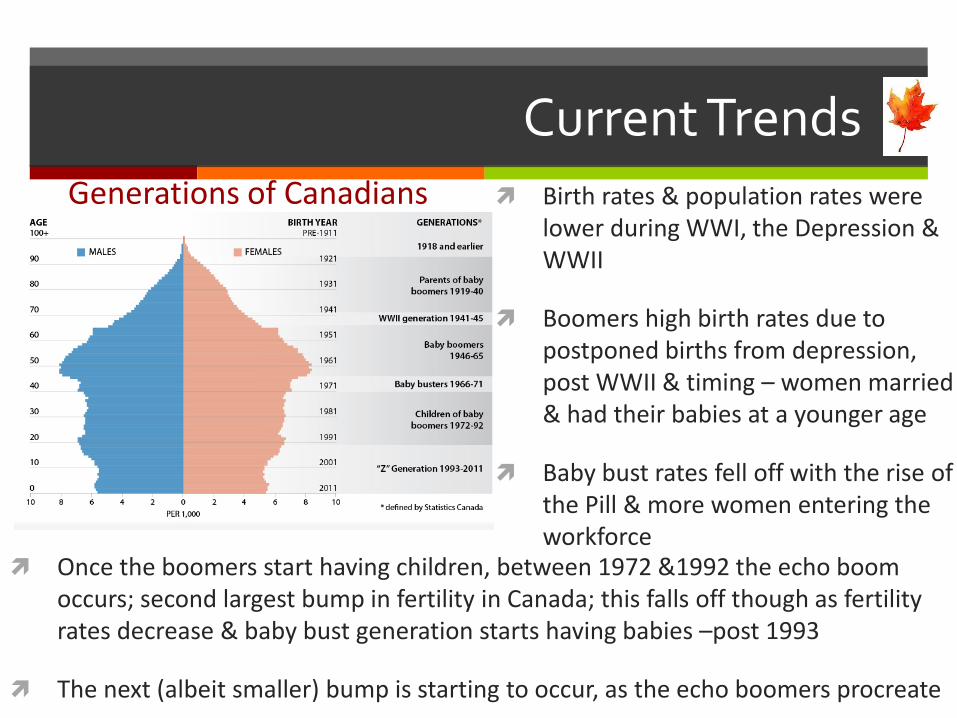
Birth rates & population rates were lower during WWI, the Depression & WWII
Boomers high birth rates due to postponed births from depression, post WWII & timing – women married & had their babies at a younger age
Baby bust rates fell off with the rise of the Pill & more women entering the workforce
Once the boomers start having children, between 1972 &1992 the echo boom occurs; second largest bump in fertility in Canada; this falls off though as fertility rates decrease & baby bust generation starts having babies –post 1993
The next (albeit smaller) bump is starting to occur, as the echo boomers procreate
Baby Boomers born 1946-65
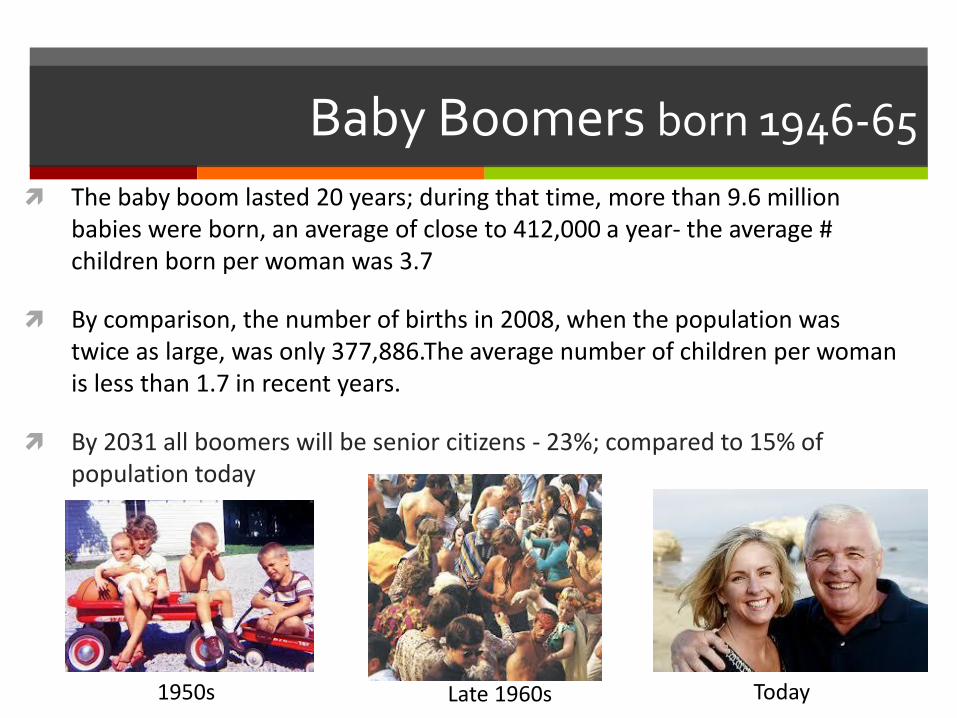
The baby boom lasted 20 years; during that time, more than 9.6 million babies were born, an average of close to 412,000 a year- the average # children born per woman was 3.7
By comparison, the number of births in 2008, when the population was twice as large, was only 377,886.The average number of children per woman is less than 1.7 in recent years.
By 2031 all boomers will be senior citizens - 23%; compared to 15% of population today
1950s Late 1960s Today
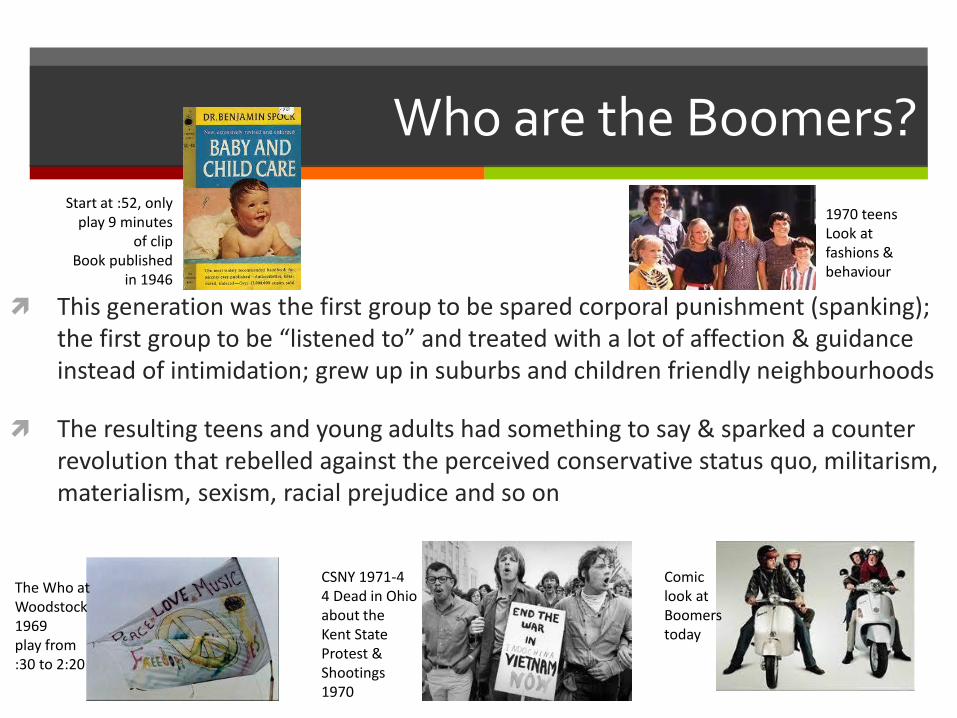
Who are the Boomers?
This generation was the first group to be spared corporal punishment (spanking); the first group to be “listened to” and treated with a lot of affection & guidance instead of intimidation; grew up in suburbs and children friendly neighbourhoods
The resulting teens and young adults had something to say & sparked a counter revolution that rebelled against the perceived conservative status quo, militarism, materialism, sexism, racial prejudice and so on
Start at :52, only play 9 minutes
of clip Book published
in 1946
1970 teens Look at fashions & behaviour
The Who at Woodstock 1969 play from :30 to 2:20
CSNY 1971-4 4 Dead in Ohio about the Kent State Protest & Shootings 1970
Comic look at Boomers today
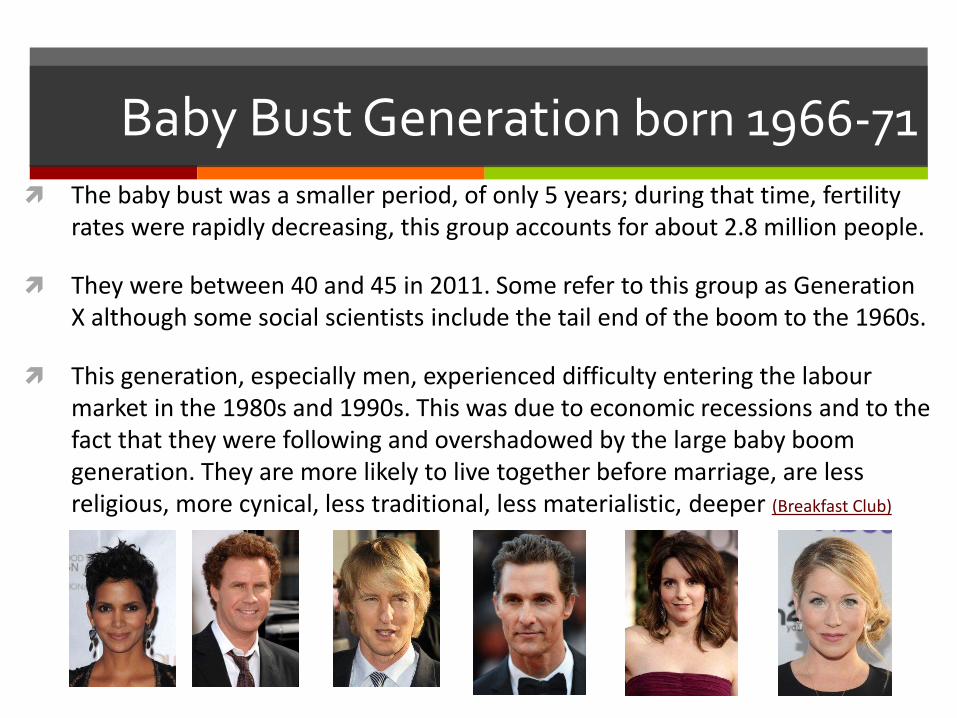
Baby Bust Generation born 1966-71
The baby bust was a smaller period, of only 5 years; during that time, fertility rates were rapidly decreasing, this group accounts for about 2.8 million people.
They were between 40 and 45 in 2011. Some refer to this group as Generation X although some social scientists include the tail end of the boom to the 1960s.
This generation, especially men, experienced difficulty entering the labour market in the 1980s and 1990s. This was due to economic recessions and to the fact that they were following and overshadowed by the large baby boom generation. They are more likely to live together before marriage, are less religious, more cynical, less traditional, less materialistic, deeper (Breakfast Club)
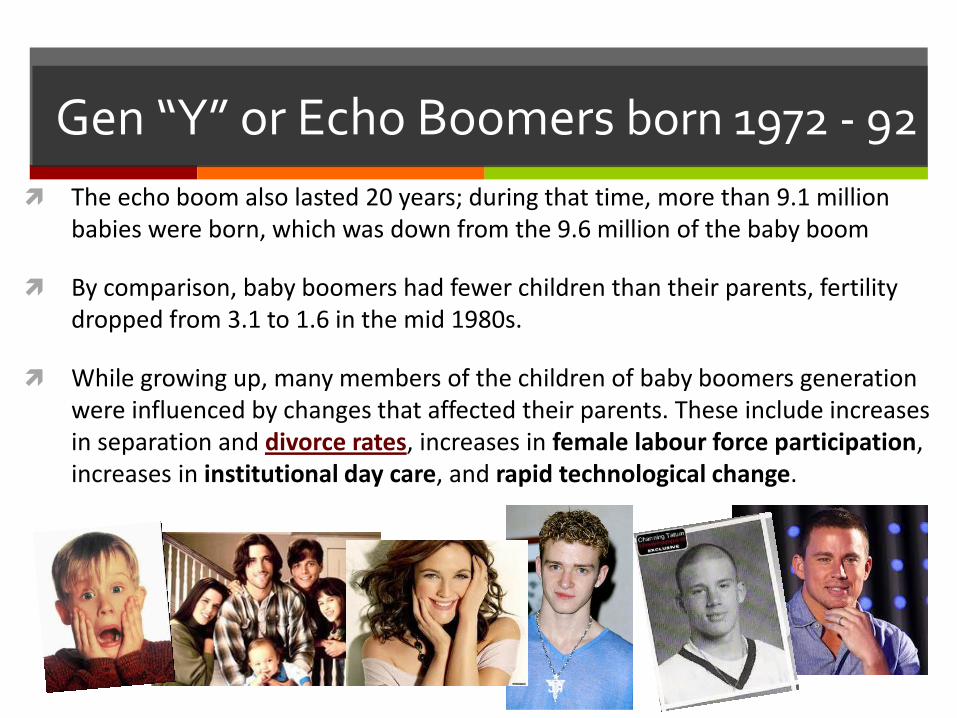
Gen “Y” or Echo Boomers born 1972 - 92
The echo boom also lasted 20 years; during that time, more than 9.1 million babies were born, which was down from the 9.6 million of the baby boom
By comparison, baby boomers had fewer children than their parents, fertility dropped from 3.1 to 1.6 in the mid 1980s.
While growing up, many members of the children of baby boomers generation were influenced by changes that affected their parents. These include increases in separation and divorce rates, increases in female labour force participation, increases in institutional day care, and rapid technological change.
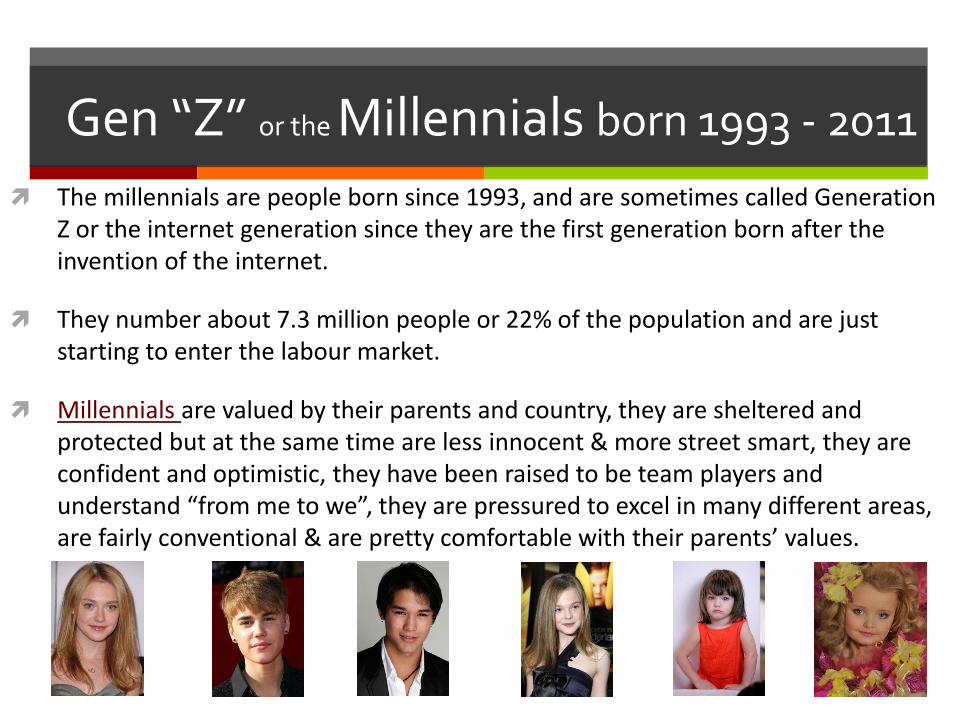
Gen “Z” or the Millennials born 1993 - 2011
The millennials are people born since 1993, and are sometimes called Generation Z or the internet generation since they are the first generation born after the invention of the internet.
They number about 7.3 million people or 22% of the population and are just starting to enter the labour market.
Millennials are valued by their parents and country, they are sheltered and protected but at the same time are less innocent & more street smart, they are confident and optimistic, they have been raised to be team players and understand “from me to we”, they are pressured to excel in many different areas, are fairly conventional & are pretty comfortable with their parents’ values.
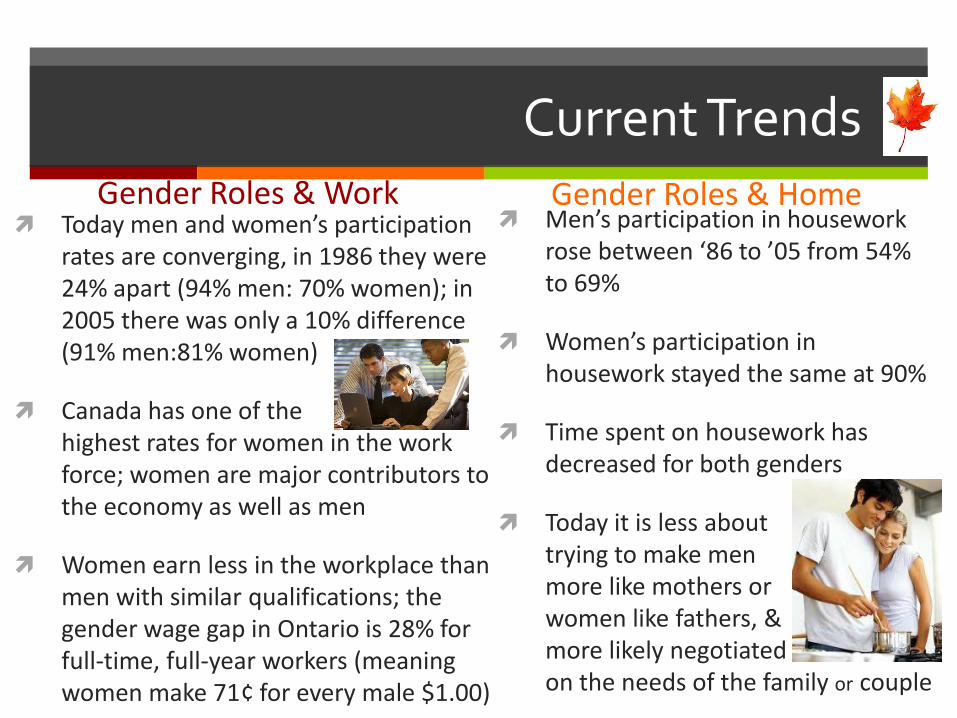
Current Trends s Gender Roles & Work Gender Roles & Home
Today men and women’s participation rates are converging, in 1986 they were 24% apart (94% men: 70% women); in 2005 there was only a 10% difference (91% men:81% women)
Canada has one of the highest rates for women in the work force; women are major contributors to the economy as well as men
Women earn less in the workplace than men with similar qualifications; the gender wage gap in Ontario is 28% for full-time, full-year workers (meaning women make 71¢ for every male $1.00)
Men’s participation in housework rose between ‘86 to ’05 from 54% to 69%
Women’s participation in housework stayed the same at 90%
Time spent on housework has decreased for both genders
Today it is less about trying to make men more like mothers or women like fathers, & more likely negotiated tasks based on the needs of the family or couple
Current Trends s
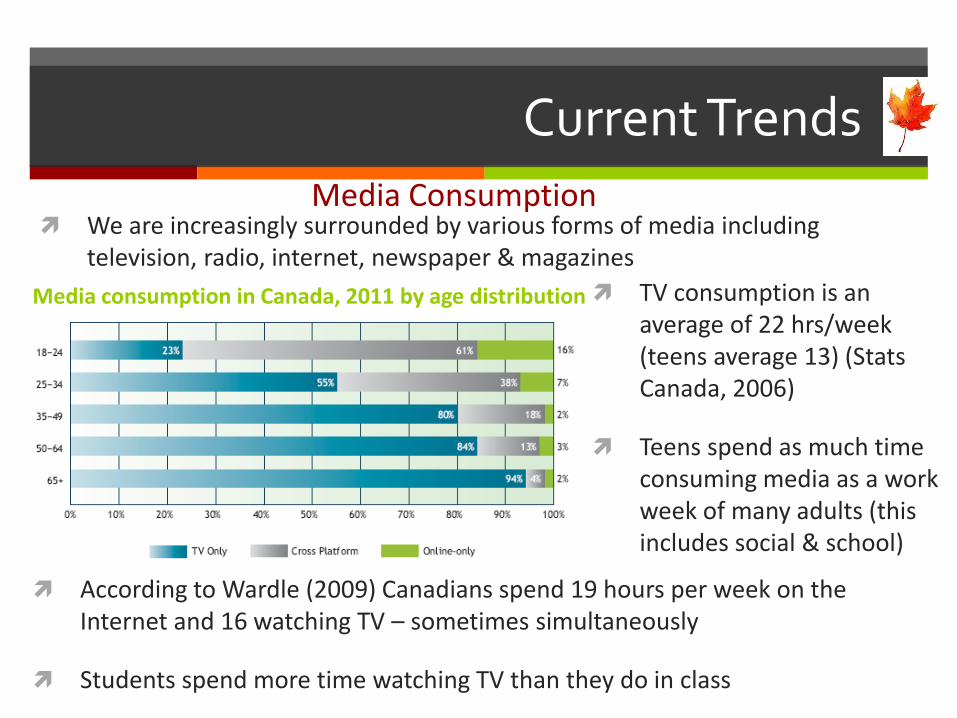
Media Consumption We are increasingly surrounded by various forms of media including
television, radio, internet, newspaper & magazines
Media consumption in Canada, 2011 by age distribution TV consumption is an average of 22 hrs/week (teens average 13) (Stats Canada, 2006)
Teens spend as much time consuming media as a work week of many adults (this includes social & school)
According to Wardle (2009) Canadians spend 19 hours per week on the Internet and 16 watching TV – sometimes simultaneously
Students spend more time watching TV than they do in class
Current Trends s
Violence in the Media Desensitization
The average American child will see more than 200 000 acts of violence and 16 000 murders before the age of 18.
The average TV show displays over 812 violent acts per hour and children’s programs can show up to 20 violent acts per hour (Canadian stats are very similar)
According to Marshall McLuhan, the medium is as influential as the message – meaning it isn’t only that there is violence on TV it is also that we are more accepting of it as well
Increasing amounts of violence on TV, in the movies and in video games allows people to become desensitized to graphic images
As viewers demand more realism, graphic violence has increased.
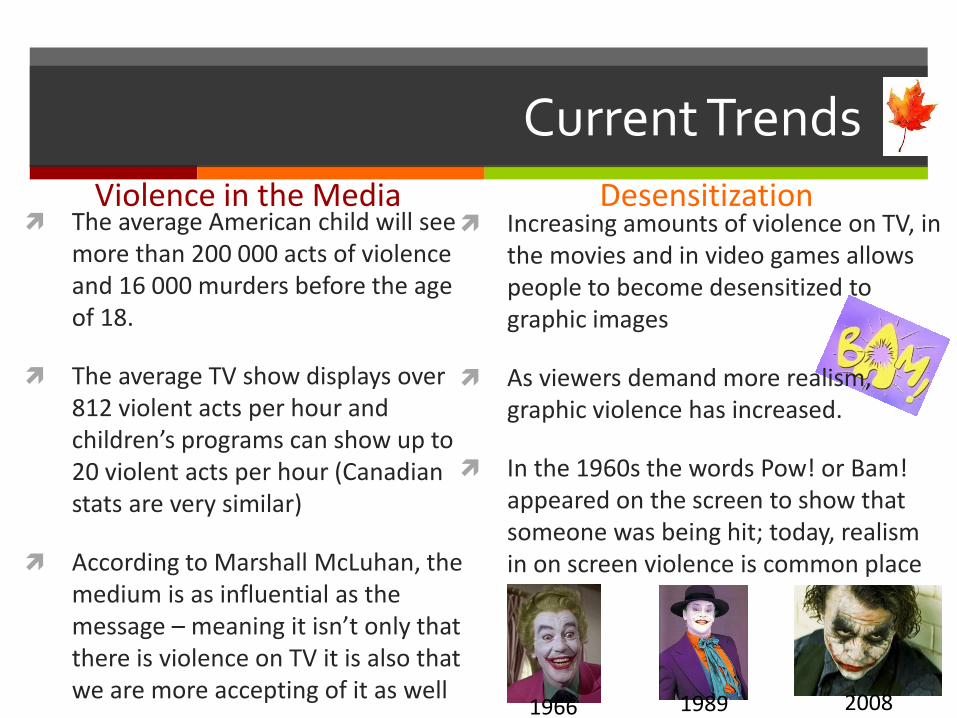
In the 1960s the words Pow! or Bam! appeared on the screen to show that someone was being hit; today, realism in on screen violence is common place
1966 1989 2008
Current Trends s
Violence in Gaming
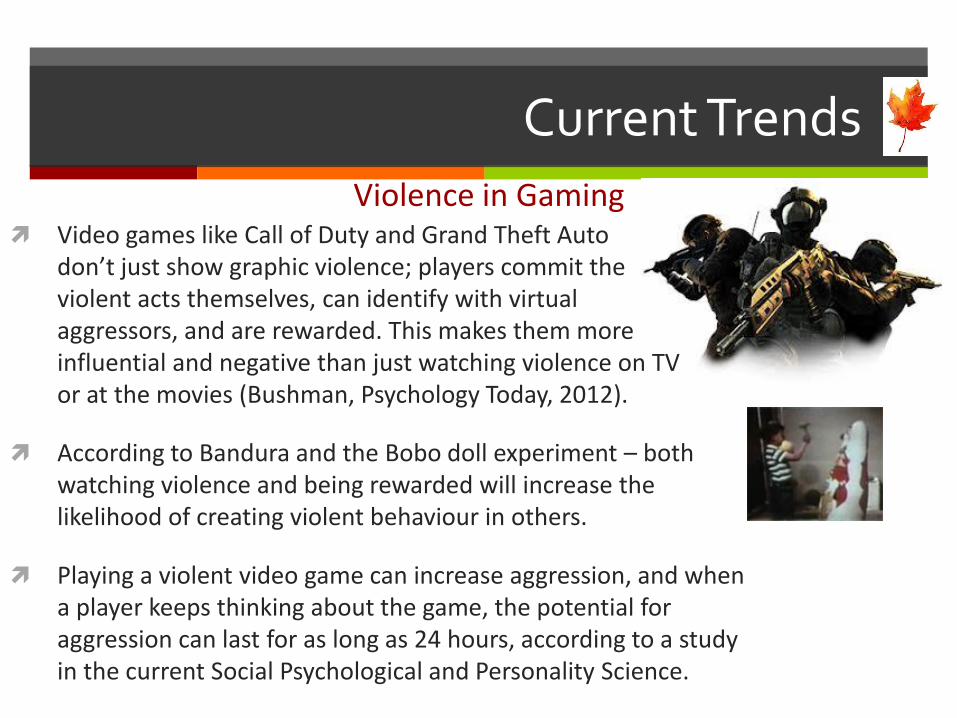
Video games like Call of Duty and Grand Theft Auto don’t just show graphic violence; players commit the violent acts themselves, can identify with virtual aggressors, and are rewarded. This makes them more influential and negative than just watching violence on TV or at the movies (Bushman, Psychology Today, 2012).
According to Bandura and the Bobo doll experiment – both watching violence and being rewarded will increase the likelihood of creating violent behaviour in others.
Playing a violent video game can increase aggression, and when a player keeps thinking about the game, the potential for aggression can last for as long as 24 hours, according to a study in the current Social Psychological and Personality Science.
Consolidation
Questions to consider…
Which generation would like to belong to and why?
Which trend do you think is the most negative and why?
Which trend do you think is the most positive and why?