growing together: professional learning communities at
TRANSCRIPT

Growing Together: Professional Learning Communities at Work® Generates Achievement Gains in Arkansas August 2021

This page left intentionally blank.

Growing Together: Professional Learning Communities at Work® Generates Achievement Gains in Arkansas Authors
Havala Hanson, Ph.D.
Kathryn Torres, Ph.D.
Sun Young Yoon, Ph.D.
Rebecca Merrill, Ph.D.
Traci Fantz
Zoe Velie August 2021

Abstract
Professional learning communities (PLCs) are a teacher collaboration and professional
development strategy that is widely used in public schools in the United States and beyond.
PLCs have the potential to improve instruction and student learning through structured,
ongoing, job-embedded staff collaboration. However, many schools find it challenging to
implement the features of PLCs effectively. The Arkansas Division of Elementary and
Secondary Education (DESE) invested in three years of intensive supports for schools to build
high-functioning PLCs using Solution Tree’s Professional Learning Communities at Work® (PLC at
Work®) model. This study evaluates the effectiveness of Solution Tree’s supports on student
English language arts (ELA) and math achievement tests in Arkansas.
The study used a two-stage matching process to establish treatment and comparison groups
combined with a difference-in-differences model to estimate treatment effects. It found that
within 19 months (i.e., by the state testing period in the second year of implementation) the
model had positive impacts on math achievement test scores (0.083 standard deviations, p =
0.014) and no effects on ELA achievement test scores.
The findings are relevant for schools considering or actively using PLCs to improve
collaboration, teaching, and learning. The study also describes areas for further research,
including replication in different contexts and experimental studies.

Professional Learning Communities at Work® Generates Achievement Gains in Arkansas i
Contents
Introduction ................................................................................................................................................. 1
Literature review......................................................................................................................................... 3
Background of PLC at Work in Arkansas ................................................................................................. 4
Method ......................................................................................................................................................... 6
Data ........................................................................................................................................................... 6
Measures ................................................................................................................................................... 7
Sample ....................................................................................................................................................... 7
Analytic approach ................................................................................................................................. 10
Results15
Student group effects of PLC at Work on student achievement ...................................................... 15
Discussion .................................................................................................................................................. 17
Limitations and opportunities for future research ........................................................................... 17
References .................................................................................................................................................. 19
Appendix A. Two-stage matching process results .............................................................................. 24
Appendix B. Complete regression results ............................................................................................. 31
Appendix C. Supplementary results ...................................................................................................... 41

ii Education Northwest
Figures
Figure 1. On average, Solution Tree delivered 38 to 47 days of on-site coaching and
training to each Cohort 1 school .................................................................................................. 5
Figure 2. Two-stage sampling design and associated statistical matching stages to
establish baseline equivalency between PLC at Work Cohort 1 and comparison
schools ........................................................................................................................................... 11
Tables
Table 1. Characteristics of PLC at Work project schools compared to other schools in
Arkansas, 2016/17 .......................................................................................................................... 8
Table 2. Analytic sample and state average (all schools), 2016/17 ....................................................... 9
Table 3. Student groups included in group analyses and statistical equivalency between
PLC at Work and comparison students before and after two-stage matching
procedure ...................................................................................................................................... 14
Table 4. PLC at Work’s contributions to student achievement growth from baseline
(2016/17) in Cohort 1 schools in the second year of implementation (2018/19) .................. 16
Table A1. Baseline means and standard deviations of treatment and comparison group
school characteristics before and after the propensity score matching process ................. 24
Table A2. Baseline means and standard deviations of treatment and comparison group
student characteristics before and after the coarsened exact matching process ................ 25
Table A3. Baseline means and standard deviations of treatment and comparison group
student characteristics after the propensity score matching and coarsened exact
matching processes, by race/ethnicity ...................................................................................... 26
Table A4. Baseline means and standard deviations of treatment and comparison group
student characteristics after the propensity score matching and coarsened exact
matching processes, by English learner status ........................................................................ 27
Table A5. Baseline means and standard deviations of treatment and comparison group
student characteristics after the propensity score matching and coarsened exact
matching processes, by gender .................................................................................................. 28
Table A6. Baseline means and standard deviations of treatment and comparison group
student characteristics after the propensity score matching and coarsened exact
matching processes, by eligibility for free or reduced-price lunch ...................................... 29

Professional Learning Communities at Work® Generates Achievement Gains in Arkansas iii
Table A7. Baseline means and standard deviations of treatment and comparison group
student characteristics after the propensity score matching and coarsened exact
matching processes, by eligibility for special education services ......................................... 30
Table B1. Full analytic sample results .................................................................................................... 31
Table B2. Results by gender .................................................................................................................... 33
Table B3. Results by race/ethnicity for the three largest racial/ethnic groups ................................. 35
Table B4. Results by federal program eligibility .................................................................................. 37
Table B5. Results by eligibility for English learner services ............................................................... 39
Table C1. Baseline means and standard deviations of treatment and comparison group
student characteristics after the propensity score matching process ................................... 41
Table C2. Baseline means and standard deviations of treatment and comparison group
student characteristics after the propensity score matching process, by
race/ethnicity ................................................................................................................................ 42
Table C3. Baseline means and standard deviations of treatment and comparison group
student characteristics after the propensity score matching process, by English
learner status ................................................................................................................................ 43
Table C4. Baseline means and standard deviations of treatment and comparison group
student characteristics after the propensity score matching process, by gender ............... 44
Table C5. Baseline means and standard deviations of treatment and comparison group
student characteristics after the propensity score matching process, by eligibility
for free or reduced-price lunch .................................................................................................. 45
Table C6. Baseline means and standard deviations of treatment and comparison group
student characteristics after the propensity score matching processes, by
eligibility for special education services ................................................................................... 46
Table C7. Full analytic sample results ................................................................................................... 47
Table C8. Results by gender .................................................................................................................... 49
Table C9. Results by race/ethnicity for the three largest racial/ethnic groups................................. 51
Table C10. Results by federal program eligibility ................................................................................ 53
Table C11. Results by eligibility for English learner services ............................................................. 56


Professional Learning Communities at Work® Generates Achievement Gains in Arkansas 1
Introduction
Effective teaching is critical for students’ success (Coleman, 1966; Goldhaber, 2007; Hanushek &
Rivkin, 2012; Kane & Staiger, 2008), and effective teacher collaboration has been shown to have
a strong positive influence on students’ academic progress (Branch et al., 2012, 2013; Chiang et
al., 2014; Clifford et al., 2012; Dhuey & Smith, 2018; Dutta & Sahney, 2016). High-performing
educators have also been linked to substantial long-term economic benefits for students and, by
extension, for the communities in which students ultimately live and contribute (Chetty et al.,
2014; Hanushek, 2011).
Acknowledging these strong connections between educator expertise and student outcomes,
education leaders and policymakers frequently concentrate their efforts on improving the
efficacy of the educator workforce through hiring and retaining effective teachers. While these
initiatives are important, they impact only a fraction of the educator workforce. In contrast,
effective school- or districtwide professional development has the potential to benefit all
educators—and by extension, all students—within a system.
Effective schoolwide professional development for educators is often difficult to choose and
implement, however. The field is crowded with options, and evidence of program effectiveness
is sparse. Where rigorous evidence supports professional learning options, it is often narrowly
focused on certain student groups, grade levels, and content areas, and options with
complementary professional learning support for school leaders are rare (Darling-Hammond et
al., 2017). Education leaders have few objective references to help them determine how well a
program may fit in their local context.
Professional learning communities (PLCs) have the potential to meet the need for effective
schoolwide professional development. PLCs can encompass many features of effective
professional development, including a focus on active learning strategies and collaboration,
explicit modeling of effective practice, expert coaching, and opportunities for feedback and
reflection (Darling-Hammond et al., 2017). PLCs are already a common strategy for
instructional improvement in U.S. public schools, yet there is little empirical evidence to help
education leaders identify and apply PLC best practices that lead to positive student outcomes.
This study contributes to the limited body of evidence on the effectiveness of PLCs
implemented across the spectrum of grade levels and content areas in K–12 schools.
Specifically, it evaluates the effectiveness of Solution Tree’s implementation of Professional
Learning Communities at Work® (PLC at Work®) in Arkansas on student achievement in English
language arts (ELA) and math. The study constitutes the first large-scale evaluation of the
effects of a PLC initiative on student achievement. Further, it is the first evaluation of the impact
of the widely used DuFour and Eaker model of PLCs—implemented by Solution Tree as PLC at
Work in Arkansas—on student achievement (DuFour, 2004; DuFour, DuFour, Eaker, & Many,
2016).

2 Education Northwest
The study is based on statewide data that include diverse communities and groups of students.
This enabled investigations of the initiative’s overall effect on student achievement as well as its
effects on student groups, including those that are historically underserved by education
systems. The current study complements a rigorous implementation study that measured
schools’ fidelity to the PLC at Work model and quantified progress on desired improvements in
educator collaboration and instruction practices (Torres et al., 2020). That study confirmed that
all schools in the study sample (Cohort 1), which began the initiative during the 2017/18 school
year, had implemented PLC at Work with fidelity by the end of the third year, with the
exception of one school that dropped out of the program after two years.
This study employed a two-stage matching process followed by a difference-in-differences
framework to estimate the impact of PLC at Work in Arkansas on ELA and math state
achievement tests. It found that the initiative had a positive effect on math achievement test
scores (0.083 standard deviations, p = 0.014) and no effect on ELA achievement test scores after
less than two years of the three-year intervention. Positive effects were observed for several
student groups, and no significant negative effects were found for any student group.
The study findings are relevant for school, district, and state education leaders who are
reviewing schoolwide professional development options. It is especially pertinent for
administrators who are considering or actively implementing PLCs. This study’s findings imply
that the coaching Solution Tree provided through the PLC at Work initiative can yield early
benefits for math student achievement after less than two years of the three-year initiative.
Moreover, the intervention included schools with a wide range of characteristics and students
from varied backgrounds. The diverse sample suggests that the results may apply to a variety
of school contexts beyond the study sample.
Future research should evaluate the effects of the full three-year intervention, which were not
possible due to the cancellation of state assessments during the 2019/20 school year as a result of
the COVID-19 pandemic. Other opportunities for future research include replication studies for
other cohorts of schools in the Arkansas initiative and for schools in other states. Additionally, a
study that employs random selection of schools could validate these promising results.
This report begins with a brief review of the literature related to the connection between PLCs
and student outcomes. This is followed by a summary of the PLC at Work model in Arkansas.
The report continues with descriptions of the study’s data, methods, and results and concludes
with a discussion of implications, contributions to the literature, and opportunities for
continued research.
Professional Learning Communities at Work® Generates Achievement Gains in Arkansas 3
Literature review
PLCs gained popularity in the 1990s as a collaborative alternative to the traditional model of
teaching and curriculum development in which teachers work in isolation and are individually
responsible for the success of the students in their classrooms (Feger & Arruda, 2008; Flinders,
1988; Hamos et al., 2009; Scribner et al., 1999; Williams et al., 2012). Today, PLCs are one of the
most common forms of collaborative teacher professional development in K–12 public schools
in the United States. When implemented well, PLCs promote sustained collaboration focused
on designing and sharing curricula and instructional strategies, as well as collective
responsibility for the success of all students (DuFour et al., 2016).
Consistent with effective adult learning practices, PLCs provide collaborative, ongoing, job-
embedded professional learning (see, for example, Darling-Hammond & Bartz-Snoden, 2005;
Darling-Hammond et al., 2009; Johnson & Taylor, 2006; Kolb, 1984; Yoon et al., 2007).
Participating in a PLC, according to several studies, can increase teacher confidence and self-
efficacy to improve student learning (Bandura, 1977; Clary et al., 2012; Tschannen-Moran &
Hoy, 2007). Likewise, participation in PLCs may improve early career teachers’ resilience and
persistence in the profession (Kitching et al., 2009).
PLCs often have a positive association with student outcomes, according to a large body of
research. Many studies have observed positive correlations with student achievement test
scores (Berry et al., 2005; Burns et al., 2018; Capraro et al., 2016; Huggins et al., 2011; Jackl &
Lougée, 2012; Louis & Marks, 1998; Ratts et al., 2015; Saunders et al., 2009; Sigurðardóttir, 2010;
Williams, 2013). One study provides quasi-experimental evidence that PLCs have a positive
impact on student achievement gains when implemented well and alongside project-based
learning (Capraro et al., 2016). Additional studies found positive associations with student
engagement and attitudes (Chou, 2011; Dix & Cawkwell, 2011; McLaughlin & Talbert, 2006;
Owen, 2015).
Many of the studies cited above emphasize that the benefits of PLCs only occur when they are
well implemented. This presents a challenge for school leaders. Implementing PLCs well
typically requires changes to staff norms and expectations, school schedules, and curriculum
development and pacing. These changes can present steep learning curves and logistical
barriers. Furthermore, research indicates that without a clear set of definitions and expectations
for the PLC process, collective buy-in from teachers and staff members, and support from
administration, schools are likely to abandon the model (Munoz & Branham, 2016; Sims &
Penny, 2015; Talbert, 2010). The PLC at Work initiative in Arkansas seeks to help schools
surmount these implementation obstacles and maximize the benefits to student learning that
PLCs are designed to achieve.

4 Education Northwest
Background of PLC at Work in Arkansas
The PLC at Work model, as conceptualized by Richard Dufour and Robert Eaker, is an “ongoing
process in which educators work collaboratively in recurring cycles of inquiry and action
research to achieve better results for the students they serve” (DuFour et al., 2016, p. 10).
Solution Tree has delivered professional learning resources and services based on the PLC at
Work model on a national scale since 1998 (Solution Tree, 2021). Its work in Arkansas, which is
under evaluation in this study, amplified its PLC at Work model to new levels of customization
and scope.
For PLC at Work in Arkansas, Solution Tree allotted up to 50 days per year of on-site coaching
and training to each Cohort 1 school. They also paired a four- or five-member team of skilled
associates—a lead associate and associates in the areas of leadership, math, assessment, and
literacy—with each school according to its needs, which were identified through an assessment
conducted at the beginning of the first year. Solution Tree selected all associates using a
rigorous review process that required candidates to have extensive experience and a proven
record of success with implementing the PLC at Work model (Solution Tree, 2021).
In practice, schools accommodated between 38 and 47 days of on-site coaching each year (figure
1). Schools supplemented on-site coaching with off-site training for key faculty members and
leaders at PLC at Work workshops, on-demand virtual coaching from Solution Tree associates,
and full access to Solution Tree’s Global PD online library of PLC at Work resources and
trainings.
Professional Learning Communities at Work® Generates Achievement Gains in Arkansas 5
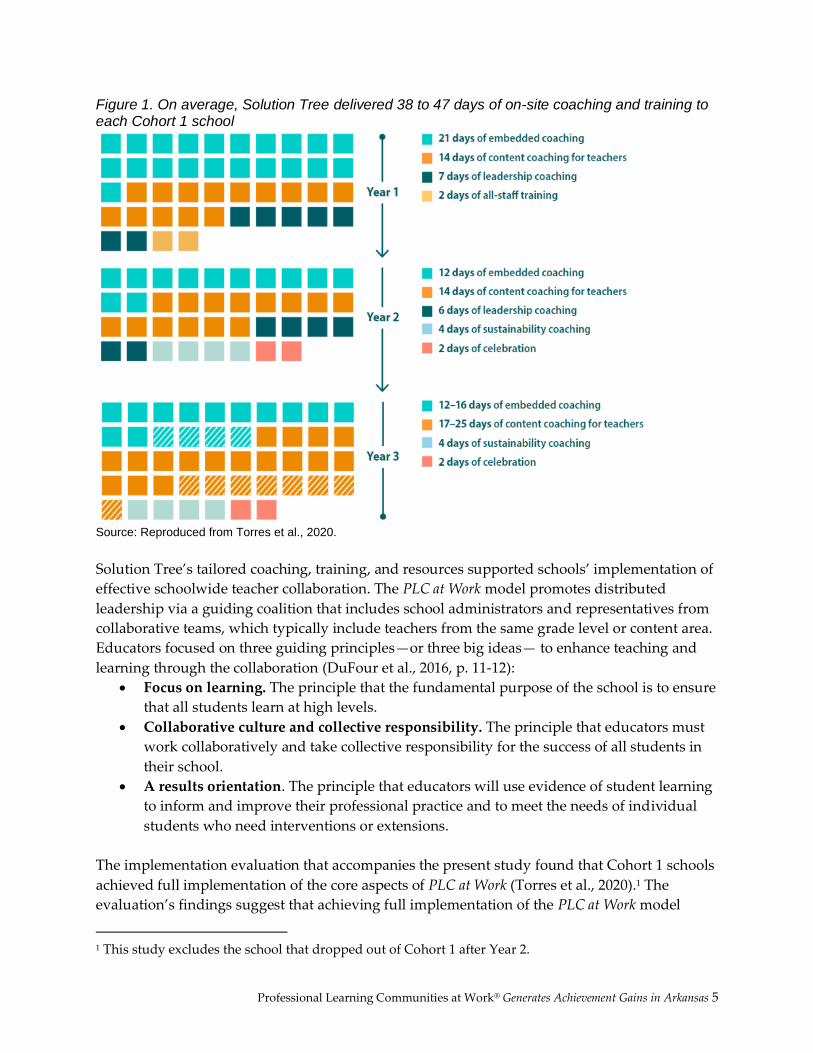
Figure 1. On average, Solution Tree delivered 38 to 47 days of on-site coaching and training to each Cohort 1 school
Source: Reproduced from Torres et al., 2020.
Solution Tree’s tailored coaching, training, and resources supported schools’ implementation of
effective schoolwide teacher collaboration. The PLC at Work model promotes distributed
leadership via a guiding coalition that includes school administrators and representatives from
collaborative teams, which typically include teachers from the same grade level or content area.
Educators focused on three guiding principles—or three big ideas— to enhance teaching and
learning through the collaboration (DuFour et al., 2016, p. 11-12):
• Focus on learning. The principle that the fundamental purpose of the school is to ensure
that all students learn at high levels.
• Collaborative culture and collective responsibility. The principle that educators must
work collaboratively and take collective responsibility for the success of all students in
their school.
• A results orientation. The principle that educators will use evidence of student learning
to inform and improve their professional practice and to meet the needs of individual
students who need interventions or extensions.
The implementation evaluation that accompanies the present study found that Cohort 1 schools
achieved full implementation of the core aspects of PLC at Work (Torres et al., 2020).1 The
evaluation’s findings suggest that achieving full implementation of the PLC at Work model
1 This study excludes the school that dropped out of Cohort 1 after Year 2.

6 Education Northwest
within three years yields expected improvements in collaboration, instructional practices, and
student learning.
Notably, all Cohort 1 schools reported positive changes in instructional practices, including
improvements in identifying and providing appropriate interventions for students who need
extra help and extensions for students who are ready for advanced material. Likewise,
educators reported that the implementation of PLC at Work improved their school’s culture of
collaboration and collective responsibility for ensuring all students learn at high levels. Nearly
all educators in Cohort 1 schools agreed that their collaborative teams practiced effective
communication, teachers trusted one another, teachers practiced collective efficacy and
responsibility for student learning, and teachers believed that all students could learn at high
levels.
The present study tests whether the implementation progress Cohort 1 schools made—less than
two years into the three-year intervention—resulted in benefits to student learning. Specifically,
the study intends to provide empirical evidence of the effectiveness of the PLC at Work model as
implemented in Arkansas on students’ ELA and math state achievement test scores. Two
questions guided the study:
1. What is the impact of PLC at Work on student achievement in ELA and math?
2. How do the impacts of PLC at Work vary among students with different background
characteristics, including gender, race/ethnicity, and eligibility for free or reduced-price
lunch, English learner, and special education programs?
Method
Data
The Arkansas Division of Elementary and Secondary Education (DESE) provided statewide
student-level data from the 2009/10 to 2018/19 school years. This included records for ACT
Aspire state achievement test scores, student demographic background characteristics, federal
program enrollment, discipline, and attendance. The data also included school-level
information, including geographic location in the state. Finally, DESE provided information
about educators, including years of experience, content area and grade levels taught, and
degrees earned. The study used longitudinal data from 2009/10 through 2018/19 to observe
whether students had ever enrolled in a federal program, including English learner, free or
reduced-price lunch, and/or special education programs. The analysis otherwise leveraged state
data from the 2016/17 through 2018/19 school years to assess PLC at Work’s impact on student
achievement test scores.

Professional Learning Communities at Work® Generates Achievement Gains in Arkansas 7
Measures
The study’s primary dependent variables included state-administered ACT Aspire ELA and
math achievement test scores. Arkansas administered the ACT Aspire assessment annually
during the study period (2016/17–2018/19). ELA and math ACT Aspire scores were
standardized within grade level and school year among the entire population of students who
took the assessment.
The primary independent variable is a binary indicator equal to 1 if a student was enrolled in a
PLC at Work Cohort 1 school in 2017/18—the first year of the intervention—and 0 otherwise.
Analyses included several covariates measured at baseline (i.e., in 2016/17). At the student level,
these included ELA and math ACT Aspire scores, standardized among all test takers in the state
within grade level to have a mean of 0 and a standard deviation of 1; grade level; gender;
race/ethnicity; and a vector of binary indicators for federal program enrollment (i.e., English
learner, free or reduced-price lunch, special education, and gifted and talented programs) set to
1 if the student had ever been enrolled in the program and 0 otherwise; as well as binary
indicators for whether the student had been suspended or expelled and whether the student
was chronically absent. Chronic absence was defined as being absent—whether excused or
unexcused—for 18 or more days in the school year (i.e., at least 10 percent of school days).
School-level covariates included school average baseline ELA and math ACT Aspire scores;
geographic region (Northwest, Northeast, Central, Southeast, and Southwest Arkansas); school
enrollment; a binary indicator for whether the school was in a district that contained a PLC at
Work school; the percentage of teachers in their first year of teaching; percentages of students
who were white; and percentages of students who were ever enrolled in federal programs,
including English learner, free or reduced-price lunch, and special education programs.
Additionally, the school’s propensity score for selection into the treatment—derived from the
first stage of the matching process—was included in models.
Sample
DESE selected treatment schools through a competitive application process. All state-funded
schools were invited to apply. The state received 86 applicants and selected 10 schools and one
small school district in Cohort 1.2 DESE reviewed applications using a set of criteria and
2 The schools included Bragg Elementary School, Ballman Elementary School, Douglas MacArthur Junior
High School, Greenbrier Eastside Elementary School, Frank Mitchell Intermediate School, Monticello
Middle School, Morrilton Intermediate School, Rogers High School, Joe T. Robinson Middle School,
Spradling Elementary, and all schools in Prescott School District. Prescott School District included two
schools—an elementary and a secondary school—in the baseline year and the first year of
implementation. The district divided its students into three schools—an elementary, junior high, and high
school—in the outcome year (2018/19). The study matched schools based on the configuration during the
baseline year. Student outcomes were measured for those who attended a PLC at Work school in 2017/18
and their matched peers regardless of where they attended school in 2018/19.

8 Education Northwest
selected schools from each of the five geographic regions of the state. The selected Cohort 1
schools had many similar characteristics to all other schools in the state, on average, particularly
with respect to proficiency on state assessments (table 1).
Table 1. Characteristics of PLC at Work project schools compared to other schools in Arkansas, 2016/17
Project schools
(N = 12)
All other schools in Arkansas
(N = 898)
Student enrollment characteristics
Average number of students enrolled 623 461*
Number of students per teacher 13 12*
Percentage of students who are Black 23% 20%
Percentage of students who are Latinx 16% 10%**
Percentage of students who are white 57% 66%
Percentage of students who are eligible for free or reduced-price lunch
64% 64%
Percentage of students who are English learners 11% 6%*
Percentage of students with special needs 12% 12%
Percentage of students who met or exceeded standards on the 2016/17 ACT Aspire assessments
English language arts 52% 51%
Mathematics 51% 47%
Science 41% 40%
* p < 0.05, ** p < 0.01
Source: Authors’ analysis of Arkansas Division of Elementary and Secondary Education data, 2016/17.
One Cohort 1 school dropped out of the program after completing the second year. This school
and its students who were enrolled in the first implementation year remained in the analytic
sample. Additionally, because this school exited in the third intervention year, it received the
same intervention as all other Cohort 1 schools during the study period.
Analytic sample exclusions
The study authors excluded certain schools that received partial treatment from the comparison
sample prior to conducting the matching process used to establish baseline equivalency. These
included 14 schools selected for Cohort 2 of PLC at Work, which began receiving intervention
services in the 2018/19 school year. Additionally, five schools not in a PLC at Work cohort sent
several school leaders and faculty members—typically the principal, other school or district
administrators, and teacher leaders—to participate in more than five days of onsite or offsite
PLC at Work training during the study period. To avoid comparing one PLC at Work
intervention with another, these schools were excluded from the sample prior to matching.
Professional Learning Communities at Work® Generates Achievement Gains in Arkansas 9
The treatment sample included all students who were enrolled in a Cohort 1 school during the
first year of the program (2017/18) and had a baseline (2016/17) state achievement test score.
Students who were enrolled in a Cohort 1 school at any time during the first implementation
year were included in the study sample, regardless of their attendance at other schools during
the first two years of implementation. There were two exceptions: Students were excluded from
the sample if they attended a Cohort 2 school or a school that was dropped for participating in
more than five days of PLC at Work training.
Attrition
Students who joined Cohort 1 or comparison schools after the first intervention year (2017/18)
were not admitted into the sample. Prior to the treatment, the total number of students was
2,756 in the treatment schools and 46,703 in the control schools. Some treatment and comparison
group students left Arkansas or otherwise did not take the state ELA or math assessment in the
second intervention year (2018/19). This included 131 matched treatment students and 2,398
matched comparison students (the analytic approach section describes the matching process).
These students were removed from the sample and baseline equivalence was retested and
confirmed with the trimmed sample. The overall attrition rate was 5.1 percent, and the
differential attrition rate was 0.4 percent. This level of attrition falls below a cautious threshold
for potential bias (i.e., attrition is likely exogenous to the intervention and levels are acceptable
for the study design).
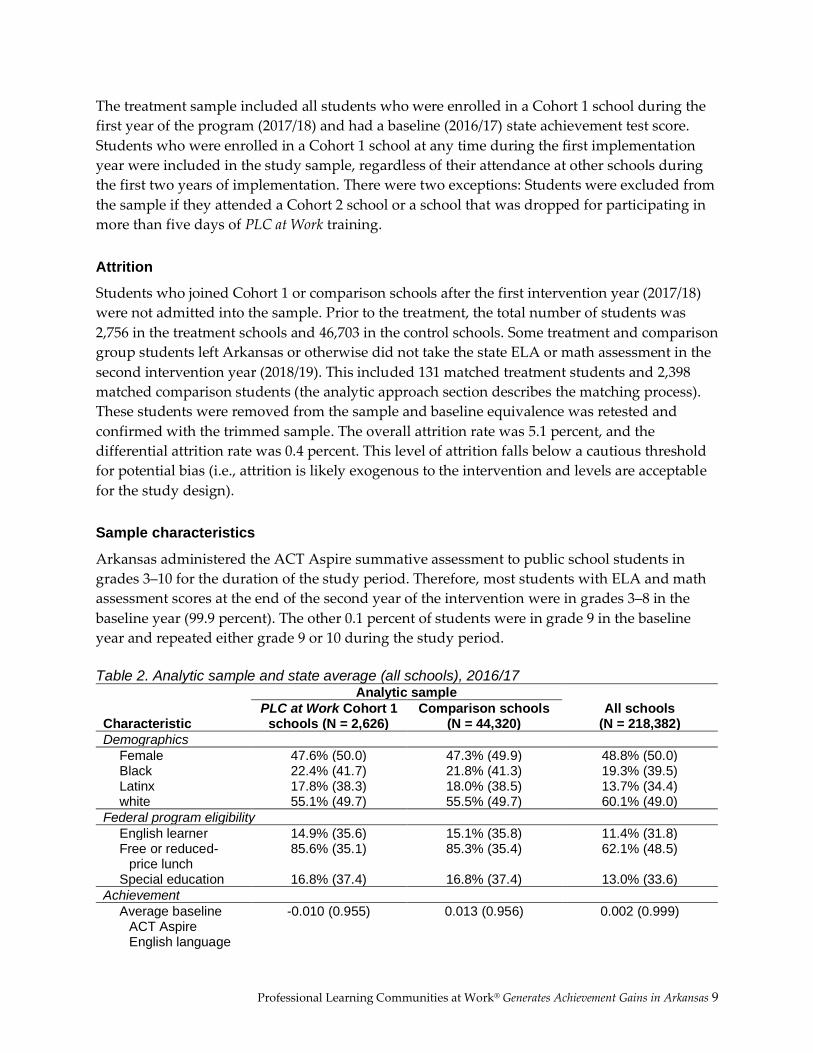
Sample characteristics
Arkansas administered the ACT Aspire summative assessment to public school students in
grades 3–10 for the duration of the study period. Therefore, most students with ELA and math
assessment scores at the end of the second year of the intervention were in grades 3–8 in the
baseline year (99.9 percent). The other 0.1 percent of students were in grade 9 in the baseline
year and repeated either grade 9 or 10 during the study period.
Table 2. Analytic sample and state average (all schools), 2016/17
Characteristic
Analytic sample
All schools (N = 218,382)
PLC at Work Cohort 1 schools (N = 2,626)
Comparison schools (N = 44,320)
Demographics
Female 47.6% (50.0) 47.3% (49.9) 48.8% (50.0) Black 22.4% (41.7) 21.8% (41.3) 19.3% (39.5) Latinx 17.8% (38.3) 18.0% (38.5) 13.7% (34.4) white 55.1% (49.7) 55.5% (49.7) 60.1% (49.0)
Federal program eligibility
English learner 14.9% (35.6) 15.1% (35.8) 11.4% (31.8) Free or reduced-
price lunch 85.6% (35.1) 85.3% (35.4) 62.1% (48.5)
Special education 16.8% (37.4) 16.8% (37.4) 13.0% (33.6)
Achievement
Average baseline ACT Aspire English language
-0.010 (0.955) 0.013 (0.956) 0.002 (0.999)

10 Education Northwest
arts scores (standardized)
Average baseline ACT Aspire math scores (standardized)
0.031 (0.951) 0.031 (0.952) 0.007 (0.997)
Note: Standard deviations are in parentheses. Analytic sample values are weighted. See appendix A for baseline equivalency details. Sample for all schools includes students in grades 3–8 in 2016/17 who were not missing ELA and math assessment scores. Source: Authors’ analysis of Arkansas Division of Elementary and Secondary Education data, 2016/17.
Analytic approach
Our approach to estimating the effects of PLC at Work on student achievement included a two-
stage matching process to establish baseline equivalency between treatment and comparison
groups, followed by the use of a hierarchical intent-to-treat (ITT) model to estimate the main
effects of the model. This was followed by group analyses to estimate the effect of PLC at Work
on students from different backgrounds. We repeated the ITT model used to estimate the main
effect among samples limited to students with a common background characteristic (i.e., the
same gender, race/ethnicity, or federal program eligibility status).
Matching approach
This study established baseline equivalency between treatment and comparison groups through
a two-stage matching process (figure 2). The approach is grounded in theory, reflecting the
program’s selection and implementation processes. It begins at the school level, where the
intervention occurred and continues at the student level, where the intervention aims to impact
outcomes.

Professional Learning Communities at Work® Generates Achievement Gains in Arkansas 11
Figure 2. Two-stage sampling design and associated statistical matching stages to establish baseline equivalency between PLC at Work Cohort 1 and comparison schools
Source: Authors’ illustration.
In the first stage, propensity score matching (PSM) established a comparison group for
treatment schools (Rosenbaum & Rubin, 1983). When DESE selected Cohort 1 schools through a
competitive application process, it used criteria to select schools rather than a random sampling
procedure. Because the time between the notice for application and the selection process was
short—two months before the intervention began— the study team acknowledged that
information gaps may have discouraged some schools from filing an application. As a result,
the study team chose to include all schools in the comparison sample prior to matching.
The estimated propensity score, p(xj), for school j (j = 1,…,969) is the conditional probability of
being selected for PLC at Work Cohort 1 given a set of baseline year covariates, Xj, including the
number of students enrolled; average ELA and math achievement test scores; the percentage of
students who are male; percentages of students who are Black, Latinx, or white; percentages of
students who were ever eligible for federal programs, including English learner, free or
reduced-price lunch, or special education services; the average years of teacher experience; and
the percentage of beginning teachers (equation 1).
𝑝(𝑥𝑗) = Pr(𝑃𝐿𝐶𝑎𝑡𝑊𝑜𝑟𝑘𝑗 = 1|𝑿𝑗) (1)

12 Education Northwest
Upon completion of the PSM procedure, the sample was restricted to comparison schools with
common support. That is, comparison schools in the matched sample had propensity scores that
fell within the range of propensity scores for the treatment group (0.007 to 0.039). The trimmed
sample included all 12 PLC at Work Cohort 1 schools and 645 comparison schools with no
remaining significant differences across groups (see table A1 in appendix A for detailed results).
After restricting the sample to treatment and comparison schools with common support, the
study team employed a coarsened exact matching (CEM) process to pair students within
treatment schools to peers within the matched set of comparison schools (Iacus et al., 2012).
CEM “coarsens” each variable through recoding so that substantively indistinguishable values
are grouped and assigned the same numerical value. Then, an “exact matching” algorithm is
applied to the coarsened data to identify matches and remove unmatched units. Finally, the
coarsened data are discarded, and the original values of the matched data are retained for
analysis. Specifically, the CEM algorithm creates a set of strata, each with the same coarsened
values of X = (X1, X2,…, Xk), a k-dimensional dataset, where each Xj is a column vector of
observed values of pretreatment variable j for n sample observations. Units in strata that
contain at least one treated and one comparison student are retained while all other strata are
removed from the sample. Each matched student, i, in stratum s is assigned a weight:
𝑤𝑖 = {1, 𝑖 ∈ 𝑇𝑠
𝑚𝐶
𝑚𝑇∙𝑚𝑇
𝑠
𝑚𝐶𝑠 , 𝑖 ∈ 𝐶𝑠 (2)
where Ts represents the treated students in stratum s, 𝑚𝑇𝑠 is the number of treated students in
each stratum, and mT is the number of matched students in the treatment group. Similarly, for
comparison students, Cs, 𝑚𝐶𝑠 is the number of treated students in each stratum and mC is the
number of matched students in the treatment group (Iacus et al., 2012).
The matching algorithm includes several pretreatment characteristics that are associated with
student achievement. These include binary indicators for the male gender; each racial/ethnic
group; grade level in the baseline year; and whether a student was ever an English learner, ever
eligible for free or reduced-price lunch, or ever eligible for special education. In addition,
baseline ELA and math achievement test scores were stratified into seven groups based on the
sample distribution to minimize the range of scores within each stratum.
After matching, there were no significant differences between treatment and comparison
groups. In addition, Hedges’ g and Cox tests confirmed that each difference between treatment
and comparison groups had effect sizes smaller than 0.25 (see table A2 in appendix A for
baseline equivalency details).
Benefits of a two-stage matching process
The two-stage matching process aligns with the PLC at Work selection process and
implementation design—it is a school-level intervention focused on improving student learning

Professional Learning Communities at Work® Generates Achievement Gains in Arkansas 13
and engagement. In addition, conducting a two-stage matching process helps mitigate
limitations of a single approach. Matching at the school level is appropriate because PLC at
Work is a schoolwide intervention, with services delivered to school administrators, teachers,
and other school staff members. Further, PSM is an appropriate approach to pair treatment and
comparison schools since schools needed to apply to become part of Cohort 1. The propensity
for a school to apply to become part of Cohort 1 may be correlated with its characteristics.
However, PSM is vulnerable to omitted variable bias and modeling constraints. There is a trade-
off between using all available variables that could potentially be correlated with the outcome
and the number of degrees of freedom available in the model. Moreover, each variable brings
unique distributional properties that often require transformation and sample trimming to
achieve normality before matching. Each variable in the model mediates the influence of others
on the outcome, complicating the path to achieving and interpreting baseline equivalence. The
study team mitigated these challenges by limiting the PSM model to variables with the
strongest correlation to the outcome at the risk of increasing omitted variable bias.
Student-level matching helps correct for some of the limitations of school-level matching. The
average characteristics of a school, which were used to match treatment and comparison
schools, often fall short when representing the diversity of student background and academic
characteristics within schools. Unlike PSM, CEM does not rely on modeling assumptions about
the data generation process beyond the usual ignorability assumptions. The method performs
as well or better in its ability to reduce imbalance between treatment groups, model
dependents, estimation error, bias, variance, and mean square error (Iacus et al., 2012).
Estimation model
After creating a comparison group through this two-stage matching process, the study team
used an ITT difference-in-differences model to measure the difference in treatment and
comparison group achievement test score growth between the baseline year and the second
year of the intervention. The ITT model assigns outcomes to students based on enrollment in a
treatment or comparison school in the first year of the intervention (2017/18), regardless of
where they attended school in year 2 (2018/19). The ITT model is shown in equation 3:
𝑌𝑖𝑗 = 𝛼 + 𝑃𝐿𝐶𝑎𝑡𝑊𝑜𝑟𝑘𝑖𝑗 + 𝑿𝑖𝑗 + 𝜹𝑗 + 𝑢𝑗 + 𝜀𝑖𝑗 (3)
where Yij is either the ELA or math ACT Aspire score in the outcome year (2018/19) for student i
in school j; PLCatWork is an indicator for whether student i was enrolled in a PLC at Work
school; Xij is a vector of baseline (2016/17) student-level covariates, including ELA and math
ACT Aspire scores; binary indicators for whether student i was chronically absent, suspended
or expelled; male gender; ever eligible for English learner services, free or reduced-price lunch,
or special education services; and for each racial/ethnic group (American Indian or Alaska
Native, Asian, Black, Latinx, Native Hawaiian or Pacific Islander, and multiracial relative to
white students); and a categorical variable for grade level. δj, is a set of school characteristics,
including the propensity score determined through the matching process; binary indicators for
14 Education Northwest
each geographic region of the state (Northwest, Northeast, Central, and Southwest relative to
Southeast); a binary indicator for whether the school belonged to a district that contained a PLC
at Work school; and baseline characteristics include the percentages of students eligible for
English learner services, free or reduced-price lunch, or special education services, the number
of students enrolled, white students, school average baseline math and ELA score, and the
percentage of beginning teachers. uj, is a school random effect and εij, represents residual error.
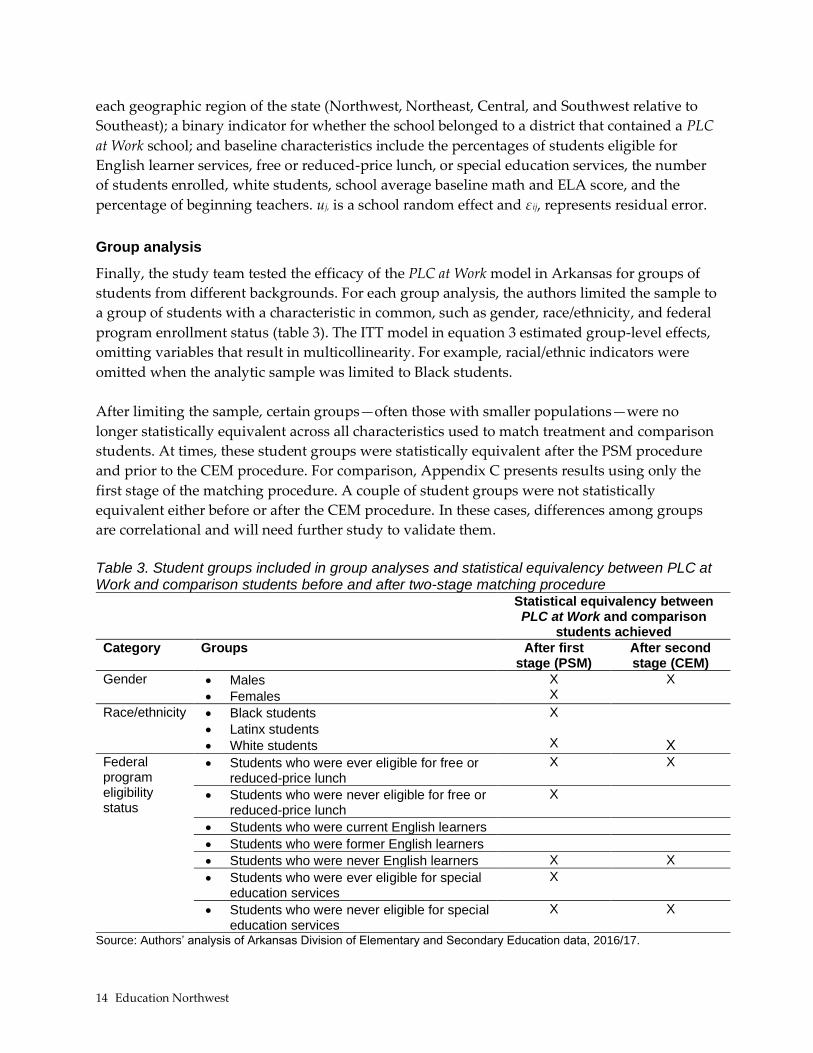
Group analysis
Finally, the study team tested the efficacy of the PLC at Work model in Arkansas for groups of
students from different backgrounds. For each group analysis, the authors limited the sample to
a group of students with a characteristic in common, such as gender, race/ethnicity, and federal
program enrollment status (table 3). The ITT model in equation 3 estimated group-level effects,
omitting variables that result in multicollinearity. For example, racial/ethnic indicators were
omitted when the analytic sample was limited to Black students.
After limiting the sample, certain groups—often those with smaller populations—were no
longer statistically equivalent across all characteristics used to match treatment and comparison
students. At times, these student groups were statistically equivalent after the PSM procedure
and prior to the CEM procedure. For comparison, Appendix C presents results using only the
first stage of the matching procedure. A couple of student groups were not statistically
equivalent either before or after the CEM procedure. In these cases, differences among groups
are correlational and will need further study to validate them.
Table 3. Student groups included in group analyses and statistical equivalency between PLC at Work and comparison students before and after two-stage matching procedure Statistical equivalency between
PLC at Work and comparison students achieved
Category Groups After first stage (PSM)
After second stage (CEM)
Gender • Males
• Females
X X
X
Race/ethnicity • Black students
• Latinx students
• White students
X
X
X
Federal program eligibility status
• Students who were ever eligible for free or reduced-price lunch
X X
• Students who were never eligible for free or reduced-price lunch
X
• Students who were current English learners
• Students who were former English learners
• Students who were never English learners X X
• Students who were ever eligible for special education services
X
• Students who were never eligible for special education services
X
X
Source: Authors’ analysis of Arkansas Division of Elementary and Secondary Education data, 2016/17.

Professional Learning Communities at Work® Generates Achievement Gains in Arkansas 15
Results
The analysis found that students in PLC at Work schools accelerated their growth on math
achievement tests relative to their matched peers. Specifically, students in PLC at Work schools
had 0.083 standard deviations higher growth on ACT Aspire math assessments between 2016/17
and 2018/19 than that of their matched peers (p = 0.014). This statistically significant result
equates to moving a student at the 50th percentile of math scores to the 53rd percentile.
Meanwhile, students in PLC at Work schools had about the same growth on ELA achievement
tests as their matched peers. They had growth on ELA assessments between 2016/17 and
2018/19 that was 0.018 standard deviations higher than that of their matched peers (p = 0.648).
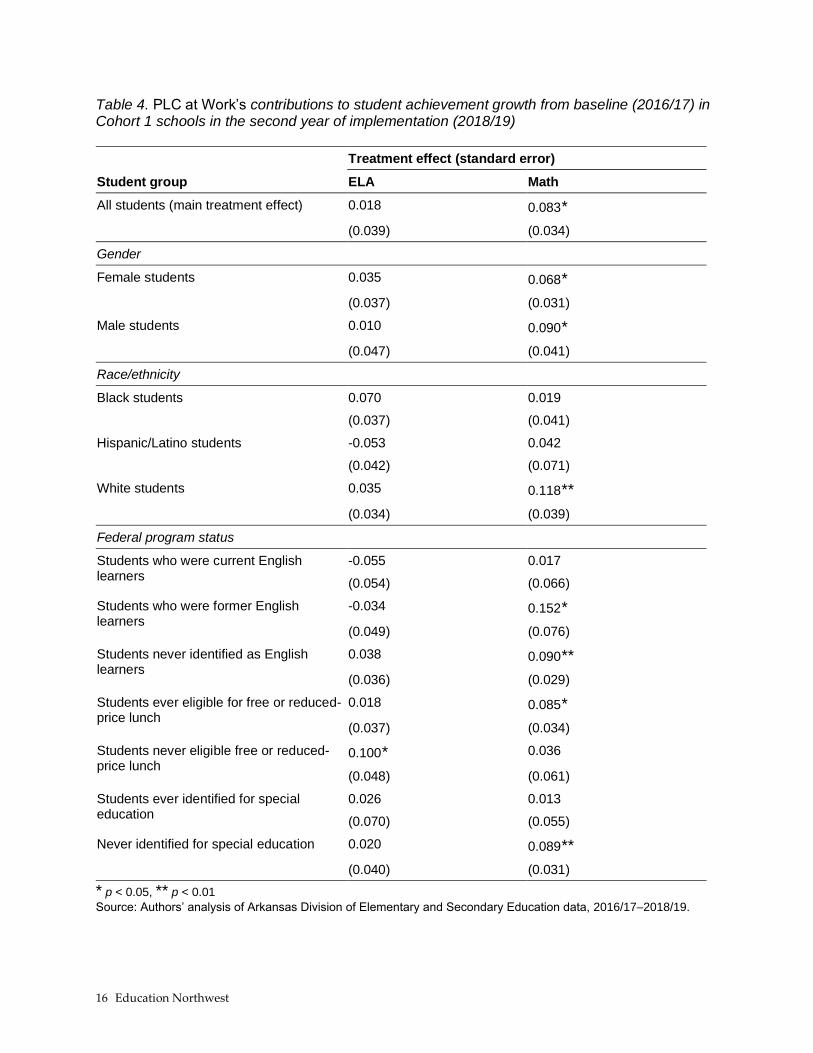
Student group effects of PLC at Work on student achievement
The PLC at Work model emphasizes the importance that all students learn and grow. For this
reason, it is useful to examine group-level treatment effects and assess whether the initiative’s
impact varies among student groups. Many student groups in PLC at Work schools
demonstrated higher growth than their matched peers in comparison schools, particularly in
math (table 4). Several student groups recorded growth on achievement tests at about the same
rate in PLC at Work and comparison schools. This was especially true in ELA, where only one
group—those never eligible for free or reduced-price lunch—showed a significantly higher
growth rate for PLC at Work students relative to their matched peers (0.100 standard deviations,
p = 0.035).
In contrast, several student groups in PLC at Work schools achieved higher math achievement
growth between 2016/17 and 2018/19 than that of their peers in comparison schools by
statistically significant margins. Some of these groups represent students who are traditionally
underserved in education systems. These include students who were ever eligible for free or
reduced-price lunch. In addition, female students, male students, white students, students who
were never eligible for English learner services, and students who were never eligible for
special education services in PLC at Work schools achieved significantly higher growth than that
of their peers in comparison schools. All other student groups grew at about the same rate as
their matched peers.
In ELA, students in PLC at Work schools grew at about the same rates as their peers in
comparison schools for the most part. Only students who were never eligible for free or
reduced-price lunch in PLC at Work schools grew at significantly higher rates than their
matched peers in comparison schools. Black students had higher growth than their peers, and
this growth was close to statistical significance (p = 0.056).
16 Education Northwest
Table 4. PLC at Work’s contributions to student achievement growth from baseline (2016/17) in Cohort 1 schools in the second year of implementation (2018/19)
Student group
Treatment effect (standard error)
ELA Math
All students (main treatment effect) 0.018 0.083*
(0.039) (0.034)
Gender
Female students 0.035 0.068*
(0.037) (0.031)
Male students 0.010 0.090*
(0.047) (0.041)
Race/ethnicity
Black students 0.070 0.019
(0.037) (0.041)
Hispanic/Latino students -0.053 0.042
(0.042) (0.071)
White students 0.035 0.118**
(0.034) (0.039)
Federal program status
Students who were current English learners
-0.055 0.017
(0.054) (0.066)
Students who were former English learners
-0.034 0.152*
(0.049) (0.076)
Students never identified as English learners
0.038 0.090**
(0.036) (0.029)
Students ever eligible for free or reduced-price lunch
0.018 0.085*
(0.037) (0.034)
Students never eligible free or reduced-price lunch
0.100* 0.036
(0.048) (0.061)
Students ever identified for special education
0.026 0.013
(0.070) (0.055)
Never identified for special education 0.020 0.089**
(0.040) (0.031)
* p < 0.05, ** p < 0.01
Source: Authors’ analysis of Arkansas Division of Elementary and Secondary Education data, 2016/17–2018/19.

Professional Learning Communities at Work® Generates Achievement Gains in Arkansas 17
Discussion
This study shows that the PLC at Work model—accompanied by expert support to implement
it—can positively influence student achievement in math without negative effects in ELA two
years into the three-year intervention. This study’s large, statewide sample represented diverse
sets of school contexts and student backgrounds. This suggests that the results may extend to
schools beyond those included in the study. The findings may inspire school leaders pursuing
the benefits of PLCs to commit to the tenets of the PLC at Work model and advocate for support
to implement it.
The PLC at Work model posits that implementing the core components of the process with
fidelity can support improvements in instructional practices and, by extension, in student
learning. This study confirms that the theory has merit. Nevertheless, systems change inevitably
takes time, careful planning, flexibility to adapt to challenges, and patience to manage setbacks.
A commitment to the PLC at Work model requires a “focused, organized, and consistent school
in which leaders and teachers collaborate, make evidence-based decisions, understand that the
student is the top priority, communicate effectively, and are involved in trusting relationships”
(Spiller & Power, 2019, p.1). To get there, Cohort 1 schools needed to dismantle old routines and
foster new ways of learning and growing together. This worked best when districts supported
the transition by providing school leaders the flexibility to change schedules to protect
collaboration time, identify essential standards to prioritize in the curricula, and distribute
school leadership (Torres et al., 2020). By extension, building and sustaining the PLC at Work
model relied on creating opportunities for teacher leadership and strengthening their leadership
abilities (Torres et al., 2020).
Importantly, the PLC at Work schools included in this study received Solution Tree’s
comprehensive and customized support to implement the model. Indeed, this study evaluates
the effectiveness of the PLC at Work model in concert with the coaching, training, and resources
Solution Tree provided to smooth transitions to new norms and fortify the core components of
the model in each school. Solution Tree associates helped schools navigate and overcome
hurdles with consistent and open lines of communication and timely, ongoing coaching. They
differentiated supports to fit each school’s unique needs and provided hands-on training that
empowered educators to learn by doing rather than simply telling them how to do it. In turn,
many Cohort 1 school leaders and educators credited their early successes to the support
Solution Tree provided (Torres et al., 2020).
Limitations and opportunities for future research
Several opportunities for future research surfaced from this study’s promising findings of the
PLC at Work model implemented in Arkansas. Foremost among them is the need for an
evaluation of the full implementation of the three-year model. School closures due to the

18 Education Northwest
COVID-19 pandemic interrupted state testing in the 2019/20 school year. This eliminated the
possibility of evaluating the full three-year implementation of the PLC at Work intervention for
Cohort 1. Replicating the study with a cohort of schools that received the full intervention
should be done to confirm the results.
Furthermore, the study’s results rely on quasi-experimental methods to establish a comparison
group in the absence of random assignment of schools to treatment and control conditions. The
two-stage matching process achieved baseline equivalency between treatment and comparison
schools on several characteristics that are highly correlated with student outcomes; however,
the study cannot guarantee the absence of bias.
One concern is that the sample is limited to the heterogeneity of students within the selected
treatment schools. Matching identified peers with similar background characteristics among
students in Cohort 1 schools. Nevertheless, these students may have idiosyncrasies that are
unobservable or difficult to measure.
Additionally, it is not possible to match students in treatment and comparison schools on all
factors that could influence the outcome. This is because they are either measured through
proxies, such as tying motivation to succeed in school to baseline test scores; they are not
available in existing datasets, such as family and community characteristics; or there are not a
sufficient number of students in the comparison sample that can match to students in the
treatment group on a large number of characteristics. A study in which schools are randomly
selected to receive the intervention could mitigate some of the limitations of the present study.
Finally, there is value in studying variations of the PLC at Work model evaluated in this study.
For example, evaluating the model in other states could reinforce the generalizability of the
findings. There are further opportunities to evaluate variations on the model, such as providing
additional or fewer implementation supports for longer and shorter periods of time or
measuring the effectiveness of the model when schools implement it without support. Such
evaluations could test the threshold for the intensity of supports that result in positive impacts
on student achievement.
Overall, while much room exists for further evaluation, this study contributes important
evidence to a limited body of research on the effectiveness of PLCs to improve student
achievement. It suggests that the PLC at Work model—with support for implementation—can
help schools begin to see improvements in student learning in just two years. Beyond student
achievement, the accompanying implementation study (Torres et al., 2020) finds that school
leadership and teacher efficacy improved with time for professional collaboration focused on
instructional quality, inquiry, and helping all students succeed. Altogether, the promising
results suggest the PLC at Work model, when implemented well, can be a fulcrum for improving
instruction and student learning across widespread and diverse student groups and school
contexts.

Professional Learning Communities at Work® Generates Achievement Gains in Arkansas 19
References
Bandura, A. (1977). Self-efficacy: Toward a unifying theory of behavioral change. Psychological
review, 84(2), 191–215. https://eric.ed.gov/?id=EJ161632
Berry, B., Johnson, D., & Montgomery, D. (2005). The power of teacher leadership [electronic
version]. Educational Leadership, 62(5), 56.
Branch, G. F., Hanushek, E. A., & Rivkin, S. G. (2012). Estimating the effect of leaders on public
sector productivity: The case of school principals. [Working Paper 17803]. National Bureau of
Economic Research. https://eric.ed.gov/?id=ED529199
Branch, G. F., Hanushek, E. A., & Rivkin, S. G. (2013). School leaders matter. EducationNext,
13(1). https://eric.ed.gov/?id=EJ1008235
Burns, M. K., Naughton, M. R., Preast, J. L., Wang, Z., Gordon, R. L., Robb, V., & Smith, M. L.
(2018). Factors of professional learning community implementation and effect on
student achievement. Journal of Educational and Psychological Consultation, 28(4), 394–412.
https://doi.org/10.1080/10474412.2017.1385396
Capraro, R. M., Capraro, M. M., Scheurich, J. J., Jones, M., Morgan, Huggins, K. S., Corlu, M. S.,
Younes, R., & Han, S. (2016). Impact of sustained professional development in STEM on
outcome measures in a diverse urban district. The Journal of Education Research, 109(2),
181–196. http://dx.doi.org/10.1080/00220671.2014.936997
Chetty, R., Friedman, J. N., & Rockoff, J. E. (2014). Measuring the impacts of teachers II: Teacher
value-added and student outcomes in adulthood. American Economic Review, 104(9),
2633–2679. https://www.aeaweb.org/articles?id=10.1257/aer.104.9.2633
Chiang, H., Lipscomb, S., & Gill, B. (2014). Is school value-added indicative of principal quality?
Education Finance and Policy, 11(3), 283–309. Retrieved from
https://files.eric.ed.gov/fulltext/ED566133.pdf
Chou, C. (2011). Teachers’ professional development investigating teachers’ learning to do
action research in a professional learning community. The Asia-Pacific Education
Researcher, 20(3), 421–437.
Clary, D. M., Styslinger, M. E., & Oglan, V. A. (2012). Literacy learning communities in
partnership. School-University Partnerships, 5(1), 28–39.
https://files.eric.ed.gov/fulltext/EJ974367.pdf

20 Education Northwest
Clifford, M., Behrstock-Sherratt, E., & Fetters, J. (2012). The ripple effect: A synthesis of research on
principal influence to inform performance evaluation design. (Issue Brief). American Institutes
for Research. https://eric.ed.gov/?id=ED530748
Coleman, J. S. (1966). Equality of educational opportunity [NBER Working Paper 12828]. U.S. Dept.
of Health, Education, and Welfare, Office of Education.
Darling-Hammond, L., & Baratz-Snoden, J. (Eds.) (2005). A good teacher in every classroom:
Preparing the highly qualified teachers our children deserve. National Academy of Education
Committee on Teacher Education. Jossey-Bass.
Darling-Hammond, L., Hyler, M. E., Gardner, M. & Espinoza, D. (2017). Effective teacher
professional development. Learning Policy Institute.
https://learningpolicyinstitute.org/sites/default/files/product-
files/Effective_Teacher_Professional_Development_REPORT.pdf
Darling-Hammond, L., Wei, R. C., Andree, A., Richardson, N. & Orphanos, S. (2009).
Professional learning in the learning profession: A status report on teacher development in the
United States and abroad. [Technical Report]. National Staff Development Council.
https://edpolicy.stanford.edu/sites/default/files/publications/professional-learning-
learning-profession-status-report-teacher-development-us-and-abroad.pdf
Dhuey, E. & Smith, J. (2018). How school principals influence student learning. Empirical
Economics, 54(2), 851–882. https://eric.ed.gov/?id=ED535648
Dix, S. & Cawkwell, G. (2011). The influence of peer group response: Building a teacher and
student expertise in the writing classroom. English Teaching: Practice and Critique, 10(4),
41–57.
Dufour, R. (2004). What is a “Professional Learning Community”? Educational Leadership, 61(8),
6–11.
DuFour, R., DuFour, R., Eaker, R., Many, T. W., & Mattos, M. (2016). Learning by doing: A
handbook for professional learning communities at work. Solution Tree Press.
Dutta, V. & Sahney, S. (2016). School leadership and its impact on student achievement: The
mediating role of school climate and teacher job satisfaction. International Journal of
Educational Management, 30(6), 941–958. https://eric.ed.gov/?id=EJ1109267
Feger, S., & Arruda, E. (2008). Professional learning communities: Key themes from the literature.
Education Alliance, Brown University.

Professional Learning Communities at Work® Generates Achievement Gains in Arkansas 21
Flinders, D. J. (1988). Teacher Isolation and the New Reform. Journal of Curriculum and
Supervision, 4(1), 17-29.
Goldhaber, D. (2007). Everyone’s doing it, but what does teacher testing tell us about teacher
effectiveness? Journal of Human Resources, 42(4): 765–794.
Hamos, J. E., Bergin, K. B., Maki, D. P., Perez, L. C., Prival, J. T., Rainey, D. Y., ... &
VanderPutten, E. (2009). Opening the Classroom Door: Professional Learning
Communities in the Math and Science Partnership Program. Science educator, 18(2), 14-
24.
Hanushek, E. A. (2011). The economic value of higher teacher quality. Economics of Education
review, 30(3), 466-479.
Hanushek, E. A. & Rivkin, S. G. (2012). The distribution of teacher quality and implications for
policy. Annual Review of Economics, 2012(4), 131–157.
http://hanushek.stanford.edu/sites/default/files/publications/Hanushek%2BRivkin%2020
12%20AnnRevEcon%204.pdf
Huggins, K. S., Scheurich, J. J. & Morgan, J. R. (2011). Professional learning communities as a
leadership strategy to drive math success in an urban high school serving diverse, low-
income students: A case study. Journal of Education for Students Placed at Risk. 16(2), 67–
88. https://doi.org/10.1080/10824669.2011.560525
Iacus, S. M., King, G., & Porro, G. (2012). Causal inference without balance checking: Coarsened
exact matching. Political Analysis, 20(1), 1–24. https://doi.org/10.1093/pan/mpr013
Jackl, A., & Lougée, A. (2012). Wake County Public School System (WCPSS) professional learning
teams (PLTs): 2010–11 to 2011–12 school-based policy study. [Data and Accountability
Department D&A Report No. 12.02]. Wake County Public Schools.
https://webarchive.wcpss.net/results/reports/2012/1202plt10-11sbp.pdf
Johnson, S. & Taylor, K. (2006). The neuroscience of adult learning. New Directions for Adult and
Continuing Education, 110. Wiley.
Kane, T. J. & Staiger, D. O. (2008). Estimating teacher impacts on student achievement: An
experimental evaluation [Working Paper No. 14607]. National Bureau of Economic
Research. https://www.nber.org/papers/w14607
Kitching, K., Morgan, M., & O’Leary, M. (2009). It’s the little things: Exploring the importance of
commonplace events for early‐career teachers’ motivation. Teachers and Teaching: Theory
and Practice, 15(1), 43–58. https://eric.ed.gov/?id=EJ828153

22 Education Northwest
Kolb, D. A. (1984). Experiential learning: Experience as the source of learning and development.
Prentice-Hall.
Louis, K. S., & Marks, H. (1998). Does professional community affect the classroom? Teachers’ work
and student experience in restructuring schools. Center on Organization and Restructuring
of Schools.
McLaughlin, M. W. & Talbert, J. E. (2006). Building school-based teacher learning communities:
Professional strategies to improve student achievement. University of Chicago Press.
Muñoz, M. A. & Branham, K. E. (2016). Professional learning communities focusing on results
and data-use to improve student learning: The right implementation matters. Planning
and Changing, 47(1–2), 37–46. https://eric.ed.gov/?id=EJ1145332
Owen, S. M. (2015). Teacher professional learning communities in innovative contexts: ‘ah hah
moments’, ‘passion’ and ‘making a difference’ for student learning. Professional
Development in Education, 41(1), 57–74. https://doi.org/10.1080/19415257.2013.869504
Ratts, R. F., Pate, J. L., Archibald, J. G., Andrews, S. P., Ballard, C. C., & Lowney, K. S. (2015).
The influence of professional learning communities on student achievement in
elementary schools. Journal of Education & Social Policy, 2(4), 51–61.
Rosenbaum, P. R. & Rubin, D. B. (1983). The central role of the propensity score in observational
studies for causal effects. Biometrika, 70(1), 41–55. https://doi.org/10.1093/biomet/70.1.41
Saunders, W. M., Goldenberg, C. N., & Gallimore, R. (2009). Increasing achievement by focusing
grade-level teams on improving classroom learning: A prospective, quasi-experimental
study of Title I schools. American Educational Research Journal, 46(4), 1006–1033.
doi:10.3102/0002831209333185
Scribner, J. P., Cockrell, K. S., Cockrell, D. H., & Valentine, J. W. (1999). Creating professional
communities in schools through organizational learning: An evaluation of a school
improvement process. Educational administration quarterly, 35(1), 130-160.
Sigurðardóttir, A. K. (2010). Professional learning community in relation to school effectiveness.
Scandinavian Journal of Educational Research, 54, 395–412.
doi:10.1080/00313831.2010.508904
Sims, R. L. & Penny, R. (2015). Examination of a failed professional learning community. Journal
of Education and Training Studies. 3(1), 39–45. http://dx.doi.org/10.11114/jets.v3i1.558
Solution Tree. (2021). About Solution Tree. Solution Tree.
https://www.solutiontree.com/about/overview

Professional Learning Communities at Work® Generates Achievement Gains in Arkansas 23
Spiller, J. & Power, K. (2019). Leading with Intention: 8 Areas for Reflection and Planning in Your
PLC at Work. Bloomington, IN: Solution Tree Press.
Talbert J. E. (2010). Professional learning communities at the crossroads: How systems hinder or
engender change. In A. Hargreaves, A. Lieberman, M. Fullan, & D. Hopkins (Eds.),
Second International Handbook of Educational Change (pp. 555–571). Springer.
https://doi.org/10.1007/978-90-481-2660-632
Torres, K., Rooney, K., Holmgren, M., Young, S. Y., Taylor, S., & Hanson, H. (2020). PLC at
Work® in Arkansas: Driving achievement results through school transformation and innovation.
Education Northwest. https://educationnorthwest.org/sites/default/files/driving-
achievement-results-through-school-transformation.pdf
Tschannen-Moran, M., & Hoy, A. (2007). The differential antecedents of self-efficacy of novice
and experienced teachers. Teaching and teacher education, 23, 944–956.
Williams, R., Brien, K., & LeBlanc, J. (2012). Transforming schools into learning organizations:
Supports and barriers to educational reform. Canadian Journal of Educational
Administration and Policy, (134).
Williams, D. J. (2013, winter). Urban education and professional learning communities. The
Delta Kappa Gamma Bulletin, 31–39.
Yoon, K. S., Duncan, T., Lee, S. W-Y., Scarloss, B., & Shapley, K. (2007). Reviewing the evidence on
how teacher professional development affects student achievement. (Issues & Answers Report,
REL 2007–No. 033). U.S. Department of Education, Institute of Education Sciences,
National Center for Education Evaluation and Regional Assistance, Regional
Educational Laboratory Southwest. https://eric.ed.gov/?id=ED498548

24 Education Northwest
Appendix A. Two-stage matching process results
This appendix provides details about the two-stage matching process this study used to achieve
baseline equivalence between treatment and comparison groups. First, table A1 presents means,
standard deviations, and effect size tests (Hedge’s g) for balance equivalency before and after
conducting propensity score matching among variables used during the matching procedure.
Note that variables were standardized and transformed prior to matching to normalize
distributions for treatment and comparison samples. The following table (A2) presents the same
information for the student level, before and after the coarsened exact matching procedure. To
ascertain effect sizes for the difference between treatment and comparison groups, Hedge’s g
tests were used for continuous variables and Cox’s index tests were used for binary variables.
Table A1. Baseline means and standard deviations of treatment and comparison group school characteristics before and after the propensity score matching process
Group
Unmatched Matched
PLC at Work (N = 12 schools)
Comparison (N = 957 schools)
PLC at Work (N = 12 schools)
Comparison (N = 645 schools)
Variables Mean S.D. Mean S.D. Hedge’s g
Mean S.D. Mean S.D. Hedge’s g
School enrollment (standardized and log transformed)
0.625 0.736 0.757 0.655 0.200 0.631 0.708 0.624 0.499 0.014
Student demographics (standardized)
Black students 0.113 0.604 –0.001 1.004 0.114 0.207 0.576 0.066 1.003 0.141 Latinx students (square root)
3.644 1.861 3.008 1.645 0.386 3.895 1.876 3.593 1.786 0.169
White students –0.256 0.696 0.003 1.003 0.259 -0.415 0.631 -0.206 0.981 0.214 Male students 0.326 0.547 –0.004 1.004 0.330 0.329 0.577 0.266 0.639 0.098
Federal program eligibility (standardized)
English learner 0.274 1.242 –0.003 0.997 0.277 0.389 1.298 0.259 1.128 0.115 Free or reduced-price lunch (reciprocal, cubed)
0.000006
0.000006
0.00003
0.0004
0.055 0.000004
0.000005
0.000005
0.000004
0.155
Special education –0.049 0.531 0.001 1.005 0.049 -0.066 0.470 -0.035 0.683 0.046
Average ACT Aspire scores (standardized)
English language arts (cubed)
–0.079 0.760 -0.006 4.842 0.015 –0.229 0.704 –0.199 2.545 0.012
Math –0.003 0.577 0.00003
1.004 0.003 –0.101 0.523 –0.002 0.903 0.110
Teacher experience (standardized)
Average years of experience
0.105 0.866 –0.001 1.002 0.106 0.255 0.829 0.055 0.923 0.216
Percentage of beginning teachers
–0.180 0.881 0.002 1.002 0.182 –0.250 0.780 –0.174 0.808 0.095
* p < 0.05, ** p < 0.01, *** p < 0.001
Source: Authors’ analysis of Arkansas Division of Elementary and Secondary Education data, 2016/17.

Professional Learning Communities at Work® Generates Achievement Gains in Arkansas 25
Table A2. Baseline means and standard deviations of treatment and comparison group student characteristics before and after the coarsened exact matching process
Group
Unmatched Matched
PLC at Work (N =12 schools; 5,360 students)
Comparison (N=645 schools; 198,921 students)
PLC at Work (N = 87 schools; 2,625 students)
Comparison (N = 313 schools; 44,305 students)
Variables Mean S.D. Mean S.D. Hedge’s g or Cox’s index
Mean S.D. Mean S.D. Hedge’s g or Cox’s index
English language arts score (standardized)
-0.017 0.668 -0.027 0.668 0.016 -0.010 0.955 0.013 0.956 0.024
Math score (standardized)
0.030 0.675 0.018 0.662 0.018 0.031 0.951 0.031 0.952 0.001
Grade level 6.636 2.148 6.399 2.278 0.104 5.263 1.718 5.288 1.721 0.014
Ever eligible for English learner services
0.167 0.373 0.125 0.331 0.202 0.149 0.356 0.151 0.358 0.083
Ever eligible for free or reduced-price lunch
0.816 0.387 0.808 0.394 0.033 0.856 0.351 0.853 0.374 0.053
Ever eligible for special education services
0.184 0.388 0.191 0.393 0.028 0.168 0.374 0.168 0.413 0.161
Black 0.187 0.390 0.193 0.395 0.023 0.224 0.417 0.218 0.413 0.061
Latinx 0.194 0.395 0.147 0.354 0.200 0.178 0.383 0.180 0.385 0.107
White 0.566 0.496 0.593 0.491 0.066 0.551 0.497 0.555 0.497 0.141
Male 0.520 0.500 0.518 0.500 0.004 0.524 0.500 0.527 0.499 0.022
* p < 0.05, ** p < 0.01, *** p < 0.001
Source: Authors’ analysis of Arkansas Division of Elementary and Secondary Education data, 2016/17.

26 Education Northwest
Table A3. Baseline means and standard deviations of treatment and comparison group student characteristics after the propensity score matching and coarsened exact matching processes, by race/ethnicity
* p < 0.05, ** p < 0.01, *** p < 0.001
Source: Authors’ analysis of Arkansas Division of Elementary and Secondary Education data, 2016/17.
Group Black Latinx White
PLC at Work (N = 43 schools; 588 students)
Comparison (N = 261 schools; 9,167 students)
PLC at Work (N = 29 schools; 467 students)
Comparison (N = 273 schools; 6,802 students)
PLC at Work (N = 59 schools; 1,450 students)
Comparison (N = 304 schools; 26,974 students)
Variable Mean (S.D.)
Mean (S.D.)
Hedge’s g or Cox’s index
Mean (S.D.) Mean (S.D) Hedge’s g or Cox’s index
Mean (S.D.) Mean (S.D.)
Hedge’s g or Cox’s index
English language arts score (standardized)
–0.378 (0.869)
–0.418 (0.780)
0.050 –0.098 (0.895)
–0.131 (0.709)
0.045 0.161 (0.966)
0.179 (0.898)
0.020
Math score (standardized)
–0.379 (0.836)
–0.465 (0.719)
0.118 –0.081 (0.886)
–0.106 (0.671)
0.038 0.237 (0.955)
0.195 (0.884)
0.047
Grade level 5.350 (1.494)
5.457 (1.637)
0.065 6.004 (1.974)
5.427 (1.730)
0.331 4.993 (1.649)
5.216 (1.686)
-0.132
Ever eligible for English learner services
0.002 (0.041)
0.000 (0.010)
1.665 0.788 (0.409)
0.844 (0.363)
0.227 0.000 (0.000)
0.000 (0.000)
0.000
Ever eligible for free or reduced-price lunch
0.983 (0.129)
0.994 (0.077)
0.638 0.985 (0.122)
0.997 (0.051)
1.058 0.757 (0.429)
0.750 (0.433)
0.023
Ever eligible for special education services
0.192 (0.394)
0.163 (0.369)
0.122
0.167 (0.373)
0.085 (0.279)
0.466
0.161 (0.367)
0.140 (0.347)
0.097
Male 0.495 (0.500)
0.495 (0.500)
0.001 0.550 (0.498)
0.539 (0.499)
0.028 0.524 (0.500)
0.518 (0.500)
0.015

Professional Learning Communities at Work® Generates Achievement Gains in Arkansas 27
Table A4. Baseline means and standard deviations of treatment and comparison group student characteristics after the propensity score matching and coarsened exact matching processes, by English learner status
* p < 0.05, ** p < 0.01, *** p < 0.001
Source: Authors’ analysis of Arkansas Division of Elementary and Secondary Education data, 2016/17.
Group Current English learner Former English learner Never English learner
PLC at Work (N = 23 schools; 264 students)
Comparison (N = 232 schools; 3.471 students)
PLC at Work (N = 15 schools; 127 students)
Comparison (N = 199 schools; 2,393 students)
PLC at Work (N = 84 schools; 2,234 students)
Comparison (N = 305 schools; 38,441 students)
Variable Mean (S.D.) Mean (S.D.) Hedge’s g or Cox’s index
Mean (S.D.) Mean (S.D.) Hedge’s g or Cox’s index
Mean (S.D.) Mean (S.D.) Hedge’s g or Cox’s index
English language arts score (standardized)
–0.406 (0.875)
–0.444 (0.684)
0.054 0.463 (0.673)
0.268 (0.534)
0.358 0.009 (0.960)
0.028 (0.895)
-0.021
Math score (standardized)
-0.346 (0.876)
-0.348 (0.635)
0.003
0.392 (0.740)
0.181 (0.605)
0.345 0.056 (0.956)
0.028 (0.881)
0.032
Grade level 6.508 (1.874)
5.732 (1.744)
0.442 5.654 (2.017)
5.195 (1.661)
0.273 5.096 (1.613)
5.260 (1.672)
0.098
Ever eligible for free or reduced-price lunch
0.992 (0.087)
0.999 (0.029)
1.319 1.000 (0.000)
1.000 (0.000)
0.000 0.832 (0.374)
0.821 (0.383)
0.043
Ever eligible for special education services
0.231 (0.422)
0.130 (0.337)
0.422 0.031 (0.175)
0.027 (0.161)
0.102 0.168 (0.374)
0.141 (0.348)
0.127
Black 0.004 (0.062)
0.000 (0.017)
1.563 0.000 (0.000)
0.000 (0.000)
0.000 0.263 (0.440)
0.238 (0.426)
0.079
Latinx 0.951 (0.217)
0.978 (0.145)
0.516 0.921 (0.270)
0.980 (0.142)
0.853 0.044 (0.206)
0.028 (0.164)
0.297
White 0.000 (0.000)
0.000 (0.000)
0.000 0.000 (0.000)
0.000 (0.000)
0.000 0.649 (0.477)
0.702 (0.458)
0.146
Male 0.561 (0.497)
0.575 (0.494)
0.036 0.551 (0.499)
0.481 (0.500)
0.172 0.517 (0.500)
0.511 (0.500)
0.016

28 Education Northwest
Table A5. Baseline means and standard deviations of treatment and comparison group student characteristics after the propensity score matching and coarsened exact matching processes, by gender
* p < 0.05, ** p < 0.01, *** p < 0.001 Source: Authors’ analysis of Arkansas Division of Elementary and Secondary Education data, 2016/17.
Group Male Female
PLC at Work (N = 64 schools; 1,373 students)
Comparison (N = 304 schools; 22,774 students)
PLC at Work (N = 57 schools; 1252 students)
Comparison (N = 295 schools; 21,531 students)
Variable Mean (S.D.) Mean (S.D.) Hedge’s g or Cox’s index
Mean (S.D.) Mean (S.D.) Hedge’s g or Cox’s index
English language arts score (standardized)
-0.139 (0.969)
-0.162 (0.886)
0.025
0.130 (0.917)
0.180 (0.828)
0.060
Math score (standardized)
0.019 (0.992)
–0.029 (0.887)
0.054 0.045 (0.902)
0.044 (0.825)
0.002
Grade level 5.269 (1.750)
5.269 (1.693)
0.000 5.260 (1.681)
5.318 (1.670)
0.035
Ever eligible for English learner services
0.159 (0.366)
0.138 (0.345) 0.099
0.138 (0.345)
0.126 (0.332)
0.063
Ever eligible for free or reduced-price lunch
0.866 (0.341)
0.848 (0.359)
0.089
0.845 (0.362)
0.842 (0.365)
0.015
Ever eligible for special education services
0.202 (0.401)
0.183 (0.387)
0.072
0.130 (0.337)
0.081 (0.273)
0.320
Black
0.212 (0.409)
0.199 (0.399)
0.047
0.237 (0.426)
0.215 (0.411)
0.077
Latinx 0.187 (0.390)
0.161 (0.367)
0.111
0.168 (0.374)
0.146 (0.353)
0.101
White 0.554 (0.497)
0.613 (0.487)
0.149 0.551 (0.498)
0.604 (0.489)
0.132

Professional Learning Communities at Work® Generates Achievement Gains in Arkansas 29
Table A6. Baseline means and standard deviations of treatment and comparison group student characteristics after the propensity score matching and coarsened exact matching processes, by eligibility for free or reduced-price lunch
Group Eligible for free or reduced-price lunch in any school year
Never eligible for free or reduced-price lunch in any school year
PLC at Work (N = 82 schools; 2,247 students)
Comparison (N = 304 schools; 37437 students)
PLC at Work (N = 17 schools; 378 students)
Comparison (N = 216 schools; 6868 students)
Variable Mean (S.D.) Mean (S.D.) Hedge’s g or Cox’s index
Mean (S.D.) Mean (S.D.) Hedge’s g or Cox’s index
English language arts score (standardized)
–0.123 (0.929)
–0.110 (0.850)
0.015
0.654 (0.822)
0.625 (0.741)
0.039
Math score (standardized)
–0.083 (0.907)
–0.108 (0.822)
0.030
0.714 (0.917)
0.628 (0.779)
0.109
Grade level 5.211 (1.693)
5.319 (1.683)
0.064
5.582 (1.824)
5.152 (1.668)
0.257
Ever eligible for English learner services
0.173 (0.378)
0.157 (0.363)
0.073
0.005 (0.073)
0.000 (0.021)
1.514
Ever eligible for special education services
0.182 (0.386)
0.150 (0.357)
0.137
0.085 (0.279)
0.043 (0.202)
0.445
Black 0.257 (0.437)
0.243 (0.429)
0.045
0.026 (0.161)
0.008 (0.089)
0.736
Latinx 0.205 (0.404)
0.181 (0.385)
0.092
0.019 (0.135
0.003 (0.051)
1.195
White 0.489 (0.500)
0.541 (0.498)
0.126
0.931 (0.253)
0.981 (0.137)
0.804
Male 0.529 (0.499)
0.516 (0.500)
0.032 0.487 (0.500)
0.504 (0.500)
0.042
* p < 0.05, ** p < 0.01, *** p < 0.001
Source: Authors’ analysis of Arkansas Division of Elementary and Secondary Education data, 2016/17.

30 Education Northwest
Table A7. Baseline means and standard deviations of treatment and comparison group student characteristics after the propensity score matching and coarsened exact matching processes, by eligibility for special education services
Group Eligible for special education services in any school year
Never eligible for special education services in any school year
PLC at Work (N = 37 schools; 440 students)
Comparison (N = 288 schools; 5922 students)
PLC at Work (N = 77 schools; 2185 students)
Comparison (N = 304 schools; 38383 students)
Variable Mean (S.D.) Mean (S.D.) Hedge’s g or Cox’s index
Mean (S.D.) Mean (S.D.) Hedge’s g or Cox’s index
English language arts score (standardized)
–0.848 (0.918)
–0.905 (0.833)
0.067
0.158 (0.868)
0.145 (0.794)
0.017
Math score (standardized)
–0.648 (0.922)
–0.715 (0.797)
0.084
0.168 (0.896)
0.118 (0.812)
0.062
Grade level 5.182 (1.690)
5.153 (1.648)
0.017
5.281 (1.722)
5.315 (1.686)
0.020
Ever eligible for English learner services
0.148 (0.355)
0.087 (0.282)
0.362
0.149 (0.356)
0.139 (0.346)
0.048
Ever eligible for free or reduced-price lunch
0.927 (0.260)
0.951 (0.217)
0.251
0.842 (0.365)
0.829 (0.377)
0.057
Black 0.257 (0.437)
0.252 (0.434)
0.016
0.217 (0.413)
0.200 (0.400)
0.064
Latinx 0.177 (0.382)
0.098 (0.297)
0.418
0.178 (0.383)
0.162 (0.369)
0.068
White 0.530 (0.500)
0.639 (0.480)
0.274
0.557 (0.497)
0.604 (0.489)
0.118
Male 0.630 (0.483)
0.705 (0.456)
0.207 0.502 (0.500)
0.485 (0.500)
0.041
* p < 0.05, ** p < 0.01, *** p < 0.001
Source: Authors’ analysis of Arkansas Division of Elementary and Secondary Education data, 2016/17.

Professional Learning Communities at Work® Generates Achievement Gains in Arkansas 31
Appendix B. Complete regression results
This appendix presents full regression results for main treatment effects for all students and for
each group of students included in the group analysis.
Table B1. Full analytic sample results
English language arts (ELA) Math
PLC at Work Cohort 1 school 0.018 (0.039)
0.083*
(0.034) Baseline ELA score (standardized) 0.576***
(0.009)
0.236***
(0.010) Baseline math score (standardized) 0.170***
(0.008)
0.464***
(0.010) Special education –0.239***
(0.020)
–0.134***
(0.021) Male –0.140***
(0.009)
0.0670***
(0.009) Asian 0.119
(0.068) 0.085 (0.073)
Black –0.122***
(0.014)
–0.145***
(0.013) Latinx 0.039
(0.027) –0.032 (0.029)
American Indian and Alaska Native 0.086 (0.105)
–0.057 (0.082)
Native Hawaiian and Pacific Islander 0.108 (0.086)
0.031 (0.130)
Two or more races –0.060*
(0.026)
–0.076*
(0.034) Free or reduced-price lunch –0.046***
(0.012)
–0.101***
(0.013) Baseline grade level (2016/17) 0.021**
(0.007)
0.018*
(0.008) Gifted and talented 0.198***
(0.015)
0.303***
(0.018) Suspended or expelled –0.154***
(0.011)
–0.144***
(0.012) Ever English learner –0.075**
(0.029)
0.006 (0.030)
Chronically absent –0.098***
(0.011)
–0.127***
(0.013) Propensity score 0.120
(0.295) –0.129 (0.386)
Northwest 0.030 (0.039)
0.051 (0.042)
Northeast 0.041 (0.037)
0.040 (0.038)
Central 0.027 (0.028)
0.045 (0.033)
Southwest 0.055 (0.033)
0.070 (0.037)
School enrollment –0.0001*
(0.00003)
–0.0001 (0.00004)

32 Education Northwest
English language arts (ELA) Math School percentage eligible for free or reduced-price lunch
–0.001 (0.001)
–0.001 (0.001)
School average baseline math score (standardized) –0.171*
(0.075)
0.372***
(0.097) School average baseline ELA score (standardized) 0.280***
(0.082)
–0.119 (0.095)
School percentage white –0.0001 (0.001)
–0.001 (0.001)
School percentage current or former English learner –0.001 (0.001)
–0.001 (0.001)
School is in a district that contains a PLC at Work school
0.039 (0.022)
–0.029 (0.024)
School percentage ever eligible for special education 0.001 (0.003)
–0.001 (0.004)
School percentage beginning teachers –0.223*
(0.088)
–0.340**
(0.108) Constant 0.158
(0.083) 0.177*
(0.087)
School random effect (constant) 0.128***
(0.007)
0.149***
(0.011) School random effect (residual) 0.509***
(0.006)
0.568***
(0.006)
N 46,946 46,946 N cluster 315 315 ll –34,939.2 –40,063.1
* p < 0.05, ** p < 0.01, *** p < 0.001
Source: Authors’ analysis of Arkansas Division of Elementary and Secondary Education data, 2016/17–2018/19.

Professional Learning Communities at Work® Generates Achievement Gains in Arkansas 33
Table B2. Results by gender Female Male
English language arts (ELA)
Math ELA Math
PLC at Work Cohort 1 school
0.035 (0.037)
0.068*
(0.031)
0.010 (0.047)
0.090*
(0.041) Baseline ELA score (standardized)
0.579***
(0.008)
0.242***
(0.011)
0.571***
(0.014)
0.230***
(0.014) Baseline math score (standardized)
0.167***
(0.008)
0.456***
(0.011)
0.172***
(0.014)
.0468***
(0.015) Special education –0.234***
(0.021)
–0.135***
(0.022)
–0.238***
(0.028)
–0.129***
(0.029) Asian 0.007
(0.064) 0.161 (0.086)
0.196*
(0.099)
0.040 (0.086)
Black –0.124***
(0.013)
–0.117***
(0.015)
–0.121***
(0.021)
–0.171***
(0.019) Latinx -0.023
(0.037) –0.077 (0.046)
0.090*
(0.036)
0.003 (0.035)
American Indian and Alaska Native
0.002 (0.134)
–0.088 (0.124)
0.221 (0.141)
–0.005 (0.098)
Native Hawaiian and Pacific Islander
0.030 (0.084)
–0.093 (0.071)
0.178 (0.136)
0.120 (0.169)
Two or more races 0.010 (0.025)
-0.056*
(0.028)
–0.125**
(0.041)
–0.095 (0.055)
Free or reduced-price lunch –0.031*
(0.015)
–0.100***
(0.014)
–0.064***
(0.015)
–0.105***
(0.020) Baseline grade level (2016/17)
0.016*
(0.007)
0.009 (0.009)
0.021**
(0.007)
0.018*
(0.008) Gifted and talented 0.185***
(0.015)
0.276***
(0.017)
0.217***
(0.024)
0.334***
(0.029) Suspended or expelled –0.147***
(0.014)
–0.131***
(0.014)
–0.154***
(0.014)
–0.148***
(0.015) Ever English learner -0.038
(0.039) 0.038 (0.046)
–0.101**
(0.039)
–0.016 (0.039)
Chronically absent -0.093***
(0.016)
–0.127***
(0.016)
–0.101***
(0.016)
–0.124***
(0.021) Propensity score 0.274
(0.328) –0.225 (0.493)
–0.054 (0.351)
–0.175 (0.367)
Northwest 0.011 (0.040)
0.034 (0.042)
0.045 (0.046)
0.068 (0.050)
Northeast 0.014 (0.035)
0.033 (0.039)
0.056 (0.043)
0.050 (0.044)
Central 0.011 (0.028)
0.060 (0.032)
0.028 (0.034)
0.022 (0.040)
Southwest 0.022 (0.034)
0.059 (0.036)
0.078*
(0.038)
0.075 (0.043)
School enrollment –0.0001*
(0.00003)
–0.00004 (0.00004)
–0.00004 (0.00004)
–0.00002 (0.00004)
School percentage eligible for free or reduced-price lunch
–0.0004 (0.001)
–0.001 (0.001)
–0.0004 (0.001)
–0.001 (0.001)
School average baseline math score (standardized)
–0.178*
(0.075)
0.405***
(0.099)
–0.134 (0.089)
0.398***
(0.108) School average baseline ELA score (standardized)
0.333***
(0.088)
–0.125 (0.102)
0.222*
(0.094)
–0.164 (0.105)
School percentage white –0.001 –0.001 0.0002 –0.001

34 Education Northwest
Female Male
English language arts (ELA)
Math ELA Math
(0.0006) (0.001) (0.001) (0.001) School percentage current or former English learner
–0.001 (0.001)
–0.0001 (0.001)
–0.001 (0.001)
–0.001 (0.001)
School is in a district that contains a PLC at Work school
–0.001 (0.021)
–0.041 (0.025)
0.064*
(0.027)
–0.019 (0.029)
School percentage ever eligible for special education
0.001 (0.003)
–0.001 (0.004)
0.0004 (0.004)
–0.0002 (0.004)
School percentage beginning teachers
–0.181*
(0.086)
–0.260*
(0.109)
–0.200*
(0.101)
–0.330**
(0.120) Constant 0.209*
(0.083)
0.221*
(0.091)
–0.024 (0.096)
0.206*
(0.105)
School random effect (constant)
0.119***
(0.008)
0.138***
(0.013)
0.145***
(0.009)
0.168***
(0.155) School random effect (residual)
0.475***
(0.005)
0.536***
(0.005)
0.534***
(0.009)
0.591***
(0.008)
N 22,790 22,790 24,156 24,156 N cluster 298 298 313 313 ll –15,066.0 –17,766.5 –19,648.5 –22,162.5
* p < 0.05, ** p < 0.01, *** p < 0.001
Source: Authors’ analysis of Arkansas Division of Elementary and Secondary Education data, 2016/17–2018/19.

Professional Learning Communities at Work® Generates Achievement Gains in Arkansas 35
Table B3. Results by race/ethnicity for the three largest racial/ethnic groups Black Latinx White
English language arts (ELA)
Math ELA Math ELA Math
PLC at Work Cohort 1 school
0.070 (0.037)
0.019 (0.041)
–0.053 (0.042)
0.042 (0.071)
0.035 (0.034)
0.118**
(0.039) Baseline ELA score (standardized)
0.560***
(0.024)
0.265***
(0.024)
0.586***
(0.017)
0.264***
(0.023)
0.569***
(0.010)
0.218***
(0.011) Baseline math score (standardized)
0.146***
(0.028)
0.037***
(0.029)
0.190***
(0.020)
0.488***
(0.020)
0.175***
(0.009)
0.486***
(0.010) Special education –0.267***
(0.059)
–0.145*
(0.058)
–0.202***
(0.035)
-0.093**
(0.034)
–0.231***
(0.018)
–0.147***
(0.020) Male –0.165***
(0.018)
0.019 (0.018)
–0.079***
(0.021)
0.113***
(0.021)
–0.145***
(0.009)
0.071***
(0.009) Free or reduced–price lunch
–0.033 (0.063)
–0.146 (0.103)
–0.083 (0.083)
–0.079 (0.112)
–0.053*** (0.011)
–0.087*** (0.013)
Baseline grade level (2016/17)
–0.0001 (0.008)
–0.009 (0.009)
0.008 (0.012)
–0.020 (0.015)
0.029*** (0.007)
0.034*** (0.009)
Gifted and talented 0.287***
(0.049)
0.384***
(0.052)
0.189*** (0.034)
0.225*** (0.049)
0.182*** (0.013)
0.286*** (0.017)
Suspended or expelled –0.113***
(0.014)
–0.099***
(0.017)
–0.174*** (0.036)
–0.149*** (0.025)
–0.170*** (0.013)
–0.160*** (0.014)
Ever English learner –1.156***
(0.091)
0.147***
(0.025)
–0.059* (0.025)
0.032 (0.027)
‡ ‡
Chronically absent –0.101***
(0.019)
–0.089***
(0.025)
-0.084** (0.029)
–0.093 (0.048)
–0.092*** (0.013)
–0.138*** (0.015)
Propensity score –0.131 (0.385)
–0.292 (0.362)
0.540 (0.584)
0.428 (1.042)
–0.371 (0.307)
–0.502 (0.356)
Northwest 0.059 (0.063)
0.082 (0.067)
0.029 (0.063)
–0.158 (0.090)
0.008 (0.042)
0.050 (0.045)
Northeast –0.010 (0.044)
0.071 (0.039)
–0.039 (0.063)
–0.094 (0.084)
0.065 (0.040)
0.044 (0.039)
Central 0.004 (0.032)
0.017 (0.033)
0.0003 (0.055)
-0.055 (0.076)
0.033 (0.032)
0.045 (0.036)
Southwest 0.007 (0.043)
0.069 (0.040)
0.100 (0.053)
-0.025 (0.086)
0.052 (0.036)
0.063 (0.038)
School enrollment –0.00001 (0.00004)
0.00002 (0.0001)
-0.0001 (0.0001)
0.0001 (0.0001)
-0.0001*
(0.00004)
-0.0001*
(0.00004) School percentage eligible for free or reduced–price lunch
0.0002 (0.0007)
0.00006 (0.0007)
–0.001 (0.001)
–0.001 (0.001)
–0.00001 (0.0006)
–0.0008 (0.0007)
School average baseline math score (standardized)
–0.266*
(0.111)
0.437***
(0.110)
–0.128 (0.131)
0.392***
(0.143)
–0.167*
(0.079)
0.352**
(0.111)
School average baseline ELA score (standardized)
0.473***
(0.121)
–0.179 (0.134)
0.320*
(0.129)
–0.154 (0.160)
0.276**
(0.086)
–0.070 (0.104)
School percentage white
0.0009 (0.0008)
0.00005 (0.0008)
–0.0008 (0.001)
–0.001 (0.001)
–0.001 (0.0007)
–0.001 (0.0008)
School percentage current or former English learner
–0.0003 (0.002)
–0.0004 (0.002)
–0.002 (0.001)
0.0008 (0.002)
–0.0005 (0.001)
–0.0003 (0.001)
School is in a district that contains a PLC at Work school
0.019 (0.029)
–0.026 (0.028)
0.011 (0.034)
–0.027 (0.043)
0.018 (0.022)
–0.047 (0.026)

36 Education Northwest
School percentage ever eligible for special education
–0.003 (0.004)
–0.009*
(0.004)
0.007 (0.005)
0.016*
(0.006)
0.0003 (0.004)
–0.002 (0.004)
School percentage beginning teachers
–0.111 (0.116)
–0.192 (0.105)
–0.259 (0.171)
–0.195 (0.222)
-0.301**
(0.096)
–0.436***
(0.118) Constant 0.061
(0.112) 0.152 (0.132)
0.302 (0.158)
0.134 (0.190)
0.204*
(0.086)
0.172 (0.098)
School random effect (constant)
0.130***
(0.013)
0.129***
(0.015)
0.180***
(0.013)
0.206***
(0.033)
0.126***
(0.008)
0.152***
(0.015) School random effect (residual)
0.504***
(0.018)
0.531***
(0.013)
0.480***
(0.007)
0.549***
(0.008)
0.512***
(0.006)
0.579***
(0.005)
N 9,758 9,758 7,269 7,269 28,437 28,437 N cluster 268 268 280 280 311 311 ll -7,581.4 -8,112.4 –5,918.8 –7,042.7 –19,567.2 –22,785.8
* p < 0.05, ** p < 0.01, *** p < 0.001
Source: Authors’ analysis of Arkansas Division of Elementary and Secondary Education data, 2016/17–2018/19. Note: ‡ variables omitted because of collinearity.

Professional Learning Communities at Work® Generates Achievement Gains in Arkansas 37
Table B4. Results by federal program eligibility Eligible for free or
reduced-price lunch in any school year
Never eligible for free or reduced-price lunch
Eligible for special education services in any school year
Never eligible for special education services
ELA Math ELA Math ELA Math ELA Math
PLC at Work Cohort 1 school
0.018 (0.037)
0.085*
(0.034)
0.100*
(0.048)
0.036 (0.061)
0.026 (0.070)
0.013 (0.055)
0.020 (0.040)
0.089**
(0.031) Baseline ELA score (standardized)
0.576***
(0.010)
0.233***
(0.011)
0.561***
(0.014)
0.249***
(0.018)
0.558***
(0.032)
0.233***
(0.029)
0.581***
(0.007)
0.239***
(0.008)
Baseline math score (standardized)
0.170***
(0.010)
0.453***
(0.011)
0.172***
(0.014)
0.526***
(0.017)
0.129***
(0.032)
0.356***
(0.030)
0.180***
(0.008)
0.489***
(0.009)
Special education –0.237***
(0.022)
–0.148***
(0.023)
–0.239***
(0.036)
–0.028 (0.040)
Male –0.145***
(0.009)
0.065***
(0.009)
–0.124***
(0.016)
0.087***
(0.020)
–0.146 (0.028)
0.053*
(0.026)
–0.136***
(0.008)
0.068***
(0.008) Asian 0.159*
(0.075)
0.120 (0.075)
–0.215*
(0.091)
–0.037 (0.118)
0.471*
(0.240)
0.241***
(0.067)
0.095 (0.069)
0.086 (0.072)
Black –0.124***
(0.015)
–0.150***
(0.014)
–0.110 (0.067)
–0.106 (0.106)
-0.154***
(0.040)
–0.156***
(0.038)
–0.112***
(0.011)
–0.141***
(0.011) Latinx 0.037
(0.028) –0.032 (0.029)
0.100 (0.075)
0.006 (0.096)
0.118 (0.108)
–0.129*
(0.063)
0.021 (0.023)
–0.021 (0.031)
American Indian/Alaska Native
0.120 (0.113)
–0.082 (0.094)
–0.194 (0.204)
0.124 (0.197)
0.093 (0.352)
–0.039 (0.323)
0.075 (0.095)
–0.058 (0.067)
Native Hawaiian/Pacific Islander
0.106 (0.090)
0.018 (0.129)
‡ ‡ -0.308* (0.144)
0.139 (0.088)
0.135 (0.112)
0.025 (0.119)
Two or more races
–0.067* (0.027)
–0.075* (0.034)
0.036 (0.085)
–0.095 (0.145)
–0.080 (0.083)
0.021 (0.095)
–0.051*
(0.025)
–0.095**
(0.032) Free or reduced-price lunch
–0.057 (0.046)
–0.253***
(0.057)
–0.046***
(0.012)
–0.074***
(0.013) Baseline grade level (2016/17)
0.023** (0.007)
0.016 (0.008)
0.007 (0.009)
0.005 (0.013)
0.034** (0.011)
-0.010 (0.012)
0.015*
(0.007)
0.019*
(0.009) Gifted and talented
0.214***
(0.018)
0.328***
(0.021)
0.164***
(0.019)
0.198***
(0.028)
0.482***
(0.100)
0.689***
(0.094)
0.176***
(0.009)
0.264***
(0.014) Suspended or expelled
–0.152***
(0.012)
–0.146***
(0.012)
–0.153***
(0.033)
–0.147***
(0.039)
–0.143***
(0.027)
–0.113***
(0.029)
-0.161***
(0.012)
–0.151***
(0.011) Ever English learner
–0.079**
(0.029)
0.007 (0.031)
0.060 (0.101)
–0.260*
(0.122)
-0.236*
(0.110)
0.153*
(0.074)
–0.036 (0.026)
–0.013 (0.032)
Chronically absent –0.099***
(0.012)
–0.125***
(0.014)
–0.083**
(0.031)
–0.128**
(0.045)
–0.089**
(0.034)
–0.103***
(0.029)
–0.101***
(0.012)
–0.137***
(0.014) Propensity score 0.140
(0.289) –0.136 (0.394)
–0.197 (0.631)
–0.115 (0.866)
–0.531 (0.584)
–0.001 (0.514)
0.258 (0.300)
–0.215 (0.408)
Northwest 0.033 (0.039)
0.038 (0.041)
0.028 (0.058)
0.098 (0.068)
–0.016 (0.069)
0.068 (0.075)
0.040 (0.039)
0.041 (0.042)
Northeast 0.039 (0.037)
0.033 (0.037)
0.054 (0.059)
0.022 (0.063)
-0.050 (0.060)
0.0009 (0.057)
0.059 (0.037)
0.043 (0.039)
Central 0.025 (0.028)
0.032 (0.032)
0.030 (0.044)
0.118*
(0.050)
–0.022 (0.049)
0.045 (0.052)
0.035 (0.029)
0.041 (0.033)
Southwest 0.054 (0.033)
0.059 (0.036)
0.042 (0.047)
0.123*
(0.057)
0.041 (0.054)
0.077 (0.058)
0.056 (0.033)
0.059 (0.037)
School enrollment -0.0001*
(0.00004)
–0.0001 (0.00004)
–0.00003 (0.00004)
-0.00001 (0.0001)
-0.00001 (0.0001)
0.0001 (0.00005)
-0.0001*
(0.00003)
–0.0001 (0.00004)

38 Education Northwest
School percentage eligible for free or reduced-price lunch
–0.001 (0.001)
–0.001 (0.001)
0.002 (0.001)
0.001 (0.002)
0.0002 (0.001)
0.001 (0.001)
–0.0006 (0.001)
–0.001 (0.001)
School average baseline math score (standardized)
–0.177*
(0.076)
0.411***
(0.096)
–0.041 (0.106)
0.298 (0.155)
–0.158 (0.134)
0.359**
(0.128)
–0.164*
(0.073)
–0.394***
(0.100)
School average baseline ELA score (standardized)
0.286***
(0.083)
–0.150 (0.095)
0.240*
(0.110)
0.010 (0.155)
0.312*
(0.148)
–0.136 (0.132)
0.260***
(0.078)
–0.140 (0.099)
School percentage white
–0.0002 (0.0007)
–0.001 (0.0007)
–0.001 (0.001)
–0.0003 (0.001)
0.0006 (0.001)
0.0004 (0.001)
-0.0004 (0.0007)
–0.001 (0.0007)
School percentage current or former English learner
–0.0008 (0.0009)
–0.0006 (0.0009)
–0.001 (0.001)
–0.001 (0.002)
0.00001 (0.001)
-0.002 (0.002)
-0.0009 (0.0009)
–0.0005 (0.001)
School is in a district that contains a PLC at Work school
0.038 (0.022)
–0.033 (0.025)
0.029 (0.028)
–0.032 (0.035)
0.035 (0.042)
0.00004 (0.041)
0.034 (0.021)
–0.033 (0.025)
School percentage ever eligible for special education
0.00007 (0.003)
–0.0005 (0.004)
0.009 (0.006)
–0.0008 (0.006)
–0.002 (0.005)
–0.008 (0.005)
0.0008 (0.003)
-0.0003 (0.004)
School percentage beginning teachers
-0.222*
(0.089)
–0.333**
(0.108)
–0.142 (0.142)
–0.124 (0.160)
–0.330*
(-0.142)
–0.215 (0.150)
–0.187*
(0.090)
–0.331**
(0.113)
Constant 0.125 (0.084)
0.101 (0.086)
0.008 (0.142)
–0.029 (0.162)
–0.198 (0.152)
0.072 (0.154)
0.194*
(0.083)
0.187*
(0.091)
School random effect (constant)
0.128***
(0.007)
0.148***
(0.011)
0.121***
(0.012)
0.136***
(0.016)
0.184***
(0.018)
0.186***
(0.023)
0.128***
(0.007)
0.151***
(0.010) School random effect (residual)
0.517***
(0.007)
0.570***
(0.006)
0.452***
(0.007)
0.546***
(0.009)
0.595***
(0.021)
0.610***
(0.015)
0.485***
(0.003)
0.552***
(0.005)
N 39,699 39,699 7,247 7,247 6,364 6,364 40,582 40,582
N cluster 312 312 221 221 293 293 312 312
ll –30,455.8 –34,347.3 –4,370.6 –5,660.7 –7,204.1 –7,397.5 –27,186.0 –32,247.5
* p < 0.05, ** p < 0.01, *** p < 0.001
Source: Authors’ analysis of Arkansas Division of Elementary and Secondary Education data, 2016/17–2018/19. Note: ‡ variables omitted because of collinearity.

Professional Learning Communities at Work® Generates Achievement Gains in Arkansas 39
Table B5. Results by eligibility for English learner services Current English learner
in baseline year Former English learner in baseline year
Never English learner
English language arts (ELA)
Math ELA Math ELA Math
PLC at Work Cohort 1 school –0.055 (0.054)
0.017 (0.066)
–0.034 (0.049)
0.152*
(0.076)
0.038 (0.036)
0.090**
(0.029) Baseline ELA score (standardized)
0.562***
(0.029)
0.272***
(0.042)
0.500***
(0.033)
0.165***
(0.032)
0.570***
(0.010)
0.231***
(0.011) Baseline math score (standardized)
0.199***
(0.020)
0.444***
(0.034)
0.100***
(0.030)
0.465***
(0.034)
0.170***
(0.009)
0.464***
(0.010) Special education –0.239***
(0.043)
–0.060 (0.044)
–0.060 (0.104)
–0.041 (0.089)
–0.237***
(0.022)
-0.143***
(0.023) Male –0.038
(0.028) 0.096***
(0.029)
–0.110*** (0.031)
0.116** (0.037)
–0.152***
(0.008)
0.060***
(0.009) Asian –0.282
(0.181) -0.312 (0.358)
0.012 (0.192)
0.331 (0.178)
0.019 (0.062)
0.086 (0.061)
Black –1.793***
(0.197)
–0.429 (0.359)
‡ ‡ –0.126***
(0.014)
–0.148***
(0.014) Latinx –0.455**
(0.157)
-0.558 (0.347)
–0.062 (0.181)
0.180** (0.068)
0.039 (0.026)
–0.024 (0.030)
American Indian/Alaska Native 0.403**
(0.152)
–1.323***
(0.348)
‡ ‡ 0.072 (0.105)
–0.051 (0.083)
Native Hawaiian/Pacific Islander
–0.313 (0.160)
–0.354 (0.408)
0.0005 (0.205)
0.004 (0.110)
-0.285*
(0.117)
–0.188 (0.227)
Two or more races –0.064*
(0.026)
–0.079*
(0.034) Free or reduced–price lunch 0.125**
(0.046)
0.249***
(0.069)
‡ ‡ –0.051***
(0.011)
–0.100***
(0.013) Baseline grade level (2016/17) 0.013
(0.015) -0.051***
(0.016)
0.023 (0.016)
0.008 (0.019)
0.022**
(0.007)
0.022*
(0.009) Gifted and talented 0.298***
(0.072)
0.390***
(0.083)
0.174*** (0.034)
0.256*** (0.058)
0.205***
(0.016)
0.305***
(0.019) Suspended or expelled –0.239***
(0.032)
–0.182***
(0.040)
–0.237*** (0.038)
–0.153 (0.095)
–0.145***
(0.011)
–0.140***
(0.012) Chronically absent –0.158***
(0.045)
–0.127*
(0.054)
0.091 (0.081)
–0.064 (0.067)
-0.095***
(0.013)
–0.124***
(0.015) Propensity score 1.422*
(0.664)
–0.155 (0.702)
–1.898 (1.010)
–0.342 (0.989)
0.014 (0.293)
–0.152 (0.384)
Northwest 0.191*
(0.087)
–0.014 (0.086)
0.033 (0.120)
–0.180 (0.173)
0.011 (0.039)
0.065 (0.043)
Northeast 0.146 (0.091)
-0.034 (0.086)
0.060 (0.123)
–0.056 (0.179)
0.039 (0.038)
0.047 (0.038)
Central 0.070 (0.075)
–0.033 (0.079)
–0.016 (0.095)
–0.084 (0.157)
0.030 (0.280)
0.056 (0.033)
Southwest 0.210**
(0.082)
0.129 (0.089)
0.081 (0.117)
–0.153 (0.169)
0.041 (0.033)
0.070 (0.037)
School enrollment 0.00001 (0.0001)
0.0001 (0.0001)
–0.00003 (0.0001)
0.00007 (0.0001)
–0.00009**
(0.00003)
–0.00006 (0.00004)
School percentage eligible for free or reduced–price lunch
0.0007 (0.001)
–0.0003 (0.001)
0.001 (0.002)
–0.001 (0.002)
–0.0005 (0.0006)
–0.0007 (0.0007)
School average baseline math score (standardized)
–0.092 (0.157)
0.303*
(0.154)
0.120 (0.199)
0.446*
(0.210)
–0.201**
(0.076)
0.359***
(0.101)

40 Education Northwest
School average baseline ELA score (standardized)
0.274 (0.140)
–0.201 (0.149)
0.124 (0.185)
–0.242 (0.217)
0.320***
(0.085)
–0.090 (0.097)
School percentage white 0.001 (0.001)
0.0007 (0.001)
–0.003 (0.002)
0.0004 (0.002)
-0.0004 (0.0007)
–0.001 (0.0007)
School percentage current or former English learner
–0.001 (0.002)
0.0007 (0.002)
–0.003 (0.002)
0.001 (0.003)
0.00007 (0.001)
–0.0006 (0.0009)
School is in a district that contains a PLC at Work school
0.027 (0.039)
–0.008 (0.041)
0.104*
(0.051)
0.008 (0.053)
0.028 (0.021)
–0.039 (0.024)
School percentage ever eligible for special education
0.0008 (0.007)
0.008 (0.007)
–0.012 (0.009)
–0.002 (0.008)
0.001 (0.003)
–0.001 (0.004)
School percentage beginning teachers
0.110 (0.207)
0.169 (0.224)
–0.380 (0.275)
–0.226 (0.357)
–0.268**
(0.090)
-0.360***
(0.109) Constant –0.043
(0.245) 0.322 (0.360)
0.461 (0.300)
–0.003 (0.266)
0.186*
(0.084)
0.185*
(0.090)
School random effect (constant) 0.164 (0.016)
0.153***
(0.016)
0.206***
(0.027)
0.194***
(0.023)
0.126***
(0.007)
0.149***
(0.012) School random effect (residual) 0.474
(0.013) 0.540***
(0.010)
0.432***
(0.011)
0.534***
(0.017)
0.512***
(0.007)
0.570***
(0.006)
N 3,735 3,735 2,520 2,520 40,691 40,691
N cluster 240 240 206 206 314 314
ll –3,086.8 –3,642.2 –1,593.3 –2,115.3 -29,915.9 -34,148.3
* p < 0.05, ** p < 0.01, *** p < 0.001
Source: Authors’ analysis of Arkansas Division of Elementary and Secondary Education data, 2016/17. Note: ‡ variables omitted because of collinearity.

Professional Learning Communities at Work® Generates Achievement Gains in Arkansas 41
Appendix C. Supplementary results
This appendix presents results using propensity score matching to determine baseline
equivalency between PLC at Work students and comparison students. That is, the second-stage
matching procedure—coarsened exact matching—is not performed. The analysis complements
the main study’s findings with results that are similar in direction and magnitude. Baseline
equivalency tables (tables C1–C6) are followed by full regression results (tables C7–C10).
Table C1. Baseline means and standard deviations of treatment and comparison group student characteristics after the propensity score matching process PLC at Work
(N = 122 schools; 3,301 students)
Comparison (N = 587 schools; 109,696 students)
Variables Mean S.D. Mean S.D. Hedge’s g or Cox’s index
English language arts score (standardized)
0.011 0.638 –0.004 0.658 0.024
Math score (standardized) 0.040 0.650 0.038 0.661 0.003
Grade level 5.201 1.655 5.389 1.710 0.110
Ever eligible for English learner services
0.131 0.338 0.134 0.340 0.014
Ever eligible for free or reduced-price lunch
0.830 0.376 0.806 0.395 0.098
Ever eligible for special education services
0.179 0.383 0.188 0.391 0.037
Black 0.208 0.406 0.173 0.378 0.138
Latinx 0.164 0.370 0.156 0.363 0.034
White 0.582 0.493 0.606 0.489 0.062
Male 0.520 0.500 0.518 0.500 0.006
* p < 0.05, ** p < 0.01, *** p < 0.001
Source: Authors’ analysis of Arkansas Division of Elementary and Secondary Education data, 2016/17.

42 Education Northwest
Table C2. Baseline means and standard deviations of treatment and comparison group student characteristics after the propensity score matching process, by race/ethnicity
* p < 0.05, ** p < 0.01, *** p < 0.001
Source: Authors’ analysis of Arkansas Division of Elementary and Secondary Education data, 2016/17.
Group Black Latinx White
PLC at Work (N =52 schools; 685 students)
Comparison (N = 459 schools; 18,924 students)
PLC at Work (N =43 schools; 541 students)
Comparison (N = 543 schools; 17,148 students)
PLC at Work (N = 79 schools; 1,921 students)
Comparison (N = 565 schools; 66,528 students)
Variable Mean (S.D.) Mean (S.D.) Hedge’s g or Cox’s index
Mean (S.D.) Mean (S.D.)
Hedge’s g or Cox’s index
Mean (S.D.) Mean (S.D.)
Hedge’s g or Cox’s index
English language arts score (standardized)
–0.201 (0.600)
–0.261 (0.622)
0.096 –0.039 (0.590)
–0.067 (0.613)
0.046 0.099 (0.641)
0.083 (0.656)
0.025
Math score (standardized)
–0.190 (0.594)
–0.254 (0.595)
0.108 –0.018 (0.590)
–0.009 (0.591)
0.017 0.136 (0.658)
0.130 (0.665)
0.010
Grade level 5.382 (1.482)
5.440 (1.793)
0.032 5.887 (1.943)
5.325 (1.692)
0.331 4.940 (1.561)
5.392 (1.694)
0.267
Ever eligible for English learner services
0.003 (0.054)
0.003 (0.050)
0.086 0.741 (0.438)
0.737 (0.440)
0.014 0.001 (0.032)
0.003 (0.051)
0.566
Ever eligible for free or reduced-price lunch
0.968 (0.176)
0.966 (0.181)
0.031 0.967 (0.180)
0.961 (0.194)
0.103 0.737 (0.440)
0.715 (0.451)
0.066
Ever eligible for special education services
0.193 (0.395)
0.210 (0.407)
0.065 0.179 (0.384)
0.158 (0.365)
0.092 0.174 (0.380)
0.191 (0.393)
0.069
Male 0.498 (0.500)
0.507 (0.500)
0.022 0.555 (0.497)
0.516 (0.500)
0.094 0.516 (0.500)
0.522 (0.499)
0.015
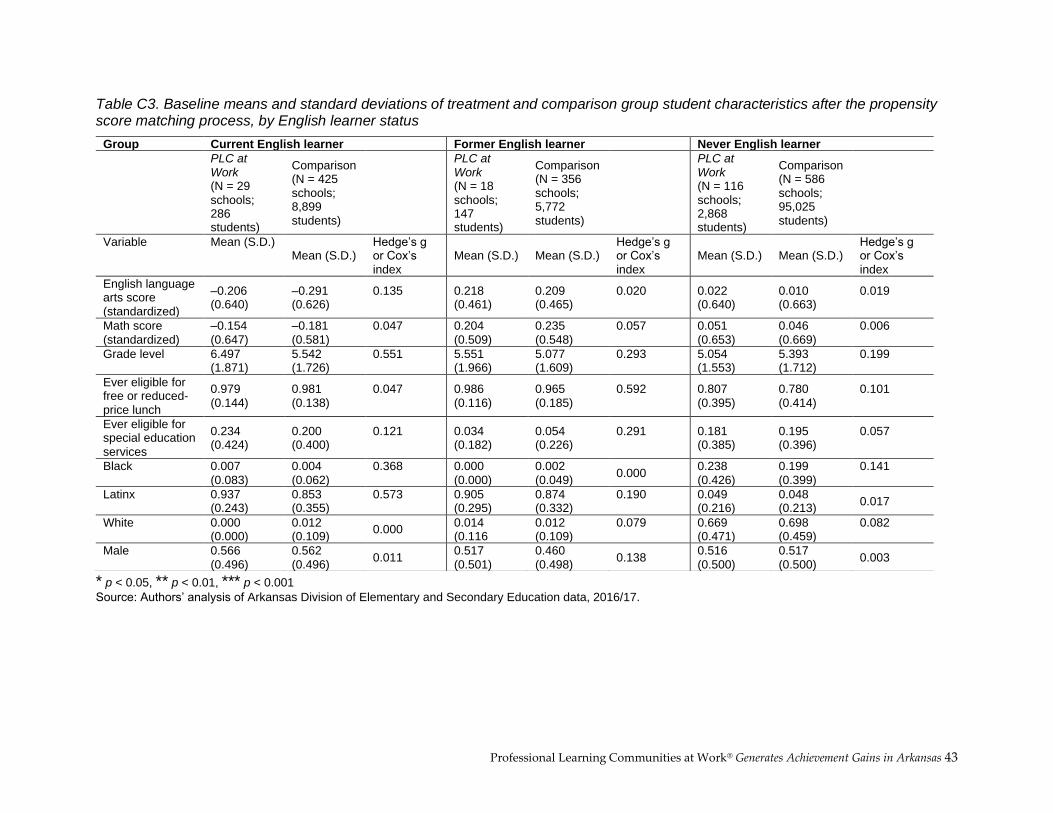
Professional Learning Communities at Work® Generates Achievement Gains in Arkansas 43
Table C3. Baseline means and standard deviations of treatment and comparison group student characteristics after the propensity score matching process, by English learner status
* p < 0.05, ** p < 0.01, *** p < 0.001
Source: Authors’ analysis of Arkansas Division of Elementary and Secondary Education data, 2016/17.
Group Current English learner Former English learner Never English learner
PLC at Work (N = 29 schools; 286 students)
Comparison (N = 425 schools; 8,899 students)
PLC at Work (N = 18 schools; 147 students)
Comparison (N = 356 schools; 5,772 students)
PLC at Work (N = 116 schools; 2,868 students)
Comparison (N = 586 schools; 95,025 students)
Variable Mean (S.D.) Mean (S.D.)
Hedge’s g or Cox’s index
Mean (S.D.) Mean (S.D.) Hedge’s g or Cox’s index
Mean (S.D.) Mean (S.D.) Hedge’s g or Cox’s index
English language arts score (standardized)
–0.206 (0.640)
–0.291 (0.626)
0.135
0.218 (0.461)
0.209 (0.465)
0.020
0.022 (0.640)
0.010 (0.663)
0.019
Math score (standardized)
–0.154 (0.647)
–0.181 (0.581)
0.047
0.204 (0.509)
0.235 (0.548)
0.057
0.051 (0.653)
0.046 (0.669)
0.006
Grade level 6.497 (1.871)
5.542 (1.726)
0.551
5.551 (1.966)
5.077 (1.609)
0.293
5.054 (1.553)
5.393 (1.712)
0.199
Ever eligible for free or reduced-price lunch
0.979 (0.144)
0.981 (0.138)
0.047
0.986 (0.116)
0.965 (0.185)
0.592
0.807 (0.395)
0.780 (0.414)
0.101
Ever eligible for special education services
0.234 (0.424)
0.200 (0.400)
0.121
0.034 (0.182)
0.054 (0.226)
0.291
0.181 (0.385)
0.195 (0.396)
0.057
Black 0.007 (0.083)
0.004 (0.062)
0.368
0.000 (0.000)
0.002 (0.049)
0.000 0.238 (0.426)
0.199 (0.399)
0.141
Latinx 0.937 (0.243)
0.853 (0.355)
0.573
0.905 (0.295)
0.874 (0.332)
0.190
0.049 (0.216)
0.048 (0.213)
0.017
White 0.000 (0.000)
0.012 (0.109)
0.000 0.014 (0.116
0.012 (0.109)
0.079
0.669 (0.471)
0.698 (0.459)
0.082
Male 0.566 (0.496)
0.562 (0.496)
0.011 0.517 (0.501)
0.460 (0.498)
0.138 0.516 (0.500)
0.517 (0.500)
0.003

44 Education Northwest
Table C4. Baseline means and standard deviations of treatment and comparison group student characteristics after the propensity score matching process, by gender
* p < 0.05, ** p < 0.01, *** p < 0.001
Source: Authors’ analysis of Arkansas Division of Elementary and Secondary Education data, 2016/17.
Group Male Female
PLC at Work (N = 84 schools; 1,717 students)
Comparison (N = 582 schools; 56,793 students)
PLC at Work (N = 79 schools; 1,584 students)
Comparison (N = 571 schools; 52,903 students)
Variable Mean (S.D.) Mean (S.D.) Hedge’s g or Cox’s index
Mean (S.D.) Mean (S.D.) Hedge’s g or Cox’s index
English language arts score (standardized)
–0.082 (0.659)
–0.105 (0.670)
0.035
0.112 (0.599)
0.104 (0.626)
0.012
Math score (standardized)
0.028 (0.680)
0.014 (0.692)
0.020 0.052 (0.617)
0.064 (0.624)
0.018
Grade level 5.212 (1.681)
5.398 (1.713)
0.109 5.190 (1.627)
5.379 (1.706)
0.111
Ever eligible for English learner services
0.139 (0.346)
0.135 (0.342)
0.019
0.123 (0.329)
0.133 (0.339)
0.051
Ever eligible for free or reduced-price lunch
0.839 (0.367)
0.805 (0.396)
0.144
0.820 (0.384)
0.807 (0.394)
0.050
Ever eligible for special education services
0.217 (0.412)
0.236 (0.425)
0.066
0.137 (0.344)
0.136 (0.343)
0.005
Black 0.199 (0.399)
0.169 (0.375)
0.120
0.217 (0.412)
0.176 (0.381)
0.157
Latinx 0.175 (0.380)
0.156 (0.363)
0.083
0.152 (0.359)
0.157 (0.364)
0.022
White 0.578 (0.494)
0.612 (0.487)
0.086
0.586 (0.493)
0.600 (0.490)
0.035

Professional Learning Communities at Work® Generates Achievement Gains in Arkansas 45
Table C5. Baseline means and standard deviations of treatment and comparison group student characteristics after the propensity score matching process, by eligibility for free or reduced-price lunch
Group Eligible for free or reduced-price lunch in any school year Never eligible for free or reduced-price lunch in any school year
PLC at Work (N = 117 schools; 2,740 students)
Comparison (N = 585 schools; 88416 students)
PLC at Work (N = 24 schools; 561 students)
Comparison (N = 421 schools; 21,280 students)
Variable Mean (S.D.) Mean (S.D.) Hedge’s g or Cox’s index
Mean (S.D.) Mean (S.D.) Hedge’s g or Cox’s index
English language arts score (standardized)
–0.058 (0.620)
–0.081 (0.638)
0.036 0.349 (0.617)
0.315 (0.643)
0.054
Math score (standardized)
–0.033 (0.611)
–0.041 (0.622)
0.013
0.394 (0.717)
0.367 (0.713)
0.038
Grade level 5.157 (1.639)
5.380 (1.715)
0.130
5.419 (1.716)
5.425 (1.686)
0.004
Ever eligible for English learner services
0.155 (0.362)
0.162 (0.368)
0.030
0.014 (0.119)
0.018 (0.132)
0.134
Ever eligible for special education services
0.193 (0.395)
0.205 (0.404)
0.045
0.107 (0.309)
0.116 (0.320)
0.053
Black 0.242 (0.428)
0.207 (0.405)
0.123 0.039 (0.194)
0.030 (0.171)
0.168
Latinx 0.191 (0.393)
0.186 (0.389)
0.018
0.032 (0.176)
0.032 (0.175)
0.010
White 0.517 (0.500)
0.538 (0.499)
0.052
0.900 (0.300)
0.890 (0.313)
0.068
Male 0.526 (0.499)
0.517 (0.500)
0.022
0.492 (0.500)
0.521 (0.500)
0.071
* p < 0.05, ** p < 0.01, *** p < 0.001
Source: Authors’ analysis of Arkansas Division of Elementary and Secondary Education data, 2016/17.

46 Education Northwest
Table C6. Baseline means and standard deviations of treatment and comparison group student characteristics after the propensity score matching processes, by eligibility for special education services
Group Eligible for special education services in any school year Never eligible for special education services in any school year
PLC at Work (N = 50 schools; 590 students)
Comparison (N = 564 schools; 20615 students)
PLC at Work (N = 106 schools; 2711 students)
Comparison (N = 585 schools; 89081 students)
Variable Mean (S.D.) Mean (S.D.) Hedge’s g or Cox’s index
Mean (S.D.) Mean (S.D.) Hedge’s g or Cox’s index
English language arts score (standardized)
-0.490 (0.720)
-0.490 (0.750)
0.000 0.120 (0.562)
0.108 (0.579)
0.021
Math score (standardized)
-0.317 (0.727)
-0.321 (0.710)
0.006
0.117 (0.605)
0.121 (0.620)
0.006
Grade level 5.100 (1.571)
5.351 (1.678)
0.150
5.224 (1.672)
5.397 (1.717)
0.101
Ever eligible for English learner services
0.122 (0.328)
0.102 (0.302)
0.125
0.133 (0.340)
0.141 (0.348)
0.041
Ever eligible for free or reduced-price lunch
0.898 (0.303)
0.881 (0.324)
0.109
0.815 (0.388)
0.789 (0.408)
0.101
Black 0.224 (0.417)
0.193 (0.395)
0.114
0.204 (0.403)
0.168 (0.374)
0.145
Latinx 0.164 (0.371)
0.131 (0.338)
0.159
0.164 (0.370)
0.162 (0.369)
0.008
White 0.568 (0.496)
0.618 (0.486)
0.125
0.585 (0.493)
0.604 (0.489)
0.047
Male 0.632 (0.483)
0.651 (0.477)
0.049
0.496 (0.500)
0.487 (0.500)
0.021
* p < 0.05, ** p < 0.01, *** p < 0.001
Source: Authors’ analysis of Arkansas Division of Elementary and Secondary Education data, 2016/17.

Professional Learning Communities at Work® Generates Achievement Gains in Arkansas 47
Table C7. Full analytic sample results English language arts (ELA) Math
PLC at Work Cohort 1 school 0.044*
(0.017)
0.061***
(0.019)
Baseline ELA score (standardized) 0.603***
(0.004)
0.347***
(0.004)
Baseline math score (standardized) 0.278***
(0.004)
0.477***
(0.004)
Special education –0.354***
(0.005)
–0.243***
(0.005)
Male –0.192***
(0.004)
0.061***
(0.004)
Asian 0.073***
(0.018)
0.163***
(0.019)
Black –0.198***
(0.006)
–0.235***
(0.007)
Latinx –0.032***
(0.009)
–0.066***
(0.009)
American Indian and Alaska Native –0.027 (0.030)
–0.019 (0.032)
Native Hawaiian and Pacific Islander –0.141***
(0.022)
–0.220***
(0.023)
Two or more races –0.043***
(0.009)
–0.068***
(0.010)
Free or reduced-price lunch –0.125***
(0.005)
–0.154***
(0.005)
Baseline grade level (2016/17) 0.008***
(0.002)
0.008***
(0.002)
Gifted and talented 0.393***
(0.006)
0.479***
(0.006)
Suspended or expelled –0.230***
(0.005)
–0.209***
(0.005)
Ever English learner –0.076***
(0.010)
–0.051***
(0.010)
Chronically absent –0.130***
(0.006)
–0.169***
(0.006)
Propensity score 1.236 (0.849)
–0.676 (0.988)
Northwest 0.036 0.027

48 Education Northwest
English language arts (ELA) Math
(0.024) (0.028)
Northeast 0.041 (0.023)
0.036 (0.027)
Central 0.012 (0.021)
0.029 (0.025)
Southwest 0.049*
(0.024)
0.068*
(0.028)
School enrollment –0.00002 (0.00002)
–0.0000005 (0.00002)
School percentage eligible for free or reduced-price lunch
0.0002 (0.0004)
0.00001 (0.0004)
School average baseline math score (standardized) –0.075 (0.047)
0.504***
(0.055)
School average baseline ELA score (standardized) 0.364***
(0.047)
–0.084 (0.055)
School percentage white –0.0002 (0.0003)
–0.002***
(0.0004)
School percentage current or former English learner –0.0005 (0.0005)
–0.0003 (0.0006)
School is in a district that contains a PLC at Work school
0.019 (0.015)
–0.027 (0.017)
School percentage ever eligible for special education 0.002 (0.002)
0.002 (0.002)
School percentage beginning teachers –0.031 (0.045)
–0.239***
(0.052)
Constant 0.213***
(0.049)
0.217***
(0.057)
School random effect (constant) –2.191***
(0.039)
–2.019***
(0.038)
School random effect (residual) –0.520***
(0.002)
–0.456***
(0.002)
N 112997 112997 N cluster 31 31 ll –102147.4 –109374.4
* p < 0.05, ** p < 0.01, *** p < 0.001
Source: Authors’ analysis of Arkansas Division of Elementary and Secondary Education data, 2016/17.

Professional Learning Communities at Work® Generates Achievement Gains in Arkansas 49
Table C8. Results by gender Female Male
English language arts (ELA)
Math ELA Math
PLC at Work Cohort 1 school 0.049*
(0.022)
0.035 (0.024)
0.030 (0.023)
0.080**
(0.025)
Baseline ELA score (standardized) 0.597***
(0.005)
0.356***
(0.006)
0.608***
(0.005)
0.341***
(0.005)
Baseline math score (standardized) 0.268***
(0.005)
0.470***
(0.005)
0.283***
(0.005)
0.481***
(0.005)
Special education –0.432***
(0.008)
–0.284***
(0.008)
–0.303***
(0.007)
–0.217***
(0.007)
Asian 0.047 (0.025)
0.166***
(0.027)
0.103***
(0.026)
0.161***
(0.027)
Black –0.188***
(0.009)
–0.197***
(0.010)
–0.208***
(0.009)
–0.272***
(0.010)
Latinx –0.041***
(0.012)
–0.062***
(0.013)
–0.023 (0.013)
–0.069***
(0.013)
American Indian and Alaska Native –0.010 (0.040)
–0.079 (0.043)
–0.042 (0.044)
0.045 (0.046)
Native Hawaiian and Pacific Islander –0.175***
(0.031)
–0.179***
(0.033)
–0.117***
(0.031)
–0.256***
(0.033)
Two or more races –0.026*
(0.013)
–0.064***
(0.013)
–0.058***
(0.014)
–0.069***
(0.015)
Free or reduced-price lunch –0.120***
(0.007)
–0.159***
(0.008)
–0.130***
(0.007)
–0.150***
(0.008)
Baseline grade level (2016/17) 0.011***
(0.003)
0.008*
(0.003)
0.002 (0.003)
0.005 (0.003)
Gifted and talented 0.355***
(0.008)
0.442***
(0.008)
0.436***
(0.008)
0.517***
(0.009)
Suspended or expelled –0.229***
(0.008)
–0.204***
(0.009)
–0.227***
(0.007)
–0.210***
(0.007)
Ever English learner –0.073***
(0.013)
–0.052***
(0.014)
–0.080***
(0.014)
–0.051***
(0.015)
Chronically absent –0.130***
(0.008)
–0.164***
(0.009)
–0.131***
(0.008)
–0.173***
(0.009)
Propensity score 1.185 (0.878)
–0.899 (1.040)
1.234 (0.944)
–0.886 (1.043)
Northwest 0.043 0.029 0.031 0.023

50 Education Northwest
Female Male
English language arts (ELA)
Math ELA Math
(0.025) (0.029) (0.026) (0.029)
Northeast 0.052*
(0.024)
0.035 (0.028)
0.034 (0.026)
0.034 (0.029)
Central 0.011 (0.022)
0.042 (0.026)
0.010 (0.024)
0.016 (0.026)
Southwest 0.038 (0.025)
0.069*
(0.029)
0.060*
(0.027)
0.065*
(0.029)
School enrollment –0.00003 (0.00002)
–0.000003 (0.00003)
0.000002 (0.00002)
0.00001 (0.00003)
School percentage eligible for free or reduced-price lunch
–0.0001 (0.0004)
0.00003 (0.0005)
0.0007 (0.0004)
0.0001 (0.0005)
School average baseline math score (standardized)
–0.092 (0.049)
0.517***
(0.058)
–0.0440 (0.053)
0.508***
(0.058)
School average baseline ELA score (standardized)
0.372***
(0.049)
-0.116*
(0.058)
0.350***
(0.053)
–0.067 (0.058)
School percentage white 0.0001 (0.0004)
-0.0008 (0.0004)
–0.0006 (0.0004)
–0.002***
(0.0004) School percentage current or former English learner
–0.0003 (0.0005)
-0.00005 (0.0006)
–0.0007 (0.0006)
–0.0006 (0.0006)
School is in a district that contains a PLC at Work school
0.003 (0.015)
–0.036*
(0.018)
0.034*
(0.017)
–0.015 (0.018)
School percentage ever eligible for special education
0.002 (0.002)
0.002 (0.002)
0.002 (0.002)
0.003 (0.002)
School percentage beginning teachers –0.009 (0.048)
–0.232***
(0.056)
–0.022 (0.051)
–0.210***
(0.056)
Constant 0.207***
(0.052)
0.182**
(0.061)
0.024 (0.056)
0.301***
(0.061)
School random effect (constant) –2.255***
(0.048)
–2.045***
(0.044)
–2.168***
(0.045)
–2.052***
(0.044)
School random effect (residual) –0.565***
(0.003)
–0.495***
(0.003)
–0.484***
(0.003)
–0.423***
(0.003) N 54487 54487 58510 58510 N cluster 30 30 30 30 ll –46902.7 -50728.6 –55053.9 –58639.3
* p < 0.05, ** p < 0.01, *** p < 0.001
Source: Authors’ analysis of Arkansas Division of Elementary and Secondary Education data, 2016/17.
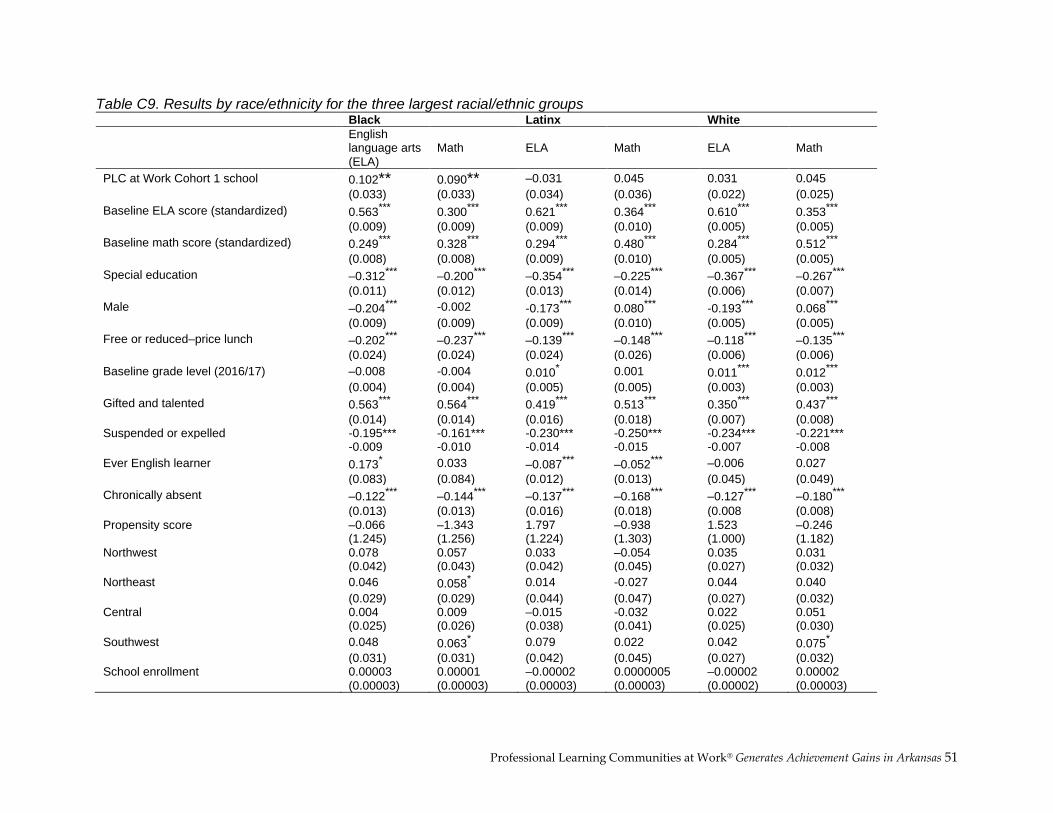
Professional Learning Communities at Work® Generates Achievement Gains in Arkansas 51
Table C9. Results by race/ethnicity for the three largest racial/ethnic groups Black Latinx White
English language arts (ELA)
Math ELA Math ELA Math
PLC at Work Cohort 1 school 0.102** 0.090** –0.031 0.045 0.031 0.045
(0.033) (0.033) (0.034) (0.036) (0.022) (0.025)
Baseline ELA score (standardized) 0.563*** 0.300*** 0.621*** 0.364*** 0.610*** 0.353***
(0.009) (0.009) (0.009) (0.010) (0.005) (0.005)
Baseline math score (standardized) 0.249*** 0.328*** 0.294*** 0.480*** 0.284*** 0.512***
(0.008) (0.008) (0.009) (0.010) (0.005) (0.005)
Special education –0.312*** –0.200*** –0.354*** –0.225*** –0.367*** –0.267***
(0.011) (0.012) (0.013) (0.014) (0.006) (0.007)
Male –0.204*** -0.002 -0.173*** 0.080*** -0.193*** 0.068***
(0.009) (0.009) (0.009) (0.010) (0.005) (0.005)
Free or reduced–price lunch –0.202*** –0.237*** –0.139*** –0.148*** –0.118*** –0.135***
(0.024) (0.024) (0.024) (0.026) (0.006) (0.006)
Baseline grade level (2016/17) –0.008 -0.004 0.010* 0.001 0.011*** 0.012***
(0.004) (0.004) (0.005) (0.005) (0.003) (0.003)
Gifted and talented 0.563*** 0.564*** 0.419*** 0.513*** 0.350*** 0.437***
(0.014) (0.014) (0.016) (0.018) (0.007) (0.008) Suspended or expelled -0.195*** -0.161*** -0.230*** -0.250*** -0.234*** -0.221*** -0.009 -0.010 -0.014 -0.015 -0.007 -0.008
Ever English learner 0.173* 0.033 –0.087*** –0.052*** –0.006 0.027
(0.083) (0.084) (0.012) (0.013) (0.045) (0.049)
Chronically absent –0.122*** –0.144*** –0.137*** –0.168*** –0.127*** –0.180***
(0.013) (0.013) (0.016) (0.018) (0.008 (0.008) Propensity score –0.066 –1.343 1.797 –0.938 1.523 –0.246 (1.245) (1.256) (1.224) (1.303) (1.000) (1.182) Northwest 0.078 0.057 0.033 –0.054 0.035 0.031 (0.042) (0.043) (0.042) (0.045) (0.027) (0.032)
Northeast 0.046 0.058* 0.014 -0.027 0.044 0.040
(0.029) (0.029) (0.044) (0.047) (0.027) (0.032) Central 0.004 0.009 –0.015 -0.032 0.022 0.051 (0.025) (0.026) (0.038) (0.041) (0.025) (0.030)
Southwest 0.048 0.063* 0.079 0.022 0.042 0.075*
(0.031) (0.031) (0.042) (0.045) (0.027) (0.032) School enrollment 0.00003 0.00001 –0.00002 0.0000005 –0.00002 0.00002 (0.00003) (0.00003) (0.00003) (0.00003) (0.00002) (0.00003)

52 Education Northwest
School percentage eligible for free or reduced–price lunch
0.0009 0.0002 –0.00005 –0.000008 0.0003 –0.00009
(–0.0006) (–0.0006) (0.0006) (0.0007) (0.0004) (0.0005) School average baseline math score (standardized)
–0.171* 0.489*** 0.114 0.459*** –0.055 0.503***
(0.079) (0.079) (0.075) (0.080) (0.051) (0.061) School average baseline ELA score (standardized)
0.487*** –0.146 0.381*** –0.107 0.336*** –0.070
(0.083) (0.083) (0.075) (0.080) (0.052) (0.062)
School percentage white 0.001 –0.0001 0.001 –0.0003 –0.001 –0.001*
(0.001) (0.001) (0.001) (0.001) (0.0004) (0.0005) School percentage current or former English learner
0.0003 0.0006 0.00002 0.0006 –0.0008 0.0002
(0.0009) (0.0009) (0.0007) (0.0008) (0.0006) (0.0007) School is in a district that contains a PLC at Work school
–0.024 –0.063** 0.024 –0.025 0.028 –0.015
(0.020) (0.020) (0.022) (0.023) (0.017) (0.020) School percentage ever eligible for special education
0.001 –0.002 0.007* 0.006 0.002 0.003
(0.003) (0.003) (0.003) (0.003) (0.002) (0.002)
School percentage beginning teachers 0.057 –0.255** –0.046 –0.358*** –0.067 –0.224***
(0.077) (0.077) (0.083) (0.089) (0.049) (0.057)
Constant 0.049 0.048 0.103 0.120 0.231*** 0.116
(0.076) (0.076) (0.088) (0.094) (0.057) (0.068)
School random effect (constant) –2.267*** -2.260*** –2.132*** –2.079*** –2.213*** –2.006***
(0.077) (0.081) (0.074) (0.071) (0.046) (0.043)
School random effect (residual) –0.550*** –0.540*** –0.537*** –0.462*** –0.511*** –0.442***
(0.005) (0.005) (0.005) (0.005) (0.003) (0.003)
N 19609 19609 17689 17689 68449 68449 N cluster 25 25 25 25 25 25 ll –17172.8 –17378.8 –15760.1 –17093.9 –62546.9 –67304.5
* p < 0.05, ** p < 0.01, *** p < 0.001
Source: Authors’ analysis of Arkansas Division of Elementary and Secondary Education data, 2016/17.

Professional Learning Communities at Work® Generates Achievement Gains in Arkansas 53
Table C10. Results by federal program eligibility Eligible for free or
reduced-price lunch in any school year
Never eligible for free or reduced-price lunch
Eligible for special education services in any school year
Never eligible for special education services
ELA Math ELA Math ELA Math ELA Math
PLC at Work Cohort 1 school 0.034 0.077*** 0.097** –0.003 –0.017 –0.002 0.052** 0.066***
(0.019) (0.020) (0.036) (0.041) (0.036) (0.037) (0.018) (0.020) Baseline ELA score (standardized) 0.616*** 0.350*** 0.540*** 0.335*** 0.602*** 0.331*** 0.602*** 0.360***
(0.004) (0.004) (0.008) (0.009) (0.008) (0.008) (0.004) (0.005) Baseline math score (standardized) 0.284*** 0.459*** 0.268*** 0.539*** 0.233*** 0.359*** 0.290*** 0.514***
(0.004) (0.004) (0.007) (0.008) (0.008) (0.008) (0.004) (0.004) Special education –0.348*** –0.243*** –0.341*** –0.250***
(0.005) (0.006) (0.012) (0.014) Male –0.191*** 0.060*** –0.198*** 0.063*** –0.119*** 0.096*** –0.208*** 0.054***
(0.004) (0.004) (0.008) (0.009) (0.010) (0.010) (0.004) (0.004) Asian 0.091*** 0.162*** 0.007 0.156*** 0.201** 0.141* 0.054** 0.151***
(0.021) (0.022) (0.034) (0.039) (0.064) (0.065) (0.018) (0.020) Black –0.195*** –0.237*** –0.145*** –0.216*** –0.179*** –0.219*** –0.203*** –0.238***
(0.007) (0.007) (0.023) (0.026) (0.016) (0.016) (0.007) (0.008) Latinx –0.026** –0.063*** –0.027 –0.068* –0.020 –0.055* –0.036*** –0.071***
(0.009) (0.010) (0.024) (0.027) (0.023) (0.023) (0.009) (0.010) American Indian/Alaska Native –0.030 –0.030 –0.017 0.019 0.025 0.080 –0.038 –0.039 (0.034) (0.036) (0.061) (0.069) (0.073) (0.074) (0.032) (0.035) Native Hawaiian/Pacific Islander –0.129*** –0.221*** –0.095 –0.147 –0.032 –0.183** –0.158*** –0.227***
(0.022) (0.024) (0.179) (0.203) (0.070) (0.071) (0.023) (0.024) Two or more races –0.044***– –0.067*** –0.027 –0.081** –0.067** –0.084*** –0.037*** –0.063***
(0.010) (0.011) (0.023) (0.026) (0.023) (0.024) (0.010) (0.011) Free or reduced-price lunch –0.183*** –0.202*** –0.111*** –0.135***
(0.015) (0.016) (0.005) (0.006) Baseline grade level (2016/17) 0.010*** 0.008** –0.006 –0.002 0.016*** –0.001 0.003 0.008**
(0.002) (0.003) (0.004) (0.005) (0.004) (0.004) (0.002) (0.003) Gifted and talented 0.444*** 0.520*** 0.305*** 0.372*** 0.760*** 0.862*** 0.365*** 0.432***
(0.007) (0.007) (0.010) (0.012) (0.024) (0.024) (0.006) (0.006) Suspended or expelled –0.225*** –0.207*** –0.224*** –0.247*** –0.174*** –0.161*** –0.245*** –0.221***
(0.005) (0.006) (0.017) (0.019) (0.012) (0.012) (0.006) (0.006) Ever English learner –0.080*** –0.049*** 0.025 –0.042 –0.094*** -0.043 –0.072*** –0.048***
(0.010) (0.011) (0.034) (0.039) (0.027) (0.027) (0.010) (0.011) Chronically absent –0.129*** –0.169*** –0.104*** –0.155*** –0.120*** –0.133*** –0.132*** –0.178***
(0.006) (0.007) (0.018) (0.021) (0.014) (0.014) (0.006) (0.007)

54 Education Northwest
Propensity score 1.029 –0.900 2.886* –0.577 1.639 –0.866 1.261 –0.650
(0.858) (0.990) (1.345) (1.566) (1.096) (1.086) (0.883) (1.074) Northwest 0.036 0.022 0.078* 0.055 0.069* 0.047 0.028 0.019
(0.024) (0.028) (0.037) (0.043) (0.031) (0.031) (0.025) (0.030) Northeast 0.039 0.030 0.0950* 0.053 0.059 0.042 0.039 0.032
(0.024) (0.027) (0.039) (0.046) (0.031) (0.030) (0.024) (0.029) Central 0.015 0.023 0.015 0.072 0.038 0.035 0.003 0.023 (0.022) (0.025) (0.034) (0.039) (0.029) (0.029) (0.022) (0.027) Southwest 0.055* 0.069* 0.034 0.068 0.080* 0.095** 0.042 0.057
(0.024) (0.028) (0.037) (0.043) (0.032) (0.032) (0.025) (0.030) School enrollment -0.00003 -0.00001 0.00004 0.00006* 0.000006 0.00004 -0.00001 0.000003 (0.00002) (0.00003) (0.00003) (0.00003) (0.00003) (0.00002) (0.00002) (0.00003) School percentage eligible for free or reduced-price lunch
0.0001 -0.0001 0.001 0.001 0.0006 0.0008 0.0002 -0.00009
(0.0004) (0.0004) (0.0009) (0.001) (0.0005) (0.0005) (0.0004) (0.0005) School average baseline math score (standardized)
–0.081 0.504*** 0.001 0.494*** 0.020 0.423*** –0.089 0.525***
(0.048) (0.055) (0.070) (0.081) (0.061) (0.060) (0.049) (0.060) School average baseline ELA score (standardized)
0.374*** –0.086 0.269*** –0.041 0.206*** –0.107 0.395*** –0.088
(0.048) (0.055) (0.073) (0.085) (0.062) (0.062) (0.049) (0.060) School percentage white –0.0003 –0.001*** –0.0006 –0.0009 –0.0006 –0.002*** –0.00009 –0.001** (0.0003) (0.0004) (0.0006) (0.0007) (0.0005) (0.0005) (0.0004) (0.0004) School percentage current or former English learner
–0.0005 –0.0003 –0.002* –0.0006 –0.0009 –0.0009 –0.0004 –0.0003
(0.0005) (0.0006) (0.0008) (0.001) (0.0007) (0.0007) (0.0005) (0.0006) School is in a district that contains a PLC at Work school
0.020 –0.031 0.039 –0.002 0.028 0.012 0.016 –0.039*
(0.015) (0.017) (0.022) (0.026) (0.019) (0.019) (0.015) (0.019) School percentage ever eligible for special education
0.002 0.002 0.003 0.004 –0.004 –0.004 0.004* 0.003
(0.002) (0.002) (0.003) (0.003) (0.002) (0.002) (0.002) (0.002) School percentage beginning teachers
–0.034 –0.237*** 0.000 –0.201* 0.016 –0.096 –0.015 –0.246***
(0.046) (0.053) (0.070) (0.082) (0.061) (0.061) (0.047) (0.057) Constant 0.088 0.079 0.201* 0.055 –0.202** -0.044 0.211*** 0.200**
(0.050) (0.058) (0.091) (0.105) (0.069) (0.069) (0.051) (0.062)
School random effect (constant) –2.196*** –2.029*** –2.228*** –2.057*** –2.360*** –2.404*** –2.159*** –1.935***
(0.041) (0.039) (0.065) (0.063) (0.076) (0.078) (0.040) (0.038) School random effect (residual) –0.510*** –0.459*** –0.580*** –0.451*** –0.409*** –0.392*** –0.554*** –0.480***
(0.002) (0.002) (0.005) (0.005) (0.005) (0.005) (0.002) (0.002)
N 91156 91156 21841 21841 21205 21205 91792 91792
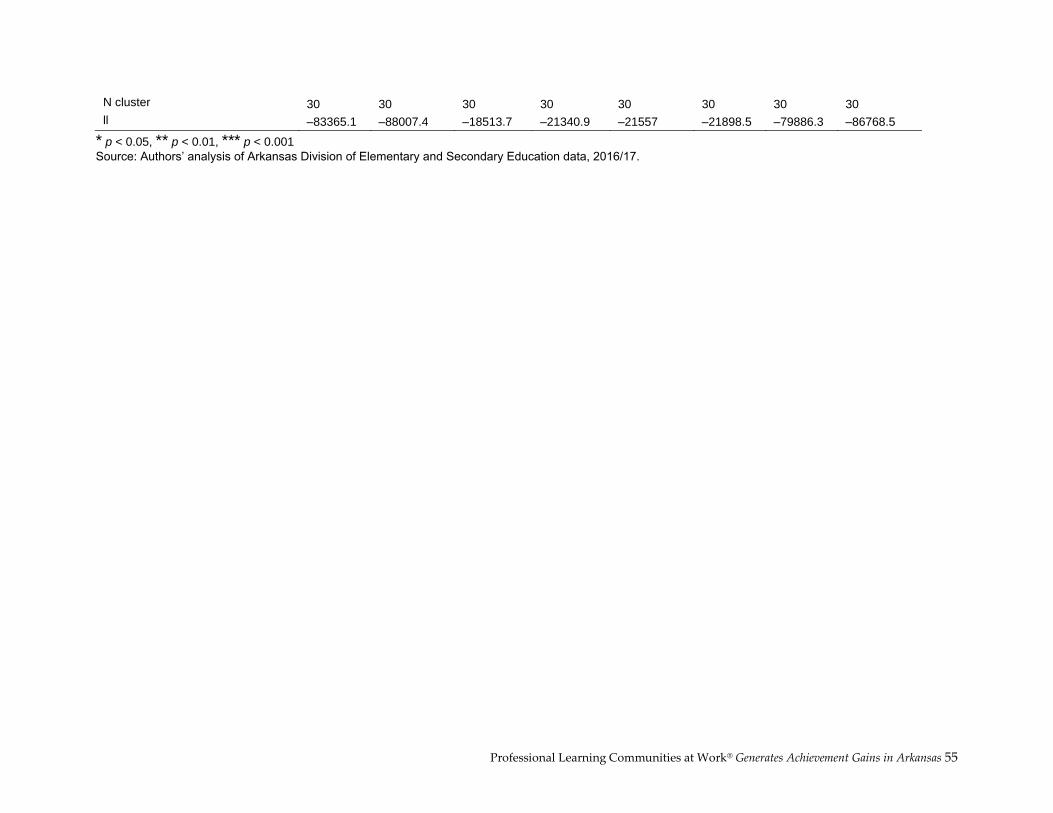
Professional Learning Communities at Work® Generates Achievement Gains in Arkansas 55
N cluster 30 30 30 30 30 30 30 30
ll –83365.1 –88007.4 –18513.7 –21340.9 –21557 –21898.5 –79886.3 –86768.5
* p < 0.05, ** p < 0.01, *** p < 0.001
Source: Authors’ analysis of Arkansas Division of Elementary and Secondary Education data, 2016/17.

56 Education Northwest
Table C11. Results by eligibility for English learner services Current English learner
in baseline year Former English learner in baseline year
Never English learner
English language arts (ELA)
Math ELA Math ELA Math
PLC at Work Cohort 1 school –0.025 0.095* 0.016 0.121 0.056** 0.058**
(0.043) (0.046) (0.054) (0.064) (0.019) (0.020) Baseline ELA score (standardized) 0.541*** 0.302*** 0.473*** 0.277*** 0.600*** 0.344***
(0.012) (0.013) (0.017) (0.020) (0.004) (0.004) Baseline math score (standardized) 0.236*** 0.378*** 0.205*** 0.497*** 0.277*** 0.477***
(0.012) (0.013) (0.014) (0.017) (0.004) (0.004) Special education -0.312*** -0.188*** -0.120*** -0.086* -0.355*** -0.248***
(0.016) (0.017) (0.031) (0.036) (0.005) (0.006) Male -0.152*** 0.076*** -0.157*** 0.113*** -0.195*** 0.058***
(0.012) (0.013) (0.014) (0.016) (0.004) (0.004) Asian 0.034 0.115 0.099 0.081 0.014 0.123***
(0.062) (0.066) (0.068) (0.080) (0.028) (0.029) Black 0.003 –0.228 –0.068 –0.315 –0.201*** –0.234***
(0.109) (0.118) (0.154) (0.181) (0.007) (0.007) Latinx –0.085 –0.088 –0.057 –0.176* –0.021* -0.059**
(0.056) (0.060) (0.064) (0.075) (0.009) (0.010) American Indian/Alaska Native –0.251 –0.242 ‡ ‡ –0.023 –0.019 (0.194) (0.209) (0.030) (0.032) Native Hawaiian/Pacific Islander –0.114 –0.202** –0.101 –0.231** –0.214** –0.078
(0.061) (0.065) (0.073) (0.086) (0.078) (0.083) Two or more races 0.040 –0.062 –0.122 0.010 –0.0445*** –0.070***
(0.093) (0.100) (0.105) (0.124) (0.009) (0.010) Free or reduced–price lunch –0.244*** –0.263*** –0.169*** –0.067 –0.125*** –0.154***
(0.044) (0.048) (0.040) (0.046) (0.005) (0.006) Baseline grade level (2016/17) 0.024*** 0.001 0.021** 0.025** 0.008*** 0.009***
(0.006) (0.007) (0.008) (0.009) (0.002) (0.002) Gifted and talented 0.594*** 0.726*** 0.316*** 0.412*** 0.391*** 0.472***
(0.029) (0.031) (0.022) (0.026) (0.006) (0.006) Suspended or expelled –0.206*** –0.195*** –0.203*** –0.298*** –0.229*** –0.204***
(0.017) (0.018) (0.026) (0.030) (0.005) (0.006) Chronically absent –0.185*** –0.189*** –0.0709* –0.136*** –0.127*** –0.167***
(0.021) (0.023) (0.032) (0.037) (0.006) (0.007) Propensity score 2.674 –0.706 3.465* –0.689 0.989 –0.672

Professional Learning Communities at Work® Generates Achievement Gains in Arkansas 57
(1.424) (1.501) (1.717) (2.125) (0.868) (1.013) Northwest 0.033 –0.070 0.089 –0.045 0.035 0.032 (0.052) (0.055) (0.077) (0.093) (0.024) (0.028) Northeast 0.040 –0.004 0.115 0.023 0.041 0.039 (0.057) (0.061) (0.086) (0.103) (0.023) (0.027) Central –0.022 –0.058 0.076 0.039 0.013 0.032 (0.047) (0.050) (0.073) (0.088) (0.021) (0.025) Southwest 0.081 0.008 0.124 0.030 0.045 0.071*
(0.053) (0.056) (0.079) (0.096) (0.024) (0.028) School enrollment –0.000002 0.000009 –0.00006 –0.00005 –0.00002 0.000003 (0.00003) (0.00003) (0.00004) (0.00005) (0.00002) (0.00002) School percentage eligible for free or reduced–price lunch
–0.0002 –0.0005 0.0003 0.0007 0.0003 0.00000
(0.0009) (0.0009) (0.001) (0.001) (0.0004) (0.0004) School average baseline math score (standardized) –0.175 0.333*** –0.108 0.473*** –0.076 0.493***
(0.092) (0.097) (0.110) (0.135) (0.048) (0.056) School average baseline ELA score (standardized) 0.362*** –0.045 0.269* –0.156 0.378*** –0.069
(0.090) (0.095) (0.110) (0.136) (0.048) (0.056) School percentage white 0.0001 –0.0009 0.0007 0.00004 –0.0004 –0.001*** (0.0008) (0.0008) (0.001) (0.001) (0.0003) (0.0004) School percentage current or former English learner –0.001 –0.0004 0.00002 –0.0004 –0.0004 –0.0003 (0.0009) (0.001) (0.001) (0.001) (0.0005) (0.0006) School is in a district that contains a PLC at Work school
0.021 –0.051 0.093** 0.022 0.011 –0.031
(0.026) (0.027) (0.030) (0.037) (0.015) (0.017) School percentage ever eligible for special education
0.001 –0.001 0.006 0.006 0.002 0.002
(0.004) (0.004) (0.005) (0.006) (0.002) (0.002) School percentage beginning teachers –0.012 –0.255* –0.135 –0.759*** –0.031 –0.230***
(0.114) (0.121) (0.147) (0.178) (0.045) (0.052) Constant 0.025 0.283* 0.201 0.230 0.231*** 0.204***
(0.127) (0.136) (0.159) (0.192) (0.049) (0.058)
School random effect (constant) –2.170*** –2.140*** –2.070*** –1.806*** –2.211*** –2.030***
(0.095) (0.097) (0.110) (0.096) (0.041) (0.039) School random effect (residual) –0.590*** –0.514*** –0.660*** –0.502*** –0.516*** –0.455***
(0.008) (0.008) (0.009) (0.009) (0.002) (0.002)
N 9185 9185 5919 5919 97893 97893 N cluster 30 30 29 29 30 30 ll –7708.7 –8403.5 –4578.1 –5523.1 –88876 –94896.6
* p < 0.05, ** p < 0.01, *** p < 0.001
Source: Authors’ analysis of Arkansas Division of Elementary and Secondary Education data, 2016/17. Note: ‡ variables omitted because of collinearity.