growing beans in the city: a case study of kampala, uganda
TRANSCRIPT

GROWING BEANS IN THE CITY: A CASE STUDY OF KAMPALA, UGANDA
Soniia David
Occasional Publications Series, No. 39
April, 2003

Correct citation: Soniia David, 2003. Growing beans in the city: a case study in Kampala, Uganda. Network on Bean Research in Africa, Occasional Publications Series, No. 39. CIAT, Kampala, Uganda.

i
PREFACE
This volume is the thirty-ninth in a series that serves research on common bean (Phaseolus vulgaris) and its smallholder production systems in Africa. It complements several previous publications in this series by extending focus to improving our understanding of the production, status and research needs of this important crop in peri-urban areas of Kampala, one of the main cities located in the crop’s East Africa heartland. The Network on Bean Research in Africa serves to stimulate, focus and coordinate research efforts on common bean, the systems within which it is produced and the people who consume it. The network is organized by CIAT in collaboration with two interdependent sub-regional networks of national programs: the Eastern and Central Africa Bean Research Network (ECABREN) and the Southern Africa Bean Research Network (SABRN) for southern Africa. Financial support for regional bean projects comes from: the Canadian International Development Agency (CIDA); the Swiss Agency for Development and Cooperation (SDC); the United States Agency for International Development (USAID); and the African Development Bank through the Southern Africa Development Conference (SADC). This Occasional Papers series includes bibliographies, research reports and network discussion papers. These publications are complemented by two associated series: Workshop Proceedings and Reprints. Further information on bean research in Africa is available from: Coordinator, Pan-Africa Bean Research Alliance, CIAT, P.O. Box 6247, Kampala,
Uganda. Coordinator, Eastern and Central Africa Bean Research Network, P.O. Box 2704,
Arusha, Tanzania. Coordinator, Southern Africa Bean Research Network, Chitedze Research Station, P.O.
Box 158, Lilongwe 3, Malawi.

ii
ACKNOWLEDGEMENTS
Field research for this paper was undertaken by Apollo Kalibala for his M.Sc. thesis in agricultural extension at Makerere University. Unfortunately, he did not proceed to write up his results and complete the thesis. I wish to thank Margaret Azuba, District Agricultural Officer for Kampala, for her helpful comments on an earlier draft. I am grateful to Dennis Bisase, my research assistant, for an admirable job in data entry and analysis.

1
GROWING BEANS IN THE CITY: A CASE STUDY OF KAMPALA, UGANDA
Soniia David1
INTRODUCTION Urban and peri-urban agriculture (UPA) is an increasingly important phenomenon throughout Africa. The vast majority of urban farmers are women, and most live in low-income households. Urban farming is typically a survival strategy to improve household food security and, in some cases, increase incomes. Yet, urban farmers throughout the developing world generally benefit little from agricultural research. The lack of attention to urban agriculture by agricultural researchers is also reflected in the focus of the growing literature on the subject. Many studies have been conducted on the social and economic benefits of UPA (e.g. Sawio, 1993; Mougeot, 1994; Maxwell, 1995; Sawio, 1998), access to land, legal and policy aspects (Maxwell, 1995), health and nutritional aspects, environmental (Rose, 1999) and gender related issues (Hovorka, 1998; Hasna, 1998), and a considerable literature exists on urban agriculture in Uganda (Kimeze, 2002). However, less attention has been given to a diagnosis of technical constraints and generating agricultural technologies appropriate to urban farmers. For example, a bibliography on UPA in Uganda listed only 5 entries of a technical nature (Kimeze, 2002). In 1999-2000 the International Center for Tropical Agriculture (CIAT) and the Ugandan National Bean Program (UNBP) undertook action research to disseminate and promote new bean varieties in Kampala, Uganda’s capital city. The project promoted seed marketing activities and investigated modalities for introducing climbing beans as a new technology (David et al., 2000b). The common bean (Phaseolus vulgaris L.) plays a paramount role in human nutrition and market economies throughout rural and urban areas of Eastern Africa. Eastern Africa has the highest bean production in sub-Saharan Africa at 1,297,000 tons per annum (Wortmann et al., 1999). The largest producing countries include Kenya, Uganda, D.R. Congo, Burundi, Tanzania, Rwanda and Ethiopia. While in Eastern Africa beans (and pulses in general) are considered a low status food, the “meat of the poor”, due to their low cost relative to animal products, they provide the second most important source of protein after maize and the third most important source of calories after maize and cassava (Pachico, 1993). Several studies show the important contribution bean research has made to rural poverty alleviation in Eastern Africa (Odendo et al., 2002; David et al., 2000a), yet little is know about bean production and consumption in urban areas and the potential impact of agricultural research. Donors, researchers and policy makers in East Africa may question attention to urban farming when the vast majority of poor people live in the rural areas. But recent demographic trends in sub-Saharan Africa provide a compelling rationale for supporting UPA. The continent is experiencing unprecedentedly high rates of urbanization (over 4% per annum), along with urbanization of poverty caused by lagging employment and 1 CIAT, Kawanda Agricultural Research Institute, P.O. Box 6247, Kampala, Uganda

2
income levels. One study forecast that by 2020, 35-40 million people (40% of the urban population) in Eritrea, Ethiopia, Kenya, Mozambique, Tanzania, Uganda, Zambia and Zimbabwe will be dependent upon urban food production for at least part of their needs (Denninger et al, 1998). For African countries seeking new economic opportunities for small-scale agricultural producers, the proximity of urban and peri-urban farmers to markets and their higher intensity of output is a compelling rationale for supporting this activity. Finally, with the recent emphasis on market driven agricultural research and development agenda, agricultural researchers must pay more attention to the needs and preferences of urban consumers, many of whom are farmers. The objective of the present study was to provide descriptive information on bean production in Kampala to serve as a baseline for future interventions and to guide agricultural researchers in making appropriate technical interventions on this important crop. The study situates bean production within the wider farming context by investigating the range of agricultural activities in which bean farmers are involved, their use of inputs, general farming constraints and soil fertility management practices. The focus on beans allowed for collection of detailed crop specific information. Throughout the paper, variation in the farming and production system will be explored by analyzing differences between three categories of study area: “urban new”, peri-urban to urban transition and peri-urban as described in Table 1. A historical perspective is introduced into the discussion by comparing results with earlier studies, notably Maxwell and Zziwa (1990) and Maxwell (1995). Table 1: Description of KCC urban agriculture classification system Urban, new Peri-urban to
urban transition Peri-urban
Average population density (persons/km2)
49
11
8
Prevalence of crop production
Low
Medium
High
Prevalence of local livestock
Low
Low
High
Prevalence of improved livestock
High
High
Low
Land availability Limited Moderate Very good Study site Kampala City, the capital of Uganda, has a population of close to one million inhabitants (890,800 in 1999), with a population density of 4,128 persons per square kilometer. The city falls within the Lake Victoria Basin and receives an annual average of 1,180 millimeters of rainfall. Administratively, Kampala District is divided into five divisions: Central, Makindye, Nakawa, Kawempe and Rubaga. The city is built on a number of hills interspersed by wetland valleys into which run sewage, domestic and industrial waste, and which are commonly exploited for farming. Kampala in the 21st Century is the

3
showcase of Uganda’s economic, political and social transformation from the civil war and economic decay of the late 1970s and 1980s. Yet, poverty remains rampant, as evident by the 20% of the city’s population who live on $1 or less per day (UNDP, 1998). Urban agriculture is widely practiced both within the municipal boundaries and peri-urban areas, yet is technically illegal. A 1993 survey of three neighborhoods found that 35% of households engaged in agriculture, mainly crop cultivation (Maxwell, 1995). In 1992, 56% of land in the city was used for agriculture (Maxwell, 1995). An estimated 70% of all poultry products consumed in Kampala are produced in the city (Maxwell, 1995). A significant literature exists on UPA in Uganda and focuses on five aspects: agricultural production (crops, livestock, forestry/agroforestry), UPA’s contribution to food security and nutrition, land use, environment and policy issues (Kimeze, 2002). The study focussed on 4 of the city’s 5 divisions (Table 1). Sampling of households was done at parish level2. Using KCC’s classification system, study sites were classified as “urban new”, peri-urban to urban transition and peri-urban. Naguru 1, Naguru 2 and Kansanga Parishes were the sites of the CIAT/UNBP bean dissemination project. Five other parishes were randomly selected from a list of parishes where urban agriculture was practiced. Table 1. Description and classification of study sites Parish Naguru
1 and 2 Kansanga Kawempe 2,
Kanyanya Namirembe and Rubaga
Lungujja
Division
Nakawa Makindye Kawempe Rubaga Rubaga
Sample size 40 40 40 19 21 Classification Urban
new Urban new Peri-urban to
urban Peri-urban to urban
Peri-urban
Population 5,655 4,894 2,366 Namirembe: 9,000 Rubaga: 4,668
3,468
Land pressure High Medium Low Namirembe: high Rubaga: low
Low
Prevalence of UA
Medium Low High High High
Economic status of residents
Low High Low-medium Medium Medium
Proximity to wetlands Distant Close Close Distant Distant Accessibility Good Good Moderate Moderate Good Source: Government of Uganda, 1992 (population and housing census); Personal communication, KCC
2 Kampala is administratively divided into divisions, parishes and villages. A village is the smallest administrative unit.

4
METHODOLOGY The results presented in this paper are derived from a formal survey of 160 randomly selected bean farmers conducted in November-December 2000. Farmers were sampled from eight parishes. In each location, lists of bean growing households were obtained from local authorities and households randomly selected. As women are the main bean farmers, they constituted 72% of respondents. The study investigated farming objectives, bean production and general farming constraints, farmers’ access to extension services and information, amounts of beans planted, sold and consumed, varieties grown, seed sources, adoption of new varieties, and marketing issues. No information was obtained on the wealth status of surveyed households due to methodological difficulties. Demographic profile of surveyed households The total population of the 160 surveyed households was 1,160. On average, households consisted of 7.2 members. Nakawa had the smallest households (6.6 members) and Kawempe the largest (7.7 members). A resident male headed the majority of surveyed households (76%). Women headed households constituted 22% of the overall sample and were more prevalent in the predominantly low-income neighborhoods of Nakawa (33%) and Kawempe (25%). There were five cases of men living on their own. The mean age of heads of household was 41 for men and 53 for women. Respondents were well educated, which suggests that the sample was biased toward the middle and upper income wealth groups. Sixty-eight per cent had secondary or higher education, 31% had primary education and only 1% had no formal schooling. Respondents represented 10 ethnic groups; the majorities were Baganda (72%) and most were born in the central region (76%), where Kampala is located. A minority of respondents was born in the western (14%), eastern (7%) and northern regions (4%). Respondents had lived in Kampala for an average of 26 years (standard deviation: 17.2), which disproves the widely held assumption that urban farming is mainly done by recent migrants. The main occupations of respondents were: housekeeping (25%), farming (23%), petty trade (22%), civil service workers (9%) and teaching (6%), although this information does not adequately reflect the multiplicity of occupations urban people typically engage in. On average, 1.3 household members worked outside the home. Nearly half of the respondents started farming in Kampala during the economically depressed 1970s (14%) and 1980s (42%), but a significant proportion began farming during the 1990s (31%) and in 2000. These results confirm the three significant periods identified by Maxwell (1995) when large numbers of people began farming in the city. The first period was the 1970s when many households were pushed into farming by the harsh economic circumstances. The second period, which began after 1986 (after the present government came to power), corresponds to a time when people felt secure enough to engage in agricultural production away from their home compounds. In the 1990s Ugandans began experiencing the impacts of structural adjustment policies, and at

5
the same time, urban farmers were able to take advantage of the greatly improved security situation. About half of survey respondents said they engaged in agricultural activities solely to meet their household subsistence needs, and therefore regarded this activity as an important survival strategy (Table 2). When compared with the 69% of subsistence oriented farmers recorded by Maxwell and Zziwa in 1989, these results suggest a decrease in their number. The increase in the number of farmers producing for the market is probably related to improvement in the economy and increased market opportunities. While a significant proportion of farmers had a mixture of subsistence and commercial farming objectives, none mentioned a strictly commercial motive. Farmers in Kawempe and Rubaga, the more peri-urban areas, tended to be more commercially oriented, possibly because of better access to land for cultivation and space for livestock production (Table 2). Table 2. Farmers’ objectives by division (per cent) Nakawa Makindye Kawempe Rubaga Overall
sample
Food only 47 75 40 48 53 Food and cash 45 25 60 52 46 Food, cash and other (hobby, cleanliness)
8 0 0 0 2
Household resources For the most part, less actively urban agriculture is a part-time occupation mainly done by women; men and children are involved (Table 3). Interestingly, while few respondents considered farming a full-time activity 23% reported it as their main occupation. Although farming is mainly practiced to meet subsistence needs, most households experience labour shortages -- with the result that nearly half (49%) of those surveyed hired labour for agricultural work, mainly for digging (90%), weeding (64%) and land clearing (44%). Intensification of agricultural activities may explain why the proportion of households hiring labour in 2000 was higher than the 30% of households reported by Maxwell and Zziwa in 1989. Hired labour worked on the staple crops, namely, maize (81%), beans (79%), sweet potatoes (69%), bananas (44%), cassava (33%) and cocoyam (26%). Only two households hired labour for taking care of livestock. A slightly higher proportion of households in Makindye and Kawempe hired labour compared to the other two divisions. Although the present study did not investigate who provides hired labour, Maxwell and Zziwa (1990: 33) note that casual workers engage in this type of work as a last resort because it is considered arduous and less lucrative than other forms of informal wage labour (e.g. transporting water and hawking).
6
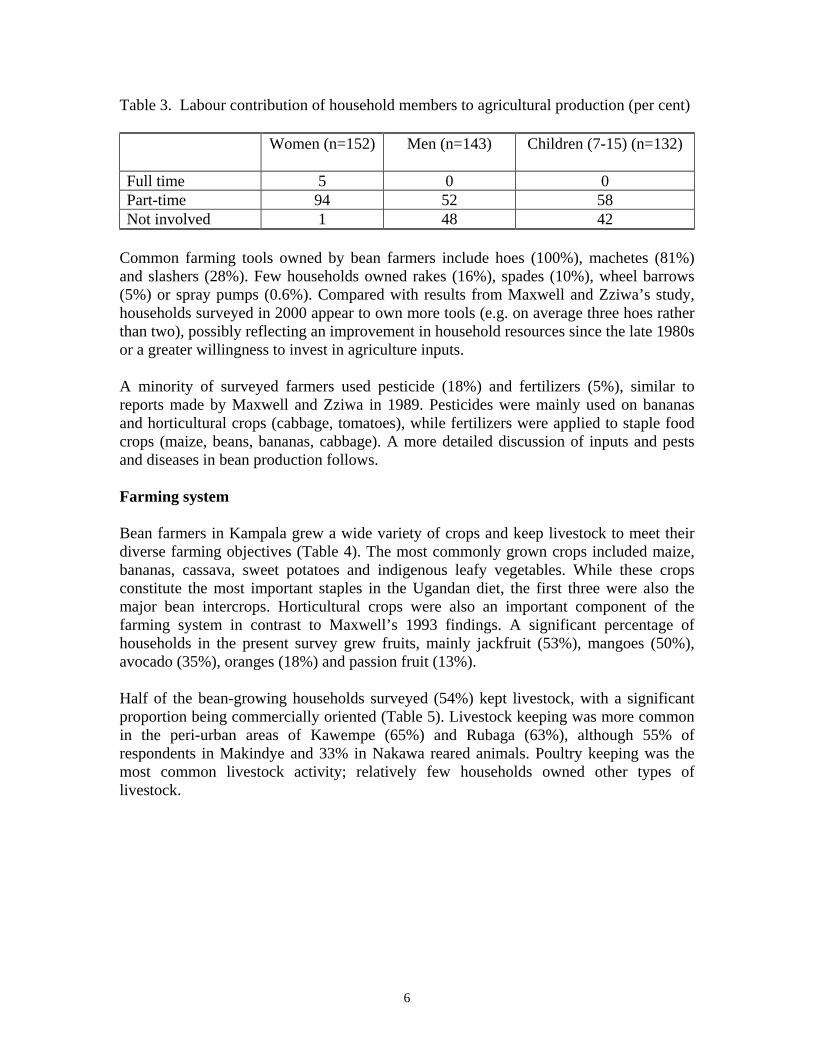
Table 3. Labour contribution of household members to agricultural production (per cent)
Women (n=152) Men (n=143) Children (7-15) (n=132)
Full time 5 0 0 Part-time 94 52 58 Not involved 1 48 42
Common farming tools owned by bean farmers include hoes (100%), machetes (81%) and slashers (28%). Few households owned rakes (16%), spades (10%), wheel barrows (5%) or spray pumps (0.6%). Compared with results from Maxwell and Zziwa’s study, households surveyed in 2000 appear to own more tools (e.g. on average three hoes rather than two), possibly reflecting an improvement in household resources since the late 1980s or a greater willingness to invest in agriculture inputs. A minority of surveyed farmers used pesticide (18%) and fertilizers (5%), similar to reports made by Maxwell and Zziwa in 1989. Pesticides were mainly used on bananas and horticultural crops (cabbage, tomatoes), while fertilizers were applied to staple food crops (maize, beans, bananas, cabbage). A more detailed discussion of inputs and pests and diseases in bean production follows. Farming system Bean farmers in Kampala grew a wide variety of crops and keep livestock to meet their diverse farming objectives (Table 4). The most commonly grown crops included maize, bananas, cassava, sweet potatoes and indigenous leafy vegetables. While these crops constitute the most important staples in the Ugandan diet, the first three were also the major bean intercrops. Horticultural crops were also an important component of the farming system in contrast to Maxwell’s 1993 findings. A significant percentage of households in the present survey grew fruits, mainly jackfruit (53%), mangoes (50%), avocado (35%), oranges (18%) and passion fruit (13%). Half of the bean-growing households surveyed (54%) kept livestock, with a significant proportion being commercially oriented (Table 5). Livestock keeping was more common in the peri-urban areas of Kawempe (65%) and Rubaga (63%), although 55% of respondents in Makindye and 33% in Nakawa reared animals. Poultry keeping was the most common livestock activity; relatively few households owned other types of livestock.

7
Table 4. Crops grown by surveyed households in first season 2000, and purpose (per
cent)
Purpose
Growing in
2000A
Food only Mainly food, sell surplus
Mainly for sale, eat some
Beans 100 84 13 3 Maize 96 76 20 5 Bananasa 75 94 4 2 S. potato 74 74 23 3 Cassava 74 88 9 3 Leafy vegetables 59 96 1 2 Cocoyamb 35 48 38 14 Tomato 16 80 4 16 Cabbage 19 50 33 17 Eggplant 17 89 7 4 Other vegetables 26 Na na Na
a Includes both cooking and dessert bananas b Colocasia esculenta and Xanthosoma spp. Although no farmer indicated strictly commercial farming objectives, crop specific responses revealed more information about commercial production. In contrast with livestock production, few farmers grew crops for sale, the main ones being maize (sold as a street food, roasted or boiled), sweet potatoes, cocoyam (locally known as mayuni), cabbage and tomatoes (Table 4). Table 5. Livestock ownership, mean numbers owned and percent keeping livestock for
commercial purposes
Households owning (%)
Mean numbers owned (range)
Percent commercially oriented
Chickens 49 81.5 (2-900) 38 Cattle 14 2.3 (1-7) 70 Goats 11 3.3 (1-8) 82 Pigs 9 6.2 (2-30) 67 Ducks 8 15.5 (3-60) 42 Rabbits 4 10.4 (7-20) 57 Turkey 4 6.6 (2-20) 50 Other 2 2.3 (1-4) 0

8
Access to land During the first season of 2000, surveyed households cultivated a mean of 1.4 land parcels, with a maximum of 5 parcels. The higher mean number of plots reported by Maxwell and Zziwa (i.e. 2) possibly reflects increased land pressure since 1989. Farmers in Nakawa and Rubaga had the highest mean number of plots (1.6), followed by Makindye (1.5) and Kawempe (1.3). The higher number of plots in Nakawa could be attributed to high land pressure resulting in more scattered plots, while the same phenomenon in Rubaga may be explained by the relatively high proportion of households cultivating in the wetlands (Table 6). As Table 6 shows, across divisions, the most common location of plots was within or adjacent to the compound, which corroborates the findings of other studies (Maxwell and Zziwa, 1990; Maxwell, 1995). It took some farmers up to one hour to reach their furthest plots. Households in all divisions cultivated crops in the wetlands, regardless of proximity (see Table 1). Wetland cultivation was most common in Rubaga. Roadside cultivation, an indicator of acute land shortage, was relatively uncommon in the overall sample, but was most prevalent in Naguru, a densely populated area. A significant number of households in Kasanga Parish, Makindye, cultivated plots outside the city, presumably because many households in this high income neighborhood owned rural farms. Makindye was also the only area where farmers grew crops in containers, reflecting the presence of Environmental Alert, an NGO promoting that technology. Table 6. Location of plots cultivated in the first season 2000, by division (percent)
Nakawa Makindye Kawempe Rubaga Total sample
Compound 61 43 43 50 50 In neighborhood 17 8 33 13 14 Wetlands 9 13 6 24 13 Roadside in neighborhood
11 3 8 2 6
Outside Kampala 2 30 10 11 13 Container 0 3 0 0 0.8
Most farmers (81%) felt that the land available to them for farming was insufficient, with 66% mentioned insufficient land as an important constraint. The frequency with which insufficient land was mentioned was highest in Nakawa (95%), with lower frequencies in Makindye (83%), Rubaga (80%) and Kawempe (68%). Land tenure arrangements in Kampala are complex: how farmers access land does not necessarily correspond to existing land tenure categories. Nearly half of surveyed households (49%) “owned” the land they cultivated (Table 7), a situation which had not changed from the late 1980s (Maxwell and Zziwa, 1990). Twenty-five per cent cultivated rented land, 16% borrowed land for farming and 11% were squatters, that is, cultivated

9
land without permission of the owner. However, because the unit of analysis for questions pertaining to land access and tenure was not the land parcel, this information does not adequately reflect the complexity of the situation. Although no information was collected on farmers’ security of land tenure, some farmers reported problems with maintaining access to land they were farming. Thirty-two percent of households (those who had borrowed or purchased use rights) had been stopped from farming, mainly because the owner of the land they had been cultivating sold the plot. Only eight households had been stopped from farming by Kampala City Council, which supports Maxwell’s observation that harassment by city authorities has declined (1994: 142-143). Table 7. Ownership of plots farmed in the first season 2000, by division (per cent) Nakawa Makindye Kawempe Rubaga Total
sample Own land 37 67 69 61 58 Rented land 33 5 18 7 16 Borrowed land 10 23 8 21 16 Squatting 21 5 5 11 11
Farming constraints Farmers in Kampala face numerous problems and constraints (Table 8). Farmers surveyed for the present study perceived lack of inputs and their high price, shortage of land, and pests and diseases as very serious constraints. Notably, constraints in livestock production were not mentioned, possibly due to the study’s bias toward crops. The proportion of farmers who mentioned technical problems, namely pests, diseases and inputs shortages, was unexpectedly high. Pests ranked as the fourth most important constraint in Maxwell and Zziwa’s study, after lack of capital, access to land and theft. One explanation for the frequent reporting of technical constraints in the present study is Maxwell and Zziwa’s observation that technical problems and high production costs are a major concern of high and middle-income farmers. Their survey showed that low-income farmers are more concerned with labour shortages and lack of security of land tenure. In the absence of data on household wealth or income status, it is possible that the sample in the present survey was biased toward the high and middle-income groups.

10
Table 8. Major farming constraints mentioned by farmers (per cent)
Pests and diseases 68 Shortage of land 66 Lack of/expensive inputs 53 Theft of crops 48 Low soil fertility 43 Unreliable rainfall 40 Lack of extension staff 31 Lack of credit/capital 16 Declining yields 14 Destruction of crops by vermins/domestic animals 14 Available land is water logged/swampy 12 Drought 9 Labour shortage 9 Soil contamination 5 Lack of market 5 Others 11
Soil fertility management deserves more detailed discussion. Although a significant proportion of respondents indicated soil fertility as a major constraint (43%), the majority felt that their soils were moderately fertile (Table 9). Soil fertility appears to be poorer in Nakawa and Makindye. Despite the difficulties experienced by urban bean farmers in accessing land, they nevertheless make efforts to manage soil fertility, especially for areas planted to bananas, maize, beans, root crops and leafy vegetables. Seventy-seven per cent used crop residues for improving soil fertility (on bananas, maize, beans), 58% used manure (on bananas, maize, beans, root crops and leafy vegetables), 26% left land to fallow (a mean of 1.8 seasons), and 17% used compost (on bananas, beans, maize, leafy vegetables). The proportion of farmers who practiced fallowing is similar to reports by Maxwell and Zziwa (1990) and is surprising given the intensity of farming in Kampala. Table 9. Farmers’ perception of soil fertility status of plots cultivated in the first season
2000, by division (per cent)
Nakawa Makindye Kawempe Rubaga Overall sample
Very fertile 2 2 0 0 1 Moderately fertile 63 86 68 79 74 Infertile 23 0 28 17 17 Very infertile 13 12 5 2 8 Can’t tell 0 0 0 2 0.6

11
Beans in the farming system Beans have several advantages as an urban crop: they grow quickly and are versatile as a food and cash crop since they can be eaten with many foods or on their own. The grain is eaten or sold either dry or fresh, and the leaves are eaten as relish. Random sample surveys suggested that bean cultivation has increased in importance in the past decade and may be more important in some parts of the city. Maxwell (1995) found that 63% of households were growing beans in 1993 compared with 39% in 1989 (Maxwell and Zziwa, 1990). All households surveyed in peri-urban areas (Eresu, 2000), but only 20% of households in Makindye Division, grew beans (Kakitahi and Zimbe, 2000). Increased bean production in Kampala since the late 1980s may be due to two factors: the improved security situation (as the crop is highly vulnerable to theft) and the high cost of other protein sources. Surveyed households grew beans primarily for subsistence (84%), 13% grew the crop mainly for food but sold surpluses, while 3% grew beans primarily for sale (Table 4). Over half (59%) of surveyed households planted beans in both the first (March to June) and second season (September to December), but one third of farmers grew beans continuously, that is, they did not follow a particular seasonal pattern for cultivation. Beans were mainly grown in home compounds (Table 10) intercropped with maize (82%), cassava (17%) and bananas (15%). Only 2% of farmers grew beans in pure stand. Table 10. Location of bean plots, first season 2000, by division (per cent)
Nakawa Makindye Kawempe Rubaga Total sample
Compound 60 44 44 50 50 Neighborhood 18 9 34 13 17 Wetlands in neighborhood
10 14 6 23 13
Roadside in neighborhood
11 4 6 2 6
Outside Kampala 2 26 10 13 13 Container 0 4 0 0 0.8
On average, farmers sowed 4.6 kg of bean seed in the first season of 2000. Farmers in Makindye sowed the highest mean amounts (7.0 kg) compared to a mean of 3.3 kg in Rubaga. While half of the farmers surveyed had not changed the amount of beans they planted since 1995, a third (34%) were planting less beans than in the past, mainly due to land scarcity (83%). Thirteen per cent of respondents had increased the amount of beans sown. Average bean area was 0.07 hectares, with the largest area being sown in Makindye (Table 11). In the first season of 2000, households planted beans on an average of 1.4 parcels of land. Bean yields were highly variable between households. The average yield for K20, the most commonly grown variety, was 809 kg/ha (s.d. 287), significantly higher than averages of 366-561 kg/ha recorded in two rural communities (David, 1999).

12
Good management, including the use of soil amendments, may account for relatively high bean yields among urban households, but more detailed investigation of yields and management practices are needed. Notably, because farmers assess yields in terms of production rather than output per unit area, low yields were mentioned as a production constraint. Table 11. Mean bean area (ha), first season 2000, by division
Nakawa Makindye Kawempe Rubaga Total sample
Bean area 0.05 0.10 0.06 0.07 0.07 The main production constraints experienced by urban bean farmers can be grouped into seven categories: diseases and pests, land shortage, poor soil fertility, lack of varieties resistant to major diseases and pests, poor climate, poor seed quality and theft (Table 12). Only two of these constraints, land shortage and theft, are characteristic of urban settings and are not amenable to technical interventions. Three constraints -- varieties, seed related issues and diseases and pests -- are discussed below in more detail. Table 12. Bean production constraints (per cent) Diseases and pests 77 Lack of improved varieties 46 Land shortage 31 Low yields 30 Unreliable rainfall 26 Lack of/expensive seed 25 Damage by chickens 24 Low soil fertility 20 Poor germination 15 Theft 15 Other 33
Bean varieties and seed supply Kampala farmers grew a total of 9 bean varieties, two of which -- K20 (an old variety released in 1968) and Kanyebwa (a landrace) were widely grown (Table 13). On average, farmers sowed 1.6 bean varieties in the first season of 2000, commonly sowing two or more varieties on the same plot. An insignificant number of farmers (13%) were growing modern bush and climbing varieties in 2000. However, it is highly probably that the adoption rate for K132 was much higher than reported by surveyed farmers due to their inability to distinguish it from K20 (both are Calima types characterized by large, red, mottled seeds) and its wide availability in markets, where it is often mixed with K20. Makindye, one of the sites of the CIAT/UNBP bean project, had the highest number of farmers growing modern varieties. Farmers reported a number of constraints to adopting

13
climbing beans namely, shortage of staking materials, delayed land preparation and marketing difficulties due to staggered harvesting, problems with weeding due to plant architecture, pests, diseases and the need for high rainfall. Table 13. Bean varieties that farmers claimed to grow in the first season 2000 Variety
Origin Per cent of farmers
Kanyebwa Landrace 38 Kahura Landrace 9 Others Landrace 10 K20 (Nambale) Released in 1968 84 K132 Modern type released in 1994 6 K131 Modern type released in 1994 4 MCM 2001 Modern type released in 1995 1 MCM 1015 Modern type released in 1995 2 Climbing beans Modern type released in 1999 1
CHECK RELEASE YEAR FOR MCM Urban bean farmers tend to be seed insecure due to two major factors: small harvests caused by planting small areas to low yielding landraces or the superceded old variety, and the practice of eating beans fresh to avoid theft, reduce cooking time and cope with the lack of space for drying and threshing. Consequently, the most important seed source for Kampala farmers is the commercial grain market. By contrast, rural farmers mainly depend on farm-saved seed (David and Sperling, 1999). Farm-saved seed is the third most important source for urban farmers and seed sharing is rare (Table 14). Other reasons given for obtaining seed from off-farm seed sources include the desire to obtain new varieties (8%) and storage losses (1%). Table 14. Farmers’ sources of bean seed sown in the first season 2000 (per cent) Shop 68 Market 46 Own stock 44 Extension agent 9 Farmers’ shop 6 Gift 4 Other 6 Note: Total exceeds 100% due to multiple sources Diseases and pests Farmers reported a number of disease-related symptoms on bean plants, particularly foliar symptoms (Table 15). While these symptoms do not allow for a precise identification of diseases, they suggest the prevalence of a number of diseases likely to occur in the climatic conditions prevalent in mid altitude locations such as Kampala.

14
These diseases include common bacterial blight (CBB) (yellowing of leaves), bean common mosaic virus (BCMV) (curled, mottled leaves) and southern blight (wilting/drying, yellowing of leaves, rotting of stem). Significantly, these three diseases were identified during field visits by bean pathologists working with the CIAT/UNBP bean project (pers. comm. Ina Opio, 2000). Three factors -- the use of local varieties susceptible to these diseases, farmers’ high dependence on off-farm grain markets for seed and continuous cropping that results in poor soil fertility -- might contribute to the prevalence of these diseases. More information is needed on farmers’ seed selection practices to determine their ability to reduce the incidence of seed borne diseases such as CBB and BCMV. Southern blight, a soil-borne disease exacerbated by poor soil fertility, is characteristic of areas with high land pressure. Farmers mainly identified field insect pests (Table 16). The number of urban farmers who mentioned bean weevils as a constraint is low compared with rural farmers, because of the short storage period for the small amounts harvested and the common practice of eating fresh beans. Table 15. Major bean disease symptoms identified by farmers (per cent) Yellowing of leaves 89 Curling/mottling of leaves 36 Wilting/drying 23 Stunting 13 Rotting of stem 8
Table 16. Major bean insect pests identified by farmers (per cent) Aphids 98 Pod borers/eaters 48 Weevils 38 Bean stem maggot 27 Caterpillars 14 Bean bettles/leaf eaters 13
Bean marketing A small number of farmers from all divisions sold beans in the first and second season of 1999: 18% and 15%, respectively. Due to low yields and small cultivation areas, farmers typically sell a relatively small proportion of the total harvest. Of the 29 farmers who reported usually selling beans, 19 sell 40% or less of their harvest, while only two sell over half of the amount produced. On average, farmers sold 72 kg of beans (range: 5kg to 700 kg) in the first season of 1999 and 56 kg (range: 5kg to –300kg) in the season. Farmers in peri-urban areas were not more commercially oriented: the highest quantities were sold in Makindye. In most cases, women made the decision to sell beans and how to spend the income. Most farmers who sold beans in 1999 sold directly to consumers in their neighborhood, but a minority sold to market retailers (either casual sellers or

15
traders) or to wholesaler traders. These results are similar to the findings of Maxwell and Zziwa (1990) with regard to crop marketing generally. Bean farmers mentioned three common marketing problems: low prices, inadequate storage and lack of transport. Beans were taken to the place of sale on head or by bicycle. The contribution of beans to urban food security Beans feature predominantly in the diet of Kampala residents and are a preferred food because of their high protein content and low price (Mugisha-Mutetikka et al., 1999). Other protein rich foods commonly eaten by Kampala households include, in order of importance, meat, groundnuts and fish (Mugisha-Mutetikka et al., 1999). The main staples eaten by surveyed households were: matoke (cooking bananas) (96%), sweet potatoes (91%), maize meal (locally called posho) (87%), rice (86%) and cassava (76%). Maxwell (1995) shows a strong and statistically significant association between farming in Kampala and improved child nutrition. Although this study did not assess the contribution of beans to the nutrition of urban households, we can assume that beans, as an important protein source, contribute importantly. The majority of households (79%) ate both fresh and dried beans harvested from their gardens and slightly over half (58%) ate bean leaves. Twenty-one per cent of respondents, however, only ate fresh beans. Fresh beans are a delicacy due to their preferred flavour, quicker cooking time and higher price (due also to their seasonality). The vast majority of surveyed households typically ate dried beans one to 6 times a week, but consumed fresh beans less frequently for the reasons given above (Table 17). Households cooked about 1 kg of beans at a time, with no significant difference between the food scarcity period (March-April) and the period around the main bean harvest of May-June (Table 19). Table 17. Weekly frequency of bean consumption (per cent) Frequency
Dry beans Fresh beans
Daily 1 2 4-6 times 28 9 1-3 69 89 Rarely/never 3 0
Bean producing urban households are not self-sufficient in the crop, mainly in their view because of low harvests and insufficient land; consequently, the vast majority purchase beans for household consumption both in dried (99%) and fresh (94%) form. Survey results confirm this analysis by documenting high bean consumption (see below), and small bean areas. Although the study did not investigate what proportion of consumed beans is provided by farming activities, as Maxwell (1995: 1676) notes, “farming is a major source of fungible income in terms of saving on food expenditure” especially for

16
low income households. Bean producing households typically purchased 3 kg of beans several times a month (Table 18), which suggests that only a small proportion of beans consumed are produced on-farm. The most commonly purchased varieties for home consumption were the same as those widely grown: K20/K132 (74%), Kanyebwa (67%) and Kahura (59%), which corroborate the findings of Mugisha-Mutetikka and colleagues (1999). Surveyed households purchase dry beans during two peak periods: July-September and January-February (Figure 1). These periods follow the bean harvest periods of June-July and November-December when prices are low, and coincide with school holidays (August-September, January-February) when urban households stock up on beans to feed children returning from boarding schools. Dry bean purchasing is lowest in April and May when prices are high and urban farmers rely on their own harvest. The pattern for fresh bean purchasing follows no clear pattern. Table 18. Monthly frequency with which bean-producing households purchase beans
(per cent)
Dry beans Fresh beans At least 5 times 33 9 4 times 27 11 2-3 times 29 43 1 or less 9 30 Never 1 6
Table 19. Mean quantities (grams) of dry beans cooked per meal, by type of dish and
time of year
Scarcity period (March-April) Abundance period (May-June) Sauce 0.91 1.0 Mixed dishes 1.0 1.2
Survey results show that, on average per capita, urban bean consumption is slightly higher than rural bean consumption (Table 20). The mean of 191 g/person per meal during the scarcity period (when bean prices are high) is higher than the average of 176-186 g/person per meal recorded in two rural communities in the central and eastern parts of the country in 1994 during the scarcity period (David, 1999). Per capita bean consumption among surveyed households increases significantly to 218 g/person per meal right after the main bean harvest, slightly above the 201-215 g/person recorded in rural communities during the post-harvest period (David, 1999). Bean consumption is highest in Nakawa and Kawempe, areas with a high proportion of low-income households, and lowest in Rubaga, a peri-urban area. Several factors might explain higher urban bean consumption, including the greater market dependence and possible bias in the sample toward better off households. However, a comparison of rural and urban bean consumption patterns requires further analysis.

17
Table 20. Mean per capita bean consumption per meal (grams) at different times of the
year, by division Nakawa Makindye Kawempe Rubaga Overall
sample Scarcity period (March-April)
205 189 191 182 191
Abundance period (May-June)
229 218 222 202 218
Agricultural extension and information In the early 1990s, Maxwell (1994) noted that NGOs in Kampala shied away from supporting UPA activities due to the illegality of the practice. In 2000, several organizations in Kampala provided agricultural extension information and services to urban farmers. Institutions actively supporting UPA in the study areas can be grouped into five categories: • Development oriented NGOs: Plan International, VEDCO, Mothers’ Union,
BUGADEV, Environmental Alert, YWCA • Micro-credit institutions: FINCA, Faulu, Pride Africa • NGOs promoting livestock production: Land O’Lakes, Send-a-Cow, Heifer Project • Farmers’ associations: Uganda National Farmers’ Association (UNFA) • Research and extension: the national research organization (NARO) and the
government extension system. The major extension services provided by these institutions, according to survey respondents, were in the areas of agronomy, credit, input supply and livestock production. Sixty-three per cent of surveyed farmers had acquired new agricultural information in the past three years and 75% had used a new technology or knowledge in the past year. Urban farmers were mainly exposed to agronomic information (Table 21), with little or no attention to livestock, tree and fish production. The major sources of agricultural information reported by respondents were: radio (96%), other farmers (83% from farmers in the same neighborhood, 41% from farmers from elsewhere), local councilors (44%), television (20%), extension agents (19%), newspapers (18%) and research and development agencies (14%). The relative ineffectiveness of the extension system in Kampala District is highlighted by the small number of farmers who were aware of an agricultural extension officer operating in their area (23%) and who had ever been visited by an officer (46% of 37 respondents). More farmers in Nakawa were aware of an agricultural extension agent than in any other division.
18
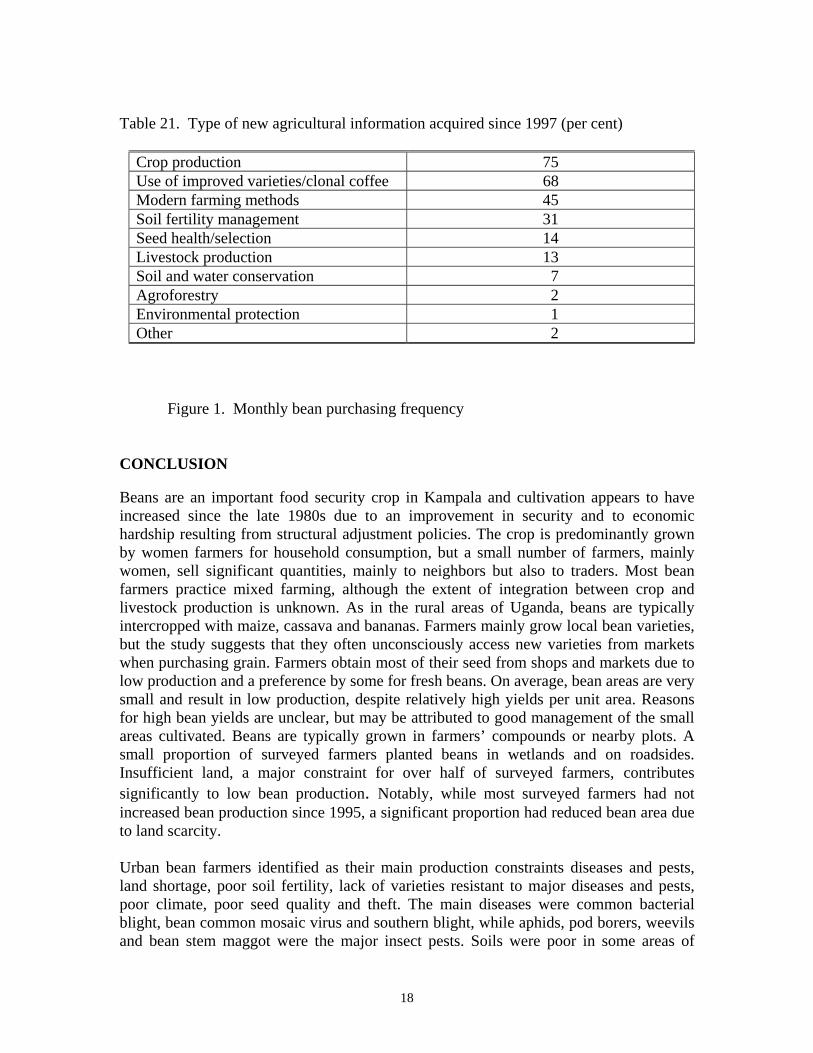
Table 21. Type of new agricultural information acquired since 1997 (per cent)
Crop production 75 Use of improved varieties/clonal coffee 68 Modern farming methods 45 Soil fertility management 31 Seed health/selection 14 Livestock production 13 Soil and water conservation 7 Agroforestry 2 Environmental protection 1 Other 2
Figure 1. Monthly bean purchasing frequency CONCLUSION Beans are an important food security crop in Kampala and cultivation appears to have increased since the late 1980s due to an improvement in security and to economic hardship resulting from structural adjustment policies. The crop is predominantly grown by women farmers for household consumption, but a small number of farmers, mainly women, sell significant quantities, mainly to neighbors but also to traders. Most bean farmers practice mixed farming, although the extent of integration between crop and livestock production is unknown. As in the rural areas of Uganda, beans are typically intercropped with maize, cassava and bananas. Farmers mainly grow local bean varieties, but the study suggests that they often unconsciously access new varieties from markets when purchasing grain. Farmers obtain most of their seed from shops and markets due to low production and a preference by some for fresh beans. On average, bean areas are very small and result in low production, despite relatively high yields per unit area. Reasons for high bean yields are unclear, but may be attributed to good management of the small areas cultivated. Beans are typically grown in farmers’ compounds or nearby plots. A small proportion of surveyed farmers planted beans in wetlands and on roadsides. Insufficient land, a major constraint for over half of surveyed farmers, contributes significantly to low bean production. Notably, while most surveyed farmers had not increased bean production since 1995, a significant proportion had reduced bean area due to land scarcity. Urban bean farmers identified as their main production constraints diseases and pests, land shortage, poor soil fertility, lack of varieties resistant to major diseases and pests, poor climate, poor seed quality and theft. The main diseases were common bacterial blight, bean common mosaic virus and southern blight, while aphids, pod borers, weevils and bean stem maggot were the major insect pests. Soils were poor in some areas of

19
Kampala, but urban bean farmers made commendable efforts to improve soil fertility by using crop residues, manure, compost and fallowing. While struggling to produce a good crop, bean farmers in Kampala battle constantly with the problem of theft. The two strategies used against this problem are planting the crop near the homestead and harvesting most of the crop in the fresh state. Despite the illegality of UPA in Kampala, there is considerable acceptance by KCC and support for farming activities by a range of institutions including NGOs, research institutes, government extension system and farmers’ association. Urban farmers are relatively well informed and exposed to new agricultural technologies and information, especially in the area of agronomy. However, despite the active involvement of UPA service providers in Kampala, farmers’ main sources of agricultural information were the radio, other farmers and local authorities. Although the study did not investigate or quantify the contribution of bean production to nutrition or saved income, it documents the contribution of this crop to food security. Farmers eat the beans they grow in both fresh and dried forms and many also consume bean leaves. Fresh beans are preferred by some farmers as a way of reducing cooking time and theft, and avoiding post-harvest operations due to lack of space. Bean consumption among surveyed households was high at 191 g/person per meal during the scarcity period and 218 g/person per meal during the post-harvest period. Given the low levels of production, nearly all surveyed households supplemented their harvests by purchasing beans. As households purchase an average of 3 kg of beans several times a month, it can be assumed that for most, harvested beans account for a small proportion of total bean consumption. Recommendations There is need to confirm some observations made in this paper by measuring various quantitative parameters such as bean yields, plot area and the proportion of total beans consumed that derive from consumers’ own production . This information should be collected to represent differences in farming styles (e.g. peri-urban, urban transition, urban new, etc) and household socio-economic characteristics (e.g. wealth, type of households, etc.) To ensure urban farmers have regular access to good quality seed of modern and local varieties of crops uneconomically important for the formal seed sector, sustainable seed supply systems should be developed. Researchers can catalyze the development of seed provision systems by sensitizing seed companies, input suppliers and extension agents to the seed needs of urban farmers. Results from an urban bean seed dissemination project suggest that, in identifying seed marketing outlets for urban areas, it is important to consider the high level of mistrust in urban areas (especially toward merchants), storage space available to potential seed sellers and their accessibility (David et al, 2000b). Local institutions and organizations that have a high level of social capital, such as neighborhood associations, schools and churches, could be involved in seed marketing.

20
To address the problem of land shortage, there is need to promote technologies that intensify crop production. Promising bean related technologies include climbing beans and climbing snap beans, the latter as a cash crop. The low adoption of climbing beans in Kampala suggests that promotion of new technologies must involve a coordinated effort between multiple institutions including NGOs, the government extension system, research, the health care system, local groups and associations, and micro-finance institutions.Efforts to intensify crop production should target specific households such as those affected by HIV/AIDS or the poorest groups. Action research is needed on staking options for climbing beans. Farmers involved in the CIAT/UNBP bean dissemination project proposed several options including planting fast growing agro-forestry species, live stakes using cassava or bananas, the string and pole method used for passion fruit, and string tied to walls/fences. Urban farmers should be exposed to knowledge-based technologies for addressing integrated crop management issues such as diseases, pests and soil fertility. Local institutions such as schools and churches could play an extension role to address these more complex issues through approaches such as farmer field schools and by establishing farmer resource centers. Specific market niches for urban bean producers should be explored and efforts made to link producers to markets and value added entrepreneurial activities such as new bean-based products. For example, peri-urban farmers may have a comparative advantage in commercial fresh bean production.

21
References David, S., R. Kirkby and S. Kasozi. 2000a. Assessing the impact of bush bean varieties
on poverty reduction in sub-Saharan Africa: Evidence from Uganda. . Network on Bean Research in Africa, Occasional Publications Series, no. 31. CIAT, Kampala, Uganda.
David, S., G. Luyimaa and M. Ugen. 2000b. “Promotion of new bean varieties and
technologies among farmers in Kampala, Uganda”. Paper presented at the CGIAR Strategic Initiative on Urban and Peri-urban Agriculture. Nairobi, Kenya, November, 2000.
David, S. and L. Sperling. 1999. Improving technology delivery mechanisms: Lessons
from bean seed systems research in Eastern and Central Africa. Agriculture and Human Values, 16:381-388.
David, S. 1999. Beans in the farming system and domestic economy of Eastern and
Central Uganda: a tale of two parishes. Network on Bean Research in Africa, Occasional Publications Series, no. 28. CIAT, Kampala, Uganda.
Denninger, M., B. Egero, and D. Lee-Smith. 1998. Urban Food Production, a Survival
Strategy of Urban Households, Report of a Workshop on East and Southern Africa, Workshop series 1. Regional Land Management Unit (RELMA) and Mazingira Institute, Nairobi. 38 pp.
Eresu, D. 2000. Report of the baseline survey on production, food security, and nutrition,
gender relations and socio-economic aspects in Nabweru, Wakiso and Muduuma sub-counties of Mpigi District. Report prepared for Environmental Alert, Kampala, Uganda.
Government of Uganda, 1992. Ministry of Finance and Economic Planning. 1991.
Population and Housing Census. Government Printing and Publishing Cooperation, Entebbe, Uganda.
Hasna, M.K. 1998. NGO gender capacity in urban agriculture: case studies from Harare,
Kampala and Accra. Cities Feeding People Series, Report 21. IDRC, Ottawa, Canada.
Hovorka, A. 1998. Gender resources for urban agriculture research: methodology,
directory and annotated bibliography. Cities Feeding People Series, Report 26. IDRC, Ottawa, Canada.
Kakitahi, J. and I. Zimbe, 2000. Urban nutrition and food security assessment in
Makindye Division, Kampala District. Report prepared for Environmental Alert, Kampala, Uganda.

22
Kimeze, S. 2002. Farming in the city: an annotated bibliography of urban and peri-urban
agriculture in Uganda. Strategic Initiative on Urban and Peri-Urban Agriculture (SIUPA), Kampala, Uganda.
Maxwell, D. 1995. Labor, land, food and farming: a household analysis of urban
agriculture in Kampala, Uganda. Ph.D dissertation, University of Wisconsin-Madison.
Maxwell, D. and S. Zziwa. 1990. Urban agriculture: a case study of Kampala. Makerere
Institute of Social Research. Kampala, Uganda. Mougeot, L. 1994. Urban food production: evolution, official support and significance.
Cities Feeding People Series, Report 8. IDRC, Ottawa, Canada. Mugisa-Mutetikka, M., S. David and G. Luyima. 1999. Evaluation of consumer
preferences for different bean varieties purchased in Uganda. Unpublished manuscript, Uganda National Bean Program, NARO, Namulonge, Uganda.
Odendo, M., S. David and R. Otsyula, 2002. “The impact of improved bean varieties in
Western Kenya”. Draft manuscript, Kampala, Uganda. Pachico, D. 1993. “The demand for bean technology” in G. Henry (ed.) Trends in CIAT
commodities, CIAT Working Document no. 128: 60-73, Cali, Colombia. Rose, G. 1999. Community based technologies for domestic wastewater treatment and
reuse: options for urban agriculture. Cities Feeding People Series, Report 27. IDRC, Ottawa, Canada
Sawio, C. 1993. Urban agriculture research in East and Central Africa: record, capacity
and opportunities. Cities Feeding People Series, Report 1. IDRC, Ottawa, Canada. Sawio, C. 1998. Managing urban agriculture in Dar es Salaam. Cities Feeding People
Series, Report 20. IDRC, Ottawa, Canada. UNDP, 1998. Uganda Human Development Report 1998. UNDP, Kampala. Wortmann, C.S., C.A. Eledu and S. David, 1999. Common bean as a cash earner in sub-
Saharan Africa. Report of the Bean Improvement Cooperative, Vol. 42:103-104.