group17 - koara.lib.keio.ac.jp
TRANSCRIPT
Title Design of Bicycle Simulator to reduce the risks of traffic accidents : Design of Bicycle Simulator toreduce the risks of traffic accidents
Sub TitleAuthor 東芝システムテクノロジー株式会社(Toshiba System Technology)
西村, 秀和(Nishimura, Hidekazu)Publisher 慶應義塾大学大学院システムデザイン・マネジメント研究科
Publication year 2010Jtitle Active learning project sequence report Vol.2010, (2010. ) ,p.717- 783
JaLC DOIAbstract Our projects theme was aimed to "reduce the risk of bicycle accidents," which was proposed by
Toshiba System Technology Corporation. We took two risk reduction measures. First, wespecified the function of the Bicycle Simulator (BS). Second, we created a feasible business modelof the BS. Even though the BS itself is effective to reduce the number of bicycle accidents, it'smeaningless if promotion fail and strategy to enter the market collapse. Taking into variousaspects into account, Cycle K's bicycle simulator was narrowed down to the concept "MovingBox." There are 3 reasons to be explained.First, the reason was to avoid the violation of patents to Honda's BS. In the first line of thedocument which guards the interest of Honda's BS, it is stated "Honda's BS was designed so as tomake it similar to actual design and dynamics of bicycles." By creating a whole set of BS systemwhich move by a truck and have user's bicycle installed in it, we came up with a solution tobypass the patent.Second, the purpose was to reduce risks in selling the BS. At first, we ourselves working on thisproject were suspicious about working towards the designing of the BS. We thought thatconsumers would also feel the same anxiety. The question "How can we invite people to come toride our bicycle simulator?" always hanged about. In the beginning, we have discussed aboutincluding factors of entertainment so that it would attract many people. However, we had aparadigm shift in our idea, "If the customers won't come, why don't we go for them?" Bypromoting the BS by a truck, we can promote and find secret sales at the same time whiledeveloping products other than the prototype version.Third, we wanted to deliver the consumers an image of a gift box. Our catch copy for the bicyclesimulator is "Moving Box, Blooming Happiness." We used a rhyme so it would sound nice. Aftersales come stable, one can remove the truck part out of the package provided and sell only thepart of box.For the moment, we end our project in proposing the concept design and business design of BS.We have left a margin to discuss about the design of BS itself. In the thesis "Bicycle Dynamics andControl" published by the IEEE association, it's stated "Control is important for design.Engineering systems are traditionally designed based on static reasoning, which does notaccount for stability and controllability." Studying control would give limitations on designoptions. Hereafter is described the systems engineering approach to our project.
Notes Student final reportsGroup 17
Genre Research PaperURL https://koara.lib.keio.ac.jp/xoonips/modules/xoonips/detail.php?koara_id=KO40002003-0000201
0-0717
慶應義塾大学学術情報リポジトリ(KOARA)に掲載されているコンテンツの著作権は、それぞれの著作者、学会または出版社/発行者に帰属し、その権利は著作権法によって保護されています。引用にあたっては、著作権法を遵守してご利用ください。
The copyrights of content available on the KeiO Associated Repository of Academic resources (KOARA) belong to the respective authors, academic societies, orpublishers/issuers, and these rights are protected by the Japanese Copyright Act. When quoting the content, please follow the Japanese copyright act.
Powered by TCPDF (www.tcpdf.org)

Group 17
― 717 ―


Group 17’s Theme Proposed by ToshibaSystem Technology
ALPS “safety and security” theme title:Design of Bicycle Simulator to reduce the risks of traffic accidents
Abstract of your project theme :Background : In 2009 more than 156,000 bicycle accidents occurred in Japan.
(155,581 people were injured and 695 people were killed.)Fig.1 shows the high risk of the bicycle accidents at intersections.
Goal: To propose a new conceptual design of bicycle simulator that couldreduce the risks of bicycle accidents.Issues to be reviewed during the project:
1) To observe the location/site with high traffic risks and record the results.2) To investigate and analyze the statistics of traffic accidents of bicycles
including fatality of senior people ( more than 65 years old).3) Hearings to bicycle associations/manufacturers for safe design of
bicycles now available.4) To model the bicycle dynamics and to specify the process of riding-skill
acquisition especially for small kids.5) To discover and identify the possible risks while driving and to
understand how to mitigate them.6) To propose a basic requirement specification of bicycle simulator.7) To review a system configuration of the proposed bicycle simulator.8) To evaluate the feasibility of the proposed bicycle simulator.
Remarks: Fig.2 shows the “Safety Bicycle” in 1885.(An appropriate project name such as “Safe Rider” are to be decided by theteam.)
Fig. 1:
Proposer Organization’s Name: Toshiba System TechnologySupporter Name and contact info: Kensuke KAWAI ( [email protected])
Fig. 2:
Theme 14:
― 719 ―

ALPS Final Report 2010
Group 17
PROJECT TITLE:“Design of Bicycle Simulator to reduce the risks of traffic accidents”
Theme:
“Design of Bicycle Simulator to reduce the risks of traffic accidents”
Proposer Organization: Toshiba System Technology
Proposer Organization’s Supporter: Kensuke Kawai
Keio Mentor: Hidekazu Nishimura
Members:
IWASAWA, ARIA
WANG, GONGTAI
TAKAMURA, SEIGO
LI, RONGSHUAI
SATO, YOSHINORI
Graduate School of System Design and Management
Keio University
― 720 ―

Team 17( Alphabetical Order )
IWASAWA ARIA 岩澤 ありあ
LI RONGSHUAI リ ロンシャン
SATO YOSHINORI 佐藤 良徳
TAKAMUR SEIGO 髙村 清吾
WAN GONGTAI 王 公太
FINAL REPORT
― 721 ―

1
PREFACE
We did the final report based on the solution that we presented last lesson.
Because this work was a summary like activity more than a creative activity, it was proceeding by way as
allocating each part to the members after dividing the report.
The persons in charge in each part are as follows.
01. Executive Summary --------------------------------------- Iwasawa Aria 岩澤 ありあ
02. Table of Contents ------------------------------------------ Wang Gongtai 王 公太
03. Problem Statement---------------------------------------- Iwasawa Aria 岩澤 ありあ
04. Analysis and Discussion of ALPS Methods --------- Takamura Seigo 髙村 清吾
05. Design Recommendation -------------------------------- Wang Gongtai 王 公太
06. Competitive Analysis ------------------------------------- Sato Yoshinori 佐藤 良徳
07. ALPS Roadmap and Reflections ---------------------- Sato Yoshinori 佐藤 良徳
08. Conclusion and Future Work --------------------------- Wang Gongtai 王 公太
09. Acknowledgments ----------------------------------------- Li Rongshuai リ ロンシャン
10. References ------------------------------------------------ Iwasawa Aria 岩澤 ありあ
11. Appendix --------------------------------------------------- Takamura Seigo 髙村 清吾
Iwasawa Aria 岩澤 ありあ
― 722 ―

2
EXECUTIVE SUMMARY
Our projects theme was aimed to “reduce the risk of bicycle accidents,” which was proposed by Toshiba System
Technology Corporation. We took two risk reduction measures. First, we specified the function of the Bicycle
Simulator (BS). Second, we created a feasible business model of the BS. Even though the BS itself is effective to
reduce the number of bicycle accidents, it’s meaningless if promotion fail and strategy to enter the market collapse.
Taking into various aspects into account, Cycle K’s bicycle simulator was narrowed down to the concept “Moving
Box.” There are 3 reasons to be explained.
First, the reason was to avoid the violation of patents to Honda’s BS. In the first line of the document which guards
the interest of Honda’s BS, it is stated “Honda’s BS was designed so as to make it similar to actual design and
dynamics of bicycles.” By creating a whole set of BS system which move by a truck and have user’s bicycle installed
in it, we came up with a solution to bypass the patent.
Second, the purpose was to reduce risks in selling the BS. At first, we ourselves working on this project were
suspicious about working towards the designing of the BS. We thought that consumers would also feel the same
anxiety. The question “How can we invite people to come to ride our bicycle simulator?” always hanged about. In the
beginning, we have discussed about including factors of entertainment so that it would attract many people.
However, we had a paradigm shift in our idea, “If the customers won’t come, why don’t we go for them?” By
promoting the BS by a truck, we can promote and find secret sales at the same time while developing products other
than the prototype version.
Third, we wanted to deliver the consumers an image of a gift box. Our catch copy for the bicycle simulator is “Moving
Box, Blooming Happiness.” We used a rhyme so it would sound nice. After sales come stable, one can remove the
truck part out of the package provided and sell only the part of box..
For the moment, we end our project in proposing the concept design and business design of BS. We have left a
margin to discuss about the design of BS itself. In the thesis “Bicycle Dynamics and Control” published by the IEEE
association, it’s stated “Control is important for design. Engineering systems are traditionally designed based on
static reasoning, which does not account for stability and controllability.” Studying control would give limitations on
design options. Hereafter is described the systems engineering approach to our project.
― 723 ―

3
TABLE OF CONTENTS
CHAPTER 1 PROBLEM STATEMENT ...................................................................................................................... 5
Number of Bicycle Accidents .............................................................................................................................. 5
What’s Behind Bicycle Accidents ....................................................................................................................... 5
Market Growth of Bicycles ................................................................................................................................... 6
Current Solution -Competition with Existing Product and Services .............................................................. 6
Problem Extracted from Interviews .................................................................................................................... 6
Road Infrastructure............................................................................................................................................... 6
Traffic Safety Education ....................................................................................................................................... 7
Bicycle Simulator .................................................................................................................................................. 7
Project Requirements ........................................................................................................................................... 7
CHAPTER 2 ANALYSIS AND DISCUSSION OF ALPS METHODS ....................................................................... 10
Scenario Graph ................................................................................................................................................... 10
CVCA .................................................................................................................................................................... 11
OPM Level 0 Diagram ......................................................................................................................................... 12
Interview............................................................................................................................................................... 13
More Observation Interview............................................................................................................................... 14
To_By_Using ....................................................................................................................................................... 15
QFD / Cost Worth Analysis ................................................................................................................................ 16
Use Case / VOC ................................................................................................................................................... 18
Morphological Concept Generation based on Functions .............................................................................. 19
Project Charter/Milestone Chart ........................................................................................................................ 20
Prototype ............................................................................................................................................................. 21
FMEA .................................................................................................................................................................... 23
DSM ...................................................................................................................................................................... 24
Robust Conceptual Design ................................................................................................................................ 25
Update of Roadmap ............................................................................................................................................ 26
Internal Rate of Return(IRR) & Net Present Value (NPV) ................................................................................ 27
Sensitive Analysis .............................................................................................................................................. 32
CHAPTER 3 DESIGN RECOMMENDATION ........................................................................................................... 33
Features of Bicycle Simulator System ............................................................................................................. 33
Designs of bicycle simulator system ............................................................................................................... 34
Features of Business Model .............................................................................................................................. 34
CHAPTER 4 COMPETITIVE ANALYSIS .................................................................................................................. 44
Business Model Overview ................................................................................................................................. 44
Revenue Sources and Cost Structure .............................................................................................................. 44
CHAPTER 5 ALPS ROADMAP AND REFLECTIONS ............................................................................................ 46
CHAPTER 6 CONCLUSIONS AND FUTURE WORK ............................................................................................. 49
The problems we need to overcome in order to complete our project ........................................................ 49
― 724 ―

4
Plan of future work for the organization that will take over our project results (goals, dates) ................. 50
Needed resources for future work .................................................................................................................... 50
Contingency plan/guidance of expected problems ........................................................................................ 51
Guidance for unexpected problems ................................................................................................................. 51
ALPS tools need to be revisited and key tools of project .............................................................................. 52
ACKNOWLEDGMENTS .............................................................................................................................................. 55
References .................................................................................................................................................................. 56
APPENDIX ................................................................................................................................................................... 57
― 725 ―

5
CHAPTER 1
PROBLEM STATEMENT
Number of Bicycle Accidents
To address the grave danger of the environment surrounding the bicycles, we start from looking at the statistic
of bicycle accidents in Tokyo, Japan. In the year 2009, 156,000 bicycle accidents occurred and among them
695 people were killed. Remind that this data only account for the partial area of Japan. The data is referenced
from the Metropolitan Police Department. From the past, countermeasures to bicycle accidents have been
taken so the numbers of death caused by bicycle accident are gradually decreasing. However, occupancy of
bicycle accidents among overall traffic accidents is increasing (ref. Figure1-1, Metropolitan Police Department).
Evidence could be shown from Figure 2 as well. When we compare the number of death caused by bicycle
accidents in Japan and Netherlands, which is famous for its bicycle rider population and its advanced road
infrastructure for bicycles, we could see that the death rate of Japan is very high. It is difficult to draw any
conclusion but the one of the challenges in decreasing the number of bicycle accidents may be due to the
increasing number of bicycle users (ref. Figure1-3). Also, the increase in the number of electric assisted
bicycles could be taken into account (ref. Figure1-4). Referring some facts from China, which country has the
largest population of cyclists, 400,000 electric assisted bicycles are in Shenyang. The number of death by
electric assisted bicycles increased by 81% in the year 2007 compared from the year 2006. Lack of road traffic
manners by the bicyclists, design of bicycle itself and lack of public sector to check the speed of products
should be discussed. Measures have been already taken to ban the traffic of electric assisted bicycles on some
roads.
What’s Behind Bicycle Accidents
In this section, we indicate several problems which lie within bicycle accidents.
– No license required for riding bicycles
– Unlike cars, bicycles have no protection devices such as seatbelt or airbags
– Bicyclists often not buying insurance for bicycle accidents
– Bicyclists remarkably lacking the recognition of bicycles as light “vehicle” which is determined by traffic law
– High bicycle accident hours: 8am-10am and 4pm-6pm
(1/3 of accidents are happening at the above time frame)
– Lack of Helmet Wearing Law
― 726 ―

6
(1/3 of bicycle accidents cause head injuries. Among people who died from head injuries, 85% of them
would have survived if worn helmets) (ref. Foreign Country Bicycle News No 94, 99)
– Increase of travel distance by bicycles (Increase of 14,850 km in 10 years)
Market Growth of Bicycles
In the year 2005, the number of bicycle possession in Japan reached 86 million. It is reported 1.045 million
bicycles are manufactured every year. (ref. Japan Bicycle Promotion Institute) Current bicycle sales ranking is
marked from the top in the following order. Bridgestone, Panasonic, Miyata and Maruishi. Company Yamaha is
growing its market share by selling electronic assisted bicycles.
Current Solution -Competition with Existing Product and Services
There is statistical data that 25,000 bicycle safety educations were held in 2006 and 2.76 million people
attended the lecture in Japan. Budget for traffic safety education is spent 6.729 million yen a year (ref. Japan
traffic safety education association) At present, the police department deliver lectures using a method called
“Scared Straight Education” to raise awareness of traffic accidents, to acquire adequate judgment when biking
and to detect high accident possibility scenarios beforehand.
The market price of relevant product and service is as follows. In the market share of bicycle simulator, only
Honda is the major player in Japan.
– Honda Bicycle Simulator: ¥73,2900 (tax included), ¥69,800 (tax excluded)
– Scared Straight education by stunt man: ¥250,000 per lecture
Problem Extracted from Interviews
From the interview with the high school teacher whose school applied scared straight education in their traffic
safety education lecture, officer of Kanagawa Police Department and an employee of Kawaski City, we
discovered problems regarding road infrastructure, traffic safety education and bicycle simulator.
Road Infrastructure
Traffic accidents are not only due to human errors but also from the defective road infrastructure. To name a few,
the set of traffic signals and installation of maintenance hatches. They are managed uniformly by Prefecture’s
Public Safety Commission and Ministry of Land, Infrastructure, Transport and Tourism, respectively. These
boundaries create the inflexibility to work towards the common goals by separate sectors.
― 727 ―

7
Traffic Safety Education
The traffic safety lecture given out by police departments is lecture-centered so its content turns out to be very
passive. Attendees tend to get bored easily. A lecture in combination with bicycle simulator may alleviate
boredom (ref. Figure1-5)
Bicycle Simulator
High school students who are teenagers at their adolescence tend to be overconfident lacking risk awareness
and traffic morals to even practice to look to the right and left before crossing roads. Scared straight education
is effective in the way that it conveys fear and the feeling of responsibility psychologically. The disadvantage it
holds is the expensive cost per lecture and actual injuries occurring in the performance to replicate the accident
scenes.
Bicycle simulators can be the alternative to scared straight education. It’s attractive enough for young students
to lean over and hold interest in traffic safety education. However, the sound and display lack reality. Also, the
current BS takes 5 to 10 minutes to finish one learning course so the time efficiency is bad for all the students to
try out the simulation. For the instructors, the initial set up of BS is a burden.
Project Requirements
Our project was established to propose a new conceptual design of bicycle simulator that could reduce the risks
of bicycle accidents. Issues reviewed during the project were as follows.
1) Identifying the location/site with high traffic risks and defining the reasons
2) Investigating and analyzing statistics of traffic accidents
3) Hearings to bicycle associations for safe design of traffic education
4) Modeling the bicycle simulator functions
5) Discovering and identifying possible risks while driving and understanding how to mitigate them
6) Reviewing the proposed basic requirement specification of bicycle simulator
7) Reviewing the system configuration of the proposed bicycle simulator
8) Evaluating the feasibility of the proposed bicycle simulator
Our specific solution to mitigate the risks of bicycle accidents is described from the next chapter.
― 728 ―

8
Figure1-1 Bicycle Accidents versus Traffic Accidents
Figure1-2 Data of Bicycle Accidents (07.2.9 Ministry of Land, Infrastructure, Transport and Tourism)
Figure1-3 Increase of Bicycle Possession (Ministry of Land, Infrastructure, Transport and Tourism)
― 729 ―

9
Figure1-4 Transition of Number of Electric Assisted Bicycles
Traffic Safety EducationProposal
Practical Skill Session
Lecture
(Fear experience+Evaluation)×Low CostCost Benefit Performance
Main
+
Organizer
Active StudentsClear Evaluation Result
(BS)・Experience of Fear・Raise of Discipline・Recognition of
Road RuleStudent
e-learning↓
・Repetition・Score Evaluation
Figure1-5 Concept of our Traffic Safety Education
― 730 ―
10
CHAPTER 2
ANALYSIS AND DISCUSSION OF ALPS METHODS
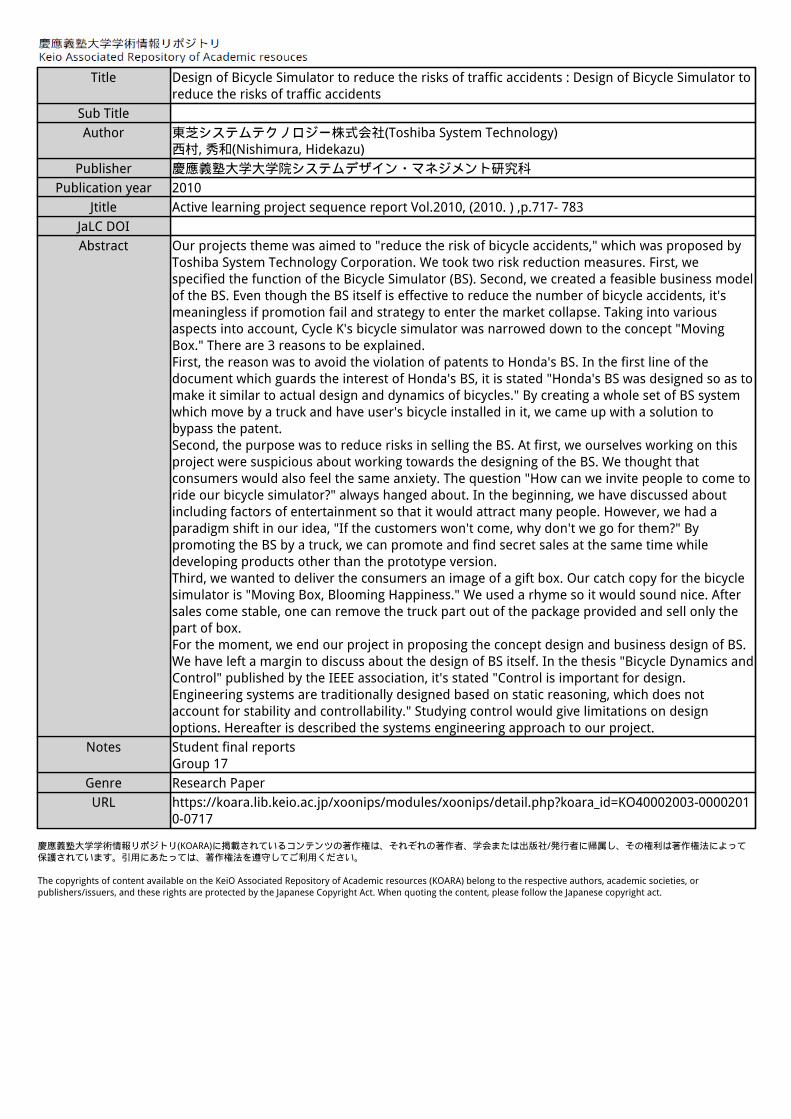
Scenario Graph
We narrowed down our ideas to the key scenario from the mind map. On making the Scenario Graph, we made
a mistake by mixing factors of “bicycle simulator” and “bicycle rider” on the same chart. For example, when we
see the chunks in “where”, we have depicted places where bicycles are used (e.g. Pedestrian road, park, tunnel)
and places where bicycle simulators would be installed (e.g. home, amusement park) as well. We should have
organized a scenario graph for each. At the moment, we have extracted the scenario “Home use bicycle
simulator for children to train the skill of riding a bicycle for the purpose of reducing risk.” Gathering information
on bicycle accidents, we will then reselect the key scenario which would most effectively reduce the risk.
We came up with several questions during this activity, “Can we put catch phrases such as [anywhere], [anyone]
and [anytime] in the graph?”, “Could we have many main functions?” and “If so, how do we choose the main
function and which would we work on first?”
Main Function
Where
Cross Road
Pedestrian Road
Parking Lot for BicyclesKinder Garden Tunnel
Bicycle Road
Game Competition
Entertainment
Training skills and manners
Education
Test
Licensing Riders
Risk Reduction
Reduce death accidentInvestigation
Maintenance
PromotionManagement
Marketing
Hill
Snow road
Snow road
Wet road
Home
School
OfficePlant
Department
Amusement PartPolice Station
Gym
Hospital
Park
Elevator
StationSupermarket
Anywhere
What
Training Riding/Learning Road Rules Checking the Bicycle
Feel Fear Feel Danger Road bike
Mountain bike
Reduce death accident risk
Reduce risky riding habit
Observe the behavior of riders
Education for trainers Education for beginners
Grade the riding skills Charge money for game
Investigation for safe bicycles
Research for city layout
Experiment of new traffic rule
Traveling to feel fun
Promotion for new bicycle
Diet
K e y S c e n a r i o
R i s k R e d u c t i o nM a i n F u n c t i o n
A n y w h e r eW h e r e
A n y o n eW h o
T r a i n i n g R i d i n g / L e a r n i n g R o a d R u l e sW h a t
A n y t i m eW h e n
H o m e u s e B i c y c l e s i m u l a t o r t o t r a i n r i d i n g a b i c y c l e f o r k i d s t o r e d u c e r i s k
Figure2-1 Scenario Graph and Key Scenario
― 731 ―

11
CVCA
We made the CVCA based on our “key scenario” and “tentative product image.” By using the CVCA tool, we
were able to define business opportunities. So that many people could casually use the simulator, our team had
come up with a product using i-pad. The key feature of our tentative product is to use bicycle already owned by
the rider. It reduces the manufacturing cost of the bicycle simulator thus leading the customers to pay less. We
thought this could be realized by creating easy-to-install applications downloaded from i-phone or i-pad. Our
concern for the CVCA is “How will the insurance company relate with bicycle simulators?”
User
Server
Government(Police)
Toshiba System Technology
Researchand
development
Manufacture
I pad
! $
!
Product Design
!
$
Prog
ress
repo
rt u
sed
$
!
Simulator
Simulator
Prog
ress
repo
rt u
sed
Sim
ulat
ion r
esul
t
Software company$ $
Har
d W
are
Soft
War
e
Date
$
!Date
Figure2-2 CVCA Diagram of Bicycle Simulator
― 732 ―

12
OPM Level 0 Diagram
We made the OPM Level 0 Diagram based on our “key scenario” and our “tentative product image”. From the
result we were able to depict interrelation between the bicycle simulator system and its surroundings. Since it
was the first time for our team members to use this tool, it turned out to be the longest activity we had worked on.
What made it difficult for us was the fact that there weren’t any explanations in the handout. For the next step,
we would move onto Level 1 of OPM Diagram. However, this OPM Level 0 Diagram was made before defining
the core problem so the product system is subject to change.
Product System
Operating Electric Power
Balance
Speed
Own Bicycle SimulatorUser
Riding Skill
Riding Manner
Bad
Good
Bad
Good
Figure2-3 OPM Level 0 Diagram
― 733 ―

13
Interview
The stakeholder interview which we plan to conduct is progressing at the moment.
We chose 3 stakeholders to interview.
1. Employee of AXA DIRECT Non-life Insurance Company
2. Parents and children in Jingu-Gaien park
3. Prefectural Engineering High School of Kawasaki
The employee of AXA DIRECT Non-life Insurance Company is an acquaintance of our team member Mr.
Takamura. We are asking to provide us information of accident data (where, who, when, why the accidents
occurred) and of insurance products.
Interviewing and observing people in Jingu-Gaien Park, we expect to gain information on how children obtain
their bicycle riding skill when they first learn how to bike.
The reason we chose the third stakeholder is because we found an article with the headline “Experiencing Fear
of Accidents – Road Safety Lecture.” The school held a demonstration of bicycle accidents using a stunt man.
We have made appointment with the school next Thursday, 2010/6/24.
After all, we were not able to obtain excellent information about No1 and No2 because of other party's all
matters affection.
However we were able to obtain excellent information about No3.
In addition we have conducted interview to one of the doctoral student in SDM. He mentioned “No one would go
and ride bicycle simulators if it’s not fun.” This word greatly impacted our team motivating us to create an
enjoyable bicycle simulator.
― 734 ―

14
More Observation Interview
We conducted interview with 2 organizations, the Prefectural Police Department of Kanagawa and the
Prefectural Engineering High School of Kawasaki.
From the interview with the Prefectural Police Department of Kanagawa, we were able to reveal the current
status of Traffic Safety Education cooperated by the police. Currently, the program is consisted of 2 parts, the
lecture and the skill practice session. The lecture takes up most of the program and is considered the most
important factor in traffic safety education. Bicycle simulators are used in skill practice sessions but are
subsidiary in the program.
From the school interview, we heard from the school teacher complain about students lacking interest in such
traffic safety lectures mentioned above. They claimed that without the essence like bicycle simulator, students
would not be attracted their curiosity. To overcome the status quo, the school provided a lecture using a stunt
man where actual people performed the scene of a bicycle accident. These kind of education implanting the
sense of fear in one’s mind is known as the “Scare Trade Education Method.” It aims people to be more
cautious about their action they take by inputting sense of fear. The teachers told us that this kind of education
is very effective to attract students. However, they’ve mentioned that they weren’t able to organize lectures
periodically because of the expensive cost (¥250,000 per lecture) it takes. The teachers had a wishful thinking
that installing a bicycle simulator could solve the problem of cost.
Although we have gained much information from interviews, on the whole, we learned that questions on “safety”
issues are very delicate. Mr. Takamura had arranged all the interviews with the police. He told us that the police
officers weren’t willing to share information on bicycle accidents to the public besides information shown on the
internet. Looking at our team’s struggle with interviews, our mentor taught us how to conduct efficient interviews.
He introduced us the term “Investigative Negotiation” which is a basic approach to persuading someone in
negotiations. He also taught us the concept of “the Danger of last hours”, a term meaning that the 80% of
important things would be decided in the last 20% of the negotiation time. We have also learned that when
interviewing, we can’t relax until the last minute.
― 735 ―

15
To_By_Using
The first draft of our To_By_Using statement is expressed in Figure 10. So far we have examined through the
accident data of the Tokyo Metropolitan Police Department (refer Figure 11). The number of bicycle accidents
which occurred in 2009 was 156,373 out of 736,668 of the total accidents. 155,581 people were injured and
among them 695 people were killed. The main victims were elderly people of more than 65 years old. 54% of
the accidents occurred at intersections. By using this tool we tend to make a concrete project goal.
By sharing clear vision with our team members, we are expecting to tighten our teamwork to head forward our
final goal. Our next step is to gather data from different associations so as to compare and evaluate the
reliability of data. We would then target the main user of the bicycle simulator to decrease the accident rate by
maximum. We would then define the exact number to fill in the blanks of the sentence.
Table2-1 Table of To_By_Using
TO reduce bicycle accidents and the number of people who die from accidents,
reducing bicycle accidents --% by the year ----,
BY training the skill and manner of the rider
USING Bicycle Simulator
― 736 ―

16
QFD / Cost Worth Analysis
QFD is meant to specify customer’s requirements. We defined our “customer,” the user of bicycle simulator. For
the customer requirements, we picked up 7 statements, which 7 is a magical number to make things simple to
explain. They are “reality, easy interface of software, easy initial set up, universal (meaning, the machine could
be used in various countries), low initial cost and low running cost.” For the engineering metrics, we chose
elements which are measurable in numbers.
The result for the QFD Phase 1, the key engineering metrics for the bicycle simulator turned out to be
“3D-Capable Video” and “Sound Sensitivity.” QFD Phase 2 yielded the result that the solution element which
fulfills the engineering metrics would be the “display” and the “headphone.” The difficulty in making the QFD
was trying to line up the statement in a MECE (Mutually exclusive and Collectively Exhaustive) way.
Using the Cost Worth Analysis, we set our bicycle simulator prime cost to be approximately ¥200,000. This
cost would have the advantage over Honda bicycle simulator which costs ¥700,000.
Figure2-4 QFD Phase 1
Engineering Metrics Customer Perception
Customer Requirements Cu
stom
er W
eigh
ts
The number of display
Screen size
Brightness
Total number of pixels (pix)
3D-c
apab
le v
ideo
Sound sensitivity
Play audio frequency
Voice range
Menu of software for language
Sound menu guidance
Mechanical noise when driving
Volume of the machine
Machine weight
Number of pople needed to assemble
Time needed to assemble
Nee
d of
tool
to a
ssem
ble
Weight tolerance
Proper machine height
Voltage range of adaptation
Power consumption
Engine oil consumption
1
Wor
se
2 3 4 5
Bet
ter
Reality 9 3 3 3 3 9 9 3 3 1 9 b AEasy user interface for software 3 3 3 3 9 9 AbcPhysical attribute of the machine 1 1 1 9 9 b A c
Convenient to assemble 3 1 9 9 3 b A cUniversal 1 3 9 9 9 b Ac
Low initial cost 9 3 3 3 3 3 3 3 3 1 1 1 1 1 1 b A cLow running cost 3 1 1 9 9 b Ac
Technical Targets
Better 5 Ab A A A A A Abc Ac A c c c c c c Ab Ab A c A: Cycle K BS4 b b b A b Ab A A A b: H's BS
Technical Benchmarking 3 c bc bc A A A b b Ab c: BS software2 c c bc
Worse 1 c bc b b b b b
Raw score
58 64 66 54 108
108
54 66 39 36 18 90 9 27 27 9 9 9 18 36 36
RelativeWeight 6% 7% 7% 6% 11
%
11%
6% 7% 4% 4% 2% 10%
1% 3% 3% 1% 1% 1% 2% 4% 4%
Existing System orCompetition
― 737 ―

17
Figure2-5 QFD Phase 2
Figure2-6 Cost-Worth Diagram
Table B: Cost Worth MatrixRelative Worth *
Part # Solution Element Cost * From QFD Phase II Relative Cost Cost / Worth1 display $829.00 41% 40% 0.982 Bicycle $150.00 17% 7% 0.413 Balance Sensor $160.00 3% 8% 2.974 Speed Sensor $80.00 3% 4% 1.485 GUI of software $5.00 8% 0% 0.036 3D glasses $220.00 1% 11% 9.287 Headphone $500.00 26% 24% 0.948 Transformer $130.00 2% 6% 3.359 Total Cost $2,074.00 100% 100%
display
BicycleBalance Sensor
Speed Sensor
GUI of software
3D glasses
Headphone
Transformer
0%
10%
20%
30%
40%
50%
0% 10% 20% 30% 40% 50%
Re
lati
ve
Co
st
Relative Worth
QFD Cost - Worth Diagram(based on "Total Part Cost" as divisor)
― 738 ―
18
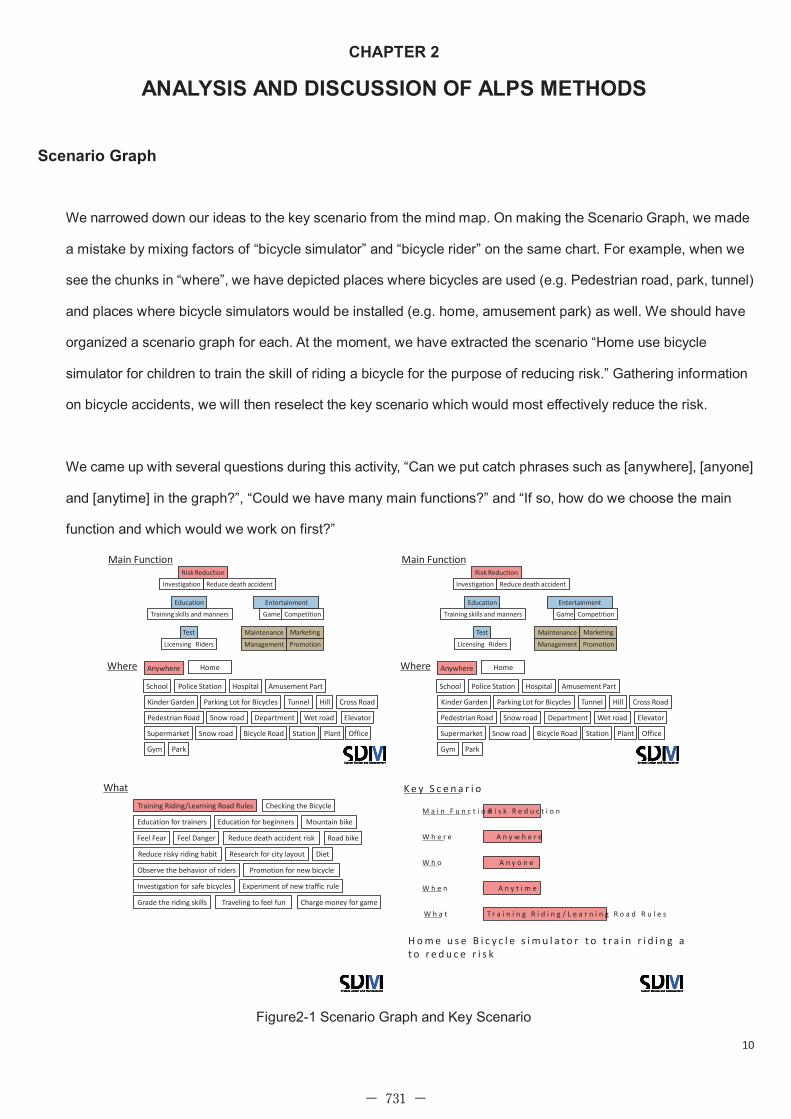
Use Case / VOC
Our team had come up with the use case “Half Learning – Half Teaching Bicycle Simulator.” This idea emerged
from the word “半学半教”, one of the concepts in SDM, which means that each individual have the roll not only
to teach but also to learn from others, or the other way around. The person who rides the bicycle simulator not
only learns the manner and road rules when riding bicycles but also teaches what they have learned to others
after when he or she experience riding the bicycle simulator.
Use Case “Half Learning – Half Teaching Bicycle Simulator” (VOCs are show in blue)
The teacher brings a bicycle simulator
Portable
Initial set up capable by one person
Initial set up done in 15 minutes
A student gets on the bicycle simulator
Adjustable seat height
A student press the start button
Easy to press-button
Clear function by color discrimination
Provision of error sound
A menu for profile (age, occupation, affiliation) input pops out on screen
Various language selection
Audio Output
Abundant choice
Scene of 3D bicycle simulation displayed on screen
View of the landscape around a particular school
Reality
A student finished riding the bicycle simulator
Conduct of Feedback Survey
Hand out of revision sheet
The student goes back home and shares his experience with his/her family
― 739 ―

19
Morphological Concept Generation based on Functions
Using Morphological Concept Generation, it made it easier to generate ideas creating an image in our mind. We
learned that many solutions exist towards solving a problem. Our team challenges to make a bicycle simulator
which provides “reality.” It was interesting when we got the idea of a Vibration Suit when thinking of how to
reproduce the body sensory information in an accident. To realize the reality of speed, we have come up with an
idea of setting a fan next to the bicycle simulator. Although we generated many solutions, we were able to
decide which one should be excluded from our bicycle simulator by comparing the diagram with the result of
QFD.
Figure2-7 Morphological Concept Generation on Bicycle Simulator
― 740 ―
20
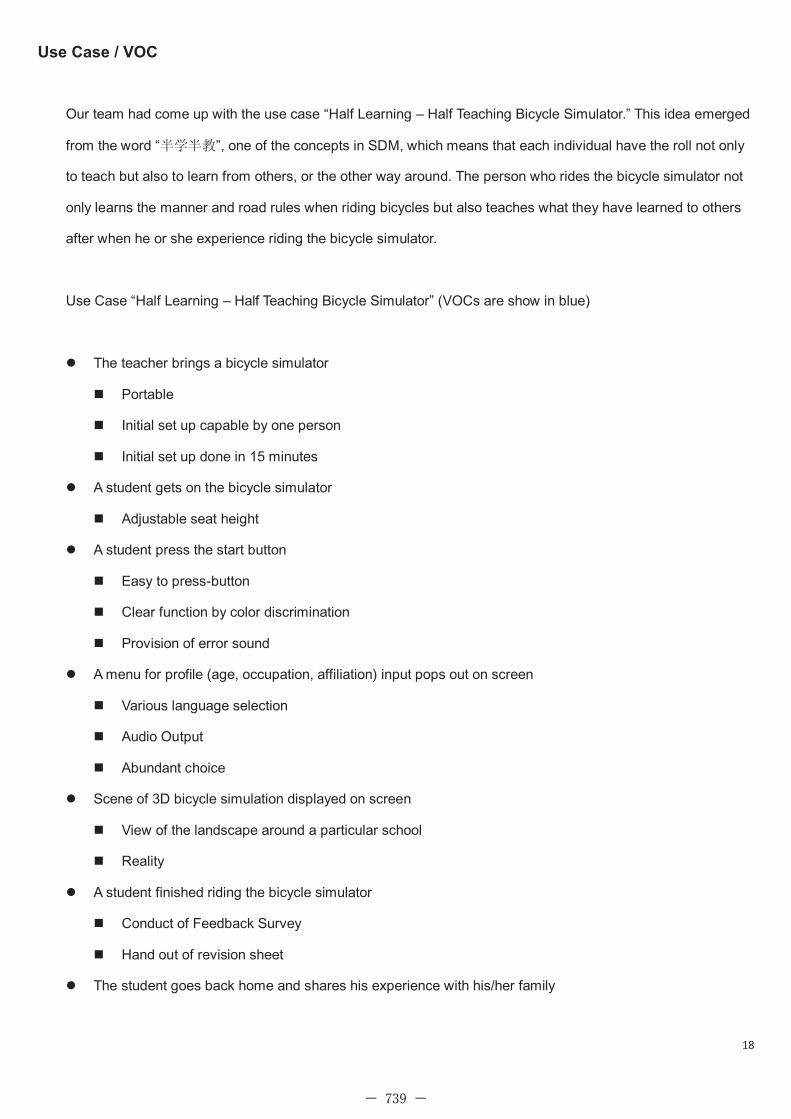
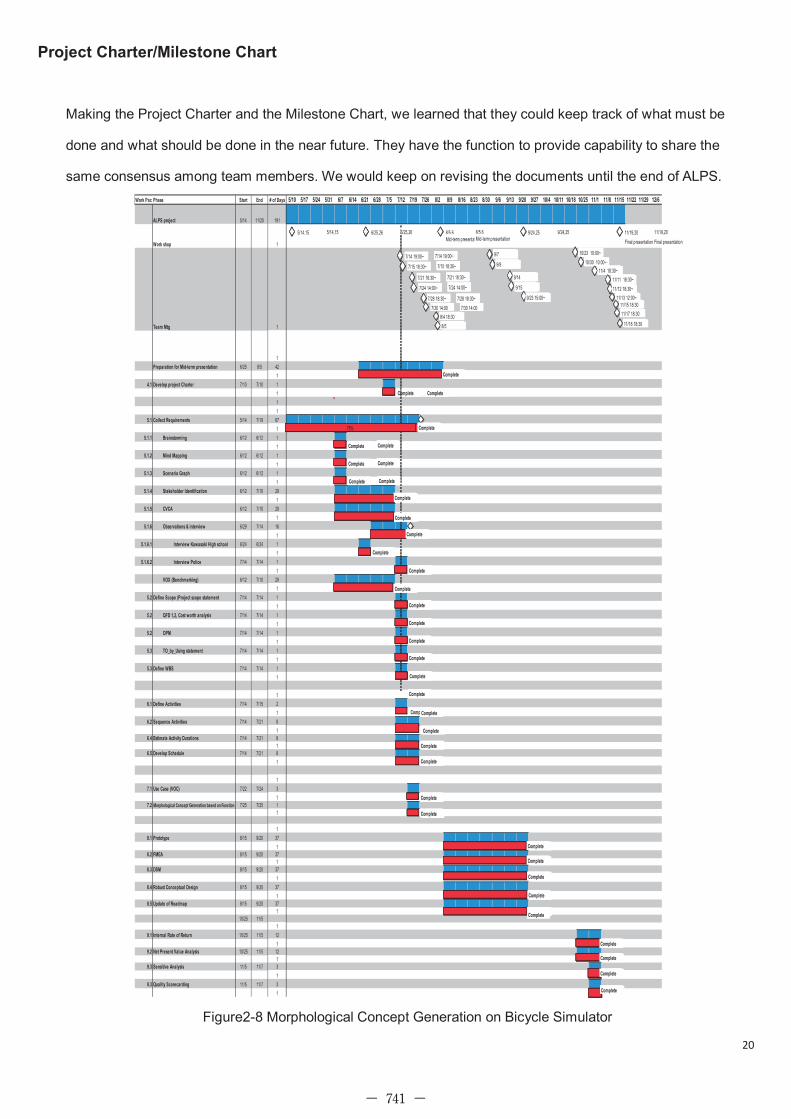
Project Charter/Milestone Chart
Making the Project Charter and the Milestone Chart, we learned that they could keep track of what must be
done and what should be done in the near future. They have the function to provide capability to share the
same consensus among team members. We would keep on revising the documents until the end of ALPS.
Figure2-8 Morphological Concept Generation on Bicycle Simulator
Work Package IDPhase Start End # of Days 5/10 5/17 5/24 5/31 6/7 6/14 6/21 6/28 7/5 7/12 7/19 7/26 8/2 8/9 8/16 8/23 8/30 9/6 9/13 9/20 9/27 10/4 10/11 10/18 10/25 11/1 11/8 11/15 11/22 11/29 12/6
ALPS project 5/14 11/20 191. . . . . . . . . . . . . . . . . . . . . . . . . . . .
Work shop 1
Team Mtg 1
1
Preparation for Mid-term presentation 6/25 8/5 42 . . . . . . .
1
4.1 Develop project Charter 7/10 7/10 1 .
1
1
1
5.1 Collect Requirements 5/14 7/19 67 . . . . . . . . . . .
1
5.1.1 Brainstorming 6/12 6/12 1 .
1
5.1.2 Mind Mapping 6/12 6/12 1 .
1
5.1.3 Scenario Graph 6/12 6/12 1 .
1
5.1.4 Stakeholder Identification 6/12 7/10 29 . . . . .
1
5.1.5 CVCA 6/12 7/10 29 . . . . .
1
5.1.6 Observations & interview 6/29 7/14 16 . . .
1
5.1.6.1 Interview Kawasaki High school 6/24 6/24 1 .
1
5.1.6.2 Interview Police 7/14 7/14 1 .
1
VOX (Benchmarking) 6/12 7/10 29 . . . . .
1
5.2 Define Scope (Project scope statement 7/14 7/14 1 .
1
5.2 QFD 1,2, Cost worth analysis 7/14 7/14 1 .
1
5.2 OPM 7/14 7/14 1 .
1
5.3 TO_by_Using statement 7/14 7/14 1 .
1
5.3 Define WBS 7/14 7/14 1 .
1
1
6.1 Define Activities 7/14 7/15 2 .
1
6.2 Sequence Activities 7/14 7/21 8 . .
16.4 Estimate Activity Durations 7/14 7/21 8 . .
16.5 Develop Schedule 7/14 7/21 8 . .
1
1
7.1 Use Case (VOC) 7/22 7/24 3 .
17.2 7/25 7/25 1 .
1
1
8.1 Prototype 8/15 9/20 37 . . . . . . .
18.2 FMEA 8/15 9/20 37 . . . . . . .
18.3 DSM 8/15 9/20 37 . . . . . . .
1
8.4 Robust Conceptual Design 8/15 9/20 37 . . . . . . .
18.5 Update of Roadmap 8/15 9/20 37 . . . . . . .
110/25 11/5
1
9.1 Internal Rate of Return 10/25 11/5 12 . .
19.2 Net Present Value Analysis 10/25 11/5 12 . .
19.3 Sensitive Analysis 11/5 11/7 3 .
1
9.3 Quality Scorecarding 11/5 11/7 3 .
1
Morphological Concept Generation based on Function
5/14,15 6/25,26 8/5,6 9/24,25 11/19,20
Complete
Complete
Complete
Complete
Mid-term presentation Final presentation
Complete
75%
7/14 19:00~
7/15 18:30~
7/21 18:30~
7/24 14:00~
7/28 18:30~
7/30 14:00
8/4 18:30
Complete
Complete
Complete
Complete
Complete
Complete
Complete
Complete
Complete
Complete
Complete
Complete
Complete
Complete
Complete
Complete
Complete
Complete
Complete
Complete
Complete
Complete
Complete
Complete
Complete
Complete
Complete
Complete
9/7
9/8
9/14
9/15
9/23 15:00~
8/5
10/23 10:00~
10/30 10:00~
11/4 18:30~
11/11 18:30~
11/12 18:30~
11/13 12:00~11/15 18:30
11/17 18:30
11/18 18:30
― 741 ―

21
Prototype
Our team had difficulty in prototyping since this time the keyword “tangible” appeared on the assignment. When
we consider bicycle simulators, simulation is the critical issue to be discussed thoroughly. However, simulation
is categorized into software. We were confused whether testing the software, the content of the bicycle
simulator, would be called as a “tangible” prototype because the user would not be able to touch anything but
only intellect with the conceptual mind. We thought that the design of bicycle simulator itself, the hardware,
would be called as a tangible prototype.
As we researched about bicycle accidents, we soon discovered that injury caused by bicycle accidents is partly
due to the fact of bicycle riders not wearing helmets. Our initial requirement from the proposal was to decrease
the number of bicycle accidents. It may not meet the requirement but we realized that decreasing the injury
level in bicycle accidents may also be possible by promoting people to wear helmets.
For one of the scenarios to be shown to the audience, we generated an idea of a bicycle simulator that controls
the power ON and OFF of the monitor by the removal of helmets. This way, it may raise the awareness of
bicycle riders to put on helmets while they bike.
Figure2-8 Image of a part of function of bicycle simulator
Prototype has the purpose to share the same thoughts among team members as well as generating ideas.
Since prototype is fairly destined to result in failure, we assume that prototyping “rapidly” is the most effective
― 742 ―

22
way to save energy and time for project members. Repeating the process of reflecting feedback to the prototype
as many times possible may be the solution to modify the project to stay or shift to the right track.
Figure2-9 Image of prototype
― 743 ―

23
FMEA
We revisited the Use Case to come up with potential failure modes. Although we have detected potential
mechanical errors which may occur, we learned by calculating the Risk Priority Number, the content of simulator
would have fatal effect on the user if the content is wrong or perhaps misperceived by the user. For example, if
a wrong road rule is taught in the simulator, it may harm the user to come across with accidents on actual roads
riding a bicycle.
Figure2-10 Failure Mode and Effect Analysis
Function orRequirement
Potential FailureModes
Potential Causesof Failure
Occ
urre
nce
Local EffectsEnd Effects onProduct, User,Other Systems S
ever
ity
Detection Method/Current Controls
Det
ectio
n
RPN
ActionsRecommended to
Reduce RPN
Responsibility andTarget Completion
Date
Transfer
Heavy to Carry
Material of BS 5
StrainedBack/fingerpinched Hernia/No Grip 10 weighing 1 50
making itcompact/choosing theright material
manufacturer/designer
Width of BS toobig to enter inthe room
Mistake inarchitectre of BS 4 wreck of wall
impossible toenter the room 8 measuring 2 64
making itcompact/decomposable parts
manufacturer/designer
Injury caused bysharp edge
Defect inmanufacturingprocess 4 skin cut bleed 10 rounding of edge 3 120
correct manufacturingline manufacturer
Mounting on BS
Impossibleadjustment ofchair Falled off screw 1
damage to BSby forcefullytrying to movethe BS
give up usingthe BS 7
test before releasingproduct 2 14
have someone withstrength hadle the BS manufacturer
Falling off theseat afterseating Unbalanced seat 2 injury of user bruise 6 undetectable 2 24
spreading mattress onthe floor user
Pressing thebutton Break of button
Pulling of thebutton 2 damage of BS
payment ofreparing cost 3 undetectable 2 12 repairement
manufacturer/user
Electric shock Tangled wire 1 shock to userdecrease ofreliability 10 undetectable 10 100
wipe off waterbeforehand using theBS
manufacturer/user
Button too stongto push
Something stuckin 2
impossible tostart up no use of BS 3
test before releasingproduct 2 12 checking the spring
manufacturer/
Pushed buttonnot coming back
Strength pushingthe button 2
decrease ofusersatisfaction
payment ofreparing cost 3 undetectable 2 12 repairement
manufacturer/user
Interface withscreen Input mistake
Error in touchingthe screen 8
unmeaningfulscreenmovement
decrease ofusersatisfaction 1 check of screen 9 72 warning signal user
Freeze of screen Software error 6impossible tomove on no use of BS 5 test 7 210 re-booting software
Sudden powerdown No battery 3
impossible tomove on
decrease ofusersatisfaction 5 undetectable 7 105 dual power machine
Unpluging of wire 3imposiible tomove on
decrease ofusersatisfaction 5 undetectable 7 105 dual power machine
Operation (ridingthe BS)
Lack ofequipment (suchas 3D glass)
Shortage inpackaging 3
impossible tosee thescreen clearly tiredness in eye 7 list checking 5 105
checking the packagebefore sending tocustomer manufacturer
Sudden powerdown No battery 3
impossible tomove on
decrease ofusersatisfaction 5 undetectable 7 105 dual power machine
Unpluging of wire 3imposiible tomove on
decrease ofuser 5 undetectable 7 105 dual power machine
Foot stuckbetween thepedal
Misuse of BS bythe user 6 injury of user bruise 10 undetectable 6 360
locking feet on thepedal by belt user/designer
Break of chain Rusted chain 2impossible tooperate no use of BS 7 test 2 28 material test manufacturer
No effect ofbrake system Signal error 2
impossible tooperate
ask forrepairment 8 test 6 96 regular check machine
Light notilluminating
UnconnectedWire 2
decrease ineffectiveness
switching thelight bulb 8 test 6 96 regular check manufacturer
Content ofSoftware
Wrong TrafficRule Lack of research 4 misconception accident 10
referrencing latestinformation 10 400
mutiple-check byprofessionals software maker
WrongLanguage Lack of study 2 misconception
decrease ofusersatisfaction 8
checking withlanguage checkingsofware on the net 1 16
multiple-check bynative speakers software maker
― 744 ―

24
DSM
We chose task-based DSM for it to better fit the project. Before we’ve made the DSM on the excel sheet, we
listed the tasks and organized them to the project graph as follows.
Figure2-11 Design Structure Matrix
Through creating the DSM, we found out that “Conduct of research on bicycle accidents,” “Creating initial QFD”
and “Constructing scenarios for simulation” must be done in parallel because they are interdependent on one
another. Also, we found out that other themes could be discussed in sequence.
Bicycle simulator needs tremendous researches to actually reduce the accidents by simulating real bicycle
accidents. To simulate effectively we have to choose which function to spend more money on than others by
using QFD. We understood that our bicycle simulator project always has to start from robust researches. Before
using DSM, our discussion went back and forth because we have not done enough researches on bicycle
accidents itself. We will research more on bicycle accidents to develop a good simulator.
― 745 ―

25
Robust Conceptual Design
Manufacturing/Performance Variation
Production Variation, Environmental Variation
An epoch-making change in the product is Moving Box that can receive the bicycle classroom always
freely.
Conceptual Robust Design
Biggest opportunities are up front
We designed the following compositions of Moving Box.
The sight is made three-dimensional by 3D image.
Aural puts out power by building the speaker into high sound quality.
The vibration and the wind are produced and the jolt of an accident and natural environment are caused.
Poka Yoke/Error Proofing
Customer & External Interaction
The bicycle simulator will offer the model of a bicycle accident decrease and a new traffic safety classroom.
Variety/Platform Architecture
Customer Needs, Technology Changes
Customers' needs are to experience the cyclist accident realistically in the traffic safety classroom.
We think that I newly develop an advanced bicycle simulator that can realistically reproduce the cyclist
accident.
Business Model
Competition, Development Challenges
The maker will be able to establish a new business model who can have abundant, excellent data,
manages data, and supplies it by using Ipad.
― 746 ―

26
Update of Roadmap
Refer to CHAPTER5 ALPS ROADMAP AND REFLECTIONS
― 747 ―

27
Internal Rate of Return(IRR) & Net Present Value (NPV)
Estimate(“y” represents years from on sale.)
Cost
Fixed Cost = ¥1,561,480,000・y + ¥2,863,290,000
Management team with one director, two section chief, five old-timer engineers
= (salary of one director per year +
salary of one section chief per year +
salary of five old-timer engineers per year) × years
= (10000000 × 1 + 8000000 × 2 + 6000000 × 5) × (y + 1)
= 56000000・y+56000000
Engineer from headquarters for development
= salary of one person per month × months × years × person
= 6000000 × 12 ×(y + 1) × 10
=720000000・y + 720000000
Engineer from headquarters for software upgrade
= salary of one person per month × person
= 6000000 × 12 × y × 10
=720000000・y
Accounting & Finance Div.
= salary of one person per month × months × years × person
= 3000000 × 12 × (y + 1) × 5
= 180000000・y + 180000000
Planning Div.
= salary of one person per month × months × years × person
= 4000000 × 12 × (y + 0.5) × 5
= 240000000・y+120000000
Public Relations Div.
= salary of one person per month × months × years × person
= 3000000 × 12 × (y + 0.5) × 5
= 180000000・y + 90000000
Databank Company = 25000000
― 748 ―
28
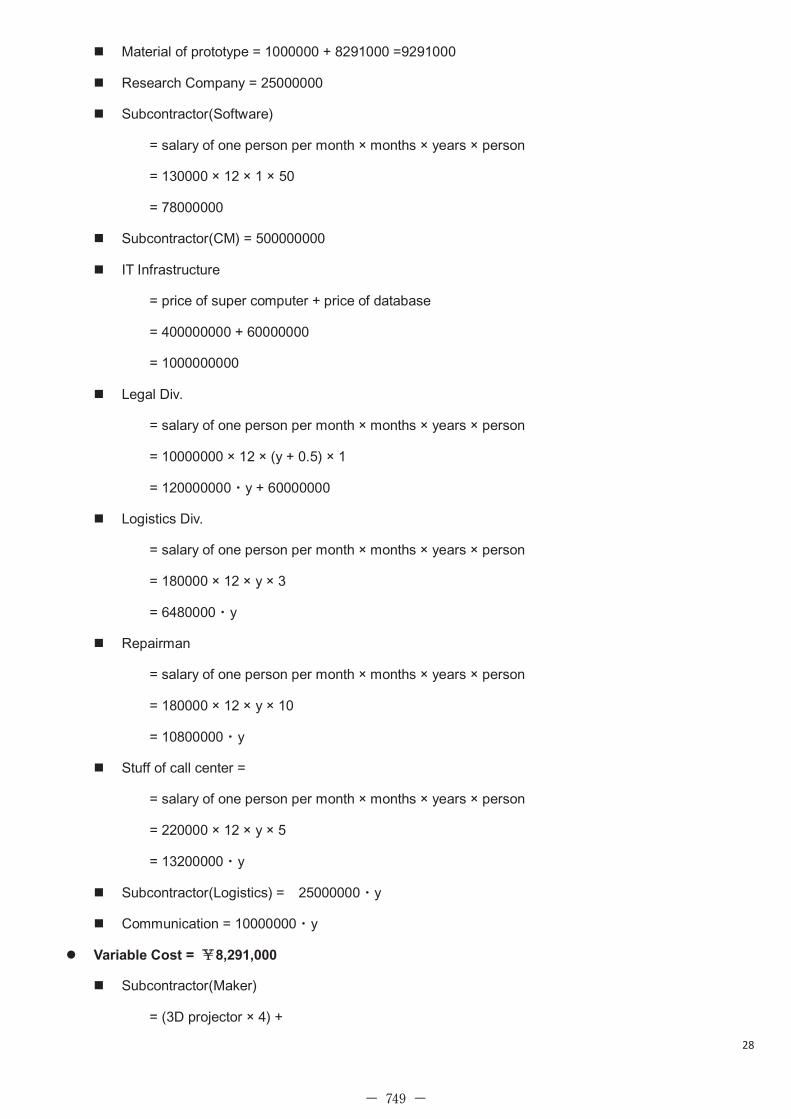
Material of prototype = 1000000 + 8291000 =9291000
Research Company = 25000000
Subcontractor(Software)
= salary of one person per month × months × years × person
= 130000 × 12 × 1 × 50
= 78000000
Subcontractor(CM) = 500000000
IT Infrastructure
= price of super computer + price of database
= 400000000 + 60000000
= 1000000000
Legal Div.
= salary of one person per month × months × years × person
= 10000000 × 12 × (y + 0.5) × 1
= 120000000・y + 60000000
Logistics Div.
= salary of one person per month × months × years × person
= 180000 × 12 × y × 3
= 6480000・y
Repairman
= salary of one person per month × months × years × person
= 180000 × 12 × y × 10
= 10800000・y
Stuff of call center =
= salary of one person per month × months × years × person
= 220000 × 12 × y × 5
= 13200000・y
Subcontractor(Logistics) = 25000000・y
Communication = 10000000・y
Variable Cost = ¥8,291,000
Subcontractor(Maker)
= (3D projector × 4) +
― 749 ―

29
(Full HD Screen × 4) +
Butter zoon +
Vibration Machine +
Car(Nissan Civilian) +
Computer +
Speaker
= 2880000 + 108000 + 123000 + 300000 + 4570000 + 160000 + 80000
= 8221000
spare part from Subcontractor (Maker)
= cost of per time × probability
= 700000 × 1%
= 70000
Revenue
Price
Pricing Strategy
For being able to get Accumulated Sales Amount twice as Accumulated Cost before the market
saturation, we do such pricing following.
Numerical result
Price = ¥50000000
Sales Volume (market size, market share, market growth)
Market size: 1,000
1000 is calculated based on the number of cities which will become our potential customer.
Some of the cities are expected that have a possibility of buying two or more.
Market share: 100% (in the first 20 years)
Our product is a simulator with a very high reality that has never been achieved. And we will
apply for a patent for this product.
It is called "Bicycle Simulator" but not in the existed "Bicycle Simulator" market. The market it
will entry is a completely new mark “Super Reality Bicycle Simulator ".
Therefore, in this new niche market, under patent protection, our product can possess 100%
of the market share.
Market growth: 17.5%
― 750 ―

30
It is a forecast that refers to the market growth rate of the super computer.
Calculate (and Visualize the results)
Internal Rate of Return (IRR)
Please refer to Table2-2
Net Present Value (NPV)
Please refer to Table2-2
Payback Period
We will get profit from the fifth year.
― 751 ―

31
Tab
le2-
2 C
alcu
late
of
NP
V a
nd IR
R
Pro
ject
Yea
r F
ree
Cas
h F
low
In
itial
Inve
stm
ent
Dis
coun
t Rat
e IR
R
NP
V
t 1+
r (1
+r)
^2
FC
Ft
FC
Ft/(
(1+
r)^2
)
2011
-1
3617
7000
0 28
6329
0000
10
%
43%
¥
13
,203
,933
,26
5.64
8
110%
2.
1435
8881
-6
3527
5755
.1
1606
7223
266
2012
-2
0223
3000
0
-9
4343
1870
.2
2013
-2
1596
3000
0
-1
0074
8333
4
2014
-1
4697
9000
0
-6
8566
7882
.4
2015
52
7490
000
2460
7797
8
2016
45
9135
0000
21
4189
8660
2017
11
9216
0000
0
55
6151
4384
2018
24
4146
0000
0
11
3895
9108
5
― 752 ―

32
Sensitive Analysis
1. At what price would you consider the product/service is too expensive to buy?
Answer: 200,000,000-
2. At what price would you start to consider the product/service is expensive?
Answer: 100,000,000-
3. At what price would you start to consider the product/service is cheap?
Answer: 40,000,000-
4. At what price would you consider the product/service is too cheap to buy?
Answer: 15,000,000-
The fire engine of 15m class of the fire engine costs 50 million yen. The fire engine of 40m class of the fire
engine costs 180 million yen. A chemical car for the airport is 280 million yen. The fire engine of a chemical car
for the airport is 280 million yen.
And a general price of earthquake simulation vehicle is about 100 million yen. A general price of a high-level
recreational vehicle is 16.5 million yen.
Moreover the price of the pedestrian and the crowd simulation software in Japan is 14 million 175 thousand yen.
― 753 ―
33
CHAPTER 3
DESIGN RECOMMENDATION
Features of Bicycle Simulator System
There are three features as following can be used to illustrate this new bicycle simulator.
Super Reality
“Super Reality” means this bicycle simulator will provide 360-degree high-definition 3D video,
multi-directional high-fidelity stereo audio. And Users can not only through visual sense, auditory sense to
get feedback, but also through tactile sensation to feel the bumpy roads or impact of traffic accident.
With this feature, the effect of training will be significantly better than other simulators looks like a game
machine from game center, and the risk of feeling fear of traffic accident will be zero.
Movable
“Movable” means this bicycle simulator can be transported by trucks. The bicycle simulator is assembled in
to a container and can be installed onto a truck.
With this feature, instead of make people to come to use the bicycle simulator, we make bicycle simulator to
go to people. Therefore, we can reduce the users’ time cost such as spending a long time waiting in a
boring traffic jam and money cost such as gasoline fee, and can increase the chance of people know the
bicycle simulator to gain more users.
High degree of customizing freedom
“High degree of customizing freedom” means users can select and combine environment elements or traffic
route by themselves to make an original course. And the original course can be shared between users.
For the Corporate intelligence theory proved that group of amateur may perform better than experts, we will
also encourage users to download a common raw course and to modify it, and the history of modification
will be saved. For such collaboration, the raw course will get better and better, and finally it will be perfect.
The perfect course will be fixed in the simulation system for ever.
With this feature, we can maximize the collective wisdom to overcome the problem that our engineer cannot
enumerate the whole circumstances of the bicycle related traffic accident. But, the most important thing is
that users’ motivation of taking training will be improved, because they are not being trained by others but
by themselves.
Training progress can be memorized
― 754 ―

34
“Training progress can be memorized” means the simulator will send different users’ training progress to the
database server in the IT center of the simulator company after the simulation, and receive the data of
progress next time for users can proceed from where last time stopped.
The training course of existing bicycle simulator is short and users have to train from start each time.
Therefore, after using several times they may know the whole content of courses and feel boring. With this
feature, users will not get boring, and have motivation to finish the training left.
Designs of bicycle simulator system
Function Design
Refer to Figure3-1 Function Design of Bicycle Simulator System, Page 41.
Function flow
Refer to Figure3-2 Function Flow, Page 42.
Physical Design
Refer to Figure3-3 Physical Design of Bicycle Simulator System, Page 43.
Features of Business Model
Stakeholders
Buyers
Government
Bicycle driving skills training institution
Users
Normal people
The people take the training using this bicycle simulator as a compulsory education which is a part
of people's public welfares.
People who met an accident
The people take the training using this bicycle simulator as a part of the psychology treatment after
a bicycle traffic accident.
People who causes accident
The people who caused a bicycle related traffic accident have to take the training for restudying
the traffic rule and law. And this bicycle simulator will be used not only teach them, but also test
them.
Maniac of such a simulation
The people who are interested in simulation technology and have service spirit to make it perfect.
― 755 ―

35
We will also regularly release new plug-in packages for the bicycle simulator system. Users need
to download license for using them and they may collect them for fine.
Financing
Refer to Figure3-4 Costs of Bicycle Simulator Business, Page44.
In this figure, the items in the tail end of each narrow composed the items in the forepart.
The cost of development will cost 8,000,000,000 yen. We need to get it from head office.
The first year of production start-up capital needs 2 billion. We need to get such a big money from both head
office and venture capital.
The fixed cost from the second year will be 1,561,480,000 yen per year, and the variable cost will be
8,291,000 each bicycle simulator. This money is calculated based on situation of building a new company
from zero, so it is a reasonable figure.
The price of each bicycle simulator will be 50,000,000 yen. It sounds like huge money. But we calculate it
based on existing product released by Sony. The price of Sony 3D Truck is 4,000,000,000 yen. Our price is
only 12.5% of it. And our main buyer is government who value performance more than the price. Therefore,
this is a reasonable price. And with this price, we can recover the cost within five years.
Table3-1 Chang of Accumulated Profit of Bicycle Simulator Business
Development
We will organize the development team with one director, two section chief and five old-timer engineers
from head office. And they will be the management team after the production.
― 756 ―

36
Production
We will organize our production as outsourcing and offshore business model to reduce cost.
Our company provides the product design and money to start the business.
Our product mainly consists of two parts, software and hardware.
For production of software we will build a project team with 10 good engineers from our company to manage
the software production. They have to do Requirements analysis, Functional specification, manage the
offshore software company and test the delivered software.
We will contract with manufacture to product hardware part for order. It will reduce the risk of holding stock.
We will assemble the software and the hardware into simulators and print our logo on them.
Marketing
Because of the buyer is government and the user is people, we will execute two kinds of marketing
strategies.
First, we will broadcast commercial message during half a year. The target of our commercial message is
1 2
3 4
― 757 ―

37
users. We use the commercial message to rouse people's safety minds and create demands of using the
bicycle simulator. It the demands of using the bicycle simulator is big, it will be an incentive for government
to buy this bicycle simulator.
Second, we will use statistics of bicycle related traffic accident to lobby the government, to make the
government realize the importance of bicycle safety education.
Using
Users need to download license by iPad from software server in the simulator IT center, for using the
simulator. The iPad which installed license will be used as a remote controller of the bicycle simulator.
After get the license, users take iPad and their personal bicycle to the bicycle simulator. They have to install
their personal bicycle onto the bicycle simulator, and then use the iPad to start-up the system. The license
will be send to the bicycle simulator and transmit to the software server in the IT center of our company.
Software server gets the license and verifies the validity of license. If the file is valid, the software server will
retrieves corresponding version information of available software and progress information of users by
license and send the data back to the bicycle simulator.
Bicycle simulator gets the version information of software and progress information of users, and start-up
the simulation system that corresponds to the license. The simulation will begin from will where users
stopped last time.
During the simulation, the bicycle simulator will provides 360-degree high-definition 3D video by four 3D
projectors, and provides multi-directional high-fidelity stereo audio. And Users can not only through visual
sense, auditory sense to get feedback, but also through tactile sensation to feel the bumpy roads or impact
of traffic accident. If users encounter traffic, they will follow from their bicycle onto the buffer made by
airbags.
At the end of simulation, the bicycle simulator will send the progress information of users to the software
1 2
― 758 ―

38
server in the IT center of our company. And it will be stored for using next time.
1 2
3 4
6 5
― 759 ―

39
Data Business
We will sell the statistics data which gathered from simulations to the research and development institute,
the government, or the lab of college.
The data without user’s personal information just include information such as “there are 1000 times accident
at the cross road”.
The data will be used to develop Geographic Information System, decision making of new traffic policy,
developing of new bicycle related product and so on.
7 8
1 2
― 760 ―
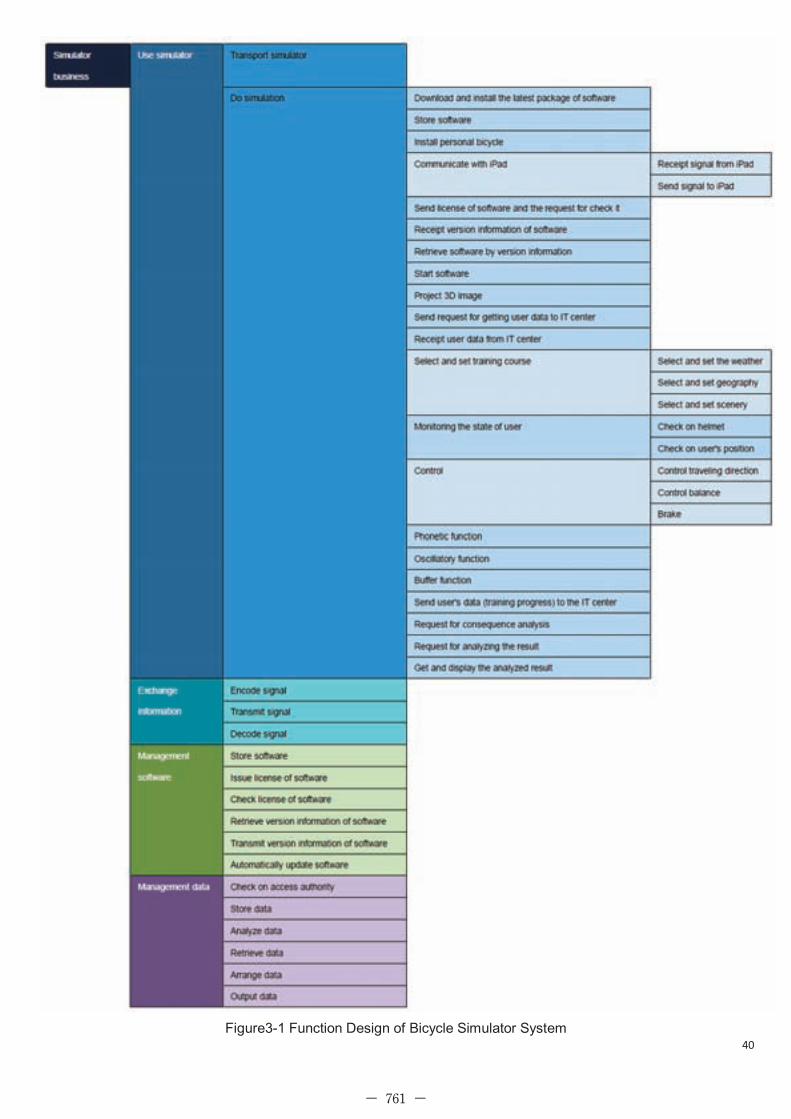
40
Figure3-1 Function Design of Bicycle Simulator System
― 761 ―

41
Figure3-2 Function Flow
― 762 ―

42
Figure3-3 Physical Design of Bicycle Simulator System
― 763 ―

43
Figure3-4 Costs of Bicycle Simulator Business
― 764 ―

44
CHAPTER 4
COMPETITIVE ANALYSIS
Business model overview
Alps team 17’s business model is shown below. We are to reduce bicycle accident by bicycle simulator. We
make revenue from several sources. First revenue source is the government and cities by selling the simulator
itself. Second revenue source is a bicycle simulator user by charging them the use fees. Lastly, we sell accident
data to research center for the future road development. We set the price of this product to 50 million yen. Since
this simulator is not low price, we install this simulator to the truck to increase the portability for the users and to
market our bicycle simulator to as many people as possible in the initial stage of our business. Not only the
portability, but also this simulator has a lot of function so that anyone from kids to elderly can try this simulator.
What
Reduce bicycle accident by bicycle simulator
Where
Any where by carrying it by truck
Who
Anyone who ride a bicycle
How
By simulating real riding situation with 3D views and surround speakers etc...
How much
50 million yen / the simulator
Figure4-1 Cycle K business model
Revenue sources and cost structure
Revenue
Source 1. Bicycle simulator sales.
Bicycle simulator Pricing Strategy
For being able to get Accumulated Sales Amount twice as Accumulated Cost before the
market saturation, we do such pricing following.
Price = ¥50,000,000
Sales Volume (market size, market share, market growth)
Market size: 1,000
1000 is calculated based on the number of cities which will become our potential
customer.
Some of the cities are expected that have a possibility of buying two or more.
Market share: 100% (in the first 20 years)
― 765 ―

45
Our product is a simulator with a very high reality that has never been achieved. And we
will apply for a patent for this product.
It is called "Bicycle Simulator" but not in the existed "Bicycle Simulator" market. The
market it will entry is a completely new mark “Super Reality Bicycle Simulator ".
Market growth: 17.5%
Source 2. Use fee of bicycle simulator from user
Normal user ¥0
User with car accident history ¥1000
24,000 students per year
Source 3. Sale of the accident data to data research center.
Cost
Refer to Internal Rate of Return(IRR) & Net Present Value (NPV),
Net Present Value (NPV): ¥13,203,933,265
Net present value of our product in 2011 is ¥13,203,933,265. and payback period from 2011 to 2015
Development time and risks
Our product takes some time to develop because it consist of not only the hardware but also the simulation
software. We estimated development time of our product to be one year. As far as we know, since no other
makers are developing the similar product and the product development is quite high, we think that the risk
of time development time is low. Instead, we use a lot of money for development therefore we need to
persuade the sponsor to finance us.
Protection strategy against other bicycle simulator.
In this new very niche market, our product would be possible to possess strong leadership in the market.
Unlike bicycle simulators produced by other maker, our product is super real so that it would not be
comparable. Their simulator should be sold to elementary school to get attraction from kids, but our product
is for cities to teach road rule through our product. Other possible competitor is “Scare trade education”
done by stunt. This education is very real and could be a potential competitor but it cost quite a lot of money.
For example a school pays 250.000 yen / one time. They are very expensive compare to what we are going
to offer. Also with the strong brand “Toshiba system technology” not many company can come after us
― 766 ―
46
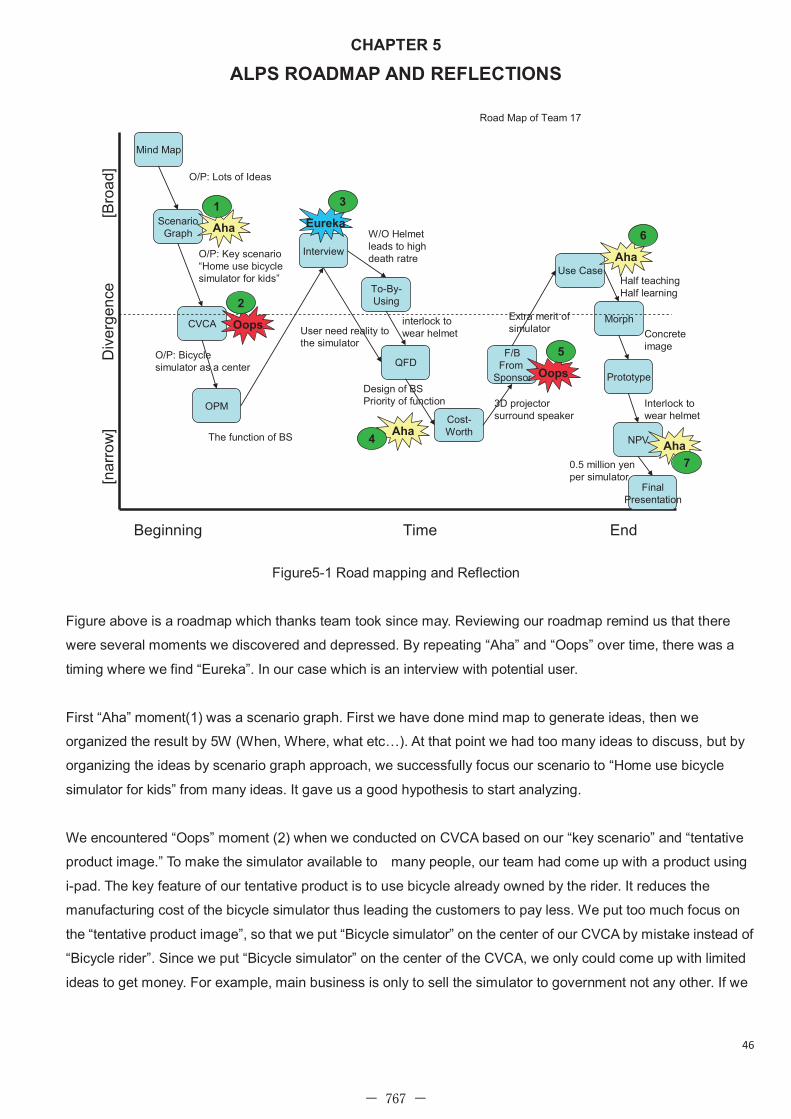
CHAPTER 5
ALPS ROADMAP AND REFLECTIONS
Mind Map
ScenarioGraph
CVCA
OPM
Interview
To-By-Using
QFD
Cost-Worth
F/BFrom
Sponsor
Morph
Prototype
Time
Div
erge
nce
[nar
row
][B
road
]
Beginning End
O/P: Lots of Ideas
O/P: Key scenario “Home use bicycle simulator for kids”
O/P: Bicycle simulator as a center
Aha
Oops
The function of BS
Eureka
User need reality to the simulator
W/O Helmet leads to high death ratre
interlock to wear helmet
Design of BSPriority of function
Aha
3D projectorsurround speaker
Use CaseAha
Extra merit of simulator
NPV
0.5 million yenper simulator
FinalPresentation
Interlock to wear helmet
Oops
Concrete image
Aha
Half teachingHalf learning
Road Map of Team 17
1
2
3
4
5
6
7
Figure5-1 Road mapping and Reflection
Figure above is a roadmap which thanks team took since may. Reviewing our roadmap remind us that there
were several moments we discovered and depressed. By repeating “Aha” and “Oops” over time, there was a
timing where we find “Eureka”. In our case which is an interview with potential user.
First “Aha” moment(1) was a scenario graph. First we have done mind map to generate ideas, then we
organized the result by 5W (When, Where, what etc…). At that point we had too many ideas to discuss, but by
organizing the ideas by scenario graph approach, we successfully focus our scenario to “Home use bicycle
simulator for kids” from many ideas. It gave us a good hypothesis to start analyzing.
We encountered “Oops” moment (2) when we conducted on CVCA based on our “key scenario” and “tentative
product image.” To make the simulator available to many people, our team had come up with a product using
i-pad. The key feature of our tentative product is to use bicycle already owned by the rider. It reduces the
manufacturing cost of the bicycle simulator thus leading the customers to pay less. We put too much focus on
the “tentative product image”, so that we put “Bicycle simulator” on the center of our CVCA by mistake instead of
“Bicycle rider”. Since we put “Bicycle simulator” on the center of the CVCA, we only could come up with limited
ideas to get money. For example, main business is only to sell the simulator to government not any other. If we
― 767 ―

47
could have put “Bicycle rider” on the center, we could have been come up with ideas such as charging money to
use and charging money for the accident information acquired from bicycle rider.
First and last “Eureka” moment (3) was an interview. Before the interview, we assumed that reasonable price
bicycle simulator will make us possible to distribute the product to many people and it leads to reduction of the
accident. However, interview with high school teacher made us realized that, simple bicycle simulator would not
help students to learn bicycle safety because the students would just enjoy riding “game like” bicycle simulator.
Instead, the teacher was choosing a method called “Scare trade education method” which lecture use a stunt
man to show the actual scene of a bicycle accident to make student realize how scary the bicycle accident is. By
this method students pays much more attention to learn the road rules. Also the teacher notified us that the
“Scare trade education method” cost them 250 thousand yen per one time so that they cannot do it many times.
With those finding we decided the key word of the bicycle simulator from “Wide spread by reasonable price” to
“Real and scary experience” Although it cost a lot to make students to feel scary by the simulator, it worth
investing.
After the “Eureka” moment “Aha” moment(4) has come again. The “Aha” moment has came when we were
doing the cost worth analysis after the QFD. From the interview we start focusing on reality to the simulator. To
simulate the reality, we came up with many ideas. For example, we tried to simulate the speed by wind from
electric fan. At that point we generate many ideas regardless of the cost. However, by using cost worth analysis,
we successfully prioritized our investment to 3D visual goods, surrounded speaker and vibration equipment to
the simulator.
The mistake was pointed out when we ask for F/B from mentor(5). By that time, we focused our discussion on
bicycle simulator to pursue reality. But the mentor told us that we should define the cause of the bicycle accident.
In fact, we spend a lot of time what kind of function we apply to the simulator instead of problem defining. From
that time, we started to investigate the cause of the accident and we found out that 1/3 of bicycle accidents
cause head injuries, and 85% of them would have survived if worn helmets. By this findings, we added a key
function interlock for wearing helmet to the simulator. F/B from mentor is very valuable as the project become
more and more concrete. The team member tend to become narrow view because they researched so much on
the subject.
We came to the “Aha” moment (6) when we did the use-case diagram. The tool showed us that only the
students who tried our simulator would learn the road rule. That fact realized us the need of the way to spread
what the simulator experience tell the students. To spread the experience of the simulator we concluded that
part of our concept of the simulator should be “Half learning, Half teaching”. By this way we can teach not only
the experiences but also the people who meet with him/her.
Finally, the last “Aha” moment (7) has come by doing the NPV study. Before we calculate the NPV, we had a
business ideas but it was not real. By trying to think about costs and investment, the ideas start to have more
and more reality. In our case, sponsor was an actual simulator company, therefore it was possible to check the
― 768 ―

48
reality with him. In conclusion of our study we came up with an ideas to reduce the cost by outsourcing software
development to China.
By reviewing the roadmap from the beginning, we realized it was a quite good roadmap. We start with a “Aha”
and the going through some “Oops”, those helps us to narrow down and broaden our ideas over time. Then after
the “Eureka” moment, our project went through quite smoothly. Important moment on our team was always F/B
from mentors and sponsors. They gave us not only fruitful advices but also severe comments and those
comments harden our project. If there were improvement points, I recommend to have NPV and Business model
lecture on the middle of the ALPS. Those lectures helped us to evolve ideas. By reviewing NPV on the middle of
the project, we can always come back from dream world to real world. In the real world, investment cost is
always a concern, therefore watching the NPV overtime would definitely helps to make the project more real.
Lastly, we appreciate faculty members big supports. I always liked prototypes. It was fun and exciting moments.
On the contrast, theme development has a problem. Our theme “Bicycle simulator” fit with ALPS very well,
however some of the themes were not. For instance Adidas theme was too ambiguous to solve by ALPS.
Therefore, I would like to recommend that theme should be reviewed very carefully by faculty stuff. You should
have advices sponsor members to be more concrete on what they want to solve. Because when students
choose theme, we never knows what would happen in the next step, therefore it will be faculty members job to
pick and modify candidate theme.
― 769 ―

49
CHAPTER 6
CONCLUSIONS AND FUTURE WORK
The problems we need to overcome in order to complete our project
As we will see in the following table, the problem about production management will be just restricted by Gantt
Chart. But we often hear that project doesn't proceed according to Gantt Chart. So, to develop a new tool may
help the organization that will overcome such a problem.
Problems Solution ALPS Tools
for Seeking Solution
The cost of development will
cost 8,000,000,000 yen. And
start-up capital of the first
year production needs 2
billion. We need to get such
huge money from both head
office and venture capital. To
persuade them will be a
problem.
This figure is calculated based on situation of building a
new company from zero. So, it is reasonable and feasible.
We will show the financial prediction result to the head
office and venture capital. To make them know that if they
invest us they will get profit from fifth year and the Net
Present Value will be 13,203,933,265.64 yen.
Financial Analysis
Elevator Pitch
Business Model
Function Diagram
QFD I & II
Cost Worth Analysis
Physical Design
We will operate production by
the way of outsourcing and
offshore. Whether the
outsourcers can deliver
products in time or not will be
a problem.
We will collect and compare historical data of some famous
outsourcers, and choose the one has a high confidence.
And we will build a project team to manage the whole
progress of production to make sure that production can be
done according to schedule.
Gantt Chart
To persuade the government
to buy our bicycle simulator
will be a problem.
We will produce a prototype which has nearly same
performance that looks like end-products, and presents it
to the government to let them experience the
super-reality.
Interview, Observation
CVCA
Business Model
Scenario Graph
Pugh Selection
Prototyping
In data business, leakage of
user individual information
will be a problem.
We will strengthen the management of the authority of the
access between servers. The user information database
server can access the software server, and the software
server can access the simulation statistics database
server. But the access of reverse order is prohibited. In
data business, the traded data will be just from the
simulation statistics database server; therefore no one
can infer related user's information by using the data.
―
― 770 ―

50
Plan of future work for the organization that will take over our project results (goals, dates)
(http://esd.mit.edu/HeadLine/keio010308/V-model.jpg)
As analyzing it in accordance with the V-model shown above, the things we did are Requirements Analysis and
Conceptual Design. The left work will be Specification, Architecture, Implementation, Testing, Documentation,
Training and Support, and Maintenance. So, we suggest the organization that will take over our project results to
do according to the following plan.
Refer to Table6-1 Plan of future work, Page 53.
Needed resources for future work
Refer to Table 6-2 Resources for future work, Page 54.
The table shown above illustrates the resources for future work.
In this table, the first line and the second line represent works, and the third line represents period of resources.
The first column represents that required resources should be procured from outside or inside.
Because of we suggest adopting Company Structure for operating this new bicycle simulator business, the
procured resource from inside of our company includes “Management team with director, section chief, old-timer
engineers”,” Accounting & Finance Division”,” Legal Division”,” Engineer for development from headquarters”,”
Planning Division”,” Public Relations Division”,” Logistics Division”,” Engineer for software upgrade from
headquarters”, and ” Repairman Call center”.
And the money be raised from the head office and venture capital, will also be used for connecting process and
make sure they can advances well, and to build IT Infrastructure just as IT center with database server, software
― 771 ―

51
server and network equipment. Due to they are belong to Sunk Cost and Fixed Assets, we treat these two as
inside resource.
For we will organize production as outsourcing and offshore, so the procured resource from outside of our
company includes “Databank Company”,” Market Research Company”,” Subcontractor=Outsourcer” and “spare
part from Subcontractor=Outsourcer”. The reason why the data collection is also done by outsourcing is that it
can makes engineers concentrate on the product design. By this way, the efficiency of the product development
will heighten.
Contingency plan/guidance of expected problems
Expected problems If the problems
are not resolved The organization should proceed
The cost of development will cost
8,000,000,000 yen. And start-up
capital of the first year production
needs 2 billion. We need to get such
huge money from both head office and
venture capital. To persuade them will
be a problem.
The project cannot
be begun.
The organization should stop the project because it
doesn't invest money yet, the loss is near 0.
Or seek two or more investors to decrease the risk
that they will owe.
We will operate production by the way
of outsourcing and offshore. Whether
the outsourcers can deliver products in
time or not will be a problem.
It is not possible to
put it on the
market according
to time.
The organization should monitor progress of the
projects frequently and explain to customers timely.
To persuade the government to buy
our bicycle simulator will be a problem.
The cost cannot
be gain back.
The organization should develop overseas market.
And produce a final product of this bicycle simulator
and supply it for free; by this way, we can make people
to know the advantage of using our bicycle simulator,
to expand the market demand.
In data business, leakage of user
individual information will be a
problem.
The law lawsuits
occur.
We have to check the history of access and find the
culprit. And to compensate the victim timely, to
strengthen the protection of database system, for
retrieving reputation of company.
Guidance for unexpected problems
Refer to Table6-1 Plan of future work, Page 53.
This schedule is established after consider the worst situation. So, we left plenty of time (25% of needed) when
developing the plan of future work, for the unexpected problems. (The green bar in Table8-1 means the time for
― 772 ―

52
dealing with unexpected problems.) If the project goes well we can accomplish it ahead of schedule. If not, we
will have nearly 25% of fixed time of per stage to solve the problem.
The point for avoiding the disastrous effects of project caused by unexpected problems will be “managers
frequently supervise the production site” and “the manufacturing division arrange data of project neatly and
report it every day”. By this way, the problems will be identified promptly. To discover problems and to solve the
problems in the early stage can reduce the cost and risk.
ALPS tools need to be revisited and key tools of project
Refer to Table6-1 Plan of future work, Page 53.
The right column of Table6-1 shows the ALPS tools we learned will be used in the future work. We also did them
during the ALPS lecture, but due to our limit of usable resource may be there are some important data we could
not gather. So, we hope that organization that will take over this project to do these tools again based on our
analyzed result, to compare their results with ours will improve the safety of their future business。
The tools have been highlighted by red color are the key tools in each stage.
― 773 ―

53
Tab
le6-
1 P
lan
of
futu
re w
ork
― 774 ―
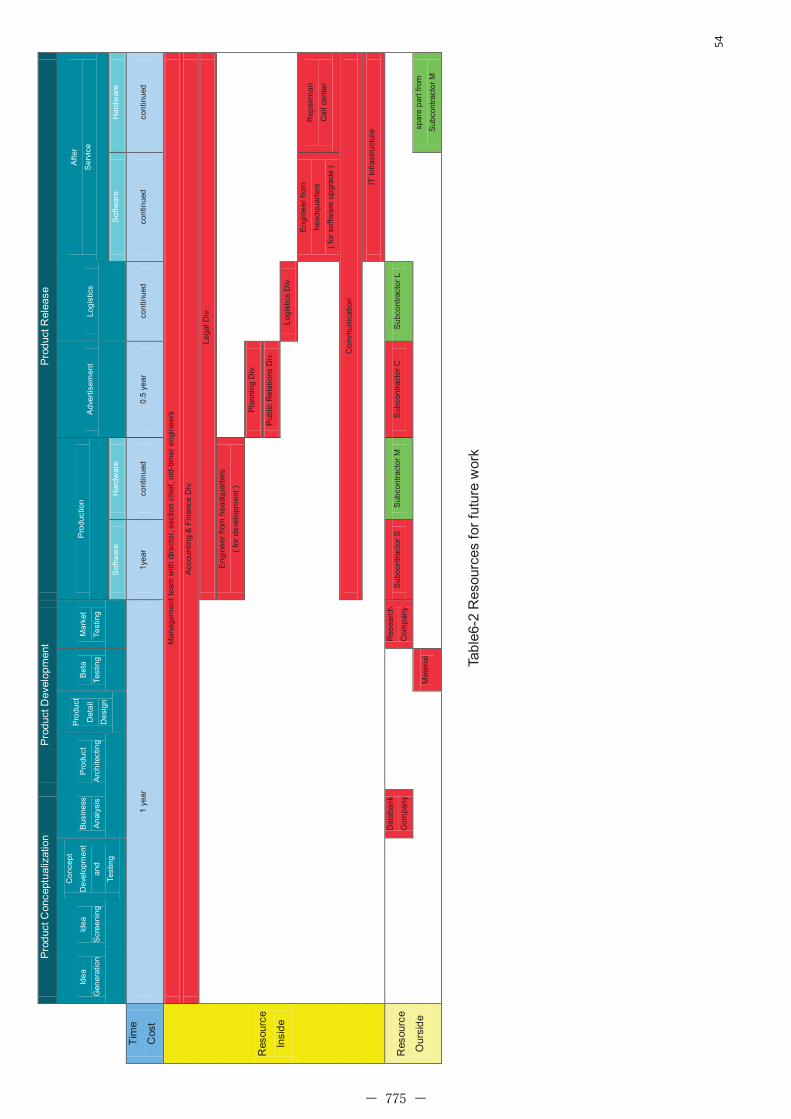
54
Pro
duc
t Con
cept
ual
izat
ion
P
rod
uct D
evel
opm
ent
Pro
duc
t Rel
ease
Idea
Gen
erat
ion
Idea
Scr
eeni
ng
Con
cept
Dev
elop
men
t
and
Test
ing
Bus
ines
s
Ana
lysi
s
Pro
duct
Arc
hite
ctin
g
Pro
duct
Det
ail
Des
ign
Bet
a
Test
ing
Mar
ket
Test
ing
Pro
duct
ion
Adv
ertis
emen
t Lo
gist
ics
Afte
r
Ser
vice
Sof
twar
e
Har
dwar
e S
oftw
are
H
ardw
are
Tim
e
Cos
t 1
year
1y
ear
cont
inue
d 0.
5 ye
ar
cont
inue
d co
ntin
ued
cont
inue
d
Res
ourc
e
Insi
de
Man
agem
ent t
eam
with
dire
ctor
, sec
tion
chie
f, ol
d-t
imer
eng
inee
rs
Acc
ount
ing
& F
inan
ce D
iv.
Lega
l Div
.
Eng
inee
r fr
om h
eadq
uart
ers
( fo
r de
velo
pmen
t )
Pla
nnin
g D
iv.
Pub
lic R
elat
ions
Div
.
Logi
stic
s D
iv.
Eng
inee
r fr
om
head
quar
ters
( fo
r so
ftwar
e up
grad
e )
Rep
airm
an
Cal
l cen
ter
C
omm
unic
atio
n
IT
Infr
astr
uctu
re
Res
ourc
e
Our
sid
e
Dat
aban
k
Com
pany
R
esea
rch
Com
pany
S
ubco
ntra
ctor
S
Sub
cont
ract
or M
S
ubco
ntra
ctor
C
Sub
cont
ract
or L
Mat
eria
l
sp
are
part
from
Sub
cont
ract
or M
Tab
le6-
2 R
esou
rces
for
fut
ure
wor
k
― 775 ―
55
ACKNOWLEDGMENTS
One year is a very short period of time because we enjoying the experience of working as a team in the ALPS
program. Group 17, nicknamed cycle K, 5 members in group 17 learning together during school teaching, doing
research about bicycle simulator and also discussing about our objectives, methods at any time through emails,
really working as a team. Passed all the difficulties and at last find out the solutions to the problems of creation of
bicycle simulator, we are happy that we got so much from attending the ALPS program.
Many thanks go out to Mr.Kensuke Kawai from Toshiba Technology who worked as a supporter of group 17, the topic
of creation of bicycle simulator is the one of the choices that be given by him for we to choose, also discussing with
us about the new ideas and difficulties that we encountered in the process, and giving our directions to the right
objective also make us feel grateful.
As the director of group 17, professor Hidekazu Nishimura help us to understand the knowledge of system design,
give us the suggestions that what and how we should do in the next steps, all of this is the most important support
for the improvements of our designs.
Also we must give great thanks to the professors that come from USA, it’s whom that gave us all the knowledge
which we need to create anddesign the whole model of bicycle simulator, without the courses they gave to us we can
not carry out the whole process, and the style that they make the lecture just like a show impressed all of us very
much.
At last, great thanks should be given to all the faculty of department of system design and all the students attending
ALPS who make it be so successful.
― 776 ―
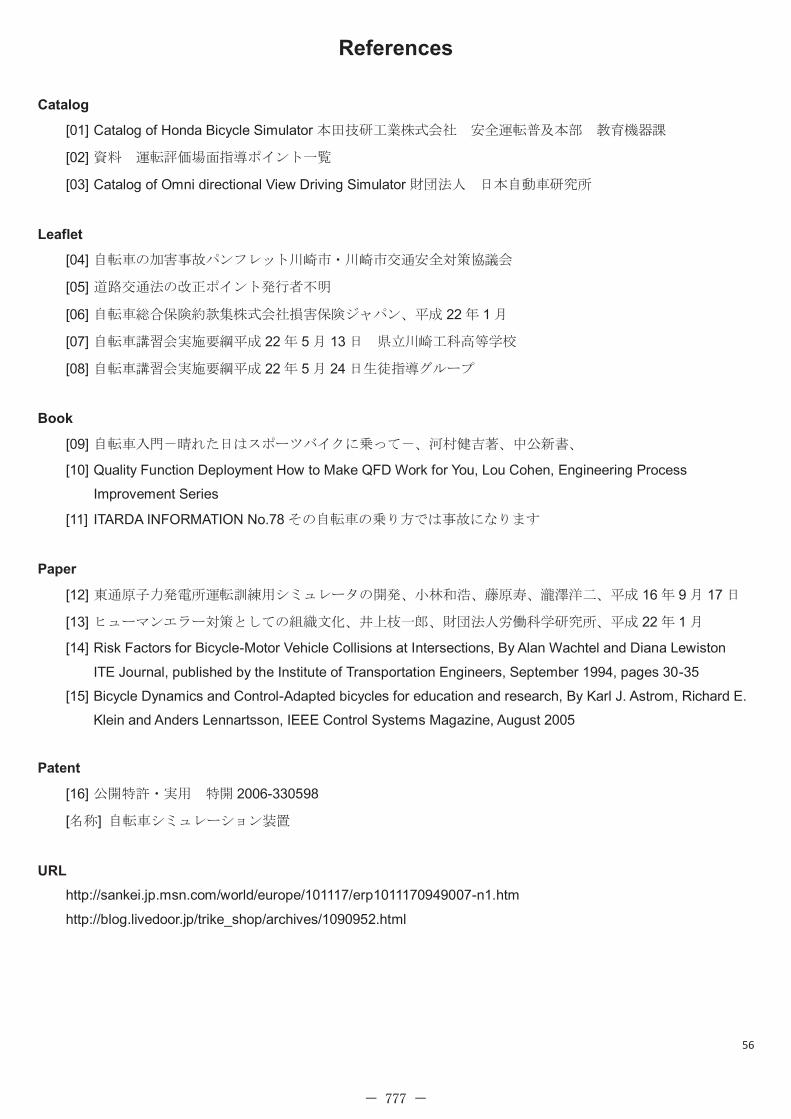
56
References
Catalog
[01] Catalog of Honda Bicycle Simulator本田技研工業株式会社 安全運転普及本部 教育機器課
[02] 資料 運転評価場面指導ポイント一覧
[03] Catalog of Omni directional View Driving Simulator財団法人 日本自動車研究所
Leaflet
[04] 自転車の加害事故パンフレット川崎市・川崎市交通安全対策協議会
[05] 道路交通法の改正ポイント発行者不明
[06] 自転車総合保険約款集株式会社損害保険ジャパン、平成 22年 1月
[07] 自転車講習会実施要綱平成 22年 5月 13日 県立川崎工科高等学校
[08] 自転車講習会実施要綱平成 22年 5月 24日生徒指導グループ
Book
[09] 自転車入門-晴れた日はスポーツバイクに乗って-、河村健吉著、中公新書、
[10] Quality Function Deployment How to Make QFD Work for You, Lou Cohen, Engineering Process
Improvement Series
[11] ITARDA INFORMATION No.78その自転車の乗り方では事故になります
Paper
[12] 東通原子力発電所運転訓練用シミュレータの開発、小林和浩、藤原寿、瀧澤洋二、平成 16年 9月 17日
[13] ヒューマンエラー対策としての組織文化、井上枝一郎、財団法人労働科学研究所、平成 22年 1月
[14] Risk Factors for Bicycle-Motor Vehicle Collisions at Intersections, By Alan Wachtel and Diana Lewiston
ITE Journal, published by the Institute of Transportation Engineers, September 1994, pages 30-35
[15] Bicycle Dynamics and Control-Adapted bicycles for education and research, By Karl J. Astrom, Richard E.
Klein and Anders Lennartsson, IEEE Control Systems Magazine, August 2005
Patent
[16] 公開特許・実用 特開 2006-330598
[名称] 自転車シミュレーション装置
URL
http://sankei.jp.msn.com/world/europe/101117/erp1011170949007-n1.htm
http://blog.livedoor.jp/trike_shop/archives/1090952.html
― 777 ―

57
APPENDIX
Cooperation group
AXA Life Insurance company
AXA Non-Life Insurance company
Prefectural Kawasaki engineering department high school
Kawasaki City citizens life part regional safety promotion section
Kanagawa police headquarters Traffic Administration Section
Reference literature
Proposal concerning promotion of safety use for bicycle
(Bicycle measures examination informal social gathering)
About the safety training in the bicycle (Masumi Akiyama)
Bicycle traffic safety education targeted with grade-schooler and research on the effect
(Atsushi Nakamura: The Sumitomo Trust & Banking Co., Ltd. and Oomori Nobuaki and Noboru Harada:
Tokyo University graduate school engineering system research course)
The realities analysis concerning bicycle traffic safety measures in the police
(Nihon University Department of science and engineering Social traffic engineering department)
Bicycle traffic safety education manual (Tokyo)
― 778 ―

Group 17’s Final Presentation Slides
― 779 ―

DESI
GNOF
ALP
S�20
10�Project�Tea
m�Cycle�K
DESI
GN�O
F�BI
CYCL
ESI
MULA
TOR
BICY
CLE�
SIMU
LATO
R
Intheye
ar20
04…
In�th
e�ye
ar�200
4�…
ProblemStatement
Problem�Statement�
Nb
fbi
lid
tNum
ber�o
f�bicycle�acciden
ts�per�yea
r
�200
9(Jap
an)
9(
p)
156,00
0�bicycle�accide
nts
945�pe
ople�were�kille
d
�Occup
ancy�of�b
icycle�acciden
tsam
ong�ov
erall�traffic�acciden
tsg
are�increa
sing
Data��of�M
etropo
litan
�Police�Dep
artm
ent
ProblemStatement
Problem�Statement
Lk
fBi
lH
ltL
Lack�of�B
icycle�Helmet�Law
�1/3�of�b
icycle�acciden
ts�cau
se�hea
d�injurie
s/3
yj
�85%
�of�the
m�wou
ld�hav
e�survived
�if�worn�he
lmets
Data��of��Fo
reign�Co
untry�Bicycle�New
s�No.94
,99
― 780 ―
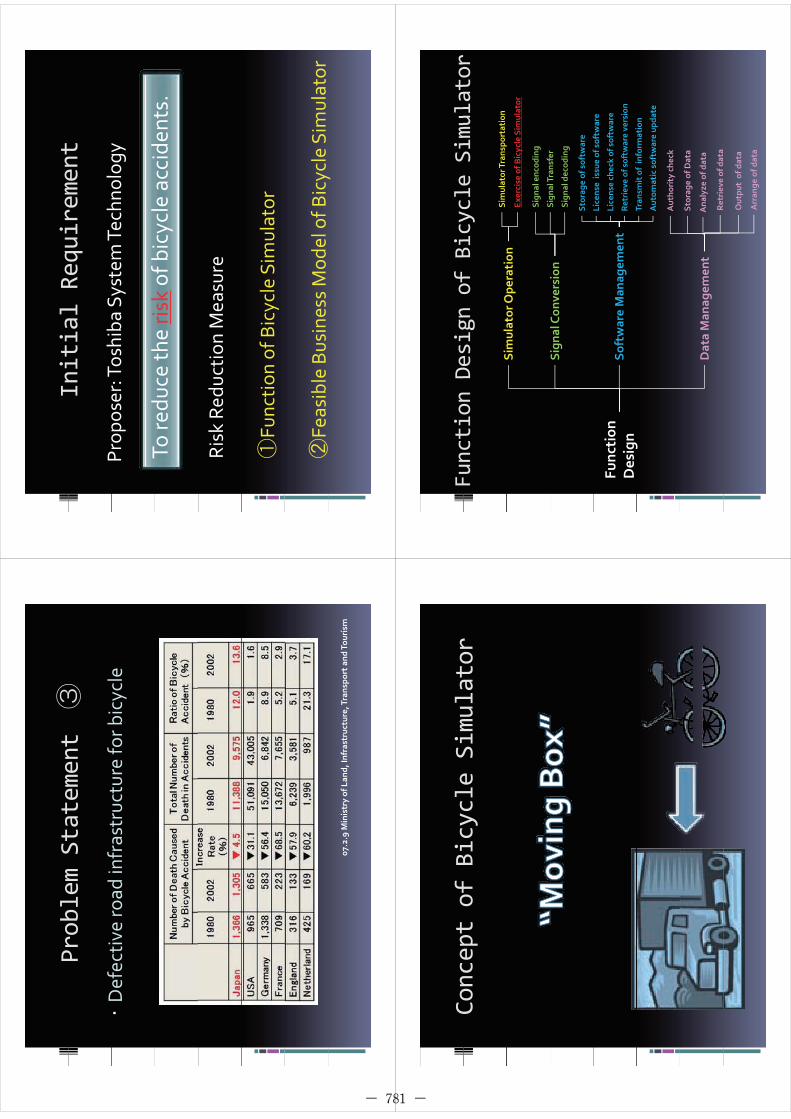
ProblemStatement
Problem�Statement
Df
tidif
tt
fbi
lDefec
tive�road
�infrastruc
ture�fo
r�bicycle�
07.2.9�M
inistry�of�Lan
d,�In
fras
truc
ture,�T
rans
port�and
�Tou
rism
InitialRequirement
Initial�Requirement�
Prop
oser
Tosh
ibaSy
stem
Tech
nology
Td
thik
fbi
lid
t
Prop
oser:�Tos
hiba
�System�Tec
hnolog
y
To�re
duce
�the�ris
kof�bicycle�acciden
ts.
Risk�Red
uctio
n�Mea
sure
Func
tion�of�Bicycle�Sim
ulator
Feasible�Business�Mod
el�of�B
icycle�Sim
ulator
y
Conceptof
BicycleSimulator
Concept�of�Bicycle�Simulator
Function
Design
ofBicycleSimulator
Function�Design�of�Bicycle�Simulator
Simulator
Ope
ration
Simulator�Trans
portation
Simulator�Ope
ration
p
Exercise
�of�B
icyc
le�Sim
ulator
Sign
al�enc
oding
Sign
alTran
sfer
Sign
al�Con
version
Sign
al�Trans
fer
Sign
al�dec
oding
Storag
e�of�softw
are
Lii
ff
Func
tion
�Des
i gn
Software�Man
agem
ent
Lice
nse��issu
e�of�softw
are
Lice
nse�ch
eck�of�softw
are
Retriev
e�of�softw
are�ve
rsion
Tit
fif
tig
Tran
smit�of��inform
ation
Autom
atic�softw
are�up
date
Autho
rity�che
ck
Data�Man
agem
ent
Storag
e�of�Data
Ana
lyze
�of�d
ata
Retriev
e�of�data
Arran
ge�of�d
ata
Outpu
t��of�data
― 781 ―

Function
ofBicycleSimulator
Function�of�Bicycle�Simulator
Dow
nloa
d�an
d�installation
�of�lates
t��so
ftware�pa
ckag
eU
dt
fft
Upd
ate�of�softw
are
Installation
ofpe
rson
albicy
cle
Acq
uisition
�of�licen
se�
Data�(training�prog
ress)��tran
sfer�to
��IT�ce
nter
Installation
�of��pe
rson
al�bicyc
leCo
nnec
tion
�with�iPad
Retriev
e�of�la
test�version
��of�s
oftw
are
Activate�simulator
Retrieve
�of�signa
l�from�iP
adSign
al��trans
fer�to�iPad
Select�io
n�of�sce
nery
Exercise
�of�B
SProjection�of�3D�im
age
Send
�requ
est�for�getting
�use
r�data�to
�IT�cen
ter
Retriev
e�of�use
r�data�from
�IT�cen
ter
Select�io
n�of�tr
aining
�cou
rse
Select�io
n�of�wea
ther
Select�io
n�of�geo
grap
hy
qg
gMon
itoring�of�Use
r
Aud
io�Outpu
t
Vibration
�outpu
t
Chec
k�of�helmet
Chec
k�of�user�p
osition
Brak
eco
ntrol
Cont
rol
Mot
ion�bu
ffer
Req
uest�of�res
ult�
Dire
ction�co
ntrol
Inclination�co
ntrol
Brak
e�co
ntrol
Retriev
e�of�softw
are�ve
rsion
Retriev
e�of�ana
lyze
d�resu
lt
Feasible
Business
Model
Feasible�Business�Model
Target
Target
Inve
stors
Inve
stors
Buye
rs�(P
refectural�and
�City
�Gov
ernm
ent)
Aim Explan
ation�of��p
rodu
ct�life�cycle
Clarifica
tion�of�cash�flo
w
Descriptio
n�of�Business�M
echa
nism
Feasible
Business
Model
Feasible�Business�Model
Review
FinalSolution
Review
–Final�Solution
Num
ber�o
f�bicyc
le�acciden
ts�per�yea
rFu
nctio
nof
bicyclesimulator
Func
tion�of�bicycle�sim
ulator
Lack
ofBicyc
leHelmet
Law
Lack
�of�B
icyc
le�Helmet�Law
Interlo
ck�helmet�system�of�b
icycle�sim
ulator
Defec
tive
�road
�infras
truc
ture�fo
r�bicyc
le�
Dt
hb
id
lbt
bil
Data�ex
chan
ge�business�mod
el�betwee
n�bicycle���
simulator�and
�research
�dev
elop
men
t�cen
ter�
― 782 ―

Commercial
Commercial
Target
Target
Stak
eholde
rswho
buythebicyclesimulator
Stak
eholde
rs�who
�buy
�the�bicycle�simulator�
End�User
Aim
Realization�of�training
�to�avo
id�acciden
tsby
bicyclesimulator
by�bicycle�sim
ulator
Campa
ignforb
icyclerid
ersto
wea
rhelmets
Campa
ign�for�b
icycle�ride
rs�to
�wea
r�helmets
You’re�hea
ring�so
�muc
h�ab
out�…
BC
lBuy�Cycle
THANKYOUFORYOUR
KIND
ATTENTION
THANK�YOU�FOR�YOUR�KIND�ATTENTION
― 783 ―