group size and the voluntary provision of public goodsecon.ucsd.edu/~jandreon/econ264/papers/isaac...
TRANSCRIPT

Journal of Public Economics 54 (1994) 1-36. North-Holland
Group size and the voluntary provision of public goods Experimental evidence utilizing large groups
R. Mark Isaac
Department of Economics, University of Arizona, McClelland Hall, Tucson, AZ 85721, USA
James M. Walker and Arlington W. Williams*
Department of Economics, Indiana University, Ballantine Hall 901, Bloomington, IN 47405, USA
Received September 1992, final version received November 1992
New experimental evidence extending the investigation of free-riding behavior in public goods provision is presented. Procedures are developed to deal with the logistical problems inherent in experiments involving many subjects. Data from Voluntary Contribution Mechanism experi- ments are reported utilizing group sizes of 4, 10, 40 and 100. These experiments provide replicable results that contradict the widely held view that a group’s ability to provide the optimal level of a pure public good is inversely related to group size. On the contrary, groups of size 40 and 100 provided the public good more efficiently than groups of size 4 and 10. Several possible alternative explanations are discussed.
1. Introduction
Over the past decade, the use of computer-based laboratory experiments to study resource allocation mechanisms for both private and public goods has proliferated. The vast majority of this research has employed the same basic procedural framework for executing experiments: a relatively small (e.g. lo- person) group of subjects arrive at the lab at the same time, participate in the experiment, are paid a performance-based cash reward at the experi-
Correspondence to: James M. Walker, Department of Economics, Indiana University, Ballantine Hall 901, Bloomington, Indiana 47405, USA.
*Research support from the National Science Foundation under grants SES-8820897 and SES-8821067 is gratefully acknowledged as is the research assistance movided bv Susan Laurv (Indiana University), Bradley Cloud, and Curtis Libor (University of Arizona). The authors thank John Ledyard and Mark Walker for their extensive comments and the numerous colleagues and students who have provided constructive criticisms of this research. The experimental data are permanently archived on the NovaNET computer system. Contact the authors for information on accessing the data archive via microcomputer dial-up.
0047-2727/94/$07.00 0 1994 Elsevier Science B.V. All rights reserved
SSDI 0047-2727(93)01370-P

2 R.M. Isaac et al., Group size and the voluntary provision of public goods
ment’s conclusion, and leave. This standard framework presents two distinct problems when one wishes to focus on ‘large’ (e.g. IOO-person) decision- making groups: physical constraints rooted in the size of the lab and number of computer workstations available, and financial constraints rooted in the magnitude of the subject payments necessary to motivate a large group of participants. It is thus quite understandable that small-group experiments predominate and, in the absence of evidence to the contrary, are implicitly assumed to characterize behavior in similar, large-group decision-making environments. The validity of this assumption is critical if ‘parallelism’ between the laboratory and a naturally occurring environment (with many decision-making agents) is essential to the relevance of the research. This is presumably the case in experimental research focusing on public policy issues.
The research reported here has two primary objectives. The first objective is to explore the extent to which results from previous small-group experi- ments on the voluntary provision of a pure public good survive in a large- group setting. The second objective is methodological - to document and discuss the general procedural framework used to overcome the problems associated with conducting large-group experiments mentioned above. We compare the use of cash vs. extra-credit point incentive structures, and experiments lasting about an hour vs. experiments lasting several weeks.
Our interest in the first objective is motivated in part by the common premise in economics and other social sciences that the suboptimality of the provision of a public good will increase with increases in group size. The logic and empirical evidence which might support this premise is not always clearly specified. Evidence from field studies is flawed by a lack of control over critical environmental parameters and the inability to observe prefer- ences and hence to measure the degree of suboptimality. Evidence from laboratory studies is based primarily on data from literally thousands of two- person games and a smaller set of N-person games with group sizes that have rarely exceeded 10. These are very small decision-making groups in comparison with the group sizes one might expect to find in many field environments. Thus, the common premise that free riding becomes more severe as group size increases, ceteris paribus, does not appear to be based on an extensive empirical foundation.
Building on research presented by Isaac and Walker (1988), this paper presents new evidence regarding the existence of a pure group size effect in the provision of pure public good. Our experiments utilize group sizes ranging from 4 to 100 and provide replicable results that contradict the widely held view that a group’s ability to provide the optimal level of a pure public good is necessarily inversely related to group size. The next section summarizes the components of the voluntary contribution mechanism and briefly reviews the experimental literature on public goods provision utilizing

R.M. Isaac et al., Group size and the voluntary provision of public goods 3
this institution. Section 3 describes the experimental environment and procedural framework developed for our new experiments. Section 4 reports our initial experimental results. Section 5 presents possible explanations for the inconsistency between these results and the predictions of the standard complete information Nash equilibrium model. Section 6 reports the results from additional experiments designed to provide further insight into the observed discrepancies between the standard Nash model and our results. Finally, section 7 summarizes our experimental results.
2. The voluntary contribution mechanism
The essence of the voluntary contribution mechanism (VCM) is that each individual in a group must decide how to allocate an endowment of a productive factor between a private good (where consumption benefits accrue only to the individual) and a group good (where consumption benefits accrue to all group members).
2.1. Experimental implementation
The laboratory version of VCM utilized in the experiments presented here was implemented in a sequence of ten decision-making rounds. At the start of each round, individual i was endowed with Zi tokens which had to be divided between a ‘private account’ and a ‘group account’. Tokens could not be carried across rounds. Each token placed in the private account earned pi cents with certainty.’ For a given round, let m, represent individual i’s allocation of tokens to the group account and xrnj represent the sum of tokens placed in the group account by all other individuals (j # i). Each individual earned [G(mi + c mj)]/iv cents from the group account. Because each individual received a l/N share of the total earnings from the group account, the group account was a pure public good. The specification of the group account payoff function is one of many that could be utilized to create a laboratory public good. Thus, a representative individual’s utility function in any one period can be written as Ui[pi(Zi-m,) +(G(mi+~mi)/N)]. The marginal per capita return from the group account (MPCR) is defined as the ratio of benefits to costs for moving a single token from the individual to the group account, or [G’( .)/N]/pi. In the experiments reported here, pi and the functions G( .) were chosen so that the Pareto optimum (defined simply as the outcome that maximizes group earnings) was for each individual to place all tokens in the group account (i.e. to set mi=Zi). The single-period
‘In the experiments reported here p,=$O.Ol for all i. This need not be the case. Fisher et al. (1988) report experiments in which the pi’s vary from person to person.

4 R.M. Isaac et al., Group size and the voluntary provision of public goods
dominant strategy for each individual i, however, was for each subject to place zero tokens in the group account because pi and G( .) were chosen so that the MPCR -c 1. Given the finite number of decision rounds, the outcome mi=O, Vi, is also the unique, backward unravelling, complete information, multi-period Nash equilibrium. This will be referred to as a complete free- riding outcome.
Each individual’s information set included: the number of rounds, Zi (i’s own token endowment for each round), CZ, (the groups’ aggregate token endowment for each round), pi (earnings per token from i’s private account), N (group size), and G( .)/N (per capita earnings function for the group account presented in tabular form).’ It was explained that the decisions for each round were binding and that end-of-experiment rewards would be based on the sum of earnings from all rounds. Prior to the start of each round, participants were shown information on their own earnings for the previous round as well as the total number of tokens placed by the entire group in the group account. During each round, subjects could view their personal token allocations, earnings, and total tokens placed in the group account for all previous rounds.
2.2. Previous experimental results
A large body of experimental research addresses the empirical validity of the free-rider hypothesis utilizing various implementations of the voluntary contributions mechanism. See, for example, Marwell and Ames (1979, 1980, 1981), Kim and Walker (1984), Isaac, Walker and Thomas (1984); Isaac, McCue and Plott (1985); Isaac and Walker (1988); Andreoni (1989), Brookshire et al. (1989) and Dorsey (1992). This work demonstrates two points: (1) the early findings of Marwell and Ames, who report substantial levels of contributions to the public good, are replicable under certain experimental conditions, and (2) very different (replicable) results showing far more free riding can be found under alternative parametric and institutional conditions.
The results presented by Isaac and Walker (1988), hereafter IW, are of particular relevance to the research presented here. IW investigate different concepts of group size in the context of the standard conjecture that larger groups have a more difficult task in providing public goods. A natural question is: Why should free riding increase in severity as the group size is increased? A logical response is that as the size of the group increases, the
‘Note that we do not explicitly announce other subjects’ pi values nor the distribution of tokens. Isaac and Walker (1989) report no obvious difference in behavior in similar experiments where this information was common knowledge.

R.M. Isaac et al., Group size and the voluntary provision of public goods 5
marginal return from the group good declines (due to crowding). Alternati- vely, public goods provided in large group settings may be characterized naturally by ‘small’ marginal returns. These are both explanations that depend on a smaller marginal benefit from the public good with increases in group size. Is there, however, a ‘pure numbers’ effect that influences the efficiency of public goods provision ? In a framework where G( .) increases linearly (as in IW and here), a pure numbers effect can be examined by varying G’( .) so that the MPCR remains constant as N increases. Alternati- vely, group size effects based on crowding or an inherently small MPCR can be examined by allowing the MPCR to vary with group size.
IW examined the separate and combined influences of a pure numbers effect and variations in the MPCR in groups of size 4 and 10. Their primary conclusion was that a higher MPCR leads to less free riding and thus greater efficiency in the provision of the public good. IW found no statistical support for a pure numbers effect. In fact, to the extent that there was any qualitative difference in the data, it was in the direction of the groups of size 10 providing larger levels of the public good than the groups of size 4. IW did find support for a crowding effect; larger groups exhibited more free riding if increases in group size generated a smaller MPCR.
One critique of Iw’s results is that a lo-person group is not large enough to be behaviorally distinct from a 4-person group. According to this very informal argument, a much larger group, of say 100, would be required to capture any behavioral properties inherent in very large groups. Unfortuna- tely, the effective size of laboratory experiments has been limited by both the expense of subject payments and by the capacity constraints of existing laboratories. The initial phase of the research reported here focused on the development of experimental procedures designed to facilitate large group experiments. These procedures are implemented utilizing new software on the NovaNET computer system. This paper reports results from groups of size 4, 10, 40, and 100. We believe that the loo-person groups are the largest salient reward, public goods experiments conducted to date.
3. Experimental procedures and parameters
Most of the experiments presented here employ two important procedural modifications relative to the earlier IW research: (1) decision-making rounds last several days rather than a few minutes, and (2) rewards are based on extra-credit points rather than cash. We refer to experiments composed of rounds lasting several days as ‘multiple session’ (MS) experiments. This contrasts with the ‘single session’ (SS) experiments of IW, typical of laboratory experiments in economics where all decision rounds occur in
sequence over a relatively brief time span, usually an hour or two.

6 R.M. Isaac et al., Group size and the voluntary provision ofpuhlic goods
Experimenter initializes design cells
Information sheet distributed on timing of rounds
I ,rSubject6g<&6Toiputer and accesses VCM software I
L~__~______;________ _,J Has sub‘ect entered decision for current round?
NO, ’ --YES
fl~t%<~ry (Round I)? J Reject subject entry - - ----iP--- L_________
rGndoil;assign to design cell ] _______~,_~~~~~_
Randomly assign to subject type I
_~--~--- ~---- ~~~~ I Allocation decision for tokens ! 1 1 entered for current round
Subject logs off and leaves lab. ( Subsequent rounds are at a time 1
interval specified on the I information sheet.
Fig. 1. Flow of multiple-session experiments
3.1. Framework for computerized multiple-session experiments
Fig. 1 shows a flowchart of the steps which comprise our multiple-session VCM experiments using a salient reward structure based on extra-credit points (VCM-MS-XC).3 Subjects participating in VCM-MS-XC experiments were volunteers from undergraduate microeconomic theory classes at Indiana University and the University of Arizona. All students attending these classes received a handout (see appendix A) explaining the rules for participation. In summary, the handout informed students: (1) of the basic nature of the group decision-making exercise, (2) that participation is voluntary and will result in their earning extra-credit points rather than cash, (3) of the specific formula used to convert the cash earnings reported to them by the computer into extra-credit points, (4) of the days associated with each of the ten decision rounds, and (5) of the specific procedures for accessing the experiment on
3An alternative multiple-session procedure was used in the public goods experiments of Kim and Walker (1984). Other examples of multiple-session procedures exist in the social science literature. Such experiments are rare, however, relative to single-session experiments.

R.M. Isaac et al., Group size and the voluntary provision of public goods
NovaNET. The following specific points describe the multiple-session procedure.
(1) The NovaNET VCM software handles many decision-making groups running simultaneously. Before beginning the experiment, the experimenter initializes a set of parameters for each decision-making group (called a design cell). For example, a class of size 350 might have one group of 100, three groups of 40, and several groups of 10 and 4 running simultaneously.
(2) Upon logging onto the computer for the first time, subjects are assigned to a design cell via a quasi-random rotation procedure unknown to the subjects. This reduces the probability that several acquaintances who access round 1 at the same time will be assigned to the same group. As part of the initialization process, the experimenter designates each design cell as either ‘primary’ or ‘secondary’. All primary design cells are filled before remaining subjects are assigned to secondary cells. Inevitably, some students fail to meet the deadline for entering their round 1 decision and are thus excluded from further participation.
(3) After logging in for the first time, subjects work through a set of instructions at their own pace and then enter their allocation decision for round 1 of the experiment.4 After entering their decision, subjects log off the computer and leave the lab.
(4) Subjects are allowed to proceed to the next round only after the experimenter advances the ‘current round’ parameter to allow for the continuation of the experiment. Upon logging on for subsequent rounds, subjects are shown the results of the previous round and then routed directly to the decision entry display for the current round. At this point, subjects have the option to review the instructions and to view the results from all prior rounds. It is important to note that subjects are not shown preliminary information on the aggregate tokens allocated to the group account for the current round. Information on aggregate token allocations is disseminated only for completed rounds.
(5) We cannot guarantee that all subjects will make an allocation decision in each round (a similar problem exists in many field experiments). For this reason, the software allows the experimenter to specify a default allocation decision for each subject. This procedure for handling defaults is explicitly explained to subjects in the instructions. An obvious setting for the default decision is to place zero tokens in the group account since lack of participation can be interpreted as a decision to free ride. There are certainly other reasonable default specifications - the method for handling default decisions is an interesting research question which can potentially influence aggregate outcomes in multiple-session experiments. For all VCM-MS-XC
41nstructions are available upon request from the authors.

8 R.M. Isaac et al., Group size and the voluntary provision of public goods
experiments reported here, the default decision for each subject was for all tokens to be invested in the individual account (private good). Thus, this specific VCM-MS-XC implementation contains an additional element which lowers the cost of free-riding behavior.
The experimental procedures outlined above represent a logical link between standard single-session laboratory experiments and actual field experiments. Certainly some experimental control is lost relative to a strictly controlled laboratory setting; however, the gain in feasible group sizes, the real time between allocation decisions, and the more ‘natural’ communication opportunities available in this environment add an element of parallelism with non-experimental settings that could have important methodological and behavioral ramifications.
3.2. Extra-credit performance index
As explained in the class handout, subject i’s experimental dollar earnings were converted into the following ‘performance index’ prior to being converted into extra-credit points:
i’s actual earnings-i’s minimum possible earnings
i’s maximum possible earnings -i’s minimum possible earnings
which can range from 0 to 1 for each individual. At the end of the final round, this fraction was computed for each individual (based on earnings in all rounds), multiplied by 3, and added to the subject’s final grade average. Thus, the range of possible extra-credit points was [0,3]. The performance index was used so that the maximum and minimum possible extra-credit earnings did not depend upon the design cell assignment. All classes from which subjects were drawn utilized a loo-point scale and, with minor modifications, used a standard mapping of point totals into letter grades (A =90’s, B= 80’s, etc.). Furthermore, Indiana University (where 64 of 74 of the extra-credit experiments were conducted) allows + and - letter grades, so a unique letter grade typically comprised a 3 to 4 point interval.
We have spent a great deal of time considering questions of practicability and fairness in the use of extra-credit points as a motivator. It is important to realize that our extra-credit experiments always have a clear pedagogical objective and become an integral part of our in-class discussions of private vs. external benefits, public goods provision, and free riding. Our research procedures were thoroughly reviewed and approved by the Indiana Univer- sity Committee for the Protection of Human Subjects. On the issue of fairness, we can report that, of the thousands of students who have participated in VCM-MS-XC experiments, there have been no grade appeals in which these extra-credit points were an issue. In fact, feedback from

R.M. Isaac et al., Group size and the voluntary provision of public goods 9
Table 1
Listing of experiments by initializations.
Procedure used for sequencing ~ motivation Group size MPCR
Number of experiments
MS-XC 4 0.75 10 MS-XC 4 0.30 17 MS-XC 10 0.75 10 MS-XC 10 0.30 16 MS-XC 40 0.75 6 MS-XC 40 0.30 6 MS-XC 40 0.03 6 MS-XC 100 0.75 3 MS-XC 100 0.30 3 ss-$ 40 0.30 3 ss-$ 40 0.03 1 ss-5 10 0.30 6
students (and from other faculty who have adopted similar experiments for purely pedagogical purposes) has been quite positive.’
3.3. Experimental parameters
The data reported here are based on 87 new experiments involving 1,908 subjects.6 Of these experiments, 77 were multiple-session, extra-credit reward experiments (VCM-MS-XC) and 10 were single-session, cash reward experiments (VCM-SS-$). Table 1 categorizes the new experiments according to 12 unique initializations utilized in this research. The first three columns in table 1 correspond to specific components of an initialization: the sequencing-reward procedure (MS-XC or SS-$), group size (N), and marginal per capita return (MPCR) from a token allocated to the group account. The fourth column lists the total number of experiments conducted under each
‘In terms of formal, anonymous feedback, students in Williams’ Fall 1989 mtroductory and Intermediate Microeconomic Theory classes were given an end-of-semester course evaluation that included an item stating that the experiment ‘was an interesting and constructive supplement to this course’. The average responses were 2.89 and 2.87; where ‘strongly agree’=4, ‘agree’ = 3, ‘neither agree nor disagree’ = 2, ‘disagree’ = 1, and ‘stongly disagree’ = 0. In addition, there were no written comments complaining that the method of awarding extra-credit points was in any way unfair.
%ubjects were enrolled in introductory and intermediate microeconomic theory classes ranging in size form about 40 to over 350. On average, 87% of the students enrolled chose to participate in the VCM extra-credit exercise. The subjects’ major area of study varied widely - the majority were not economics majors. Indiana subjects accessed the experiment through a public microcomputer facility while Arizona subjects accessed the experiment through the Economic Science Laboratory computer room. See appendix A for details on the procedure subjects used to access NovaNET and the VCM software. With very few exceptions, subjects were able to access the experiment on their first try without problems.

IO R.M. Isaac et al., Group size and the voluntary provision of public goods
initialization. In addition, two initialization parameters were held constant across all experiments and are thus not listed in table 1: pi (i’s return per token from the private account) is $0.01 and Zi (i’s token endowment in each round) is 50.
4. Initial experimental results
The presentation of the results from our initial experiments will be organized around three subsections: subsection 4.1, a baseline comparison of VCM-MS-XC small-group (N =4, N = 10) experiments with the VCM-SS-$ experiments reported by IW; subsection 4.2, a presentation of large group (N =40, N = 100) experiments using both extra-credit and cash incentives; and subsection 4.3, an overview of variations in individual behavior.
The baseline experiments reported in subsection 4.1 were critical for extablishing that the basic IW small-group results were replicable in the VCM-MS-XC experimental environment. Having confirmed that small-group behavior in VCM-MS-XC is qualitatively similar to the behvior reported by IW, subsection 4.2 examines large-group behavior. These results are particu- larly interesting in that: (1) they suggest that large groups may be more efficient at providing public goods than small groups (holding MPCR constant), and (2) the positive correlation between MPCR and efficiency observed in small groups appears to vanish in large groups (for the {0.30,0.75] MPCR domain previously studied). This correlation is shown, however, to reappear in groups of size 40 with an MPCR of 0.03. Subsection 4.3 documents the tremendous diversity in individual subject behavior, giving the reader a more thorough perspective on the aggregate results presented in
previous subsections.
4.1. Small-group baseline comparison
The results presented in this subsection are from 53 VCM-MS-XC experiments conducted with small groups (NE (4,lO)). Figs. 2 and 3 present a time-series comparison of the IW and the VCM-MS-XC aggregate data. The extent to which the VCM-MS-XC experiments reproduce the results of IW is striking.
Observation 1. For a specific group size and MPCR, the aggregate pattern of token allocations in the VCM-MS-XC environment and the VCM-SS-S environment studied by IW are very similar.
This observation is supported by two sample t-tests on data for each decision round. Of the 40 t-values (4 design cells x 10 rounds), a significant

R.M. Isaac et al., Group size and the voluntary provision of public goods 11
GROUP SIZE n 4 AND MPCR n .3O
+TOKENSTOGROUP ACCOUNT IOO-
90 -
SO -
70 -
80 -
SO -
0’1 I I / / I : / / / I 2 3 4 5 6 7 S 9 10
ROUND
- MS-XC: 17 EXPS - SS-S-IW: 9 EXPS I
GROUP SIZE -10 AND MPCR n .30
XTOKENSTOGROUPACCOUNT 100
- MS-XC: 16 EXPS + ss-$-IW: 3 EXPS
Fig. 2. Comparison of new (MS-XC) data with Isaac-Walker (SS-$) data: MPCR=0.30.
GROUP SIZE n 4 AND MPCR = .75
+TOKENSTO QROUP ACCOUNT loo-
90 -
SO -
70 -
1 2 3 4 5 6 7 8 9 10
ROUND
- MS-XC: 10 EXPS - SS-S-IW: 3 EXPS
GROUP SIZE = 10 AND MPCR 9 .75
4;TOKENSTOGROUPACCOUNT 100
90
80 :
01
1 2 3 4 6 6 7 5 9 10
ROUND
- MS-XC: 10 EXPS - SS-S-IW: 3 EXPS
Fig. 3. Comparison of new (MS-XC) data with Isaac-Walker (SS-$) data: MPCR = 0.75.

12 R.M. Isaac et al., Group size and the voluntary provision of public goods
QocH)C SIZE. 40 AND WCR . .30
% TOKENS TO QROUP ACCOUNT 100 r
MOW #ZE - 40 AND YCCR . .I&
,90 ,!A TOKENS TO QROUC ACCOUNT
0” t I I I ’ 1 2 3 4 5 9 7 9 8 10 1 2 3 4 5 6 7 9 9 10
ROUND ROUND
Fig. 4. 90% confidence bands: group size=40.
difference in the percentage of tokens allocated to the group account is observed in only one round. Analysis of the VCM-MS-XC data using both OLS and Tobit estimation techniques lend additional support to Obser- vation 1 by reconfirming the positive correlation between MPCR levels and efficiency reported by IW.
The results of this baseline comparison are important for two reasons. First, they demonstrate that the IW results are robust to changes in experimental procedures and the reward medium. Second, the VCM-MS-XC environment does not exhibit any obvious behavioral anomalies which would preclude its use as a procedure for exploring the large-group properties of VCM.
4.2. Large-group experiments
This subsection begins by focusing on the large-group experiments using extra-credit incentives. The time-series data for groups of size 40 and 100 are shown in figs. 4 and 5. These figures present 90% confidence bands for the mean allocation to the group account for the experiments within each of the four group size and MPCR combinations. The data summarized in these figures support the following observation.
Observation 2. For groups of size 40 and 100, with MPCR = 0.30 or 0.75, a

R.M. lsaac et al., Group size and the provision of goods 13
UOUP UZE . iw AND WCR * .30 WOW UZE l 100 AND MPCW.75
,oo X TOKENS TO QROUP ACCOUNT 100
XTOKENSTOGROUPACCOUNl
90 - 90 -
60 - 60.
70 - 70.
60 60 - T
60 - so - T
40 - 40 - /\/\_, .
30 30. ~
20
t t
L
20
10
t
10
t
OLI I I L I 4 I I 0” I I I ’ ’ I L I I 2 3 4 6 6 7 6 9 10 1 2 3 4 6 6 7 6 9 10
ROUND ROUND
Fig. 5. 90% confidence bands: group size = 100.
positive correlation between the percentage of tokens allocated to the group account and MPCR does not exist.
OLS and Tobit regressions of MPCR dummy variables on the percentage of tokens allocated to the group account support this observation. This is in stark contrast to groups of size 4 and 10, where a positive MPCR effect is consistently present over the range 0.30.75. The next subsection focuses in more depth on why the MPCR effect appears to vanish in large groups for the {0.30,0.75} MPCR domain.
Fig. 6 presents the sequence of mean percentage of tokens allocated to the group account for each of the VCM-MS-XC initializations using a 0.30 or 0.75 MPCR. The data summarized in this figure lead us to the following two observations.
Observation 3. For the case of MPCR=0.30, groups of size 40 and 100 allocate more tokens to the group account on average than do groups of size 4 and 10.
Observation 4. For the case of MPCR=0.75, there is no discernible difference in allocations to the group account on average across group sizes.
These results (supported by OLS and Tobit regressions) are particularly

14 R.M. Isaac et al., Group size and the voluntary provision of public goods
100
MPCR = .30
% TOKENS TO GROUP ACCOUNT
MPCR n .75
KTOKENSTOGROUPACCOllNT 1OOr
90
60
90
60 t
70
60
70
60 t
60
0’1 / I I1 ~ I I / / 1 2 3 4 6 6 7 6 9 10 1 2 3 4 6 6 7 6 9 10
ROUND ROUND
Fig. 6. Group size comparison for high (0.75) and low (0.30) MPCR cells.
striking, since they do not support the existence of the traditionally assumed pure group size effect. In fact, the MPCR =0.30 data supporting Observation 3 exhibit an increase in efficiency when moving -from smaller groups to larger
groups. The possibility that large-group behaviour is an artifact of the VCM-MS-
XC procedures seems unlikely given the data from the smaller groups, but nonetheless required some empirical confirmation. Reported next are the results of three 40-person VCM-SS-$ (single-session, cash reward) experi- ments using MPCR =0.30. As discussed previously, in single-session experi- ments the ten decision-making rounds occur during a single experimental session lasting one to two hours. Given the limited seating capacity of our laboratories, these 40-person experiments had to be conducted ‘multi-site’ with subjects participating simultaneously at Indiana University and the University of Arizona through NovaNET. These cash payment experiments were quite expensive. In spite of the fact that we utilized an ‘experiment dollar’ to U.S. dollar exchange rate of i, each experiment cost over $900.7
Fig. 7 compares allocations to the group account for these three N=40, MPCR =0.30, VCM-SS-$ experiments (SSl, SS2, SS3x) with the means of the six corresponding VCM-MS-XC experiments. SSl and SS2 used subjects
‘Subjects earned, on average, about $20 in the experiment plus $3 for keeping their appointment to participate.

R.M. Isaac et al., Group size and the voluntary provision of public goods 15
100 r % TOKENS TO GROUP ACCOUNT
80
30
20
10
I o’i~f-+-+-+-+-+~-t--_-l
1 2 3 4 5 6 7 8 9 10
ROUND
--m SS-$-EXPSSl
++ SS-$-EXP.SS3x
+- SS-$-EXP.SSP
-B MS-XC-POOLED
Fig. 7. Cash (SS-$) vs. extra-credit (MS-XC) rewards: Group size=40, MPCR=0.30.
who had not previously participated in a VCM experiment, while SS3x used experienced subjects randomly drawn from SSl and SS2. The high percent- age of tokens allocated to the group account clearly is not an artifact of the VCM-MS-XC procedures. In fact, for these few experiments using cash rewards, the percentage of tokens allocated to the group account is higher than in the experiments using extra-credit rewards.
4.3. Diversity in individual behavior
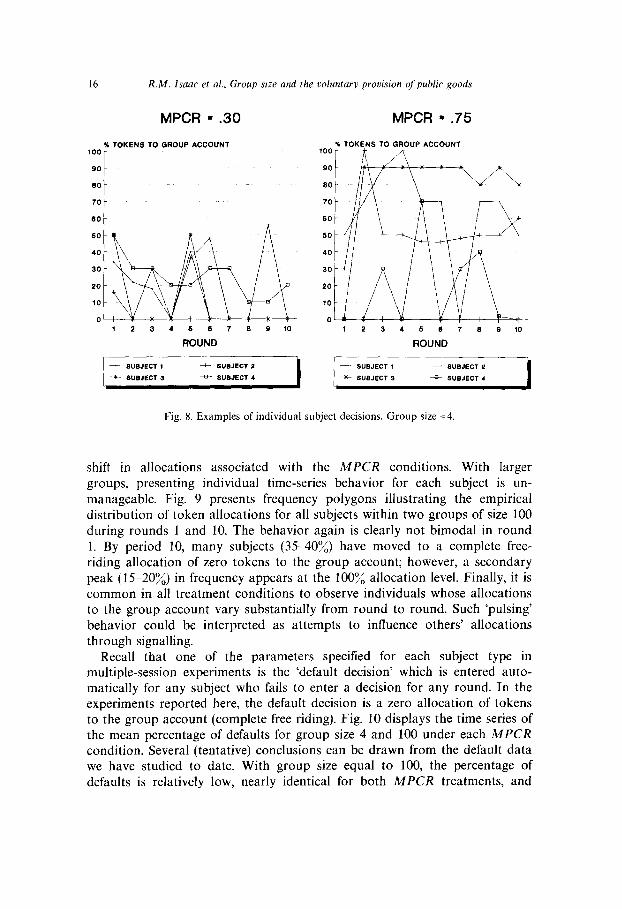
Figs. 8 and 9 document several features of individual subject behavior typical of many of our VCM experiments. Fig. 8 reports the time-series behavior for each subject in two 4-person VCM-MS-XC experiments. These data are typical of small-group VCM behavior in that: (1) they show a pattern of token allocations which is not bimodal between the two extremes of 0% and lOOo/0 of tokens placed in the group account; and (2) there is a
16 R.M. Isaac et al., Group size and the voluntary provision of public goods
MPCR n .30 MPCR = .75
YTOKENSTOGAOUPACCOUNT XTOKENSTO GROUP ACCOUNT 100 too
SO 90
SO SO
70 70
60 60
60 so
40 40
30 30
20 20
10 10
0 0 1 2 3 4 6 6 7 S 9 10 1 2 3 4 6 6 7 S 9 10
ROUND ROUND
- WWECT 1 + WBJECT? - SUBJECT 1 + 8”BJECT 1
+ SUBJECT 3 + OVBJECT 1 -r s”B.lECT 3 - SVBJECT 4
Fig. 8. Examples of individual subject decisions. Group size = 4.
shift in allocations associated with the MPCR conditions. With larger groups, presenting individual time-series behavior for each subject is un- manageable. Fig. 9 presents frequency polygons illustrating the empirical distribution of token allocations for all subjects within two groups of size 100 during rounds 1 and 10. The behavior again is clearly not bimodal in round 1. By period 10, many subjects (3540%) have moved to a complete free- riding allocation of zero tokens to the group account; however, a secondary peak (15-20x) in frequency appears at the 100% allocation level. Finally, it is common in all treatment conditions to observe individuals whose allocations to the group account vary substantially from round to round. Such ‘pulsing’ behavior could be interpreted as attempts to influence others’ allocations through signalling.
Recall that one of the parameters specified for each subject type in multiple-session experiments is the ‘default decision’ which is entered auto- matically for any subject who fails to enter a decision for any round. In the experiments reported here, the default decision is a zero allocation of tokens to the group account (complete free riding). Fig. 10 displays the time series of the mean percentage of defaults for group size 4 and 100 under each MPCR condition. Several (tentative) conclusions can be drawn from the default data we have studied to date. With group size equal to 100, the percentage of defaults is relatively low, nearly identical for both MPCR treatments, and

R.M. lsaac et al., Group size and the voluntary provision of public goods 17
Round 1: MPCFb.30 Round 1: MPCRg.75
,,% FREQUENCY
r
5. % FREQUENCY
1 46
40
36 -
30 -
25 -
20 -
16
10
6
0
-0 10 20 30 40 60 60 70 60 90 100 -0 10 20 30 40 60 60 70 60 90 100
%TOKENSTOGROUP ACCOUNT %TOKENSTOGROUP ACCOUNT
Round 10: MPCD.30 Round 10: MPCR=.75
6. % FREQUENCY
46 -
40 - A 39% complete free riding
36
30
26
20
16
10
46
40
I
36
t
301
26
16 t
6
% FREQUENCY 60
46
e 37% complete free riding 36
30
26
20
16
I A 10
0 10 20 30 40 60 60 70 80 90 100 0 10 20 30 40 60 60 70 60 30 100
%TOKENSTOGROUPACCOUNT %TOKENS TO GROUP ACCOUNT
Fig. 9. Frequency polygons of tokens allocated to group account: group size= 100.

18 R.M. Isaac et al., Group size and the voluntary provision of public goods
% DEFAULTS 1001
90 /
80
70 :
60 -
1 2 3 4 5 6 7 8 9 10
ROUND
- N=lOO; MPCR=.30 + N=lOO; MPCR=.75
+ N.4; MPCR=.30 + N94; MPCR=.75 I
Fig. 10. Mean percentage of default decisions: Group size=4 and 100.
quite stable over rounds 6 through 10 (35-4579. In conjunction with this default rate, recall that allocations to the group account were in the 30-40% range for these groups. In contrast, with groups of size 4 there are distinctly higher defaults in the low-MPCR treatment relative to the high-MPCR treatment. In low-MPCR groups, the default rate averages as high as 60% in the later rounds, whereas high-MPCR groups reach a maximum default rate of approximately 40% in round 10. These default rates are consistent with the result that lower MPCR tends to correspond to lower token allocations to the group account for ‘small’ groups. Finally, note that we do observe subjects actually entering (non-default) decisions of zero tokens allocated to the group account.
5. Factors that shape behavior: If not Nash, then what?
The results presented above are generally inconsistent with the complete

R.M. lsauc et al., Group size and the voluntary provision of public goods 19
information Nash equilibrium (NE) prediction, In the final decision round, it is a dominant strategy for an individual to allocate all tokens to the private account. In prior periods, the unique complete information multi-period NE is also complete free riding. Over the range of parameter variations investigated here, neither changes in group size nor changes in MPCR alter these predictions. The NE model correctly predicts the observed failure of our groups to achieve the Pareto optimum. Furthermore, in some treatments, decisions show a marked tendency to decay toward the NE prediction. Even in the final periods, however, there is a notable allocation of tokens to the group account in most experiments. Given the inconsistency between observed behavior and the complete information NE prediction, it is natural to examine what assumptions of the standard model may not be met in the experiments or whether alternative modelling approaches might help explain the observed behavior. Subsection 5.1 focuses on several standard assump- tions which may break down in the VCM experimental environment. In subsection 5.2, several non-standard modelling approaches are discussed.
5.1. Potential breakdown of standard Nash assumptions
5.1 .I. Incomplete information
The NE model assumes complete information, but in fact two pieces of information were not provided to participants in our experiments: others’ token endowments and others’ per-token return from the private account. Because the return from the private account is necessary to compute the opportunity cost of token allocations to the group account, one might conjecture that an incomplete information process along the lines of that described by Kreps et al. (1982) (for the finitely repeated Prisoner’s Dilemma) is responsible for the pattern of the data. There are, however, some problems in ascribing these results entirely to the domain of incomplete information. The structure of our experiments, although similar to a two- person Prisoner’s Dilemma, is not identical. In addition, Isaac and Walker (1989) using a four-person, MPCR=0.3 design identical to that of VCM- SS-$ reported here, found no difference in results when it was publicly announced that token endowments and returns from the private account were identical across all individuals. However, it may be that the incomplete information occurs at a deeper level than simply the structure of the payoffs. For example, there may be uncertainty as to the rationality of other players.
5. I .2. Learning Using a standard model as the basis for evaluating our data leaves open
the question of how quickly individuals are expected to behave in accordance with the NE model. One interpretation of the typical decay process observed in VCM is that of a ‘learning’ phenomenon [see, for example, Andreoni

20 K.M. Isaac et al., Group size and the voluntary provision of public goods
(1988)]. Even in dominant strategy decision environments, evidence exists that some individuals must learn the strategic nature of the optimization problem.’ Furthermore, in non-dominant strategy settings, individuals may have to learn to make decisions that are consistent in the sense of a Nash equilibrium. Recently, there has been a growing literature on formal models of how individuals ‘learn’ to play Nash equilibria [see Fudenberg and Kreps (1988), Moreno and Walker (1993), and Milgrom and Roberts (1991)]. Whether these models can be adapted to have implications for the VCM environment is an open question for further research.’
5.1.3. Failure of backward induction The essence of the standard NE model is that individuals choose their
actions non-cooperatively. In certain classes of infinitely repeated games, however, seemingly cooperative outcomes can be supported by non- cooperative strategies which specifically incorporate the multi-period nature of the game. Such outcomes are theoretically ruled out here by backward induction from the known end-point. Failure of some individuals to behave in a manner consistent with the logic of backward induction is one possible explanation for deviations from complete free riding.
5.1.4. Incorrectly represented preferences In our experiments, the theoretical prediction of complete free riding is
based on the assumption that each individual is maximizing a utility function which is monotonically increasing in experiment earnings. The standard model further assumes that one’s own earnings are the sole determinant of utility. This may not be a correct representation of actual preferences in the stage game. This observation is not new to this paper. For example, Palfrey and Rosenthal (1988) model ‘uncontrolled preferences’ which derive from ‘acts of social cooperation or contribution, the utility of altruism, or social duty’. Likewise, Andreoni (1989) develops the notion of a ‘warm glow’ from contributions to collective goods. In addition to warm glow effects, ‘fairness’ considerations [Kahneman et al. (1986a, b)] may play a role in the formation of individual decisions.
The ‘incomplete information’ and ‘learning’ explanations for the inconsis- tency between our results and the complete information NE prediction can be further addressed with additional experiments. Section 6 reports the results of several new cash payment experiments utilizing a large number of
‘For example, there is an abundance of evidence that many subjects do not immediately follow the dominant strategy of bidding full value in the second-price sealed-bid auction. See, for example, Cox et al. (1985) or Kagel and Levitt (1993).
9Most of this literature, in contrast to the designs reported here, focuses on non-dominant strategy NE in the stage games.
R.M. Isaac et al., Group size and the voluntary provision of public goods 21
decision rounds and enhanced strategic information. The ‘failure of backward induction’ and ‘incorrectly represented preferences’ explanations require a fundamental change in the approach to modelling behavior in the VCM environment.
5.2. Alternative modelling approaches
The inconsistency between observed behavior in the VCM environment and the complete information NE prediction has led to the development of several alternatives to the standard Nash model. This subsection briefly summarizes two approaches by Ledyard (1993) and Miller and Andreoni (1991). This is followed by the development of a simple binary choice modelling approach designed to highlight the potential gains from cooperation, and a more complex non-binary approach based on forward-looking behavior.
Ledyard (1993) has proposed an equilibrium model in which individuals ‘get some satisfaction (a warm glow) from participating in a group that implicitly and successfully cooperates’. [In modelling a ‘warm glow’, Ledyard’s assumption is related to the work of Andreoni (1989).] Individuals are distinguished by types, based upon the strength of their ‘warm glow’ preferences. Under certain assumptions on the population distribution of preferences, Ledyard finds that (1) there can be deviations from complete free riding even in a single-shot game, and (2) individuals will be more likely to deviate from complete free riding in large groups.
Miller and Andreoni (1991) present an interesting non-standard model based on the adaptive behavior of replicator dynamics. Their approach is consistent with our finding that the percentage of tokens allocated to the group account appears to be directly related to both group size and MPCR. The replicator dynamic approach also predicts continuous decay toward complete free riding and, ceteris paribus, identical time paths for designs in which (N . MPCR) is constant (e.g. N =4, MPCR =0.75 and N = 10, MPCR=0.30). While the Miller-Andreoni model does capture some of the characteristics of our aggregate VCM data, neither of the two predictions mentioned above is entirely consistent with our data.
Below, two alternative non-standard VCM modelling approaches are presented: a simple all-or-nothing (binary) symmetric choice approach, and a more complex (non-binary) asymmetric choice approach. The intent of the first approach is simply to focus on how changes in group size and MPCR
change the magnitude of the groups’ gains from deviating from complete free riding. The intent of the second approach is to outline a more detailed decision-theoretic explanation of the VCM data.
5.2.1. A symmetric binary choice approach This subsection focuses on the determinants of the gains from cooperation

22 R.M. Isaac et al., Group size and the voluntary provision of’public goods
Table 2
Gains from cooperation (in dollars)
N
MPCR=0.75
EP’J _ ENE
MPCR = 0.30 EPO _ ~“t
4 1.00 0.10 10 3.25 1 .oo 40 14.50 5.50
100 37.00 14.50
in a given period under the simplifying assumption that individuals choose to allocate either zero tokens (play Nash) or all tokens (fully cooperate) to the group account. Recall, the strategy space in our experiments allows for greater variation than ‘all tokens’ or ‘zero tokens’ and all or nothing allocations are not generally consistent with the data. This assumption, however, provides a useful insight into how the group size and MPCR
treatment variables affect the gains from cooperation, defined as the difference in experimental dollar earnings between the Pareto optimal and the NE outcomes.”
Simplifying the notation developed in subsection 2.1, let Zi=Z (the individual token endowment), pi= 1 (the 1 cent per token return from the private account), and recall that N is the group size, G’> 1 is the return to the group from a token placed in the group account, and G’IN < 1 is the MPCR. Note that: (1) individual earnings at the Pareto optimum (EPo) are G’Z, and (2) individual earnings at the Nash equilibrium (EN”) are Z. Thus, if a group moves from the Nash equilibrium to the Pareto optimum the gains to one individual from full cooperation can be expressed as
EPo-ENE=G’Z-Z=Z(G’-l)=Z[(MPCR.N)-11,
which varies directly with both group size (holding MPCR constant) and MPCR (holding group size constant).” Furthermore, the gains from coope- ration are invariant to changes in MPCR and N when the product term (N. MPCR) is constant.
Table 2 displays the numerical value of EPo-ENE for N = 4, 10, 40, 100 and MPCR =0.75, 0.30. The most striking calculation is that EPo-ENE increases dramatically as group size increases from 4 to 100 for both MPCR conditions. To the extent that participants are aware of the general nature of
‘%I the IW and VCM-SS-$ experiments reported here, explicit cooperation in the form of group discussions was strictly prohibited. In the VCM-MS-XC experiments, explicit cooperation is not prohibited since communication among subjects is uncontrolled; however, identifying the other individuals in a specific group would be very difftcult.
“Gains from cooperation also exist for movements from the Nash equilibrium to partial cooperation (Emi< NZ). Symmetric allocations to the group account by all participants (m,=m<Z,Vi) leads to gains over ENE of m(G’- 1). Asymmetric allocations do not necessarily lead to gains over EN” for all participants.

R.M. Isaac et al., Group size and the voluntary provision of public goods 23
these relationships and tend to increase token allocations to the group account as the gains to group cooperation increase, then we expect to see allocations to the group account increase with increases in EPo-ENE. Our Observation 3 is consistent with this approach. Furthermore, at the extremes, this approach correctly predicts that allocations to the group account will be greater with N = 100, MPCR=0.15 than with N =4, MPCR=0.3. On the other hand, our results are not consistent with this approach as reported in Observation 2 and Observation 4 in section 4. That is, for groups of size 40 and 100, with MPCR=0.30 or 0.75, a positive correlation between the percentage of tokens allocated to the group account and MPCR does not exist, and for the case of MPCR=0.75, there is no discernible difference in allocations to the group account on average across-group sizes.
This simple binary choice approach is useful as a starting point for characterizing the joint importance of group size and MPCR as factors that shape behavior in our VCM environment. In the next subsection we begin the task of generalizing this simple approach into a more formal model of individual behavior which allows for non-binary asymmetric decisions.
5.2.2. An asymmetric, forward-looking, non-binary approach Given that a unilateral increase in tokens to the group account by an
individual will always decrease that individual’s earnings in the current round, what plausible rationale exists for an individual to deviate from full free riding? We propose a rationale based on the individual’s perception of the expected intertemporal gains from placing tokens in the group account. Gains are ‘expected’ due to uncertainty regarding the actions of others. The standard modelling approach based on backwards induction rules out equilibria containing intertemporal signalling. The modelling approach sug- gested here deviates from the logic of backwards induction, assuming instead that individuals view themselves as involved in a forward-looking intertem- poral decision problem.
This approach is composed of three principal components: (1) the assump- tion that individual i believes his decisions have signalling content to others; (2) a benchmark earnings level for measuring the success of signalling; and (3) the formulation of a subjective probability function for evaluating the likelihood of success.
For purposes of exposition, suppose that individual i believes his allo- cation decisions have signalling content and considers the implications of his actions only one period into the future, with no discounting. Individual i is contemplating the possibility of allocating mi tokens to the group account in both the current and the next period, and he considers this effort a ‘success’ if his earnings in the next period are greater than his earnings at the complete free-riding equilibrium (2). This definition of success is clearly ad hoc and one of numerous possible benchmarks.

24 R.M. lsaac et al., Group size and the voluntary provision of public goods
Table 3
Values of Mf/(N- 1) when mi= 1.
MT/(N- 1)
N MPCR =0.75 MPCR=0.30
4 0.112 0.778 10 0.037 0.259 40 0.009 0.060
100 0.003 0.023
Let Mj*(mi) be the aggregate allocation of tokens to the group account by the N - 1 other individuals such that individual i’s earnings equal 2 when he invests mi. Note that the formulation of My does not require symmetric allocations to the group account. Solve for Mj*(m,) as follows:
(2 - mi) + MPCR(m, + MT) = 2,
MT = mi[( 1 - MPCR)/MPCR].
Notice that MT varies inversely with MPCR. Furthermore, the average number of tokens per person required to generate MT, MT/(N - l), varies inversely with group size.
Let ctf(m, ) L?*) be individual i’s conditional subjective probability at period t that a positive allocation of m, tokens will succeed. Sz’ is a vector of characteristics of the institution and environment at time t which could include the history of other individuals’ behavior and an individual’s ‘homegrown’ expectations about the effects of signalling. The approach developed here assumes that 52’ includes M)/(N - l), and that a:(mi) 52’) and MT/(N - 1) are negatively related. Our principal conjectures are that: (1) an individual will1 be more likely to signal in those experimental conditions in which a:(mi (52’) is greater, and (2) the observed mi’s will be negatively related to MT/(N - 1).
Table 3 shows numerically how MT/(N- 1) varies with the parameters used in our experiments for mi= 1. Notice that the absolute difference between the two MPCR columns is greatest at N =4 and diminishes as N increases. Consider the case of N = 10 and MPCR =0.30, where MS/(N - 1) =0.259. Assume that individual i allocates m,>O tokens to the group account in rounds t and t+ 1. The average allocation to the group account of the nine other individuals must exceed 0.259mi tokens in round t+ 1 for i’s non-zero round t allocation to be viewed as a successful signal (that is, individual i earns greater than 2 in round t + 1).
This model of asymmetric behavior is consistent with several (but not all) aspects of our data. First, it is common in all treatment conditions to observe individuals whose allocation to the group account vary substantially

R.M. Isaac et al., Group size and the voluntary provision of public goods 25
from round to round. Such ‘pulsing’ behavior could be interpreted as attempts to influence others’ allocations through signalling. Second, as reported in Observation 3 for the case of MPCR =0.30, groups of size 40 and 100 allocate more tokens to the group account on average than do groups of size 4 and 10. Third, moving from the design condition of (N= 10, MPCR=0.30) to (N=4, MPCR=0.75), the value of (MPCR.N) is constant but MT/(N - 1) decreases. As predicted by this approach, average group allocations for the N = 4, MPCR = 0.75 experiments consistently exceed those observed under the condition of N = 10, MPCR =0.30. The Miller-Andreoni replicator dynamic approach and the simple binary choice approach predict no difference in behavior across designs where (N. MPCR) is held constant. Finally, both OLS and Tobit regressions demonstrate the importance of MT/(N - 1) as an explanatory variable for aggregate allocations to the group account. Pooling the data across all group sizes and MPCR conditions, MT/(N - 1) is negatively and significantly correlated with allocations to the group account. Thus, MT/(N - 1) appears in a statistical sense to incorporate the combined impact of N and MPCR. No significant difference in allo- cations to the group account is observed: (1) for groups of size 40 and 100 with MPCR=0.30 or MPCR=0.75 (Observation 2), and (2) across all group sizes for the case of MPCR =0.75 (Observation 4). These results are inconsistent with the predictions of the asymmetric non-binary approach, the symmetric binary approach, and the Miller-Andreoni replicator approach. In addition, there is no discernible difference in aggregate allocations for the cases of (N =40, MPCR = 0.75) and (N = 100, MPCR = 0.30) even though Mf/(N- 1) changes. Since (MPCR. N) is constant for these parameters, the Miller-Andreoni and binary choice approaches correctly predict no difference in aggregate allocations.
In summary, for MPCR values in the domain of {0.30,0.75}, significant differences in aggregate allocations are observed when (1) group size is small (4,lO) and MPCR changes, and (2) MPCR=0.30 and group size changes from the small-group (4,lO) to the large-group (40,100) domain. It is in these conditions that the largest absolute changes in Mf/(N- 1) occur. Given the potential for large variations in xi across individuals and over time, statistically significant differences in Emi between N and MPCR treatment groups are unlikely to be observed in small samples unless there are large differences in MT/(N - 1) across the treatment groups. This suggests a direction for new experimentation - large groups with considerably larger differences in Mj*/(N - 1) across treatment conditions. Such experiments are presented in section 6 below.
Up to this point, individual i has been assumed to contemplate the signal value of mi> 0 for only one period in advance. This need not be the case in an expanded version of the non-binary asymmetric choice approach. If multiple-stage signalling is allowed, then the following conjecture seems

26 R.M. lsaac et al., Group size and the voluntary provision of public goods
reasonable: as the final round approaches, the expected gains from signaling diminish. Thus, in contrast to a purely adaptive or learning model where the number of rounds completed is central to behavioral dynamics, this expanded forward-looking approach suggests that the number of rounds remaining is an important determinant of behavior in the current round. Varying the number of rounds across experiments allows one to address this issue. If the number of rounds remaining is positively correlated with subjects’ expectations that signalling will be succesful, then the aggregate allocation to the group account in round t should be larger, ceteris paribus, in experiments with a longer time horizon. Section 6 below presents several VCM experiments with a much longer time horizon than any previously reported.
The forward-looking logic embodied in this approach suggests that, as the final round of the experiment approaches, the expected gains from coope- ration diminish since fewer rounds remain. In the final round, the signal content of m, is irrelevant and all individuals have a dominant strategy of m,=O. The data, however, show many deviations from this strategy. Thus, any forward-looking model based on signalling must be complemented with an explanation for positive allocations to the group account in the final round. The literature suggests two likely candidates: fairness considerations and warm glow effects.
Clearly, this more complex forward-looking approach to modelling VCM behavior has limitations as currently developed. The benchmark for success is arbitrary, and the approach does not differentiate between ‘barely’ succeeding and ‘substantially’ succeeding. Furthermore, no consistency requirements have been imposed on the ~i)s. The articulation of a formal, fully developed, forward-looking model is left as a challenge for future research.
6. Additional experimental results
This section presents two additional series of experiments. The first set examines behavior in groups of size 40 with an MPCR =0.03 and is motivated by the disappearance of the MPCR effect in large groups. The second set examines behavior when subjects are provided with additional payoff information and participate in a large number of decision rounds. These experiments are motivated, in part, by the ‘incomplete information’ and ‘learning’ explanations for the failure to observe complete free riding. In addition, they allow for further testing of the forward-looking approach presented above.
6.1. Large-group experiments with a low MPCR
Recall that in groups of size 100 and 40 there was no significant separation

R.M. Isaac et al., Group size and the voluntary provision of public goods 27
in cm, for MPCR =0.30 vs. MPCR=0.75. In groups of size 40 and 100, however, MPCR values of 0.30 and 0.75 yield values of MT/(N - 1) which are quite close in an absolute sense. In a large-group experiment with a very
low MPCR, one can recapture the feature of the small-group MPCR=0.30
experiments of a relatively large value of MJ/(N - 1). Specifically, in a 40-person group with MPCR =0.03, M,*/( N - 1) = 0.83m,. This implies that the average allocation of tokens to the group account by the (N - 1) other individuals must be greater than 0.83mi for individual i’s earnings to be greater than ENE. Thus, such experiments should exhibit lower Emi than those with MPCR=0.30 or MPCR =0.75.
The results of seven 40-person MPCR = 0.03 experiments are reported in this subsection; six using the VCM-MS-XC procedures and one using the VCM-SS-$ procedure. The subjects in the later experiment (SS4x) were randomly drawn from the group of 80 subjects who participated in experiments SS1 and SS2 reported above.” Fig. 11 displays the mean results of the VCM-MS-XC experiments and the data from the single VCM-SS-$ experiment. As predicted, these 40-person groups exhibit a substantial decay in allocations to the group account. Thus, the MPCR effect does appear to exist in 40-person experiments for MPCR values much smaller than those used by IW.
6.2. Experiments with additional payoff information and a large number of
decision rounds
The single-session experiments reported in this subsection all employ cash rewards, N = 10, and MPCR =0.30. There are two design changes relative to the previously reported experiments. First, subjects were provided with a handout (appendix B) explicitly stating the conditions in which: (1) an individual receives the maximum possible earnings, (2) an individual receives the minimum possible earnings, (3) the group as a whole receives the maximum possible earnings, and (4) the group as a whole receives the minimum possible earnings. Second, the number of decision rounds varied from 10 in three experiments to 40 in two experiments to 60 in one experiment. The subjects in the 40-round experiments were drawn from a pool of subjects with experience in lo-round VCM experiments. The subjects in the 60-round experiment were drawn from the two 40-round experiments.13
Fig. 12 summarizes the results from these additional experiments. The top
“Subjects in SS4x were paid $2 cash for each ‘experiment dollar’ earned due to the very low MPCR. Cash earnings in SS4x were approximately one-half the earnings in the other three single-session experiments.
‘%ubjects in the 40- and 60-round experiments were paid in cash $0.50 for each ‘experiment dollar’ earned due to the large number of decision rounds.

28 R.M. Isaac et al., Group size and the voluntary provision of public goods
1ooi % TOKENS TO GROUP ACCOUNT
901
60 t
, 1 2 3 4 5 6 7 8 9 10
ROUND
+ SS-$-EXP.SS4x + MS-XC-POOLED
Fig. 11. Experiments using group size 40 and a very low (0.03) MPCR.
panel displays the sequence of mean allocations to the group account from two series focusing solely on the effect of additional payoff information. The first series, SS-$-IW, were previously reported in section 4. The second series, SS-$-INFO, are the new lo-round experiments in which subjects received the additional payoff information. Examining each decision round separately, t- tests indicate that the differences in means are insignificant.
The bottom left panel reports the results of two experiments with 40 decision rounds and the additional payoff information. These experiments exhibit a pattern of allocations to the group account in which group allocations begin at a mean of 57.5% and decay slowly (but not montoni- tally) to a mean of 6.8% by round 40. The bottom right panel reports the results of one experiment with 60 decision rounds and the additional

R.M. Isaac et al., Group size and the voluntary provision of public goods 29
10 DECISION ROUNDS
t&TOKENS TOGROUPACCOUNT roor
so
SO t
70 I
so t MEANS OF 3 EXPERIMENTS
10 t
\
0-e 1 2 3 4 6 6 7 6 9 10
ROUND
- ss-s-IW - SS-S-INFO
40 DECISION ROUNDS 60 DECISION ROUNDS
,oo 5b TOKENS TO GROUP ACCOUNT
r
so
SO
70
60
50
40
30
20
10
OI 1 10 20 RO?ND 40 60 60
+TOKENSTOGROUPACCOUNT 100
90
t 10 20 RO%D
40 50 60
( - SS-S-EXPSS7XX )
Fig. 12. Experiments with additional payoff information and a larger number of decision rounds.
30 R.M. Isaac et al., Group size and the voluntary provision qfpublic goods
information. In this experiment, group allocations begin at 51% of total endowment and decay slowly (but not monotonically) to 19.2oi;; by round 60.
These experiments supplement our VCM database in several interesting ways. Even with a richer information environment, highly experienced subject groups continue to follow a pattern of behavior inconsistent with the predictions of the complete information Nash model. Thus, the results reported in section 4 are not an artifact of limiting decisions to 10 rounds. Furthermore, the rate of decay of allocations to the group account is inversely related to the number of decision rounds. For example, compare rounds 8-10 in the IO-round experiments with rounds 8-10 in the 40- and 60-round experiments. Or, compare rounds 35-40 in the 40-round experi- ments with rounds 35-40 in the 60-round experiment. Clearly, the rate of decay is faster the shorter the time horizon of the experiment. This result is inconsistent with backward induction models, and purely adaptive or learning models based on the number of rounds completed. This aspect of the VCM data is consistent with a forward-looking modelling approach based on the potential gains from cooperation.
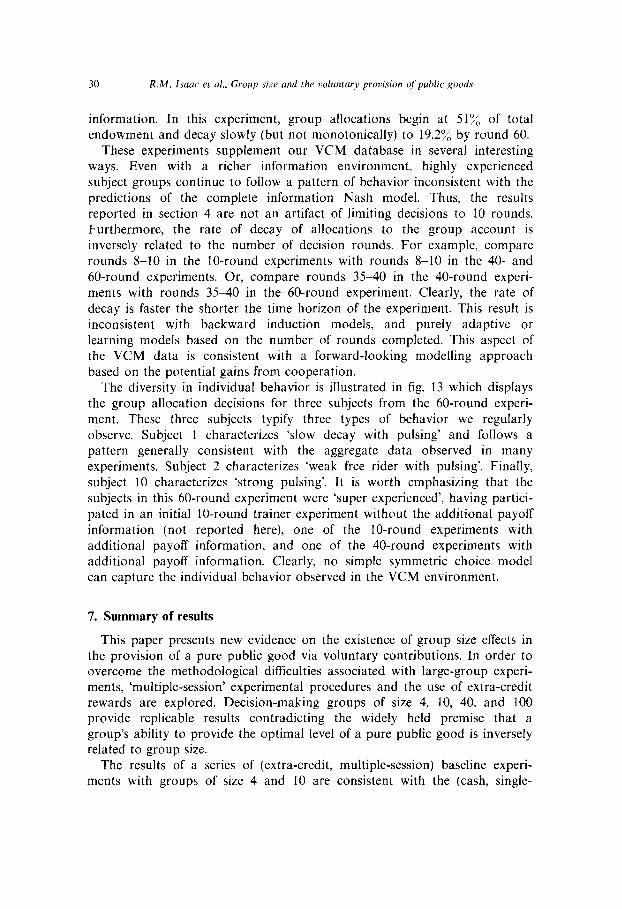
The diversity in individual behavior is illustrated in fig. 13 which displays the group allocation decisions for three subjects from the 60-round experi- ment. These three subjects typify three types of behavior we regularly observe. Subject 1 characterizes ‘slow decay with pulsing’ and follows a pattern generally consistent with the aggregate data observed in many experiments. Subject 2 characterizes ‘weak free rider with pulsing’. Finally, subject 10 characterizes ‘strong pulsing’. It is worth emphasizing that the subjects in this 60-round experiment were ‘super experienced’, having partici- pated in an initial lo-round trainer experiment without the additional payoff information (not reported here), one of the IO-round experiments with additional payoff information, and one of the 40-round experiments with additional payoff information. Clearly, no simple symmetric choice model can capture the individual behavior observed in the VCM environment.
7. Summary of results
This paper presents new evidence on the existence of group size effects in the provision of a pure public good via voluntary contributions. In order to overcome the methodological difficulties associated with large-group experi- ments, ‘multiple-session’ experimental procedures and the use of extra-credit rewards are explored. Decision-making groups of size 4, 10, 40, and 100 provide replicable results contradicting the widely held premise that a group’s ability to provide the optimal level of a pure public good is inversely related to group size.
The results of a series of (extra-credit, multiple-session) baseline experi- ments with groups of size 4 and 10 are consistent with the (cash, single-

R.M. Isaac et al., Group size and the voluntary provision of public goods 31
so
80
70 -
60
60.
SUBJECT 2
30
20
10
0
60 SUBJECT
1 6 H 16 21 26 31 36 41 46 51 66 60 3 6 11 16 21 26 31 36 41 46 61 66 60
ROUND ROUND
Fig. 13. Illustrative subject data.

32 R.M. Isaac et al., Group size and the voluntary provision cfpuhlic goods
session) experimental results reported by Isaac and Walker (1988) that a higher marginal benefit from the public good leads to less free riding and thus greater efficiency. This is in spite of the fact that, in this experimental setting, the single-period dominant strategy is a zero allocation of resources to the public good.
Our experiments with groups of size 40 and 100 yield several surprising results. First, the impact from variations in the magnitude of the marginal per capita return from the public good (MPCR) appears to vanish over the range [0.30,0.75]. Second, with an MPCR of 0.30, groups of size 40 and 100 provide the public good at higher levels of efficiency than groups of size 4 and 10. Third, with an MPCR of 0.75, there is no significant difference in efficiency due to group size.
Several additional experiments utilizing cash rewards and standard single- session procedures suggest that the unexpectedly high efficiency levels generated by large groups are not simply an artifact of extra-credit rewards or multiple-session procedures. Forty-person experiments with a very low MPCR of 0.03 yield the low efficiency levels previously observed with small groups and an MPCR of 0.30. The existence of an ‘MPCR effect’ is thus reconfirmed for large groups. Our research reveals, however, that behavior is influenced by a subtle interaction between group size and MPCR rather than simply the shear magnitude of either. Experiments using both additional payoff information and as many as 60 decision rounds provided further evidence of the failure of the standard backward induction model.
Appendix A: Example of classroom handout used in multiple-session VCM experiments
GROUP INVESTMENT EXPERIMENT
EXTRA CREDIT EXERCISE El03 - SPRING 90 - PROFESSOR WALKER
You will have the opportunity to participate in a decision making exercise referred to as the “Group Investment Experiment”. Participation is totally voluntary.
The exercise consists of a series of decision making rounds. In each round you will choose to allocate “tokens” between a “private account” and a “group account”. You will access the experiment on the NOVANET (PLATO) computer network using the MICROCOMPUTERS in BH307 and other on campus sites listed on the second page. In the first round you will receive instructions describing the exercise and you will make your tirst allocation decision.
The instructions explain how you can earn money in this exercise. You will

R.M. Isaac et al., Group size and the voluntary provision of public goods 33
NOT be paid the money. Rather, you will receive extra-credit points based on the amount of money you earn. The maximum number of extra-credit points is 3 and the minimum is 0. The extra-credit points will be added to your final course average.
All students will not face exactly the same decisions. For this reason, your earnings potential in money will not be the same. Extra-credit points will be awarded based on an individual’s money earnings relative to the maximum possible for that individual and relative to the minimum possible for that individual. For example, if one individual has maximum possible earnings of $100 and he/she earns $100 then that individual will earn 3 points. Likewise, if one individual has a maximum possible of $20 and he/she earns $20 then that individual will earn 3 points. In general, the more money you earn the greater the number of extra-credit points that you will receive. Even though potential money earnings is not the same for everyone, the maximum and minimum number of extra-credit points is the same for everyone.
The specific formula which will be used in converting money earnings into extra-credit points for each student (say, student X) will be:
X’s Actual Earnings-X’s Minimum Possible Earnings
X’s Maximum Possible Earnings-X’s Minimum Possible Earnings
This fraction can range from 0 to 1 for each individual. At the end of the final decision making round, this fraction will be computed for each individual (based on earnings in all rounds) and multiplied by 100. This gives each person a score of 0 to 100 which will be entrered in my electronic grade book. This score will be multiplied by .03 and the result added to your final grade average. For example: assume an individual has a final score of (.4.5) x 100=45. That person will have .03 x 45 = 1.35 points added to their final average for the course. Thus, it is clearly possible to earn fractional extra-credit points.
How to access NOVANET (PLATO)
Using the microcomputers in BH307 (or other sites), the “IU Micro Menu System” allows access to NOVANET (PLATO) via the COMMUNICA- TIONS MENU. Choose option 5 on the Communications Menu, listed as “NovaNET (PLATO)“. Use the following information to access the extra- credit exercise:
NOVANET name: vcm NOVANET group: iuecon
After you have logged on to NOVANET, you will be automatically routed to the “Group Investment Experiment”. You will then be ased to type your “class-tile” and your last name. Use the following information:

34 R.M. Isaac et al., Group size and the voluntary provision of public goods
Class tile: jw103 (Press NEXT when finished typing)
Last name: first 6 letters of your last name plus the last 4 numbers in your social security number. (Press NEXT when finished typing)
For example, if Ronald Raygun has SS # 123-45-6789 then this student’s last name would be entered as raygun6789. Jim McDonald with SS #333-24- 4321 would enter mcdona4321. Jill Smith with SS#234-56-9876 would enter smith9876.
After you log in, you will be routed to a set of instructions that describe the extra credit exercise. The first round will probably take from 20 to 30 minutes (feel free to take all the time you find necessary). Subsequent decision rounds may be shorter since you will not have to review the instructions unless you desire to do so. The results of your performance are automatically stored in the computer.
The exercise will consist of 10 decision making rounds. The starting and ending times for each round are:
BEGIN
Round 1 - 8:00 am on Tuesday 2/13 Round 2 - 8:00 am on Thursday 2122 Round 3 - 12 noon on Sunday 2125 Round 4 - 8:00 am on Thursday 3/l Round 5 - 12 noon on Sunday 314 Round 6 - 8:00 am on Thursday 318 Round 7 - 12 noon on Sunday 3118 Round 8 - 8:00 am on Thursday 3122 Round 9 - 12 noon on Sunday 3/25 Round 10 - 8:00 am on Thursday 3129
Those students who do not enter a
END
12 noon on Wednesday 2121 12 noon on Saturday 2/24 12 noon Wednesday 2128 12 noon Saturday 313 12 noon Wednesday 317 12 noon Saturday 3117 12 noon Wednesday 3121 12 noon Saturday 3124 12 noon Wednesday 3128 12 noon Saturday 313 1
decision for the first round of the experiment will be eliminated from participating in all subsequent rounds and thus will earn 0 extra-credit points. The instructions explain what happens for those students who participate in the first round but do not make a decision in one or more of the other rounds.
TAKE THIS HANDOUT WITH YOU WHEN YOU GO TO ENTER YOUR DECISIONS:
Hours for BH 307: Sunday through Thursday (9am to 9:45pm), F and Sat. (9am to 445pm)
Other Sites: BH308; Business - 417 and 101; Hyper 154.

R.M. Isaac et al., Group size and the voluntary provision of public goods 35
Appendix B: Additional payoff information
The following information is to help you understand how your decisions in this experiment will affect your earnings.
The following statements describe several important aspects of your mini- mum and maximum possible earnings and the aggregate earnings of everyone in the experiment.
1. An individual will receive the maximum possible earnings ($1.85 per round) only if this individual allocates all 50 tokens to the PRIVATE account and everyone else in the experiment allocates all tokens to the GROUP account.
2. An individual will receive the minimum possible earnings ($.15 per round) only if this individual allocates all 50 tokens to the GROUP account and everyone else in the experiment allocates all tokens to the PRIVATE account.
3. A decision-making group as a whole will receive the maximum possible group earnings ($1.50 for each individual in the group per round) if all individuals allocate all tokens to the GROUP account.
4. A decision-making group as a whole will receive the minimum possible group earnings ($.50 for each individual in the group per round) if all individuals allocate all tokens to the PRIVATE account.
Note: The above information is expressed in “experiment dollars”. At the end of the experiment you will be paid privately (in cash) one-half of your experiment dollar earnings plus $3.00 cash for showing up on time.
References
Andreoni, J., 1988, Why free ride? Strategies and learning in public goods experiments, Journal of Public Economics 37, 291-304.
Andreoni, J., 1989, Giving with impure altruism: Applications to charity and Ricardian equivalence, Journal of Political Economy 97, 1447-1458.
Brookshire, D., D. Coursey and D. Redington, 1989, Special interests and the voluntary provision of public goods, Unpublished manuscript.
Cox, J., V. Smith and J. Walker, 1985, Expected revenue in discriminative and uniform price sealed-bid auctions, in: V. Smith, ed., Research in experimental economics (JAI Press, Greenwich, CT) 183-232.
Dorsey, R., 1992, The voluntary contributions mechanism with real time revisions, Public Choice 13, 261-282.
Fisher, J., M. Isaac, J. Schatzberg and J. Walker, 1988, Heterogeneous demand for public goods: Effects on the voluntary contributions mechanism, Unpublished manuscript.
Fudenberg, D. and D. Kreps, 1988, A theory of learning, experimentation, and equilibrium in games, Unpublished manuscript.
k&K, M. and J. Walker, 1988, Group size effects in public goods provision: The voluntary contribution mechanism, Quarterly Journal of Economics 103, 179-200.

36 R.M. Isaac et al., Group size and the voluntary provision of public goods
Isaac. M. and J. Walker, 1989, Complete information and the provision of public goods, Unpublished manuscript.
Isaac, M., K. McCue and C. Plott, 1985, Public goods provision in an experimental environment, Journal of Public Economics 26, 51-74.
Isaac, M., J. Walker and S. Thomas, 1984, Divergent evidence on free riding: An experimental examination of some possible explanations, Public Choice 43, 113-149.
Kagel, J. and D. Levin, 1993, Independent private value auctions: Bidder behavior in first, second, and third price auctions with varying numbers of bidders, Economic Journal 103, 868-879.
Kahneman, D., J. Knetch and R. Thaler, 1986a, Fairness and the assumptions of economics, Journal of Business 59, S285-S300.
Kahneman, D., J. Knetch and R. Thaler, 1986b, Fairness as a constraint on profit seeking: Entitlements in the market, American Economic Review 76, 728-741.
Kim, 0. and M. Walker, 1984, The free rider problem: Experimental evidence, Public Choice 43, 3-24.
Kreps, D., P. Milgrom, J. Roberts and R. Wilson, 1982, Rational cooperation in the finitely repeated Prisoners dilemma, Journal of Economic Theory 27, 245-252.
Ledyard, J., 1993, Is there a problem with public goods provision?, in: J. Kagel and A. Roth, eds., The handbook of experimental economics (Princeton University Press, in press).
Marwell, G. and R. Ames, 1979, Experiments on the provision of public goods I: Resources, interest, group size, and the free rider problem, American Journal of Sociology 84, 1335-1360.
Marwell, G. and R. Ames, 1980, Experiments on the provision of public goods II: Provision points, stakes, experience and the free rider problem, American Journal of Sociology 85, 926937.
Marwell, G. and R. Ames, 1981, Economists free ride: Does anyone else?, Journal of Public Economics 15, 295-310.
Milgrom, P. and J. Roberts, 1991, Adaptive and sophisticated learning in normal form games, Games and Economic Behavior 3, 82-100.
Miller, J. and J. Andreoni, 1991, A coevolutionary model of free riding behavior: Replicator dynamics as an explanation of the experimental results, Economics Letters 36, 9-15.
Moreno, D. and M. Walker, 1993, Two problems in applying Ljung’s ‘project algorithms’ to the analysis of decentralized learning, Journal of Economic Theory, forthcoming.
Palfrey, T. and H. Rosenthal. 1988. Private incentives in social dilemmas. Journal of Public Economics 35, 309-332.