group a streptococcal m protein activates the nlrp3...
TRANSCRIPT
ARTICLESDOI: 10.1038/s41564-017-0005-6
© 2017 Macmillan Publishers Limited, part of Springer Nature. All rights reserved.
1 Department of Pediatrics, University of California, San Diego, La Jolla, CA 92093, USA. 2 Department of Chemistry and Biochemistry, University of California, San Diego, La Jolla, CA 92093, USA. 3 Department of Medicine, University of California, San Diego, La Jolla, CA 92093, USA. 4 Skaggs School of Pharmacy and Pharmaceutical Sciences, University of California, San Diego, La Jolla, CA 92093, USA. *e-mail: [email protected]; [email protected]
Group A Streptococcus (GAS) causes diseases ranging from common pharyngitis to life-threatening necrotizing fasci-itis (NF) and streptococcal toxic shock syndrome (STSS),
and is the immunologic trigger for rheumatic heart disease1. With an estimated 500,000 deaths annually, GAS ranks among the ten deadliest human pathogens2. The pathogen expresses numerous surface-bound and secreted virulence factors that subvert innate immune defences1.
M protein, the most abundant protein on the GAS surface3, extends as hair-like fimbriae4, with structure, function and immu-nochemistry unique among known virulence molecules5. Sequence analysis of encoding emm genes suggests more than 220 variants6. However, only a few M protein/emm types are widespread and asso-ciated with systemic infections, with serotype M1/emm1 the most prevalent worldwide7. A globally disseminated serotype M1T1 sub-clone has been the leading cause of severe invasive GAS infections in recent decades8.
M proteins mediate host epithelial cell adhesion9 and resistance to opsonophagocytosis by binding host components including fibrinogen, C4b-binding protein and immunoglobulin Fc10. M pro-teins also block the membrane-lytic activities of host antimicrobial peptides and histones by sequestering them away from the bacte-rial membrane11,12. Soluble M proteins released during infection by neutrophil-derived granule proteases13 can trigger inflammation by forming a supramolecular assembly with fibrinogen that activates neutrophils13,14. Indeed, soluble M1 protein is sufficient in animal models to trigger vascular leakage and tissue injury similar to severe GAS diseases such as NF and STSS13,15. Under physiological con-ditions, M1 protein is also shed naturally from the GAS surface and is detected at micromolar concentrations in the extracellular medium16, provided it is not degraded by the broad-spectrum GAS cysteine protease SpeB17. In M1T1 GAS and certain other invasive serotypes, mutations in the covR/S (aka csrR/S) two-component regulatory system can upregulate several virulence factors while suppressing expression of SpeB18,19. Loss of SpeB expression spares
M protein from proteolytic degradation and increases the levels of its soluble form. Effects of soluble M1 on macrophages have not previously been investigated.
Macrophages play a central role in pathogen recognition and the activation of innate immune and inflammatory responses. Inflammasomes are multimeric cytosolic protein complexes that integrate pathogen-triggered signalling cascades in macrophages, activating caspase-1 and proteolytic processing of pro-IL-1β and pro-IL-18 to their mature cytokine forms, IL-1β and IL-18 (ref. 20). Inflammasomes can activate a rapid pro-inflammatory form of macrophage cell death termed ‘pyroptosis’, characterized by plasma membrane rupture, release of cytosolic contents and DNA fragmentation21. Pyroptosis restricts replication of intracellular bac-terial pathogens22 and IL-1β signalling promotes immune resistance to several microbes, including GAS23.
Among the various inflammasomes, those containing intra-cellular pattern recognition molecule NACHT, LRR and pyrin domains-containing protein 3 (NLRP3) are best studied, as their deregulation contributes to inherited autoinflammatory disorders24 and chronic metabolic diseases, including atherosclerosis, type 2 diabetes, gout and obesity25. So far, two GAS-secreted toxins are known to activate macrophage NLRP3 inflammasome-mediated IL-1β signalling and pyroptosis: pore-forming cytolysin streptoly-sin O (SLO)26 and C3 ADP-ribosyltransferase SpyA27. The conse-quences of GAS toxin-mediated NLRP3 inflammasome activation range from a protective immune response to exaggerated inflam-matory host cell damage.
Here, we report that the classical GAS virulence factor M1 protein triggers macrophage cell death in a manner requiring its B-repeat region. M1 is a second signal for caspase-1-dependent NLRP3 inflammasome activation, leading to IL-1β processing and pyroptotic macrophage cell death. M1 uptake occurs through clath-rin-mediated endocytosis accompanied by K+ efflux, both essen-tial events in NLRP3 activation. M1-induced pyroptosis and IL-1β signalling may exert pro-immune and pro-inflammatory effects of
Group A streptococcal M protein activates the NLRP3 inflammasomeJ. Andrés Valderrama1,2, Angelica M. Riestra1, Nina J. Gao1, Christopher N. LaRock! !1, Naveen Gupta3, Syed Raza Ali1, Hal M. Hoffman1,3, Partho Ghosh2* and Victor Nizet! !1,4*
Group A Streptococcus (GAS) is among the top ten causes of infection-related mortality in humans. M protein is the most abun-dant GAS surface protein, and M1 serotype GAS strains are associated with invasive infections, including necrotizing fasciitis and toxic shock syndrome. Here, we report that released, soluble M1 protein triggers programmed cell death in macrophages (Mφ ). M1 served as a second signal for caspase-1-dependent NLRP3 inflammasome activation, inducing maturation and release of proinflammatory cytokine interleukin-1β (IL-1β ) and macrophage pyroptosis. The structurally dynamic B-repeat domain of M1 was critical for inflammasome activation, which involved K+ efflux and M1 protein internalization by clathrin-mediated endocytosis. Mouse intraperitoneal challenge showed that soluble M1 was sufficient and specific for IL-1β activation, which may represent an early warning to activate host immunity against the pathogen. Conversely, in systemic infection, hyperinflamma-tion associated with M1-mediated pyroptosis and IL-1β release could aggravate tissue injury.
NATURE MICROBIOLOGY | www.nature.com/naturemicrobiology
© 2017 Macmillan Publishers Limited, part of Springer Nature. All rights reserved. © 2017 Macmillan Publishers Limited, part of Springer Nature. All rights reserved.
ARTICLES NATURE MICROBIOLOGY
potential benefit or harm to the human host depending on the site, stage and magnitude of infection.
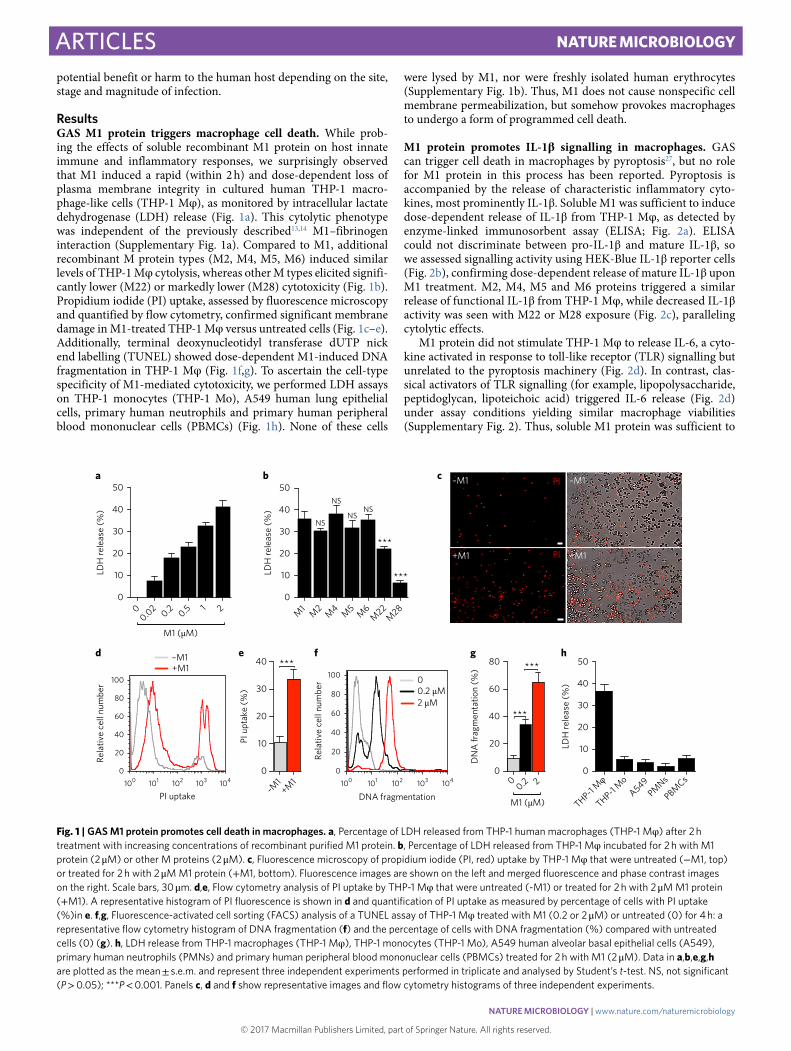
ResultsGAS M1 protein triggers macrophage cell death. While prob-ing the effects of soluble recombinant M1 protein on host innate immune and inflammatory responses, we surprisingly observed that M1 induced a rapid (within 2 h) and dose-dependent loss of plasma membrane integrity in cultured human THP-1 macro-phage-like cells (THP-1 Mφ ), as monitored by intracellular lactate dehydrogenase (LDH) release (Fig. 1a). This cytolytic phenotype was independent of the previously described13,14 M1–fibrinogen interaction (Supplementary Fig. 1a). Compared to M1, additional recombinant M protein types (M2, M4, M5, M6) induced similar levels of THP-1 Mφ cytolysis, whereas other M types elicited signifi-cantly lower (M22) or markedly lower (M28) cytotoxicity (Fig. 1b). Propidium iodide (PI) uptake, assessed by fluorescence microscopy and quantified by flow cytometry, confirmed significant membrane damage in M1-treated THP-1 Mφ versus untreated cells (Fig. 1c–e). Additionally, terminal deoxynucleotidyl transferase dUTP nick end labelling (TUNEL) showed dose-dependent M1-induced DNA fragmentation in THP-1 Mφ (Fig. 1f,g). To ascertain the cell-type specificity of M1-mediated cytotoxicity, we performed LDH assays on THP-1 monocytes (THP-1 Mo), A549 human lung epithelial cells, primary human neutrophils and primary human peripheral blood mononuclear cells (PBMCs) (Fig. 1h). None of these cells
were lysed by M1, nor were freshly isolated human erythrocytes (Supplementary Fig. 1b). Thus, M1 does not cause nonspecific cell membrane permeabilization, but somehow provokes macrophages to undergo a form of programmed cell death.
M1 protein promotes IL-1β signalling in macrophages. GAS can trigger cell death in macrophages by pyroptosis27, but no role for M1 protein in this process has been reported. Pyroptosis is accompanied by the release of characteristic inflammatory cyto-kines, most prominently IL-1β . Soluble M1 was sufficient to induce dose-dependent release of IL-1β from THP-1 Mφ , as detected by enzyme-linked immunosorbent assay (ELISA; Fig. 2a). ELISA could not discriminate between pro-IL-1β and mature IL-1β , so we assessed signalling activity using HEK-Blue IL-1β reporter cells (Fig. 2b), confirming dose-dependent release of mature IL-1β upon M1 treatment. M2, M4, M5 and M6 proteins triggered a similar release of functional IL-1β from THP-1 Mφ , while decreased IL-1β activity was seen with M22 or M28 exposure (Fig. 2c), paralleling cytolytic effects.
M1 protein did not stimulate THP-1 Mφ to release IL-6, a cyto-kine activated in response to toll-like receptor (TLR) signalling but unrelated to the pyroptosis machinery (Fig. 2d). In contrast, clas-sical activators of TLR signalling (for example, lipopolysaccharide, peptidoglycan, lipoteichoic acid) triggered IL-6 release (Fig. 2d) under assay conditions yielding similar macrophage viabilities (Supplementary Fig. 2). Thus, soluble M1 protein was sufficient to
00.02 0.2 0.5 1 2
0
10
20
30
40
50a b c
d e f g h
LDH
rele
ase
(%)
M1 (μM)
***
***
0 0.2 20
20
40
60
80
DN
A fr
agm
enta
tion
(%)
M1 (μM)
PI
PI
–M1
+M1
–M1
+M1
M1M2
M4 M5 M6M22
M280
10
20
30
40
50
LDH
rele
ase
(%)
NS
NS
NSNS
***
***
–M1
+M10
10
20
30
40
PI u
ptak
e (%
)
***
0
20
40
60
80
100
Rela
tive
cell
num
ber
100 101 102 103 104 100 101 102 103 104
PI uptake
–M1+M1
0
20
40
60
80
100
Rela
tive
cell
num
ber
DNA fragmentation
0.2 μM0
2 μM
THP-1 Mφ
THP-1 Mo
A549PMNs
PBMCs0
10
20
30
40
50
LDH
rele
ase
(%)
Fig. 1 | GAS M1 protein promotes cell death in macrophages. a, Percentage of LDH released from THP-1 human macrophages (THP-1 Mφ ) after 2!h treatment with increasing concentrations of recombinant purified M1 protein. b, Percentage of LDH released from THP-1 Mφ incubated for 2!h with M1 protein (2!μ M) or other M proteins (2!μ M). c, Fluorescence microscopy of propidium iodide (PI, red) uptake by THP-1 Mφ that were untreated (− M1, top) or treated for 2!h with 2!μ M M1 protein (+ M1, bottom). Fluorescence images are shown on the left and merged fluorescence and phase contrast images on the right. Scale bars, 30!μ m. d,e, Flow cytometry analysis of PI uptake by THP-1 Mφ that were untreated (-M1) or treated for 2!h with 2!μ M M1 protein (+ M1). A representative histogram of PI fluorescence is shown in d and quantification of PI uptake as measured by percentage of cells with PI uptake (%)in e. f,g, Fluorescence-activated cell sorting (FACS) analysis of a TUNEL assay of THP-1 Mφ treated with M1 (0.2 or 2!μ M) or untreated (0) for 4!h: a representative flow cytometry histogram of DNA fragmentation (f) and the percentage of cells with DNA fragmentation (%) compared with untreated cells (0) (g). h, LDH release from THP-1 macrophages (THP-1 Mφ ), THP-1 monocytes (THP-1 Mo), A549 human alveolar basal epithelial cells (A549), primary human neutrophils (PMNs) and primary human peripheral blood mononuclear cells (PBMCs) treated for 2!h with M1 (2!μ M). Data in a,b,e,g,h are plotted as the mean!± !s.e.m. and represent three independent experiments performed in triplicate and analysed by Student’s t-test. NS, not significant (P!> !0.05); ***P!< !0.001. Panels c, d and f show representative images and flow cytometry histograms of three independent experiments.
NATURE MICROBIOLOGY | www.nature.com/naturemicrobiology

© 2017 Macmillan Publishers Limited, part of Springer Nature. All rights reserved. © 2017 Macmillan Publishers Limited, part of Springer Nature. All rights reserved.
ARTICLESNATURE MICROBIOLOGY
specifically induce IL-1β signalling, with pyroptosis the likely cell death pathway concurrently activated in macrophages.
M1 activates the NLRP3 inflammasome and pyroptosis in a cas-pase-1-dependent manner. The synthesis, processing and release of mature IL-1β by macrophages depend on two independent sig-nals28. An inflammatory signal is provided by pathogen-associated molecular patterns (PAMPs) or danger-associated molecule pat-terns (DAMPs) recognized by specific receptors, including TLRs. These first signals, known as priming signals, induce transcription and synthesis of pro-IL-1β and initiate expression of inflammasome components29. A second signal is subsequently required for inflam-masome assembly and activation, resulting in maximal generation of mature IL-1β . In our experiments with cultured THP-1 Mφ , phorbol 12-myristate 13-acetate (PMA) was used to differentiate cells into the macrophage phenotype. PMA provided signal 1, as IL-1β transcript increased over 1,000-fold compared to undiffer-entiated THP-1 Mo (Supplementary Fig. 3), and we hypothesized that M1 was a second signal required for efficient inflammasome activation. Murine bone marrow-derived macrophages (BMDMs) primed with a variety of TLR stimuli, but not unprimed BMDMs, responded to M1 protein by releasing IL-1β (Fig. 2e). In contrast, signal 1 alone was sufficient to trigger IL-1β in human primary PBMCs, and addition of M1 did not further boost release of the cytokine (Fig. 2f). This observation correlates with recent studies that demonstrate human monocytes engage an alternative inflam-masome pathway, wherein TLR agonists by themselves trigger IL-1β in a process independent of K+ efflux and pyroptosis30.
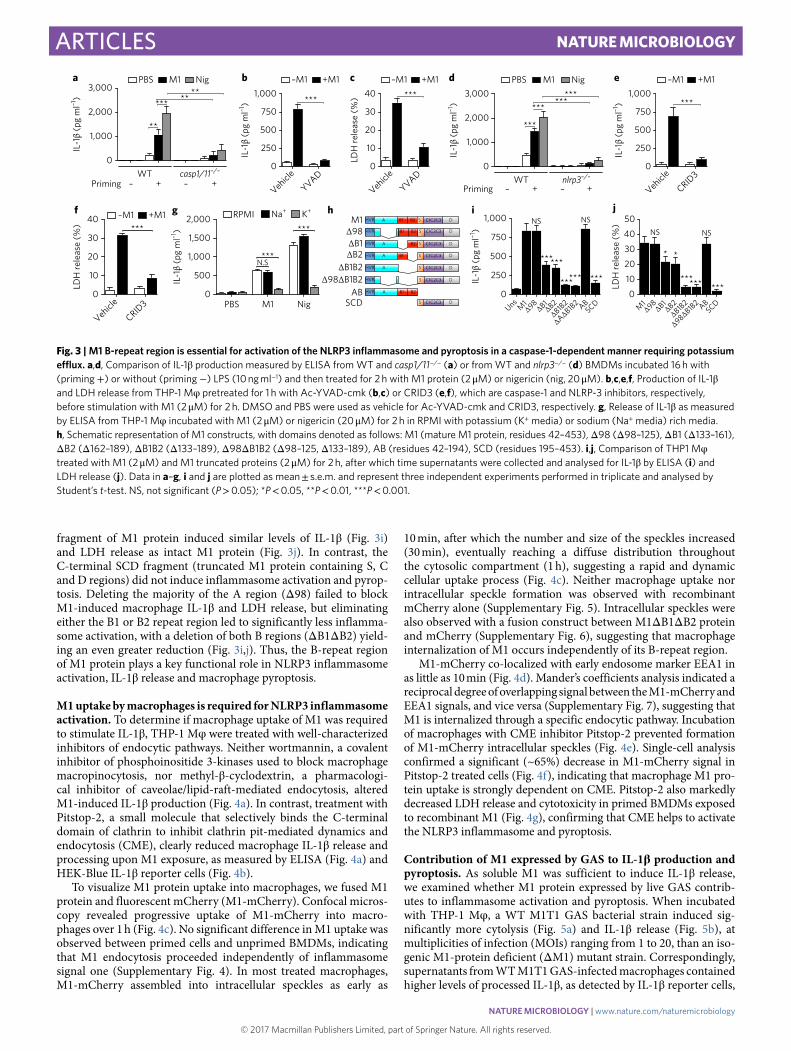
M1 protein strongly induced IL-1β release from primed wild-type (WT) BMDMs but not primed casp1/11−/− BMDMs, which
cannot form functional inflammasomes (Fig. 3a). Nigericin, an ionophore and established canonical NLRP3 inflammasome activa-tor31, served as a positive control in this experiment. Pretreatment of THP-1 Mφ with Ac-YVAD-cmk, a specific and irreversible phar-macological inhibitor of caspase-1, nearly abolished M1-mediated release of IL-1β (Fig. 3b) and macrophage cytolysis (Fig. 3c). Thus, M1 protein-triggered IL-1β release and pyroptosis are caspase-1-dependent.
We found that BMDMs from NLRP3-deficient mice failed to secrete significant IL-1β after M1 stimulation (Fig. 3d). As expected, NLRP3−/− cells stimulated with nigericin also produced minimal IL-1β (Fig. 3d). CRID3, a powerful and specific NLRP3 inhibitor32, also blocked macrophage release of IL-1β (Fig. 3e) and pyroptosis (Fig. 3f) in response to M1 protein. A drop in cytosolic K+ serves as a common step required to activate the NLRP3 inflammasome33. M1-mediated macrophage IL-1β production was markedly reduced when the gradient for K+ efflux was eliminated using K+-rich media (Fig. 3g). This reduction resembled that observed with nigericin (Fig. 3g), whose NLRP3 activation is also mechanistically depen-dent on K+ efflux. M1 thus activates the NLRP3 inflammasome in a scenario involving K+ efflux, activation of caspase-1, processing of pro-IL-1β and secretion of mature IL-1β , all accompanied by mac-rophage pyroptosis.
The B-repeat domain of M1 is critical for NLRP3 inflamma-some activation. To map the domain(s) of M1 protein required for NLRP3 inflammasome activation, we expressed and purified a set of previously described M1 truncations14,34, as depicted schemati-cally in Fig. 3h. Quantifying both IL-1β production and cytotoxic-ity (LDH release) from THP-1 Mφ , we found the N-terminal AB
00.02 0.2 2
0
400
800
1,200
IL-1
β (p
g m
l–1)
M1 (μM)
***
**
*a
00.02 0.2 2
0
2
4
6
8
10
IL-1
β sig
nalli
ng (r
.u.)
M1 (μM)
**
**
***
b
IL-1
β (p
g m
l–1)
UnsM1
M2M4 M5 M6
M22M28
0
250
500
750
1,000 NS NSNS
NS
***
***
c
IL-6
(pg
ml–1
)
0
50
100
150
**
******
NS
UnsM1
LPS
PGN LTA
d
0
200
400
600
800
–M1 +M1
NS
******
*
*** ***
IL-1
β (p
g m
l–1)
UnsLP
S PGN
LTA
R848
Pam3CSK4
e
IL-1
β (p
g m
l–1)
UnsLP
S PGN
LTA
0
250
500
750
1,000
–M1 +M1
NS
NS
NS
NS
f
Fig. 2 | M1 protein provides a second signal that specifically triggers IL-1β signalling. a,b, Total IL-1β (a) and the processed form of IL-1β (b) produced by THP-1 Mφ incubated for 2!h with increasing concentrations of M1 protein, as measured by ELISA or by HEK-Blue IL-1R reporter cells, respectively. r.u., relative units. c, Comparison of total IL-1β measured by ELISA from THP-1 Mφ incubated for 2!h with M1 (2!μ M) or other M proteins (2!μ M). d, IL-6 production assessed by ELISA from THP-1 Mφ that were unstimulated (Uns) or stimulated for 15!h with M1 (0.02!µ M), lipopolysaccharide (LPS, 100!ng!ml−1), peptidoglycan (PGN, 1!μ g!ml−1) or lipoteichoic acid (LTA, 1!μ g!ml−1). e,f, IL-1β release measured by ELISA from mouse BMDMs (e) or human PBMCs (f) that were unprimed (Uns) or primed for 16!h with different TLR agonists: LPS (10!ng!ml−1), PGN (1!μ g!ml−1), LTA (1!μ g!ml−1), R848 (1!μ g!ml−1) or Pam3CSK4 (10!ng!ml−1). BMDMs and PBMCs were then left untreated (− M1) or treated with 2!μ M of M1 protein (+ M1) for 2!h. Data are plotted as mean!± !s.e.m. and represent three independent experiments performed in triplicate and analysed by Student’s t-test. NS, not significant (P!> !0.05); *P!< !0.05, **P!< !0.01, ***P!< !0.001.
NATURE MICROBIOLOGY | www.nature.com/naturemicrobiology
© 2017 Macmillan Publishers Limited, part of Springer Nature. All rights reserved. © 2017 Macmillan Publishers Limited, part of Springer Nature. All rights reserved.
ARTICLES NATURE MICROBIOLOGY
fragment of M1 protein induced similar levels of IL-1β (Fig. 3i) and LDH release as intact M1 protein (Fig. 3j). In contrast, the C-terminal SCD fragment (truncated M1 protein containing S, C and D regions) did not induce inflammasome activation and pyrop-tosis. Deleting the majority of the A region (Δ 98) failed to block M1-induced macrophage IL-1β and LDH release, but eliminating either the B1 or B2 repeat region led to significantly less inflamma-some activation, with a deletion of both B regions (Δ B1Δ B2) yield-ing an even greater reduction (Fig. 3i,j). Thus, the B-repeat region of M1 protein plays a key functional role in NLRP3 inflammasome activation, IL-1β release and macrophage pyroptosis.
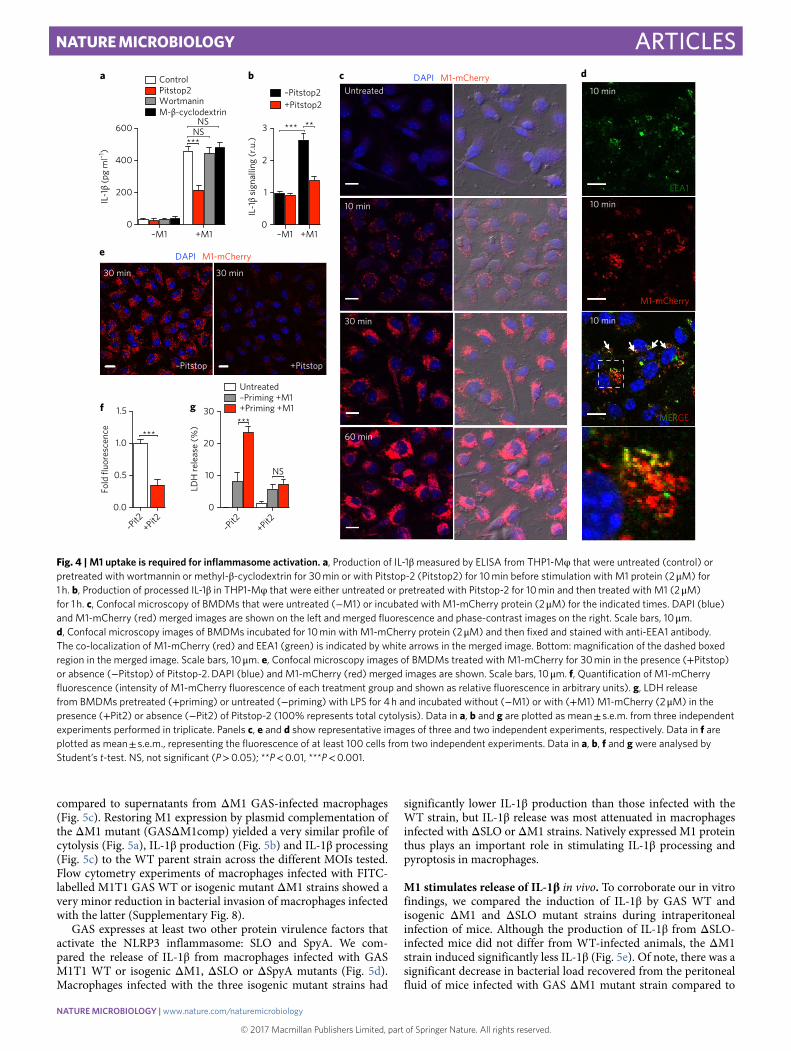
M1 uptake by macrophages is required for NLRP3 inflammasome activation. To determine if macrophage uptake of M1 was required to stimulate IL-1β , THP-1 Mφ were treated with well-characterized inhibitors of endocytic pathways. Neither wortmannin, a covalent inhibitor of phosphoinositide 3-kinases used to block macrophage macropinocytosis, nor methyl-β -cyclodextrin, a pharmacologi-cal inhibitor of caveolae/lipid-raft-mediated endocytosis, altered M1-induced IL-1β production (Fig. 4a). In contrast, treatment with Pitstop-2, a small molecule that selectively binds the C-terminal domain of clathrin to inhibit clathrin pit-mediated dynamics and endocytosis (CME), clearly reduced macrophage IL-1β release and processing upon M1 exposure, as measured by ELISA (Fig. 4a) and HEK-Blue IL-1β reporter cells (Fig. 4b).
To visualize M1 protein uptake into macrophages, we fused M1 protein and fluorescent mCherry (M1-mCherry). Confocal micros-copy revealed progressive uptake of M1-mCherry into macro-phages over 1 h (Fig. 4c). No significant difference in M1 uptake was observed between primed cells and unprimed BMDMs, indicating that M1 endocytosis proceeded independently of inflammasome signal one (Supplementary Fig. 4). In most treated macrophages, M1-mCherry assembled into intracellular speckles as early as
10 min, after which the number and size of the speckles increased (30 min), eventually reaching a diffuse distribution throughout the cytosolic compartment (1 h), suggesting a rapid and dynamic cellular uptake process (Fig. 4c). Neither macrophage uptake nor intracellular speckle formation was observed with recombinant mCherry alone (Supplementary Fig. 5). Intracellular speckles were also observed with a fusion construct between M1Δ B1Δ B2 protein and mCherry (Supplementary Fig. 6), suggesting that macrophage internalization of M1 occurs independently of its B-repeat region.
M1-mCherry co-localized with early endosome marker EEA1 in as little as 10 min (Fig. 4d). Mander’s coefficients analysis indicated a reciprocal degree of overlapping signal between the M1-mCherry and EEA1 signals, and vice versa (Supplementary Fig. 7), suggesting that M1 is internalized through a specific endocytic pathway. Incubation of macrophages with CME inhibitor Pitstop-2 prevented formation of M1-mCherry intracellular speckles (Fig. 4e). Single-cell analysis confirmed a significant (~65%) decrease in M1-mCherry signal in Pitstop-2 treated cells (Fig. 4f), indicating that macrophage M1 pro-tein uptake is strongly dependent on CME. Pitstop-2 also markedly decreased LDH release and cytotoxicity in primed BMDMs exposed to recombinant M1 (Fig. 4g), confirming that CME helps to activate the NLRP3 inflammasome and pyroptosis.
Contribution of M1 expressed by GAS to IL-1β production and pyroptosis. As soluble M1 was sufficient to induce IL-1β release, we examined whether M1 protein expressed by live GAS contrib-utes to inflammasome activation and pyroptosis. When incubated with THP-1 Mφ , a WT M1T1 GAS bacterial strain induced sig-nificantly more cytolysis (Fig. 5a) and IL-1β release (Fig. 5b), at multiplicities of infection (MOIs) ranging from 1 to 20, than an iso-genic M1-protein deficient (Δ M1) mutant strain. Correspondingly, supernatants from WT M1T1 GAS-infected macrophages contained higher levels of processed IL-1β , as detected by IL-1β reporter cells,
IL-1
β (p
g m
l–1)
IL-1
β (p
g m
l–1)
IL-1
β (p
g m
l–1)
IL-1
β (p
g m
l–1)
IL-1
β (p
g m
l–1)
IL-1
β (p
g m
l–1)
PBS M1 Nig
**
*** ** **
WT casp1/11–/–
Priming –+ +–
0
1,000
2,000
3,000PBS M1 Nig
Priming –+ +–
****** ******
WT nlrp3–/–0
250
500
750
1,000–M1 +M1
***
0
250
500
750
1,000–M1 +M1
***
VehicleYVAD
Vehicle
CRID3
VehicleYVAD
0
10
20
30
40–M1 +M1
***
0
1,000
2,000
3,000a
f g h i j
b c d e
0
10
20
30
40
LDH
rele
ase
(%)
LDH
rele
ase
(%)
LDH
rele
ase
(%)
–M1 +M1***
Vehicle
CRID3 PBS M1 Nig
0
500
1,000
1,500
2,000 RPMI Na+ K+
***
***
N.S
HVR A B1 B2 S C1C2C3 D
B1 B2 S C1C2C3 DHVR
HVR A B2 S C1C2C3 D
A B1 S C1C2C3 DHVR
HVR A B1 B2
S C1C2C3 D
S C1C2C3 DHVR
A S C1C2C3 DHVR
M1Δ98ΔB1ΔB2
ABSCD
Δ98ΔB1B2ΔB1B2
01020304050
NS
******
* *
NS
***
M1Δ98
ΔB1ΔB2
ΔB1B2
Δ98ΔB1B2 ABSCDUns
M1Δ98
ΔB1ΔB2
ΔB1B2
ΔAΔB1B2 ABSCD
0
250
500
750
1,000 NS NS
***
******
******
Fig. 3 | M1 B-repeat region is essential for activation of the NLRP3 inflammasome and pyroptosis in a caspase-1-dependent manner requiring potassium efflux. a,d, Comparison of IL-1β production measured by ELISA from WT and casp1/11−/− (a) or from WT and nlrp3−/− (d) BMDMs incubated 16!h with (priming + ) or without (priming − ) LPS (10!ng!ml−1) and then treated for 2!h with M1 protein (2!μ M) or nigericin (nig, 20!μ M). b,c,e,f, Production of IL-1β and LDH release from THP-1 Mφ pretreated for 1!h with Ac-YVAD-cmk (b,c) or CRID3 (e,f), which are caspase-1 and NLRP-3 inhibitors, respectively, before stimulation with M1 (2!μ M) for 2!h. DMSO and PBS were used as vehicle for Ac-YVAD-cmk and CRID3, respectively. g, Release of IL-1β as measured by ELISA from THP-1 Mφ incubated with M1 (2!μ M) or nigericin (20!μ M) for 2!h in RPMI with potassium (K+ media) or sodium (Na+ media) rich media. h, Schematic representation of M1 constructs, with domains denoted as follows: M1 (mature M1 protein, residues 42–453), Δ 98 (Δ 98–125), Δ B1 (Δ 133–161), Δ B2 (Δ 162–189), Δ B1B2 (Δ 133–189), Δ 98Δ B1B2 (Δ 98–125, Δ 133–189), AB (residues 42–194), SCD (residues 195–453). i,j, Comparison of THP1 Mφ treated with M1 (2!μ M) and M1 truncated proteins (2!μ M) for 2!h, after which time supernatants were collected and analysed for IL-1β by ELISA (i) and LDH release (j). Data in a–g, i and j are plotted as mean!± !s.e.m. and represent three independent experiments performed in triplicate and analysed by Student’s t-test. NS, not significant (P!> !0.05); *P!< !0.05, **P!< !0.01, ***P!< !0.001.
NATURE MICROBIOLOGY | www.nature.com/naturemicrobiology
© 2017 Macmillan Publishers Limited, part of Springer Nature. All rights reserved. © 2017 Macmillan Publishers Limited, part of Springer Nature. All rights reserved.
ARTICLESNATURE MICROBIOLOGY
compared to supernatants from Δ M1 GAS-infected macrophages (Fig. 5c). Restoring M1 expression by plasmid complementation of the Δ M1 mutant (GASΔ M1comp) yielded a very similar profile of cytolysis (Fig. 5a), IL-1β production (Fig. 5b) and IL-1β processing (Fig. 5c) to the WT parent strain across the different MOIs tested. Flow cytometry experiments of macrophages infected with FITC-labelled M1T1 GAS WT or isogenic mutant Δ M1 strains showed a very minor reduction in bacterial invasion of macrophages infected with the latter (Supplementary Fig. 8).
GAS expresses at least two other protein virulence factors that activate the NLRP3 inflammasome: SLO and SpyA. We com-pared the release of IL-1β from macrophages infected with GAS M1T1 WT or isogenic Δ M1, Δ SLO or Δ SpyA mutants (Fig. 5d). Macrophages infected with the three isogenic mutant strains had
significantly lower IL-1β production than those infected with the WT strain, but IL-1β release was most attenuated in macrophages infected with Δ SLO or Δ M1 strains. Natively expressed M1 protein thus plays an important role in stimulating IL-1β processing and pyroptosis in macrophages.
M1 stimulates release of IL-1β in vivo. To corroborate our in vitro findings, we compared the induction of IL-1β by GAS WT and isogenic Δ M1 and Δ SLO mutant strains during intraperitoneal infection of mice. Although the production of IL-1β from Δ SLO-infected mice did not differ from WT-infected animals, the Δ M1 strain induced significantly less IL-1β (Fig. 5e). Of note, there was a significant decrease in bacterial load recovered from the peritoneal fluid of mice infected with GAS Δ M1 mutant strain compared to
–Pit2
+Pit20.0
0.5
1.0
1.5
Fold
fluo
resc
ence ***
e
f g
EEA1
M1-mCherry
MERGE
+Pitstop
–M1 +M10
200
400
600
IL-1
β (p
g m
l–1)
ControlPitstop2WortmaninM-β-cyclodextrin
***NS
NS
–M1 +M10
1
2
3
IL-1
β sig
nalli
ng (r
.u.)
–Pitstop2+Pitstop2
*** **
30 min30 min
10 min
10 min
10 min
–Pit2
+Pit20
10
20
30
LDH
rele
ase
(%)
Untreated–Priming +M1+Priming +M1
***
NS
a b c dUntreated
10 min
30 min
60 min
–Pitstop
DAPI M1-mCherry
DAPI M1-mCherry
Fig. 4 | M1 uptake is required for inflammasome activation. a, Production of IL-1β measured by ELISA from THP1-Mφ that were untreated (control) or pretreated with wortmannin or methyl-β -cyclodextrin for 30!min or with Pitstop-2 (Pitstop2) for 10!min before stimulation with M1 protein (2!μ M) for 1!h. b, Production of processed IL-1β in THP1-Mφ that were either untreated or pretreated with Pitstop-2 for 10!min and then treated with M1 (2!μ M) for 1!h. c, Confocal microscopy of BMDMs that were untreated (− M1) or incubated with M1-mCherry protein (2!μ M) for the indicated times. DAPI (blue) and M1-mCherry (red) merged images are shown on the left and merged fluorescence and phase-contrast images on the right. Scale bars, 10!μ m. d, Confocal microscopy images of BMDMs incubated for 10!min with M1-mCherry protein (2!μ M) and then fixed and stained with anti-EEA1 antibody. The co-localization of M1-mCherry (red) and EEA1 (green) is indicated by white arrows in the merged image. Bottom: magnification of the dashed boxed region in the merged image. Scale bars, 10!μ m. e, Confocal microscopy images of BMDMs treated with M1-mCherry for 30!min in the presence (+ Pitstop) or absence (− Pitstop) of Pitstop-2. DAPI (blue) and M1-mCherry (red) merged images are shown. Scale bars, 10!μ m. f, Quantification of M1-mCherry fluorescence (intensity of M1-mCherry fluorescence of each treatment group and shown as relative fluorescence in arbitrary units). g, LDH release from BMDMs pretreated (+ priming) or untreated (− priming) with LPS for 4!h and incubated without (− M1) or with (+ M1) M1-mCherry (2!μ M) in the presence (+ Pit2) or absence (− Pit2) of Pitstop-2 (100% represents total cytolysis). Data in a, b and g are plotted as mean!± !s.e.m. from three independent experiments performed in triplicate. Panels c, e and d show representative images of three and two independent experiments, respectively. Data in f are plotted as mean!± !s.e.m., representing the fluorescence of at least 100 cells from two independent experiments. Data in a, b, f and g were analysed by Student’s t-test. NS, not significant (P!> !0.05); **P!< !0.01, ***P!< !0.001.
NATURE MICROBIOLOGY | www.nature.com/naturemicrobiology
© 2017 Macmillan Publishers Limited, part of Springer Nature. All rights reserved. © 2017 Macmillan Publishers Limited, part of Springer Nature. All rights reserved.
ARTICLES NATURE MICROBIOLOGY
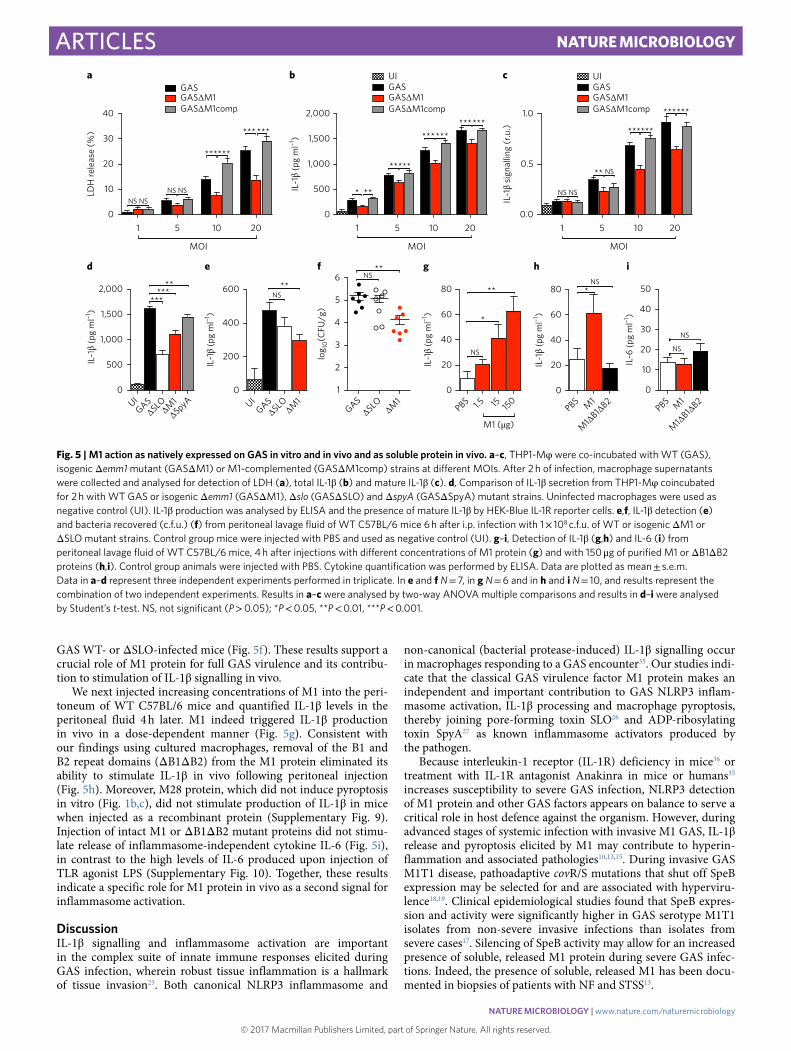
GAS WT- or Δ SLO-infected mice (Fig. 5f). These results support a crucial role of M1 protein for full GAS virulence and its contribu-tion to stimulation of IL-1β signalling in vivo.
We next injected increasing concentrations of M1 into the peri-toneum of WT C57BL/6 mice and quantified IL-1β levels in the peritoneal fluid 4 h later. M1 indeed triggered IL-1β production in vivo in a dose-dependent manner (Fig. 5g). Consistent with our findings using cultured macrophages, removal of the B1 and B2 repeat domains (Δ B1Δ B2) from the M1 protein eliminated its ability to stimulate IL-1β in vivo following peritoneal injection (Fig. 5h). Moreover, M28 protein, which did not induce pyroptosis in vitro (Fig. 1b,c), did not stimulate production of IL-1β in mice when injected as a recombinant protein (Supplementary Fig. 9). Injection of intact M1 or Δ B1Δ B2 mutant proteins did not stimu-late release of inflammasome-independent cytokine IL-6 (Fig. 5i), in contrast to the high levels of IL-6 produced upon injection of TLR agonist LPS (Supplementary Fig. 10). Together, these results indicate a specific role for M1 protein in vivo as a second signal for inflammasome activation.
DiscussionIL-1β signalling and inflammasome activation are important in the complex suite of innate immune responses elicited during GAS infection, wherein robust tissue inflammation is a hallmark of tissue invasion23. Both canonical NLRP3 inflammasome and
non-canonical (bacterial protease-induced) IL-1β signalling occur in macrophages responding to a GAS encounter35. Our studies indi-cate that the classical GAS virulence factor M1 protein makes an independent and important contribution to GAS NLRP3 inflam-masome activation, IL-1β processing and macrophage pyroptosis, thereby joining pore-forming toxin SLO26 and ADP-ribosylating toxin SpyA27 as known inflammasome activators produced by the pathogen.
Because interleukin-1 receptor (IL-1R) deficiency in mice36 or treatment with IL-1R antagonist Anakinra in mice or humans35 increases susceptibility to severe GAS infection, NLRP3 detection of M1 protein and other GAS factors appears on balance to serve a critical role in host defence against the organism. However, during advanced stages of systemic infection with invasive M1 GAS, IL-1β release and pyroptosis elicited by M1 may contribute to hyperin-flammation and associated pathologies10,13,15. During invasive GAS M1T1 disease, pathoadaptive covR/S mutations that shut off SpeB expression may be selected for and are associated with hyperviru-lence18,19. Clinical epidemiological studies found that SpeB expres-sion and activity were significantly higher in GAS serotype M1T1 isolates from non-severe invasive infections than isolates from severe cases17. Silencing of SpeB activity may allow for an increased presence of soluble, released M1 protein during severe GAS infec-tions. Indeed, the presence of soluble, released M1 has been docu-mented in biopsies of patients with NF and STSS13.
1 5 10 20
MOI
GASGASΔM1GASΔM1comp
NS NSNS NS
******
******
NS*
NS
*
**
IL-6
(pg
ml–1
)
0
10
20
30
40
50
NS
NS
LDH
rele
ase
(%)
1 5 10 200.0
0.5
1.0
MOI
NS NS
NS**
******
******
GASGASΔM1GASΔM1comp
UI
IL-1
β sig
nalli
ng (r
.u.)
1 5 10 200
500
1,000
1,500
2,000
MOI
GASGASΔM1GASΔM1comp
UI
* **
*****
************
IL-1
β (p
g m
l–1)
0
20
40
60
80
IL-1
β (p
g m
l–1)
0
20
40
60
80
IL-1
β (p
g m
l–1)
1
2
3
4
5
6
log 10
(CFU
/g)
NS**
IL-1
β (p
g m
l–1)
0
200
400
600NS
**
PBS M1
M1ΔB1ΔB2PBS 1.5 15 150
M1 (μg)PBS M1
M1ΔB1ΔB2GAS
ΔSLO ΔM1UIGAS
ΔSLO ΔM1
0
10
20
30
40
a
d e f g h i
b cIL
-1β
(pg
ml–1
)
UIGAS
ΔSLOΔM1ΔSpyA
0
500
1,000
1,500
2,000 *****
***
Fig. 5 | M1 action as natively expressed on GAS in vitro and in vivo and as soluble protein in vivo. a–c, THP1-Mφ were co-incubated with WT (GAS), isogenic Δ emm1 mutant (GASΔ M1) or M1-complemented (GASΔ M1comp) strains at different MOIs. After 2!h of infection, macrophage supernatants were collected and analysed for detection of LDH (a), total IL-1β (b) and mature IL-1β (c). d, Comparison of IL-1β secretion from THP1-Mφ coincubated for 2!h with WT GAS or isogenic Δ emm1 (GASΔ M1), Δ slo (GASΔ SLO) and Δ spyA (GASΔ SpyA) mutant strains. Uninfected macrophages were used as negative control (UI). IL-1β production was analysed by ELISA and the presence of mature IL-1β by HEK-Blue IL-1R reporter cells. e,f, IL-1β detection (e) and bacteria recovered (c.f.u.) (f) from peritoneal lavage fluid of WT C57BL/6 mice 6!h after i.p. infection with 1!× !108!c.f.u. of WT or isogenic Δ M1 or Δ SLO mutant strains. Control group mice were injected with PBS and used as negative control (UI). g–i, Detection of IL-1β (g,h) and IL-6 (i) from peritoneal lavage fluid of WT C57BL/6 mice, 4!h after injections with different concentrations of M1 protein (g) and with 150!μ g of purified M1 or Δ B1Δ B2 proteins (h,i). Control group animals were injected with PBS. Cytokine quantification was performed by ELISA. Data are plotted as mean!± !s.e.m. Data in a–d represent three independent experiments performed in triplicate. In e and f N!= !7, in g N!= !6 and in h and i N!= !10, and results represent the combination of two independent experiments. Results in a–c were analysed by two-way ANOVA multiple comparisons and results in d–i were analysed by Student’s t-test. NS, not significant (P!> !0.05); *P!< !0.05, **P!< !0.01, ***P!< !0.001.
NATURE MICROBIOLOGY | www.nature.com/naturemicrobiology

© 2017 Macmillan Publishers Limited, part of Springer Nature. All rights reserved. © 2017 Macmillan Publishers Limited, part of Springer Nature. All rights reserved.
ARTICLESNATURE MICROBIOLOGY
Our in vitro experiments examining macrophages infected with live WT or M1-deficient GAS bacterial strains show a significant contribution of natively expressed M1 protein in the induction of IL-1β and pyroptosis. In our studies, the presence of M1 was not a strong factor in establishing initial interaction with macrophages compared to its known role in adhesion or invasion of epithelial cell types, emphasizing the dominance of M1 action on the inflam-masome as compared to other known M1 properties in our assays. Production of IL-1β during GAS infection in vivo was greater when M1 was present, although the bacterial load was significantly lower in the absence of the protein. However, purified M1 protein alone, injected in vivo, was sufficient to induce the production of IL-1β , suggesting that soluble M1 induces IL-1β signalling independently of its other well-known virulence properties.
In contrast to the two signals required in vitro for M1-induction of IL-1β , M1 alone was sufficient to stimulate the IL-1β response in vivo. We hypothesize that in the latter case, macrophages are intrinsically stimulated by cellular processes such as metabolic activation elicited by the thioglycollate pre-treatment in our in vivo experiments, or alternatively that M1 may activate host-derived pro-inflammatory factors facilitating signal 1 priming. The latter mechanism is consis-tent with recent studies, which have shown that keratinocytes recog-nize soluble M1 as a PAMP to release interleukin-8, growth-related oncogene-alpha, migration inhibitory factor and other inflammatory response alarms37. Another study reported that M1 protein can syn-ergize with heparin-binding protein to interact with TLR2 on mono-cytes and promote release of IL-1β and IL-638, which differs somewhat from our findings showing no effect of M1 protein on IL-6 produc-tion in vitro or in vivo. This difference probably reflects the source of the protein in each study: purified recombinant M1 protein in the present work versus M1 protein purified from GAS supernatants in the aforementioned study. Our studies suggest that M1, per se, is not a direct TLR agonist as proposed earlier; however, during GAS infec-tion, release of M1 protein complexed with peptidoglycan (PGN) or lipoteichoic acid (LTA) to serve as PAMPs may contribute to the acti-vation of TLRs and consequent accelerated cytokine production.
CME, which constitutes the major and best-characterized endocytic pathway, carries out the continuous uptake of essential nutrients, antigens, growth factors and pathogens. Our study dem-onstrates that CME contributes to M1 uptake and that a specific clathrin inhibitor blocks M1 uptake to reduce NLRP3 activation, IL-1β production and pyroptosis. Human immunodeficiency virus and hepatitis C virus were recently shown to activate the inflam-masome by CME-dependent mechanisms39. Furthermore, muramyl dipeptide, a bacterially derived agonist of the NOD2 receptor that induces caspase-1 activation through the NLRP3 inflammasome, is internalized by macrophages through CME40. The mechanism by which M1 is targeted into clathrin-coated pits is at present unclear, but warrants further study as it may reveal mechanistic common-alities for inflammasome activation. Because the first step of inter-nalization through CME usually involves binding of a ligand to a specific membrane receptor, our studies suggest that M1 is recog-nized by a host factor expressed by macrophages.
The M1 B-repeat region serves an essential function in GAS pathogenesis, as it is responsible for M1 binding to host fibrinogen (Fg) and the formation of supramolecular M1–Fg complexes that induce neutrophil activation and transition to a proinflammatory state14,41. Based on these previous studies and taking into account our new findings, a potential scenario during GAS invasive infec-tion is that released, soluble M1 protein first activates infiltrating neutrophils through the M1-Fg supramolecular complex, resulting in the recruitment and influx of macrophages to the site. Released, soluble M1 would then act in a Fg-independent manner on these macrophages, causing pyroptotic cell death. Our studies provide evidence that the M1 B-repeat region is a multifunctional domain that plays an essential role in M1-induced inflammation.
Comparison of the inflammasome-activating effect of M1 to other M proteins suggests that the activation of NLRP3 and the consequent cell death is not unique to the M1 serotype, but is not a general property of all M protein serotypes. Due to the pronounced hypervariability of the N-terminal domain (B-repeats included) across M proteins, a single common pattern for the M proteins that activates IL-1β is unlikely. However, it has recently been recognized by X-ray crystallography that the three-dimensional structure of different M proteins in complex with host factors may reveal con-served sequence patterns hidden within hypervariability42.
K+ efflux is a common mechanism required for NLRP3 acti-vation33, and we confirmed that M1-induced inflammasome activation also requires K+ efflux. Further studies are required to understand the exact molecular mechanism that triggers K+ efflux and downstream mechanisms of NLRP3 activation upon M1 uptake. Components or by-products from the depolymeriza-tion of clathrin-coated pits, the subsequent transition from early to late endosomes, or the final fusion with recycling lysosomes are potentially important for the molecular mechanism of M1-induced NLRP3 activation. Indeed, the NLRP3 inflammasome may detect internal membrane perturbations and thereby respond to many dif-ferent stimuli, which all have in common the ability to induce lyso-somal destabilization43.
SpeBNeutrophil proteases
Surface M1
ReleasedM1
DNAdamage
CME
GAS
Signal 1Signal 2
LTA, PGN
InactiveNLRP3
?
K+
ActiveNLRP3
ASCCaspase-1
TLRsK+
Pyroptosis
IL-1β Pro-IL-1β
Transcriptionactivation
mRNA
IL-1β
Fig. 6 | Model of M1 protein-mediated NLRP3 inflammasome activation and pyroptosis. M1-mediated activation of the NLRP3 inflammasome requires two signals. The first signal is essential for stimulating increased transcriptional levels of inflammasome components and arises from the binding of pathogen-associated molecular pattern (PAMP) or damage-associated molecular pattern (DAMP) molecules, such as peptidoglycan (PGN) or lipoteichoic acid (LTA) on the GAS cell wall, to specific receptors, such as toll-like receptors (TLRs). Increased availability of released M1 (second signal) is likely to occur after down-regulation of the bacterial protease SpeB, by the activity of neutrophil proteases, or both. M1 is taken up by macrophages through clathrin-mediated endocytosis (CME), after interaction with a potential surface receptor. Once internalized, M1 activates the assembly and activation of the NLRP3 inflammasome and triggers potassium efflux (K+ efflux) through an unknown mechanism (?). Assembly of the inflammasome leads to the processing of pro-IL-1β to mature IL-1β and results in DNA damage and pyroptotic cell death in macrophages.
NATURE MICROBIOLOGY | www.nature.com/naturemicrobiology
© 2017 Macmillan Publishers Limited, part of Springer Nature. All rights reserved. © 2017 Macmillan Publishers Limited, part of Springer Nature. All rights reserved.
ARTICLES NATURE MICROBIOLOGY
In summary, we propose a model for GAS M1-dependent inflammasome activation and pyroptosis in macrophages (Fig. 6). Upon GAS tissue invasion, bacteria-derived PAMPs (for example, PGN or LTA) or host-derived DAMPs generated upon tissue injury are recognized by the macrophage through different mechanisms, including TLRs. These first signals activate the transcription of genes encoding NLRP3 inflammasome components and pro-IL-1β . M1 may be released from the GAS surface by cell wall turnover, host neutrophil proteases, or both13,16,17, and is taken up by macrophages via CME to serve as a second signal required for NLRP3 activation. Internalization of M1 activates NLRP3 through an unknown sub-cellular molecular intermediate or event, for example, lysosomal destabilization, triggering K+ efflux and promoting inflammasome assembly by recruitment of NLRP3, its well-characterized apopto-sis-associated speck-like accessory protein (ASC) and caspase-1, resulting in the maturation and secretion of the pro-inflammatory cytokine IL-1β , DNA damage, membrane disruption and pyroptosis in macrophages. This work reveals an unexpected function in GAS molecular pathogenesis for the M protein, the most abundant pro-tein on the GAS surface, with multifaceted roles in virulence and as a target of host immunity.
MethodsReagents and inhibitors. Lipopolysaccharide from E. coli serotype EH100(Ra) was purchased from Enzo. Lipoteichoic acid from Bacillus subtilis, peptidoglycan from Staphylococcus aureus, R848 and Pam3CSK4 were purchased from Invivogen. Ac-YVAD-CMK (inhibitor of caspase-1) and CRID 3 (inhibitor of NLRP3) were purchased from Enzo and Tocris, respectively. Recombinant mCherry was purchased from BioVision. Pitstop-2 was purchased from Abcam. Wortmannin, methyl-β -cyclodextrin, ATP, nigericin and human fibrinogen were purchased from Sigma.
Cell isolation and culture. BMDMs were generated as previously described44 from the femurs and tibias of 8- to 12-week-old male or female WT C57BL/6 (Jackson Laboratory), casp-1/11−/− (provided by R. Flavell), or nlrp3−/− (provided by J. Bertin) mice. The human THP-1 monocytes cell line was provided and authenticated by ATCC and stored at the UCSD cell culture facility, which routinely carried out surveillance mycoplasma testing of its facility. THP-1 cells were cultured in Roswell Park Memorial Institute (RPMI) medium supplemented with 10% fetal bovine serum (FBS), 0.05 mM 2-mercaptoethanol, 0.2% d-glucose, 10 mM HEPES and 1 mM sodium pyruvate. Human THP-1 Mφ were differentiated for 24 h with 25 nM phorbol myristate acetate (PMA) (Fisher). Primary human neutrophils, PBMCs and red blood cells were isolated from small volumes of whole blood from healthy volunteers after informed consent, following a protocol for simple phlebotomy approved by the UCSD IRB/Human Research Protection Program. Cell isolation was achieved using one-step Polymorph according to the manufacturer’s instructions (Accurate Chemical and Scientific Corporation). A549 human epithelial cells were cultured in 10% FBS–RPMI medium. All experiments with THP-1 Mφ and BMDMs were performed in 2% FBS–RPMI medium, except for the experiment in which potassium efflux was inhibited. In this experiment, cells were stimulated in K+-rich medium (serum-free buffer with 10 mM HEPES, 150 mM KCl, 5 mM NaH2PO4, 150 mM NaCl, 1 mM MgCl2, 1 mM CaCl2, 1% BSA, pH 7.4) or in Na+ medium (serum-free buffer with 10 mM HEPES, 150 mM NaCl, 5 mM KH2PO4, 1 mM MgCl2, 1 mM CaCl2, 1% BSA, pH 7.4).
Animal experiments. The UCSD Institutional Animal Care and Use Committee approved all animal use and procedures. In compliance with ethical guidelines, to minimize the number of animals, we used a minimum of five mice for each data point (except where indicated in the figure legends) to ensure statistical power. All mice were randomly distributed into the different groups as indicated in the corresponding figure legend. No blinding was performed in the animal work. For GAS infection, 8- to 10-week-old C57BL/6 female mice were injected intraperitoneally (i.p.) with 100 μ l phosphate buffered saline (PBS) as control group or with 100 μ l PBS containing 1 × 10⁸ colony-forming units (c.f.u.) of various GAS strains. For soluble M protein injection, 8- to 10-week-old C57BL/6 male or female mice were i.p. injected with 2 ml of 3% thioglycolate (Difco) to elicit peritoneal macrophages. At 72 h post-treatment, mice were injected with different amounts of M protein in 100 µ l PBS. At 4 h (M protein treatment) or 6 h (bacterial infection), mice were euthanized with isoflurane followed by cervical dislocation. Post-mortem, peritoneal fluid was collected by lavage with 3 ml sterile PBS, followed by massage. Cytokines and bacterial counts in the peritoneal fluid collected were quantified by ELISA and c.f.u., respectively.
Bacterial strains and culture conditions. GAS M1T1 5448 was originally isolated from a patient with necrotizing fasciitis and toxic shock44. The isogenic in-frame
allelic exchange knockout mutant 5448Δ emm1 (Δ M1) and its complemented strain have been described previously45 as well as the knockout mutants 5448Δ slo (Δ SLO)46 and 5448Δ spyA (Δ SpyA)27. All GAS strains were routinely propagated at 37 °C on Todd–Hewitt agar (Difco) or in static liquid cultures of Todd–Hewitt broth. Where appropriate, strains were grown in medium supplemented with 5 μ g ml–1 erythromycin or 2 μ g ml–1 chloramphenicol.
Infection of macrophages with GAS. THP-1 Mφ were seeded at 5 × 10⁵ cells in 600 μ l of RPMI–2% FBS in a 12-well plate. Macrophages were infected with overnight bacterial cultures diluted in 100 μ l of RPMI–2% FBS at MOIs of 1, 5, 10 or 20. Plates were centrifuged at 600g for 5 min to facilitate bacterial contact with macrophages. Cells were incubated at 37 °C for 2 h. Supernatants were collected by centrifugation (600g for 5 min at room temperature) and analysed for LDH release, total IL-1β production and IL-1β signalling. For GAS invasion experiments, stationary phase bacteria were labelled with FITC through 30 min incubation with 0.2 mg ml–1 FITC, covered on ice, and washed with PBS. PMA-differentiated THP-1 Mφ were co-incubated with FITC-labelled bacteria at an MOI of 10 in RPMI containing 2% FBS for 2 h. Macrophages were dissociated with trypsin–EDTA, washed in PBS supplemented with 0.5% FBS, and immediately run on FACSCalibur (BD Biosciences). Ten thousand events were collected, and samples were gated for live macrophages based on unlabelled bacteria-infected controls. Flow cytometry data were analysed using FlowJo v.9.4.10 (Tree Star).
LDH assay and ELISA. Cell culture supernatants were collected by centrifugation at 500g for 5 min at 20 °C and analysed with a Cytotox 96 Non-Radioactive Cytotoxicity Assay (Promega). Procedures and calculations of LDH release percentage (%LDH) were performed according to the manufacturer’s directions. Cell culture supernatants were assayed for human or murine IL-1β or IL-6 with ELISA kits following the manufacturer’s instructions (R&D Systems).
IL-1β signalling assay. Stably transfected HEK-Blue IL-1β reporter cells (Invivogen) (50,000 cells per well in 96-well plates), were stimulated for 16 h at 37 °C in 5% CO2 with 50 μ l supernatants from macrophages previously treated or infected under the conditions indicated for each experiment. After 18 h, supernatants from the HEK-Blue cells were analysed for secreted alkaline phosphatase activity by the addition of 50 μ l HEK-Blue IL-1β reporter cell supernatants onto 150 μ l of Quanti-Blue reagent (Invivogen) and monitoring the optical density at 620 nm with an EnSpire plate reader (PerkinElmer).
Confocal and fluorescence microscopy. BMDMs were seeded on coverslips in 24-well plates. Cells were primed with LPS (10 ng ml−1) for 4 h. As appropriate, cells were pretreated with Pitstop-2 (25 μ M) or with vehicle control (dimethyl sulfoxide, DMSO) for 10 min and then stimulated with M1-mCherry protein (2 μ M) for 10, 30 or 60 min. After these treatments, cells were washed twice with PBS and fixed with 4% paraformaldehyde for 20 min. After fixation, cells were washed three times with PBS and coverslips were mounted with ProLong Gold antifade reagent containing DAPI (Life Technologies). To quantify the M1-mCherry signal, in-focus planes were analysed with ImageJ (v.2.0.0, NIH) as previously described47. An outline of the cell was drawn and measurements of cell area, mean fluorescence and integrated density were recorded. For local background subtraction, the mean fluorescence of four regions surrounding each cell was also recorded. The total corrected cellular fluorescence (TCCF) was calculated as TCCF = integrated density – (area of selected cell × mean fluorescence of background readings) and reported as relative fluorescence. For co-localization analysis, BMDMs were incubated with 2 μ M of purified M1 protein resuspended in RPMI medium (no phenol red, Gibco) for 10 min. After treatment, cells were washed twice with PBS to remove unbound protein and then fixed with 4% paraformaldehyde for 20 min. After fixation, cells were washed three times with PBS and then permeabilized with PBS + 0.2% Triton X-100 for 30 min. Coverslips were then blocked for 1 h in 3% BSA/1× PBS + 0.02% sodium azide. Staining was performed by incubation with anti-EEA1 antibody (BD biosciences), resuspended in 3% BSA/1× PBS + 0.02% sodium azide for 1 h. Coverslips were then washed three times with PBS and incubated for 1 h with 0.4 μ g ml–1 AlexaFluor-488-conjugated anti-mouse secondary antibody (Life Technologies). Coverslips were again washed three times with PBS and stained with 1 μ g ml–1 Hoechst dye (Life Technologies). After three additional PBS washes, coverslips were mounted onto slides using ProLong Gold antifade reagent (Life Technologies). Co-localization analysis was performed with ImageJ (v.2.0.0, NIH) using the Coloc2 plugin. Cells were visualized using an Olympus FV1000 confocal microscope or a Zeiss Axio Observer.D1 fluorescence microscope.
Propidium iodide uptake assay. THP-1 Mφ were incubated in the presence or absence of purified M1 protein (2 μ M) for 2 h in RPMI containing 2% FBS. Cells were washed three times with PBS, incubated in 200 μ l PI staining solution (1% BSA and 3 μ M PI, Invitrogen) and were visualized using a Zeiss Axio Observer.D1 microscope with an AxioCamMR3 camera. To quantify the number of cells that had taken up PI, THP-1 Mφ were collected by incubating the cells for 5 min at 37 °C with cold PBS containing 5 mM EDTA, washed three times with PBS, incubated in 500 μ l PI staining solution, and analysed by flow cytometry.
NATURE MICROBIOLOGY | www.nature.com/naturemicrobiology
© 2017 Macmillan Publishers Limited, part of Springer Nature. All rights reserved. © 2017 Macmillan Publishers Limited, part of Springer Nature. All rights reserved.
ARTICLESNATURE MICROBIOLOGY
Mean fluorescence intensity was calculated from a total of 10,000 cells, and macrophages treated with PBS alone were used as negative control. Flow cytometry data were analysed with FlowJo v.9.4.10 (Tree Star).
TUNEL assay. THP-1 Mφ were incubated for 4 h in the presence or absence of purified M1 protein (0.2 μ M or 2 μ M). Cells were detached from the well by incubation for 5 min at 37 °C with cold PBS containing 5 mM EDTA, washed once with PBS, and assayed for the percentage of cells with DNA fragmented by the TUNEL technique (APO-BrdU TUNEL assay kit, Invitrogen) according to the manufacturer’s instructions. DNA fragmentation–fluorescence intensity was measured by flow cytometry for a total of 10,000 cells. Macrophages treated with PBS were used as a negative control. Flow cytometry data were analysed with FlowJo v.9.4.10 (Tree Star).
Protein expression and purification. Procedures for the construction and expression of M1 protein, truncated variants of M1 protein and other M protein types have been described previously14,34, except for M1-mCherry and M1Δ B1Δ B2-mCherry proteins. For M1-mCherry, the coding sequence of intact mCherry protein (residues 1–236) was cloned into the pET28-M1 vector25. The PCR product was amplified with primers 5′ XhoIm-Cherry (5′ -ccgctcgagggaggaagcatggtgagcatggtgagcaagggcgagaggg-3′ )+ 3′ XhoIm-Cherry (5′ -ccgctcgagcttgtacagctcgtccatgccgcc-3′ ), with mCherry fused to the C terminus of M1. For M1Δ B1Δ B2-mCherry, PCR product was amplified with primers 5′ M1dB1B2-cherry(EcoRI) (5′ -ccgccgaattcttagaaacgattactagagaacaagagattaatcg-3′ ) and 3′ M1dB1B2-cherry(EcoRI) (5′ -ccgccgaattctctttgtctatcccaacttgttgattcctttgcta-3′ ) from pET28-M1mCherry vector. Protein constructs were expressed in E. coli BL21 (DE3) cells. Bacteria were grown in LB containing 34 mg ml−1 kanamycin at 37 °C until mid-logarithmic phase and then induced at room temperature with 1 mM isopropyl β -d-1-thiogalactopyranoside and grown for a further 18 h. Bacteria were collected by centrifugation and resuspended in lysis buffer (300 mM NaCl, 100 mM Tris-HCl, pH 8, 10 mM imidazole) with protease inhibitors (Complete Tablet, Roche). Bacteria were lysed using an EmulsiFlex-C5 (Avestin; 20,000 p.s.i. with three passes). His-tagged M1 constructs were then purified as previously reported34 by Ni2+-NTA affinity and Q-Sepharose anion exchange chromatography. Purified proteins were dialysed against 2 l PBS buffer at 4 °C overnight (3500 MWCO tubing, Spectrum Laboratories). Proteins were aliquoted and flash-frozen in liquid N2 for storage at − 80 °C.
Statistical analysis. The data were collected from three independent experiments in triplicate, unless otherwise indicated. Data were combined and represented as mean ± s.e.m. Results were either analysed by unpaired Student’s t-test or by two-way ANOVA using GraphPad Prism version 7. P < 0.05 was considered statistically significant. Flow cytometry histograms and microscopy images are representative of at least two independent experiments.
Data availability. The data that support the findings of this study are available from the corresponding author upon request.
Received: 20 September 2016; Accepted: 4 July 2017; Published: xx xx xxxx
References 1. Walker, M. J. et al. Disease manifestations and pathogenic mechanisms of
group A Streptococcus. Clin. Microbiol. Rev. 27, 264–301 (2014). 2. Carapetis, J. R., Steer, A. C., Mulholland, E. K. & Weber, M. The global
burden of group A streptococcal diseases. Lancet Infect. Dis. 5, 685–694 (2005).
3. Severin, A. et al. Proteomic analysis and identification of Streptococcus pyogenes surface-associated proteins. J. Bacteriol. 189, 1514–1522 (2007).
4. Phillips, G. N. Jr, Flicker, P. F., Cohen, C., Manjula, B. N. & Fischetti, V. A. Streptococcal M protein: α -helical coiled-coil structure and arrangement on the cell surface. Proc. Natl Acad. Sci. USA 78, 4689–4693 (1981).
5. Ghosh, P. The nonideal coiled coil of M protein and its multifarious functions in pathogenesis. Adv. Exp. Med. Biol. 715, 197–211 (2011).
6. Sanderson-Smith, M. et al. A systematic and functional classification of Streptococcus pyogenes that serves as a new tool for molecular typing and vaccine development. J. Infect. Dis. 210, 1325–1338 (2014).
7. Steer, A. C., Law, I., Matatolu, L., Beall, B. W. & Carapetis, J. R. Global emm type distribution of group A streptococci: systematic review and implications for vaccine development. Lancet Infect. Dis. 9, 611–616 (2009).
8. Zhu, L. et al. A molecular trigger for intercontinental epidemics of group A Streptococcus. J. Clin. Invest. 125, 3545–3559 (2015).
9. Okada, N., Liszewski, M. K., Atkinson, J. P. & Caparon, M. Membrane cofactor protein (CD46) is a keratinocyte receptor for the M protein of the group A Streptococcus. Proc. Natl Acad. Sci. USA 92, 2489–2493 (1995).
10. Oehmcke, S., Shannon, O., Morgelin, M. & Herwald, H. Streptococcal M proteins and their role as virulence determinants. Clin. Chim. Acta 411, 1172–1180 (2010).
11. LaRock, C. N. et al. Group A streptococcal M1 protein sequesters cathelicidin to evade innate immune killing. Cell Host Microbe 18, 471–477 (2015).
12. Dohrmann, S. et al. Group A streptococcal M1 protein provides resistance against the antimicrobial activity of histones. Sci. Rep. 7, 43039 (2017).
13. Herwald, H. et al. M protein, a classical bacterial virulence determinant, forms complexes with fibrinogen that induce vascular leakage. Cell 116, 367–379 (2004).
14. Macheboeuf, P. et al. Streptococcal M1 protein constructs a pathological host fibrinogen network. Nature 472, 64–68 (2011).
15. Soehnlein, O. et al. Neutrophil primary granule proteins HBP and HNP1-3 boost bacterial phagocytosis by human and murine macrophages. J. Clin. Invest. 118, 3491–3502 (2008).
16. Akesson, P., Schmidt, K. H., Cooney, J. & Bjorck, L. M1 protein and protein H: IgGFc- and albumin-binding streptococcal surface proteins encoded by adjacent genes. Biochem. J. 300, 877–886 (1994).
17. Kansal, R. G., McGeer, A., Low, D. E., Norrby-Teglund, A. & Kotb, M. Inverse relation between disease severity and expression of the streptococcal cysteine protease, SpeB, among clonal M1T1 isolates recovered from invasive group A streptococcal infection cases. Infect. Immun. 68, 6362–6369 (2000).
18. Sumby, P., Whitney, A. R., Graviss, E. A., DeLeo, F. R. & Musser, J. M. Genome-wide analysis of group A streptococci reveals a mutation that modulates global phenotype and disease specificity. PLoS Pathog. 2, e5 (2006).
19. Cole, J. N., Barnett, T. C., Nizet, V. & Walker, M. J. Molecular insight into invasive group A streptococcal disease. Nat. Rev. Microbiol. 9, 724–736 (2011).
20. Martinon, F., Burns, K. & Tschopp, J. The inflammasome: a molecular platform triggering activation of inflammatory caspases and processing of proIL-β . Mol. Cell 10, 417–426 (2002).
21. Miao, E. A., Rajan, J. V. & Aderem, A. Caspase-1-induced pyroptotic cell death. Immunol. Rev. 243, 206–214 (2011).
22. Franchi, L., Munoz-Planillo, R. & Nunez, G. Sensing and reacting to microbes through the inflammasomes. Nat. Immunol. 13, 325–332 (2012).
23. LaRock, C. N. & Nizet, V. Inflammasome/IL-1β responses to streptococcal pathogens. Front. Immunol. 6, 518 (2015).
24. Broderick, L., De Nardo, D., Franklin, B. S., Hoffman, H. M. & Latz, E. The inflammasomes and autoinflammatory syndromes. Annu. Rev. Pathol. 10, 395–424 (2015).
25. Wen, H., Ting, J. P. & O’Neill, L. A. A role for the NLRP3 inflammasome in metabolic diseases—did Warburg miss inflammation? Nat. Immunol. 13, 352–357 (2012).
26. Harder, J. et al. Activation of the Nlrp3 inflammasome by Streptococcus pyogenes requires streptolysin O and NF-κ B activation but proceeds independently of TLR signaling and P2X7 receptor. J. Immunol. 183, 5823–5829 (2009).
27. Lin, A. E. et al. A group A Streptococcus ADP-ribosyltransferase toxin stimulates a protective interleukin 1β -dependent macrophage immune response. mBio 6, e00133 (2015).
28. Bauernfeind, F. G. et al. Cutting edge: NF-κ B activating pattern recognition and cytokine receptors license NLRP3 inflammasome activation by regulating NLRP3 expression. J. Immunol. 183, 787–791 (2009).
29. Guo, H., Callaway, J. B. & Ting, J. P. Inflammasomes: mechanism of action, role in disease, and therapeutics. Nat. Med. 21, 677–687 (2015).
30. Gaidt, M. M. et al. Human monocytes engage an alternative inflammasome pathway. Immunity 44, 833–846 (2016).
31. Mariathasan, S. et al. Cryopyrin activates the inflammasome in response to toxins and ATP. Nature 440, 228–232 (2006).
32. Coll, R. C. et al. A small-molecule inhibitor of the NLRP3 inflammasome for the treatment of inflammatory diseases. Nat. Med. 21, 248–255 (2015).
33. Munoz-Planillo, R. et al. K+ efflux is the common trigger of NLRP3 inflammasome activation by bacterial toxins and particulate matter. Immunity 38, 1142–1153 (2013).
34. McNamara, C. et al. Coiled-coil irregularities and instabilities in group A Streptococcus M1 are required for virulence. Science 319, 1405–1408 (2008).
35. LaRock, C. N. et al. IL-1β is an innate immune sensor of microbial proteolysis. Sci. Immunol. 1, eaah3539 (2016).
36. Hsu, L. C. et al. IL-1β -driven neutrophilia preserves antibacterial defense in the absence of the kinase IKKβ . Nat. Immunol. 12, 144–150 (2011).
37. Persson, S. T., Wilk, L., Morgelin, M. & Herwald, H. Vigilant keratinocytes trigger pathogen-associated molecular pattern signaling in response to streptococcal M1 protein. Infect. Immun. 83, 4673–4681 (2015).
38. Pahlman, L. I. et al. Streptococcal M protein: a multipotent and powerful inducer of inflammation. J. Immunol. 177, 1221–1228 (2006).
39. Chattergoon, M. A. et al. HIV and HCV activate the inflammasome in monocytes and macrophages via endosomal Toll-like receptors without induction of type 1 interferon. PLoS Pathog. 10, e1004082 (2014).
40. Marina-Garcia, N. et al. Clathrin- and dynamin-dependent endocytic pathway regulates muramyl dipeptide internalization and NOD2 activation. J. Immunol. 182, 4321–4327 (2009).
NATURE MICROBIOLOGY | www.nature.com/naturemicrobiology

© 2017 Macmillan Publishers Limited, part of Springer Nature. All rights reserved. © 2017 Macmillan Publishers Limited, part of Springer Nature. All rights reserved.
ARTICLES NATURE MICROBIOLOGY
41. Stewart, C. et al. Coiled-coil destabilizing residues in the group A Streptococcus M1 protein are required for functional interaction. Proc. Natl Acad. Sci. USA 113, 9515–9520 (2016).
42. Buffalo, C. Z. et al. Conserved patterns hidden within group A Streptococcus M protein hypervariability recognize human C4b-binding protein. Nat. Microbiol. 1, 16155 (2016).
43. Hornung, V. et al. Silica crystals and aluminum salts activate the NALP3 inflammasome through phagosomal destabilization. Nat. Immunol. 9, 847–856 (2008).
44. Chatellier, S. et al. Genetic relatedness and superantigen expression in group A Streptococcus serotype M1 isolates from patients with severe and nonsevere invasive diseases. Infect. Immun. 68, 3523–3534 (2000).
45. Lauth, X. et al. M1 protein allows Group A streptococcal survival in phagocyte extracellular traps through cathelicidin inhibition. J. Innate Immun. 1, 202–214 (2009).
46. Timmer, A. M. et al. Streptolysin O promotes group A Streptococcus immune evasion by accelerated macrophage apoptosis. J. Biol. Chem. 284, 862–871 (2009).
47. McCloy, R. A. et al. Partial inhibition of Cdk1 in G 2 phase overrides the SAC and decouples mitotic events. Cell Cycle 13, 1400–1412 (2014).
AcknowledgementsThe authors thank the members of the P.G. and V.N. laboratories for their valuable input. This work was supported by NIH grants AI096837 (P.G. and V.N),
AI077780 (V.N.) and AI52430 (H.M.H.) A.M.R. is a San Diego IRACDA Program fellow supported by NIGMS/NIH award K12GM068524, N.J.G. is supported by the UCSD Genetics Training Program (T32 GM008666) and the UCSD Global Health Institute and C.N.L. is a recipient of an A.P. Giannini Foundation Postdoctoral Research Fellowship.
Author contributionsJ.A.V., P.G. and V.N. formulated the original hypothesis, designed the study and analysed the results. J.A.V., A.M.R., N.J.G., C.N.L., N.G. and S.R.A. performed and optimized experiments. H.M.H. provided novel reagents. J.A.V., P.G. and V.N. wrote the manuscript and all authors reviewed the manuscript, data and conclusions before submission.
Competing interestsThe authors declare no competing financial interests.
Additional informationSupplementary information is available for this paper at doi:10.1038/s41564-017-0005-6.Reprints and permissions information is available at www.nature.com/reprints.Correspondence and requests for materials should be addressed to P.G. or V.N.Publisher’s note: Springer Nature remains neutral with regard to jurisdictional claims in published maps and institutional affiliations.
NATURE MICROBIOLOGY | www.nature.com/naturemicrobiology