groundwater flow and transport of nutrients through a...
TRANSCRIPT

Journal of Hydrology (2006) 331, 315–335
ava i lab le a t www.sc iencedi rec t . com
journal homepage: www.elsevier .com/ locate / jhydrol
Groundwater flow and transport of nutrients througha riparian meadow – Field data and modelling
Carl Christian Hoffmann a,*, Peter Berg b, Mette Dahl a,1, Søren E. Larsen a,Hans E. Andersen a, Benny Andersen a,2
a National Environmental Research Institute, Department of Freshwater Ecology, Vejlsoevej 25,DK-8600 Silkeborg, Denmarkb University of Virginia, Department of Environmental Sciences, Clark Hall, Charlottesville, USA
Received 17 March 2005; received in revised form 19 May 2006; accepted 24 May 2006
Summary Groundwater flow and nutrient transport were studied in a riparian meadow during athree-year period. The meadow is situated along a first order stream in the River Gjern catch-ment area, Jutland, Denmark. Field data included measurements of hydraulic head, hydraulicconductivity and soil characteristics. Groundwater sampled from piezometers was analysedfor nitrate, ammonium and phosphate. Nitrogen and phosphorus contents in above-ground plantbiomass were also measured. For the interpretation of our data we developed a one-dimensionalhydraulic-transport model for the lateral groundwater flow, transport of nitrate, and nitrateremoval in the meadow. The model is based on Darcy’s equation, and input data are horizontaland vertical distances, hydraulic heads, hydraulic conductivities, and nitrate concentrations. Wealso developed a scheme for evaluating uncertainties of the modeling results.
Annual removal of nitrate in the saturated zone of the riparian meadow was 326, 340, and119 kg NO�3 -N ha�1 y�1 (59–68% of groundwater input) through the three-year period. The largestnitrate removal took place outside the growing seasons. Net loss of ammonium from the saturatedzone was 0.4, 6.7, and 10:3 kg NHþ4 -N ha�1 y�1. In two of the years this was counter-balanced byatmospheric nitrogen deposition. Phosphate was not retained during the first two years but lost atrates of 0.88 and 0.36 kg P ha�1 y�1. In year 3 phosphate retention was 0.47 kg P ha�1 y�1.
These data show how a riparian ecotone along a first order stream can reduces nitrogen pollu-tion from agricultural areas. Also, the pronounced year to year variations in our nutrient budgetsshow that shorter studies, for example based on one year of observations, should be interpretedcautiously as representing a general picture of nutrient pathways.
�c 2006 Elsevier B.V. All rights reserved.
KEYWORDSRiparian meadow;Groundwater flow;Nitrate removal;Mass balance;Model
0d
022-1694/$ - see front matter �c 2006 Elsevier B.V. All rights reserved.oi:10.1016/j.jhydrol.2006.05.019* Corresponding author. Tel.: +45 89 201493; fax: +45 89 201414.E-mail address: [email protected] (C.C. Hoffmann).
1 Present address: Geological Survey of Denmark and Greenland, Department of Hydrology, DK-1350 Copenhagen K, Denmark.2 Present address: County of Vejle, DK-7100 Vejle, Denmark.

316 C.C. Hoffmann et al.
Introduction
Riparian wetlands or so-called buffer strips have receivedmuch attention due to their ability to remove and retainnutrients. Especially nitrate removal has been in focus(Peterjohn and Correl, 1984; Cooper, 1990; Haycock andPinay, 1993). In riparian wetlands characterized by shal-low lateral groundwater flow originating from uplandareas discharging groundwater to a nearby stream, deni-trification is believed to be the main process responsiblefor nitrate removal (Cooper, 1990; Schipper et al., 1993;Hoffmann et al., 2000; Vidon and Hill, 2004a). Denitrifica-tion has been determined using different approachesbased on stable isotopes (Mariotti et al., 1988; Ostromet al., 2002), soil sampling and immediate incubation withC2H2 (Cooper, 1990; Schipper et al., 1993), conservativetracer experiments with chloride and bromide (Jacobsand Gilliam, 1985; Smith et al., 1996), laboratory micro-cosmos experiments (Groffman et al., 1996; Hoffmannet al., 2000), and mass balance calculations (Haycockand Pinay, 1993).
Intensive field studies using multiple piezometer nestsare time consuming to deploy and use, but they give de-tailed information about hydraulic heads, groundwater flowpatterns, concentration of substances such as nitrate, bio-geochemical interaction between waterborne substances,zones of enhanced denitrification, and finally, water andnutrient flows. Such quantifications are important, becausethey demonstrate linkages between inputs, responses andoutputs of the riparian ecosystem. In other words, theythrow light on the environmental benefits of natural riparianwetlands acting as buffer zones or ecotones between terres-trial and aquatic environments. This role of riparian wet-lands is the focus in this paper.
Catchment area and study site Anbæk, VoldbyBrook
The study was conducted in a riparian meadow at VoldbyBrook (Fig. 1), a first order stream in the River Gjern catch-ment area, Jutland, Denmark (UTM Zone 32 ED 50 N 623689E 552210). The catchment area of River Gjern is 114 km2.The land use is mainly agriculture, 77.4%, while forests oc-cupy 13.9%, towns and paved areas 4.6%, and meadows andwetlands 4.4%. Soil types are sandy loams, 61.2%, loam,34.8% and loamy sand 4.0% (Svendsen et al., 1995 , Svend-sen, personal communication).
The meadow bufferstrip is only 20–25 m wide, and is re-charged by shallow lateral groundwater flow originatingfrom an agricultural field, which was set aside in 1994.The groundwater level changes during the year between0.2 and 1 m below the soil surface. The meadow was floodedonce (approximately one month in February–March 1994)during the study period.
The meadow geology consists in the upper 30–50 cm ofsandy sapric and hemic peat. Below this layer is 1–2 m ofmedium-grained sand with gravel and pebbles. The organiccontent is very sparse. Closer to Voldby Brook medium-grained sand alternates with fine-grained sand. The sandylayers are underlain by a low-permeable till, which consistsof silty clayey sand (Figs. 2 and 3).
The dominant plant species in the meadow are Dactylisglomerata L., Phleum pratense L., Agrotis tenuis Sibth.,Urtica dioeca and Epilobium montanum L., and with pres-ence of Achillea millifolium, Myosotis palustris L., Stellariagraminea L. and Caltha palustris.
Field design
A first picture of the groundwater flow through the meadowwas obtained in a pilot study conducted in the period Sep-tember 5, 1991 to October 24, 1991. Four piezometer nestswith two piezometer levels at each station (6–9) were in-stalled (Fig. 1). The measuring depths were 0.95–125 cmand 175–200 cm below soil surface of the meadow, respec-tively. The upper level was placed in a hydraulically activelayer of mainly sandy deposits. The lower level was placedin a hydraulically inactive low-permeable clayey till.Hydraulic head hydrographs from the first month showedonly minor gradient changes between measuring points. Ahorizontal equipotential map for the upper active levelwas then drawn. Based on this a permanent transect of fourpiezometer nests, which is not perpendicular to the brook,were then established along a groundwater flow path(Fig. 1). Measuring depths at these four stations (1–4) aredescribed below. A continuous water level gauge was placedin Voldby Brook at the end of the transect (station 5).Hydraulic heads in all piezometers were then measuredfor half a month more and hydrographs analyzed. Head gra-dients were still quite stable in this period. A horizontalequipotential map for the active upper layer from the latestmeasuring date shows that the transect followed a ground-water flow line (Fig. 1). From the same date a vertical equi-potential map (Fig. 2), was drawn along the transect fromstation 1 at the small hillslope to station 5 in Voldby Brook.The map shows a minor downward head gradient at the hills-lope, horizontal gradients throughout the main part of themeadow, and small upward gradients close the brook.
The permanent transect established as a result of the pi-lot study, is 21 m long and follows the groundwater flowdirection from the hillslope to the brook most of the year(i.e. there is no groundwater discharge a few days in sum-mer). Each piezometer nest (station) was equipped with 3or 4 polyethylene piezometers (PEH tubes) with 10 cm slot-ted well points (screens), placed at known depths above thelow-permeable till (20–30 cm, 60–70 cm, 100–110 cm and160–170 cm). Piezometer nest 1 was located at the top ofa small slopehill (1 m high) and nest 2 only 3 m away fromstation 1 at the foot of the hillslope. Piezometer nest 3was located in the middle of the riparian meadow 12 m fromnest 1, while nest 4 was located next to the brook and 21 mfrom nest 1 (Fig. 3).
The water levels in the piezometers were measured witha Plexiglas tube with a tape measure attached. The Plexi-glas tube was further connected to a piece of flexible rubbertube. By blowing air gently into the rubber tube and at thesame time lowering the Plexiglas tube into the piezometeruntil it reaches the water table, it is possible to make accu-rate measurements of the water level (±2 mm), simply byplacing a fingernail at the lip of the piezometer tube andpress it against the tape measure, exactly when the tonguesenses the air bubbles. The water level was measured in

Figure 1 Horizontal equipotential map for the active upper layer. The transect with piezometer nests 1–4 was establishedaccording to the equipotential lines.
Groundwater flow and transport of nutrients through a riparian meadow – Field data and modelling 317
each piezometer once a week in the years 1992–1993 andonce every two weeks in 1994.
Groundwater was sampled every second week in 1992–1993 and once a month in 1994. In 1992–1993 precipitationwas measured weekly with a rain gauge (200 cm2) with theorifice at ground level. Atmospheric deposition rates weredetermined from these precipitation measurements.
Water level in the stream was recorded weekly on a staffgauge. The topography of the riparian meadow and thestream was surveyed in detail, and the top of the piezome-ters were levelled in order to convert measured piezometerwater levels to hydraulic heads.
Synchronous discharge measurements in Voldby Brookwere performed upstream and downstream the meadow afew times in 1992 with propellers (Kleinflugel from Ott,Germany).
Methods
Groundwater was collected from piezometers using a sub-mersible pump (Whale 921, Whale, Northern Ireland). Toensure sampling of fresh groundwater the piezometers wereemptied the day before sampling. The samples were storedat 5 �C and analysed the following day as follows.
The samples were filtered through Whatman GF/C andanalysed on a multi-channel flow-injection analyser forammonium-N, nitrate-N, nitrite-N and phosphate-P (Quik-
Chem automated ion analyzer from LACHAT INSTRUMENTS,US, methods 10-107-06-3-D for ammonium-N, 10-107-04-1-B for nitrite-N + nitrate-N and 10-115-01-1-B for phos-phate-P). Nitrate� N > 1 mg NO�3 -N l�1 was determinedby ion chromatography on a Shimadzu HIC-6A chromato-graph using an IC-A1S anion column (Shimadzu Corporation,Japan). pH was measured using a PHM 93 pH meter (Radiom-eter, Denmark). Precipitation samples were analysed forammonium-N, nitrate-N + nitrite-N and phosphate-P usingthe same methods.
Above-ground primary production was measured monthlyin 1992–1993. Two plots of 0.5 m2 were harvested eachtime. The harvested material was divided in dead and alivebiomass and oven-dried at 105 �C for at least 16 h. The driedplant material was weighted, and analysed for total nitro-gen and total phosphorus content. Nitrogen was determinedas Kjeldahl nitrogen (Jackson, 1958). Phosphorus was deter-mined as phosphate-P by the molybdate method after ash-ing in a muffle furnace at 550 �C, and boiling the ash with0.1 N HCl (Andersen, 1976).
Hydraulic conductivity was measured in the field usingthe piezometer method developed by Luthin and Kirkham(1949) for the saturated zone, and further described byAmoozegar and Warrick (1986). Calculation of hydraulicconductivity was done using the following equation:
K ¼ pr2flogðH � d1Þ=ðH � d2ÞgCðt2 � t1Þ
; ð1Þ

Figure 2 Vertical equipotential map, along the transect from station 1 at the small hillslope to station 5 in Voldby Brook. The mapshows a small downward head gradient at the hillslope, approximately horizontal gradients through the main part of the meadow,and upward gradients close the brook.
318 C.C. Hoffmann et al.
where H is the distance from the water table to the cavitydug out under the tube and d1 and d2 is the distance fromtop of the piezometer to the water table during the measur-ing, at time, t1 and time, t2. The ‘‘shape factor’’, C, was ta-ken from Youngs (1968).
Soil cores were sampled along the transect close to thefour piezometer nests in order to get information about soilorganic matter content which may be carbon source for thedenitrification process. Soil sampling was performed withsteel cylinders (50–60 cm long, 60 mm inner diameter).The cylinders were sharpened at the bottom end and a spe-cially designed iron head was constructed to fit inside thetop of the cylinder. The cylinder was fastened to the ironhead by screws. The iron head had a hole in the middle witha rubber washer and a steel washer at the top, allowingwater and air to flow out of the cylinders as soil drillingand sampling went deeper and deeper into the wetland soil.The iron head was mounted to ordinary soil drilling equip-ment (Eijkelkamp, Holland). The soil cores were sectionedin the field at the following depth intervals: 0–10 cm, 10–
20 cm, 20–30 cm, 30–50 cm, 50–100 cm, 100–150 cm and150–200 cm. Content of soil organic matter was determinedas loss on ignition in muffle furnace maintained at 550 �C.
Dry density and porosity were determined from soil sam-ples taken with a stainless steel cylinder as described above(500 mm long, and 60 mm inner diameter). After sampling,the cylinders were sealed at both ends with rubber stop-pers, stored in an upright position and brought to the labo-ratory within a few hours. The soil cores were dried at 60 �Cfor one month, while still kept in the steel cylinders.
Hydraulic model
The model is based on Darcy’s equation and calculates thehorizontal groundwater flow between two piezometernests. Fluctuations in groundwater level through the yearare incorporated in this calculation. If concentrations of dis-solved nutrients also are given as input, the model calcu-lates the transport of these nutrients between thepiezometer nests. Thus the model calculates the transport

Figure 3 Geological profiles at the four piezometer nests (stations) in the riparian meadow.
Groundwater flow and transport of nutrients through a riparian meadow – Field data and modelling 319
of water and nutrients on measuring dates and subsequentlymonthly and yearly balances are calculated by linear inter-polation between measuring dates. For dissolved nutrients
one must consider carefully whether the element in ques-tion is removed from the system (e.g. nitrate through deni-trification), retained in the system (e.g. phosphate being

320 C.C. Hoffmann et al.
adsorbed to the soil matrix), accumulated in the system orleached out of the system. As a key element in our model-ling effort, uncertainties of calculated water flows are esti-mated in the model based on assessed measurement errorsof all input variables.
Necessary input data
The model input data needed to calculate the water flowand transport of a nutrient between station a and b is illus-trated in Fig. 4 and listed below:n number of layers,L (m) horizontal distance between the two stations,hij (m) thickness of layer for layer j at each station
i, i = a,b and j = 1,2, . . . ,n,Kj (m day�1) hydraulic conductivity at layer j, j = 1,2, . . . ,n,uij (m) hydraulic head at layer j and at each station i, i =
a,b and j = 1,2, . . . ,n,gwi (m) groundwater level at each station i, i = a,b,Cij (mg l�1) concentration of a dissolved substance mea-
sured at each station i for layer j, i = a,b and j =1,2, . . . ,n.
Model description
The model calculates water flux (qj) for each layer betweentwo stations for every measurement date as
qj ¼ �Kj
ubj � uaj
L; j ¼ 1; 2; . . . ; n: ð2Þ
The total water flow (Qj) from station a to station b in j iscalculated as:
Station a Station b
L
Flow direction
gwa gwb
K1
K2
K3
hb1
hb1
hb1
ha1
ha2
ha3
Layer 1
Layer 2
Layer 3
Piezometer
Figure 4 Schematic illustration of required model input data.Hydraulic heads are measured in piezometers located in themiddle of each layer. The model calculates for each cross-sectional area groundwater flux across the vertical boundaryindicated by the broken line.
Qj ¼ qj � Aj; j ¼ 1; 2; . . . ; n; ð3Þ
where Aj is the cross-sectional area of layer j.If the groundwater level is located in layer 1 the cross-
sectional area is defined as:
A1 ¼1
2ðha1 þ ha2Þ �
1
2ðgwa þ gwbÞ;
Aj ¼1
2ðhaj þ hbjÞ; j ¼ 2; 3; . . . ; n:
ð4Þ
If the groundwater level is located in layer 2 the cross-sectional area is defined as:
A1 ¼ 0
A2 ¼1
2ðha2 þ hb2Þ �
1
2ðgwa þ gwbÞ
Aj ¼1
2ðhaj þ hbjÞ; j ¼ 3; 4; . . . ; n;
ð5Þ
and so forth. This implies that only layers that are locatedcompletely or partly beneath the groundwater level contrib-ute to the water flow.
In situations where the groundwater level lies below apiezometer screen, the hydraulic head measured in the dee-per layer is extrapolated upwards. This implies that hydrau-lic head for the lowest layer is always necessary for themodel calculations. The model considers the measuredhydraulic head as a vertical average for the respectivelayer. For that reason measuring heads in the middle ofthe layers give the most correct model calculations.
The net transport (i.e. removal, retention, accumulationor leaching) (Rj) of a dissolved substance is calculated as:
Rj ¼ QjðCaj � CbjÞ; j ¼ 1; 2; . . . ; n; ð6Þ
where Caj is the concentration at station a in layer j and Cbj
is the concentration at station b in layer j. If a deep-lyinggroundwater level has prevented concentration measure-ments in a given layer, the concentration for the layer be-low is extrapolated upwards.
The total water flow for the whole riparian aquifer fromlayer 1 to layer n is calculated by adding the fluxes for eachlayer:
Q ¼Xnj¼1
Qj ð7Þ
The total net transport is calculated in the same way:
R ¼Xnj¼1
Rj ð8Þ
Monthly and annual values of water flow and net trans-port of dissolved substances are calculated by time integra-tions over linear interpolations between measurementdates.
Uncertainty of model calculations
Uncertainty of the calculated water flow is estimated asfollows.The water level was measured in the piezometerswith an assessed uncertainty of 2 mm as mentioned above.The topographic leveling was performed with high accu-racy, reading all measurements in millimeters. This iscrucial because differences in water level are often very

Groundwater flow and transport of nutrients through a riparian meadow – Field data and modelling 321
small, i.e. in the range from several millimeters to a fewcentimeters. The distance between the piezometerswas measured using a steel measuring tape. Thus, we as-sumed that all distances have a measurement error of2 mm, i.e.
sðLÞ ¼ 0:002 m;
sðhijÞ ¼ 0:002 m;
sðuijÞ ¼ 0:002 m;
sðgwiÞ ¼ 0:002 m;
where i = a,b and j = 1,2, . . . ,nFurthermore, we estimated that the relative error of
hydraulic conductivities is 15%. This result comes from rep-licate measurements of hydraulic conductivities (Table 1)using Eq. (1).
In the following we illustrate how the uncertainty for themodel-calculated groundwater flow is estimated. A funda-mental assumption is that all measurements needed for cal-culating the flow are independent. The formula forestimating the uncertainty for groundwater flux qj accord-ing to Hoel et al. (1971) is:
sðqjÞ ¼ �Kj
L� sðubj � uajÞ
� �2
þ ðubj � uajÞ � s �Kj
L
� �� �2(
þ s �Kj
L
� �� s ubj � uaj
� �� �2)1
2
;
where
sðubj � uajÞ ¼ fsðurjÞ2 þ sðuajÞ
2g12 ¼ 0:0283 m
s �Kj
L
� �¼ Kj
L� sðKjÞ
Kj
� �2
þ sðLÞL
� �2( )1
2
:
The uncertainty for the total flow of a column, Qj, from ato b in profile j can then be estimated as (Hoel et al., 1971):
sðQjÞ ¼ fðqj � sðAjÞÞ2 þ ðAj � sðqjÞÞ2 þ ðsðqjÞ � sðAjÞÞ2g
12;
Table 1 Hydraulic conductivity measured at different depths clo
Lithology
Station 3: Medium-grained sand with pebbles andgravel, dark grey (2,5Y4/1,v)
Station 3: Medium-grained sand with gravel, dark grey (2,5Y4/1,vStation 2: Medium-grained sand with pebblesand gravel, yellow-brownish (10YR/8,v)
Station 2: Medium-grained sand with pebbles and gravel,yellow-brownish (10YR/8,v)
Station 2: Fine-grained silty sand with graveland few pebbles, gleyey (5Y6/1,v–5YR4/8,v)
Code in parenthesis after lithology indicates colour according to Munserange in measurements. The relative error (%) at different depths sho
where
sðA1Þ¼1
2sðha1Þ
� �2
þ 1
2sðhb1Þ
� �2
þ 1
2sðgwaÞ
� �2(
þ 1
2sðgwbÞ
� �2)1
2
¼ 0:0283;
sðAjÞ¼1
2sðhajÞ
� �2
þ 1
2sðhbjÞ
� �2( )1
2
¼ 0:0141; for j¼ 2;3; . . . ;n:
Finally, the total flow, Q, for the entire riparian aquiferhas the uncertainty (Hoel et al. (1971) :
sðQÞ ¼Xnj¼1
sðQjÞ2( )1
2
:
Results
Hydraulic conductivity, dry density and porosity
Hydraulic conductivities were measured at two locations,i.e. 2 m away from station 2 and close to station 3, respec-tively, and took place at four different depths (Table 1). Atboth locations medium-grained sand was dominating atdepths 67–76 cm, 74–81 cm and 114–115 cm but withalternating content of gravel and pebbles (Table 1). Fine-grained sand dominated in the largest depth, 154–164 cm(Table 1). For all but one depth the hydraulic conductivitymeasurements were performed at least three times (Table1). With the exception of the greatest depth with fine-grained sand all measurements showed some variation pre-sumably because the cavity dug out beneath the piezometerdid not maintain its shape during measuring. This problemwas most pronounced at a depth of 114 cm and 115 cm.For that reason the length of the cavity at this depth hadto be set to zero and the resulting calculated hydraulic con-ductivity from depth 114 cm had a mean of 33.5 m day�1 butexhibited a relative large range of 22.2–43.9 m day�1 (Ta-ble 1). At depth 115 cm similar problems occurred and onlyone measurement was performed. The total collapse ofthe cavity at a depth of 114 and 115 cm indicate a highly
se to station 3 and 2 m away from station 2
Depth (cm) K (m day�1) sd=�x � 100%
67–76 37.5 (32.3–44.0) 14
) 74–81 20.9 (18.4–22.1) 10114 33.5 (22.2–43.9) 27
115 21.5 –
154–164 12.1 (11.7–12.4) 3
ll’s soil color charts (1994). Figures in parenthesis under K indicatewn as the coefficient of variation, denoted sd=�x � 100.
322 C.C. Hoffmann et al.
permeable zone. The highest conductivity was found at sta-tion 3 at a depth of 67–74 cm, with a K-value of37.5 m day�1 (Table 1), but since this depth interval is oftenlocated above the groundwater table it is of minor signifi-cance for the overall water flow.
Wet and dry density was determined on two cores sam-pled at station 3 at a depth of 85–125 cm. The cores hada length of 40 cm. Wet density was 1.932 g cm�3 and drydensity 1.496 g cm�3. The porosity was calculated as 38.3%.
Loss on ignition
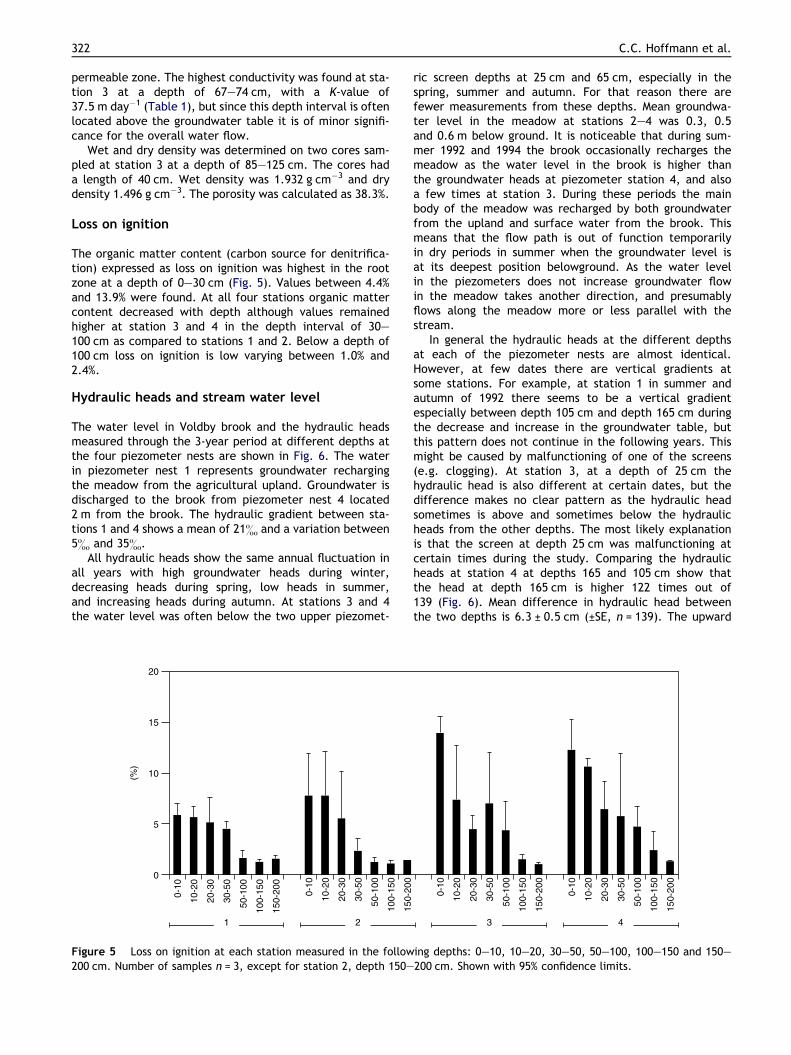
The organic matter content (carbon source for denitrifica-tion) expressed as loss on ignition was highest in the rootzone at a depth of 0–30 cm (Fig. 5). Values between 4.4%and 13.9% were found. At all four stations organic mattercontent decreased with depth although values remainedhigher at station 3 and 4 in the depth interval of 30–100 cm as compared to stations 1 and 2. Below a depth of100 cm loss on ignition is low varying between 1.0% and2.4%.
Hydraulic heads and stream water level
The water level in Voldby brook and the hydraulic headsmeasured through the 3-year period at different depths atthe four piezometer nests are shown in Fig. 6. The waterin piezometer nest 1 represents groundwater rechargingthe meadow from the agricultural upland. Groundwater isdischarged to the brook from piezometer nest 4 located2 m from the brook. The hydraulic gradient between sta-tions 1 and 4 shows a mean of 21& and a variation between5& and 35&.
All hydraulic heads show the same annual fluctuation inall years with high groundwater heads during winter,decreasing heads during spring, low heads in summer,and increasing heads during autumn. At stations 3 and 4the water level was often below the two upper piezomet-
(%)
0-10
10-2
0
20-3
0
30-5
0
50-1
00
100-
150
150-
200
0-10
10-2
0
20-3
0
30-5
0
50-1
00
100-
1500
5
10
15
20
1 2
Figure 5 Loss on ignition at each station measured in the follow200 cm. Number of samples n = 3, except for station 2, depth 150–
ric screen depths at 25 cm and 65 cm, especially in thespring, summer and autumn. For that reason there arefewer measurements from these depths. Mean groundwa-ter level in the meadow at stations 2–4 was 0.3, 0.5and 0.6 m below ground. It is noticeable that during sum-mer 1992 and 1994 the brook occasionally recharges themeadow as the water level in the brook is higher thanthe groundwater heads at piezometer station 4, and alsoa few times at station 3. During these periods the mainbody of the meadow was recharged by both groundwaterfrom the upland and surface water from the brook. Thismeans that the flow path is out of function temporarilyin dry periods in summer when the groundwater level isat its deepest position belowground. As the water levelin the piezometers does not increase groundwater flowin the meadow takes another direction, and presumablyflows along the meadow more or less parallel with thestream.
In general the hydraulic heads at the different depthsat each of the piezometer nests are almost identical.However, at few dates there are vertical gradients atsome stations. For example, at station 1 in summer andautumn of 1992 there seems to be a vertical gradientespecially between depth 105 cm and depth 165 cm duringthe decrease and increase in the groundwater table, butthis pattern does not continue in the following years. Thismight be caused by malfunctioning of one of the screens(e.g. clogging). At station 3, at a depth of 25 cm thehydraulic head is also different at certain dates, but thedifference makes no clear pattern as the hydraulic headsometimes is above and sometimes below the hydraulicheads from the other depths. The most likely explanationis that the screen at depth 25 cm was malfunctioning atcertain times during the study. Comparing the hydraulicheads at station 4 at depths 165 and 105 cm show thatthe head at depth 165 cm is higher 122 times out of139 (Fig. 6). Mean difference in hydraulic head betweenthe two depths is 6.3 ± 0.5 cm (±SE, n = 139). The upward
150-
200
0-10
10-2
0
20-3
0
30-5
0
50-1
00
100-
150
150-
200
0-10
10-2
0
20-3
0
30-5
0
50-1
00
100-
150
150-
200
3 4
ing depths: 0–10, 10–20, 30–50, 50–100, 100–150 and 150–200 cm. Shown with 95% confidence limits.

Figure 6 Hydraulic heads at different depths at piezometer nest 1–4 (stations 1–4) and water level in Voldby Brook. At station 1the ground surface lies at 56.41 m.a.s.l., and at stations 2–4 the soil surface lies at 55.97, 55.92 and 55.93 m.a.s.l., respectively.
Groundwater flow and transport of nutrients through a riparian meadow – Field data and modelling 323
move of groundwater at this location of the meadow, only2 m away from the brook indicates that groundwater isdischarged to the brook. This is in accordance with theresults from the pilot study (Fig. 2). An exception fromthis are the dry periods in summer 1992 and 1994
mentioned above. Further, it seems reasonable to modelthe groundwater flow as horizontal one-dimensional flowalong the transect from the hillslope to the stream(i.e. from stations 1 to 4) above the low-permeable bot-tom till layer, although the two dry periods have to be

324 C.C. Hoffmann et al.
treated separately as the fate of groundwater rechargingthe meadow from the upland field and streamwater recharging the meadow from the brook remainsunknown.
Precipitation
The annual precipitation in 1992 and 1993 was 711 mmand 852 mm, respectively. These numbers agree well withdata from a nearby meteorological station (Hammel)where the annual precipitation was measured to 755 mmand 892 mm, (Danish Meteorological Institute). The30-year annual normal for this station is 809 mm.Precipitation data for 1994 used in this study was acquiredfrom Hammel meteorological station, and amounted to1076 mm per year.
Nutrients in groundwater
Concentrations of nitrate-N at the four stations and inVoldby Brook are shown in Fig. 7. All stations showed anannual pattern with low concentrations in summer andbeginning of autumn while concentrations were higher inwinter and spring. From autumn 1993 through 1994 therewere generally lower nitrate concentrations at all fourstations. This overall pattern coincide with a change infarming practice as the upland field recharging the mea-dow was set aside in 1994; i.e. the field was neither fer-tilized nor tillaged after autumn 1993. Comparing nitrateconcentrations between stations and depths reveals thatin year 1992 station 1 and 2 had very similar concentra-tions at depths 65 and 105 cm. In 1993 and 1994 nitrateconcentration at station 2 were a little lower at all depthscompared to station 1. Moving from station 2 to 3 andfrom station 3 to 4 nitrate concentrations gradually de-crease at depth 105 cm. The same pattern was also seenat depth 165 cm.
Relative to nitrate, ammonium was only found in smallconcentrations below the groundwater table (Fig. 8). At sta-tion 3, depth 65 cm, ammonium concentration fluctuatedaround 0:5–0:6 mg NHþ4 -N l�1. This is significantly higherthan values from all other stations and depths. At station4, depth 105 cm mean ammonium concentration increasefrom 0.19 in 1992 to 0.25 and 0:41 mg NHþ4 -N l�1 in 1993and 1994, respectively. At the other depths at stations2–4 ammonium concentration rarely exceeded 0:05 mgNHþ4 -N l�1.
Phosphate concentrations were generally very low. Mostdepths show mean concentrations of phosphate-P below0:010 mg PO3�
4 -P l�1. At station 3, depth 65 cm, phosphateconcentration was higher in autumn 1993 ð0:008–0:103 mgPO3�
4 -P l�1). At station 4, depth 165 cm, the mean annualconcentration exceeded 0:02 mg PO3�
4 -P l�1, with 0.021,0.027 and 0:021 mg PO3�
4 -P l�1 for the years 1992–1993–1994, respectively. For all three years mean concentration(±SE) at stations 1–4 was 0.007 ± 0.001 (n = 110), 0.009 ±0.001 (n = 126), 0.012 ± 0.001 (n = 151) and 0.018 ± 0.002ðn ¼ 82Þ mg PO3�
4 -P l�1.Nitrate concentration in precipitation was stable during
the whole three year study period, with a mean of 0:674�0:069 mg NO�3 -N l�1 (n = 85 ± SE). Ammonium concentration
was 1:035� 0:115 mg NHþ4 -N l�1 (n = 33 ± SE) in 1992 and in-creased to 1:825� 0:504 mg NHþ4 -N l�1 (n = 21 ± SE) in 1993and decreased to 0:506� 0:113 mg NHþ4 -N l�1 (n = 27 ± SE)in 1994. Phosphate concentration in precipitation was0:063� 0:014 mg PO3�
4 -P l�1 (n = 33 ± SE) and 0:054� 0:014mg PO3�
4 -P l�1 (n = 21 ± SE) in 1992 and 1993, respectively.In 1994 mean annual phosphate concentration decreasedto 0:018� 0:007 mg PO3�
4 -P l�1 (n = 27± SE).
Nutrients in above-ground biomass
Alive and dead aboveground biomass was measured monthlyfrom April 1992 to October 1993. Both fractions varied be-tween the years (Table 2), probably because the meadowwas grazed until the end of summer 1991, but was neithergrazed nor cut during the study period from 1992–94. Theamount of dead biomass was much smaller in 1992 as com-pared to 1993 with maximum dead aboveground biomass of680 g m�2 in March 1993 (Table 2).
The nitrogen content in alive above-ground biomass in-creased from 2.28 g N m�2 on April 8, 1992 to 12.98 g N m�2
on October 19, 1992, which equals a daily uptake rate of55 mg N m�2 day�1 (Table 2). In 1993 the lowest contentwas found on March 23 with 4.97 g N m�2 and the highestcontent on August 9 with 9.07 g N m�2, equivalent with adaily uptake rate of 29 mg N m�2 day�1 (Table 2). The high-er amount of dead aboveground biomass on the meadow in1993 was also reflected in the amount nitrogen, which wasmuch higher, especially in summer and autumn (Table 2).
In 1992 the lowest phosphorus content, 0.15 g P m�2, inabove-ground alive biomass was found on April 8 and thehighest content, 1.46 g P m�2, on July 27. This correspondsto a daily uptake rate of 11.9 mg P m�2 day�1 (Table 2). In1993 the phosphorus content in above-ground alive biomassincreased from 0.64 g P m�2 on March 23 to 1.38 g P m�2 onAugust 9, equivalent with a daily uptake rate of5.3 mg P m�2 day�1 (Table 2).
Model calculations
Groundwater flow
Themodel was used to calculate the groundwater flow acrossthe boundary between two stations, forming one sectionalarea. The flow calculations between station 1 and 2 (flow1of sectional area 1), between station 2 and 3 (flow2 of sec-tional area 2), and between station 3 and 4 (flow3 of sec-tional area 3) were carried out independently of one another.
Input data to the three model sectional areas were: hor-izontal distance between stations (Fig. 3), vertical extent ofeach layer included in the model (Table 3). Because thewidth of the transect was set to 1 m groundwater flow is gi-ven in m3 per meter meadow.
For every measuring date (i.e. once a week in 1992–1993and every two weeks in 1994) the groundwater table is inputto the model, and thus the upper boundary of the modelchanges (or may change) from measuring date to measuringdate. The dynamic water table is obviously an approxima-tion to increasing or decreasing groundwater flow (rechargefrom the upland) as well as precipitation or evapotranspira-

J F M A M J J A S O N D J F M A M J J A S O N D J F M A M J J A S O N D1992 1993 1994
25 cm Depth 65 cm 105 cm 165 cm
Station 1
Station 2
Station 3
Station 4
Stream
NO
3- -N (
mg
l-1)
0
6
4
2
8
10
12
14
16
18
0
6
4
2
8
10
12
14
16
18
0
6
4
2
8
10
12
14
16
18
0
6
4
2
8
10
12
14
16
18
0
6
4
2
8
10
12
14
16
18
Figure 7 Nitrate-N concentration in different depths at piezometer nest 1–4 and in Voldby Brook.
Groundwater flow and transport of nutrients through a riparian meadow – Field data and modelling 325
tion in the meadow. Further, it should be noticed that thesummer situation in 1992 and 1994 where the meadow ina short period is recharged by both groundwater from the
upland and by stream water from Voldby Brook, is handledseparately as the usual flow path at this time is temporaryinterrupted.

0
0.2
0.4
0.6
0.8
1.0
1.2
J F M A M J J A S O N D J F M A M J J A S O N D J F M A M J J A S O N D1992 1993 1994
0
0.2
0.4
0.6
0.8
1.0
1.2
0
0.2
0.4
0.6
0.8
1.0
1.2
0
0.2
0.4
0.6
0.8
1.0
1.2
0
0.2
0.4
0.6
0.8
1.0
1.2
25 cm Depth 65 cm 105 cm 165 cm
Station 1
Station 2
Station 3
Station 4
Stream
NH
4+-N
(m
g l-1
)
Figure 8 Ammonium-N concentration in different depths at piezometer nest 1–4 and in Voldby Brook.
326 C.C. Hoffmann et al.
Because the hydraulic conductivities were measured withthe highest mean relative uncertainty (15%) of all variables,the K-values were used to calibrate the models in order toconsistently get the same groundwater flow moving from
the hillslope to the stream for all three model sectionalareas.
The model was tested in a four layer version and a threelayer version. The results obtained with the two versions

Table 2 Dry weight (DW) of alive and dead above ground biomass, nitrogen content (N) in alive and dead above ground biomassand phosphorus content (P) in alive and dead above ground biomass
Year BiomassDW – N – P
Month
1 2 3 4 5 6 7 8 9 10 11 12
1992 DW Alive – – – 84 172 425 574 341 730 771 625 5501992 DW Dead – – – 143 14 0 0 17 21 33 36 581993 DW Alive 324 – 247 – – 282 510 360 318 362 – –1993 DW Dead 281 – 680 – – 98 278 142 348 396 – –1992 N Alive – – – 2.28 4.31 5.84 8.35 7.07 12.42 12.98 11.98 10.661992 N Dead 3.35 0.35 0 0 0.21 0.24 0.45 0.65 1.081993 N Alive 7.12 – 4.97 – – 6.26 8.34 9.07 6.98 7.83 – –1993 N Dead 5.93 13.56 1.73 4.83 2.59 6.43 7.24 – –1992 P Alive – – – 0.15 0.33 0.58 1.46 0.94 0.83 0.91 0.70 1.201992 P Dead 0.23 0.02 0 0 0.04 0.02 0.03 0.04 0.131993 P Alive 0.79 – 0.64 – – 0.83 1.33 1.38 1.07 1.19 – –1993 P Dead 0.73 – 1.98 – – 0.21 0.72 0.38 0.96 0.97 – –
Units: g DW m�2, g N m�2 and g P m�2.
Table 3 Input data to three-layer model set-up
H Flow1 Flow2 Flow3
St. 1 m K1�2 m d�1 St. 2 m St. 2 m K2�3 m d�1 St. 3 m St. 3 m K3�4 m d�1 St. 4 m
1 0.89 25.5 0.35 0.35 37.2 0.74 0.74 21.1 0.842 0.50 31.1 0.59 0.59 33.3 1.15 1.15 25.1 0.563 0.31 16.1 0.31 0.31 18.4 0.31 0.31 28.5 0.50P
1.70 – 1.25 1.25 – 2.20 2.20 – 1.90
Layer number, H, vertical extent of a layer at each station, St., and sum of all layers,P
, all in meter. Hydraulic conductivity, K, in meterper day, for each layer used for calculating groundwater flow between stations in the meadow.
Groundwater flow and transport of nutrients through a riparian meadow – Field data and modelling 327
showed that the calculated groundwater flows were almostidentical. However, the four layer model failed when nutri-ent transport was included, because the number of watersamples at stations 3 and 4, at a depth of 25 cm, were tooscarce to support this higher depth-resolution. Thus, the re-sults presented below are based on the three layer versionof the model.
Results from three-layer model set-up
In the three-layer model set-up the vertical extent of thedifferent layers at stations 1–4 and the applied hydraulicconductivities are given in Table 3. The flows, referred toas flow1, flow2, and flow3, calculated in this calibrationare shown in Fig. 9 for the three years. The groundwaterflow was calculated for 138 dates. Although some discrep-ancy is seen in day to day comparisons of the three sectionalareas, the overall pattern through the seasons of the yearsagrees well. More specific, most calculated values lie withinthe 95% confidence limits also shown in Fig. 9. The individ-ual discrepancies were found in February 92, June 92, Jan-uary 93, December 93, and October 94. In June 92 streamwater recharged the meadow, which means that flow2and flow3 are negative due to opposite direction of watercompared to flow1 recharging the meadow from thehillslope.
The mean groundwater flow through the riparian mea-dow can be calculated based on the following two assump-tions: (i) the flow of groundwater from hillslope to stream isstrictly horizontal, (ii) flow1, flow2 and flow3 are equal butwith random variation around the true value due to geolog-ical heterogeneity (Fig. 9). For that reason, the mean valueof flow1, flow2 and flow3 was used to calculate the meanmonthly groundwater flow through the meadow. An excep-tion from this are the two summer periods in 1992 and1994, where stream water also recharges the meadow. Inthese periods only flow1, or flow1 and flow2 were used tocalculate the groundwater flow recharging the meadowfrom the upland, while flow3 was used to estimate the flowof stream water recharging the meadow. Thus, in those twoperiods, 27 days in 1992 and 20 days in 1994, the model onlycalculates the input of water to the meadow, but what fur-ther happens to the recharged water was not addressed.
Apart from summer, the groundwater flow through themeadow varies between 17 and 33 m3 m meadow�1
month�1. Groundwater flow in summer varies between 7and 13 m3 per m meadow�1 month�1. In June 1992 the mea-dow was recharged by both groundwater and stream water.Stream water recharge lasted 18 days and amounted to1.7 m3 m meadow�1 month�1. Stream water recharge con-tinued for 9 days in July 1992 and amounted to0.5 m3 m meadow�1 month�1. In June and July 1993 there

J F M A M J J A S O N D
1992
1993
1994
Flo
w (
m3
m m
eado
w-1
day
-1)
Flow 1 Flow 2 Flow 3
-0.4
0
0.4
0.8
1.2
1.6
2.0
2.4
-0.4
0
0.4
0.8
1.2
1.6
2.0
2.4
-0.4
0
0.4
0.8
1.2
1.6
2.0
2.4
Figure 9 Calculated groundwater flow with three-layer model. Flow1 is from stations 1 to 2, Flow2 is from stations 2 to 3, andFlow3 is from stations 3 to 4. Calculated 95% confidence limits are included for each of the three model sectional areas.
328 C.C. Hoffmann et al.
was a net discharge of groundwater to the stream, but onsingle measuring dates the discharge was close to zero indi-cating that recharge by stream water may have taken placein this period. In July 1994 there was recharge by streamwater to the meadow for 20 days, which amounted to1.2 m3 m meadow�1 month�1. At the end of June and begin-ning of August discharge of groundwater to the stream wasclose to zero.
Table 4 Synchronous discharge measurements, in Voldby Brooperformed along the meadow site in 1992
Date Length (m) Qus l s�1 (%) Qds l s
�1 (%) dQ l s�1
10-03-92 240 79.2 (2.3) 86.7 (3.5) 7.517-06-92 240 12.9 (0.4) 14.2 (1.8) 1.301-07-92 160 10.0 (1.2) 9.7 (0.5) �0.310-09-92 160 11.2 (1.8) 11.4 (3.6) 0.2
The table shows the dates when the discharge measurements weredischarge upstream, Qds = stream discharge downstream, dQ = increaseQ = discharge to stream or recharge of meadow (�) m3 m stream bancalculated discharge of water from the meadow to the stream or rechato 67� for comparison with stream discharge measurements.
The mean annual groundwater recharge to the meadowduring the years 1992–1993–1994 was 288, 304 and215 m3 m meadow�1 y�1, respectively.
There are a few synchronous discharge measurementsfrom this reach of Voldby Brook which can be compared tothe model predictions (Table 4). On March 10, 1992 the flowwas measured to 1.35 m3 m�1 day�1 assuming equal dis-charge of groundwater from both sides of the stream. On
k, mean of three replicas with uncertainty in parenthesis,
dQ (%) Q (m3 day�1) Model date Q Model (m3 day�1)
9.5 1.351 09-03-92 0.82910.2 0.233 15-06-92 0.075�2.6 �0.082 29-06-92 �0.0411.9 0.054 07-09-92 0.841
performed, the length of the stretch of the brook, Qus = streamor decrease in discharge shown as litre second and relatively (%),
k�1 day�1. The two right-hand columns show dates for the modelrge of the meadow (�). Model calculations are corrected with sine
Groundwater flow and transport of nutrients through a riparian meadow – Field data and modelling 329
March 9, 1992 the model predicted 0.901 ± 0.244 m3
m meadow�1 day�1 but as the transect is not at right anglesto the stream but has an angle of 67� it has to be correctedwith sine to 67 degrees for comparison, which gives0.829 ± 0.225 m3 m�1 day�1. On June 17, 1992 stream dis-charge was 0.233 m3 m�1 day�1 (assuming equal dischargeof groundwater from both sides of the stream) while themodel calculation on June 15, 1992 gave a groundwaterdischarge of 0.082 ± 0.152 m3 m meadow�1 day�1, whichcorrected with sine to 67� gives 0.075 ± 0.140 m3 m�1 day�1.On July 1, 1992 synchronous discharge measurementsshowed a loss of 0.08 m3 m�1 day�1 (Table 4), while themodel calculation estimated stream recharge of the mea-dow on June 29, 1992 to be 0.044 ± 0.142 m3 m meadow�1
day�1 or 0.041 ± 0.131 m3 m�1 day�1 (sine corrected). OnJuly 6, 1992 the meadow was still recharged by streamwater amounting to 0.073 ± 0.143 m3 m�1 day�1 (sine cor-rected). These data correspond satisfactorily, consideringthat the relative increase or decrease (dQ) in stream dis-charge measurements is small.
Residence time
The total volume of the meadow considered in the model iscalculated as follows: At stations 1–4 the vertical extent is1.70 m, 1.25 m, 2.20 m and 1.90 m (Table 3). The corre-sponding lengths along the transect are: 3 m, 9 m and 9 m(Fig. 3). Thus the total volume of the meadow transect is38.4 m3. With a mean groundwater level of 0.5 m belowground and a porosity of 38.3% the total volume of waterconsidered in the model is 10.7 m3. Based on this estimate,the mean groundwater residence time was 14, 13 and 18days, for the years 1992, 1993 and 1994, respectively. Basedon model predicted flows, the shortest groundwater resi-dence time was approximately 10 days, and the longest 42days. The two periods in summer 1992 (27 days) and 1994(20 days), when the meadow was both recharged by ground-water from the upland and by stream water are excludedfrom the above rough estimate of residence time as the fateof groundwater flow and residence time in these two peri-ods remain unknown.
Mass balances of nitrate, ammonium and phosphate
The nitrate load, i.e. input of nitrate with groundwaterrecharging the meadow, was calculated as the amount of ni-trate entering the meadow at station 1, which was locatedat the boundary to the upland field (Fig. 3). Technically thecalculation was done by setting the nitrate concentration atstation 2 to zero.
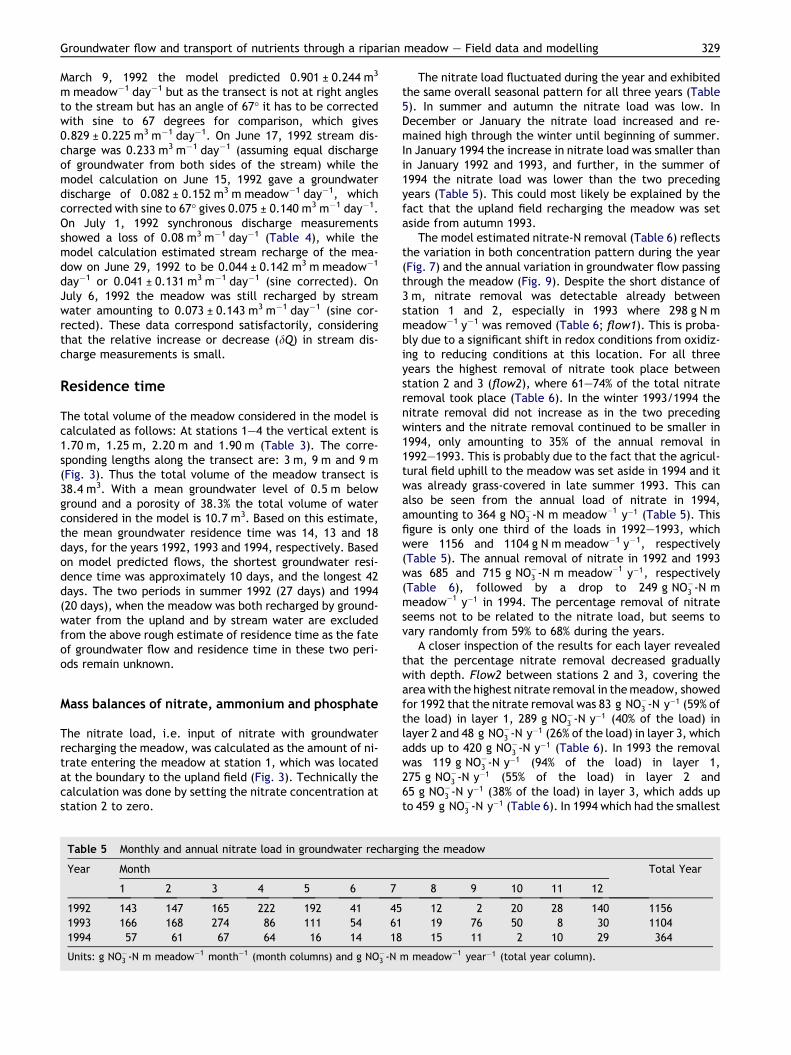
Table 5 Monthly and annual nitrate load in groundwater recharg
Year Month
1 2 3 4 5 6 7
1992 143 147 165 222 192 41 451993 166 168 274 86 111 54 611994 57 61 67 64 16 14 18
Units: g NO�3 -N m meadow�1 month�1 (month columns) and g NO�3 -N
The nitrate load fluctuated during the year and exhibitedthe same overall seasonal pattern for all three years (Table5). In summer and autumn the nitrate load was low. InDecember or January the nitrate load increased and re-mained high through the winter until beginning of summer.In January 1994 the increase in nitrate load was smaller thanin January 1992 and 1993, and further, in the summer of1994 the nitrate load was lower than the two precedingyears (Table 5). This could most likely be explained by thefact that the upland field recharging the meadow was setaside from autumn 1993.
The model estimated nitrate-N removal (Table 6) reflectsthe variation in both concentration pattern during the year(Fig. 7) and the annual variation in groundwater flow passingthrough the meadow (Fig. 9). Despite the short distance of3 m, nitrate removal was detectable already betweenstation 1 and 2, especially in 1993 where 298 g N mmeadow�1 y�1 was removed (Table 6; flow1). This is proba-bly due to a significant shift in redox conditions from oxidiz-ing to reducing conditions at this location. For all threeyears the highest removal of nitrate took place betweenstation 2 and 3 (flow2), where 61–74% of the total nitrateremoval took place (Table 6). In the winter 1993/1994 thenitrate removal did not increase as in the two precedingwinters and the nitrate removal continued to be smaller in1994, only amounting to 35% of the annual removal in1992–1993. This is probably due to the fact that the agricul-tural field uphill to the meadow was set aside in 1994 and itwas already grass-covered in late summer 1993. This canalso be seen from the annual load of nitrate in 1994,amounting to 364 g NO�3 -N m meadow�1 y�1 (Table 5). Thisfigure is only one third of the loads in 1992–1993, whichwere 1156 and 1104 g N m meadow�1 y�1, respectively(Table 5). The annual removal of nitrate in 1992 and 1993was 685 and 715 g NO�3 -N m meadow�1 y�1, respectively(Table 6), followed by a drop to 249 g NO�3 -N mmeadow�1 y�1 in 1994. The percentage removal of nitrateseems not to be related to the nitrate load, but seems tovary randomly from 59% to 68% during the years.
A closer inspection of the results for each layer revealedthat the percentage nitrate removal decreased graduallywith depth. Flow2 between stations 2 and 3, covering thearea with the highest nitrate removal in themeadow, showedfor 1992 that the nitrate removal was 83 g NO�3 -N y�1 (59% ofthe load) in layer 1, 289 g NO�3 -N y�1 (40% of the load) inlayer 2 and 48 g NO�3 -N y�1 (26% of the load) in layer 3, whichadds up to 420 g NO�3 -N y�1 (Table 6). In 1993 the removalwas 119 g NO�3 -N y�1 (94% of the load) in layer 1,275 g NO�3 -N y�1 (55% of the load) in layer 2 and65 g NO�3 -N y�1 (38% of the load) in layer 3, which adds upto 459 g NO�3 -N y�1 (Table 6). In 1994 which had the smallest
ing the meadow
Total Year
8 9 10 11 12
12 2 20 28 140 115619 76 50 8 30 110415 11 2 10 29 364
m meadow�1 year�1 (total year column).

Table 6 Mass balance for nitrate-N showing monthly and yearly rates of nitrate-N removal or gain in the saturated zone
Nitrate-N removal Month Total Year
1 2 3 4 5 6 7 8 9 10 11 12
1992Flow1 12 �27 9 53 �73 �10 �1 1 2 3 19 60 48Flow2 58 58 47 62 103 4 13 �7 �1 18 9 56 420Flow3 47 63 24 58 23 �4 4 8 �3 �1 �5 4 218Total 117 95 79 173 52 �10 16 3 �1 19 23 120 685
1993Flow1 6 29 45 14 31 �3 16 18 75 49 5 15 298Flow2 113 109 137 23 62 17 �14 �2 �1 1 1 12 459Flow3 5 �4 0 �29 1 14 45 �5 �16 �7 �9 �35 �41Total 124 134 181 8 94 28 47 10 58 42 �4 �8 715
1994Flow1 25 8 �5 4 5 3 0 3 6 1 5 15 69Flow2 29 35 43 41 �2 5 3 9 3 1 5 13 185Flow3 �22 �2 0 7 7 2 �0 1 1 �1 1 3 �4Total 31 42 39 52 10 9 3 13 10 0 10 30 249
The results are made up from all three model sectional areas. Flow1 is from station 1 to station 2, Flow2 is from stations 2 to 3 and Flow3is from stations 3 to 4. Units: g NO�3 -N m meadow�1 month�1 (month columns) and g NO�3 -N m meadow�1 year�1 (total year column).
330 C.C. Hoffmann et al.
groundwater recharge and the lowest nitrate load, nitrateremoval in layer 1, 2 and 3 was 21 g NO�3 -N y�1 (86% of theload), 125 g NO�3 -N y�1 (73% of the load) and 39 gNO�3 -N y�1 (45% of the load), respectively, and this adds upto 185 g NO�3 -N y�1.
The atmospheric bulk deposition (wet and dry) of nitratewas of minor importance (Table 7). Although 33–69% of thetotal N-deposition was nitrate, it only constituted 1% of thetotal nitrate load in 1992–1993 (1166 and 1117 g N m
Table 7 Mass balances for nitrate-N, ammonium-N and phospha
1992
Nitrate load saturated zone 1156Atmospheric nitrate deposition 10Total nitrate load 1166Groundwater discharge of nitrate 471Nitrate removal in saturated zone 685Net removal of nitrate 695
Ammonium load saturated zone 27.Atmospheric ammonium deposition 15.Total ammonium load 43.Groundwater discharge of ammonium 28.Ammonium retention in saturated zone �0.Net retention of ammonium 14.
Phosphate load saturated zone 2.Atmospheric phosphate deposition 0.Total phosphate load 3.Groundwater discharge of phosphate 5.Phosphate retention in saturated zone �2.Net retention of phosphate �1.For all three elements are shown load and removal/retention in the sadeposition, total load and total balance (i.e. net retention). The mea
meadow�1 y�1, respectively) and roughly 5% of the totalload in 1994 which amounted to 385 g N m meadow�1 y�1.
Input of nitrate to the meadow during stream water re-charge of the meadow amounted to 7:4 g NO�3 -N in 1992(June–July, 27 days) and 0:4 g NO�3 -N in 1994 (20 days inJuly). Groundwater recharge in the same two periods was20.1 and 12:2 g NO�3 -N, respectively. Thus, the total amountof nitrate which cannot be accounted for in 1992 is27:5 g NO�3 -N and it constitutes 2.3% of the total load in
te-P in g m meadow�1 year�1
1993 1994
1104 36413 21
1117 385389 115715 249728 270
6 23.5 16.48 26.9 10.74 50.4 27.15 37.5 38.19 �14.0 �21.79 12.9 �11.0
65 2.27 2.0592 1.03 0.4657 3.30 2.5142 4.06 1.5277 �1.79 0.5385 �0.76 0.99
turated zone and discharge from the saturated zone, atmosphericdow equals 21 m2 along the transect.

Groundwater flow and transport of nutrients through a riparian meadow – Field data and modelling 331
groundwater recharging the meadow in 1992. The 20 days inJuly 1994 make up 12:6 g NO�3 -N (3.5% of total load ingroundwater), which cannot be accounted for, but alsothe flooding period in February–March 1994 adds to theuncertainty of the nitrate balance this year.
Ammonium was leached from the meadow on an annualbasis (Table 7). Although the load of ammonium input withrecharging groundwater in the years 1992 to 1994 decreasedfrom 27.6 to 16:4 g NHþ4 -N m meadow�1 y�1, leaching ofammonium-N to the stream increased from 0.9 to21:7 g NHþ4 -N m meadow�1 y�1 (Table 7). In 1992 ammo-nium was retained in seven out of 12 months and leachingwas close to zero (Table 8). In 1993 ammonium was onlyretained in January, May and June, while leaching inAugust and September was high amounting to 5.1 and5:5 g NHþ4 -N m�1 meadow month�1, respectively. In 1994there was no retention of ammonium at all, and September– October showed the highest leaching 3.1 and6:3 g NHþ4 -N m meadow�1 month�1, respectively (Table 8).
The atmospheric deposition of ammonium varied from10.7 to 26:9 g NHþ4 -N m meadow�1 y�1 (Table 7), and madeup 36%, 53% and 39% of the total ammonium load for theyears 1992, 1993 and 1994, respectively. Including theatmospheric deposition in the ammonium mass balance forthe meadow results in a net retention of ammoniumamounting to 14:9 g NHþ4 -N m meadow�1 y�1 in 1992, anda net retention of 12:9 g NHþ4 -N m meadow�1 y�1 in 1993,while 1994 had a loss of 21:7 g NHþ4 -N m meadow�1 y�1 viagroundwater discharge to the stream and an atmosphericdeposition (wet and dry) of 10:7 g NHþ4 -N m meadow�1 y�1
resulting in an overall net loss of 11:0 g NHþ4 -N mmeadow�1 y�1 (Table 7).
Input of ammonium to the meadow during stream waterrecharge of the meadow amounted to 0:07 g NHþ4 -N in 1992(27days) and 0:03 g NHþ4 -N in 1994 (20 days). Groundwater
Table 8 Mass balance for ammonium-N showing monthly and year
NHþ4 -N retention Month
1 2 3 4 5 6
1992Flow1 3.0 2.4 2.6 3.4 2.1 0.3Flow2 �6.6 �2.0 �2.7 �6.7 �3.0 0.0Flow3 3.5 �0.9 3.0 1.7 0.9 �0.0Total 0.0 �0.5 2.9 �1.7 0.0 0.3
1993Flow1 0.7 �0.2 0.9 �0.0 0.2 1.1Flow2 �3.7 �3.6 �5.1 �2.6 0.4 0.1Flow3 3.8 2.6 4.1 2.5 �0.0 �0.1Total 0.8 �1.2 �0.1 �0.1 0.6 1.2
1994Flow1 �0.5 �0.5 �0.1 0.5 0.4 �0.1Flow2 �2.6 �2.0 �2.1 �1.8 �0.0 0.1Flow3 0.6 0.3 0.5 0.9 �1.2 �1.1Total �2.6 �2.2 �1.7 �0.4 �0.8 �1.1
The results are made up from all three model sectional areas. Flow1 isFlow3 is from station 3 to station 4. Units: g NHþ4 -N m meadow�1 montcolumn).
recharge in the same two periods was 0.28 and0:09 g NHþ4 -N, respectively. The amount of ammoniumwhich cannot be accounted during these two summer peri-ods only constitutes 1% of the total ammonium load ingroundwater (Table 7).
Phosphate exhibited the opposite pattern relative toammonium. In 1992 phosphate was leached during thewhole year, except for September which showed a smallretention (Table 9). Phosphate was leached both betweenstation 1 and 2 (flow1) and between station 3 and 4 (flow3).In 1993 this pattern continued but less pronounced, andthere was a net retention of phosphate in January, August,September and December (Table 9). This resulted in a de-crease in annual loss of phosphate (Table 7). The decreasein phosphate leaching continued in 1994, and although therestill was a net loss of phosphate during several months, theannual balance showed net retention of phosphate (Tables 7and 9). It was especially the decrease in phosphate leachingbetween stations 3 and 4 (flow3), which was significant. In1992 and 1993 leaching of phosphate was 1.75 and2:34 g PO3�
4 -P m meadow�1 y�1, respectively. In 1994 only0:66 g PO3�
4 -P m meadow�1 y�1 was leached. Comparingthe mass balances for all three years revealed, that therewas always retention of phosphate between stations 2 and3 (flow2) and always net loss of phosphate between stations3 and 4 (flow3; Table 9).
Atmospheric deposition of phosphate constituted 18–31% of the total P-load to the meadow (Table 7). In 1992leaching of phosphate via groundwater discharge was2.77 g P m meadow�1 y�1, but atmospheric depositioncompensated for 0.92 g P m meadow�1 y�1, resulting in anet loss of 1.85 g P m meadow�1 y�1 (Table 7). The samecalculation for 1993 resulted in a net loss of 0.76 gP m meadow�1 y�1. In 1994 there was retention of phos-phate in the saturated zone, 0.53 g P m meadow�1 y�1 and
ly rates of ammonium-N retention or loss in the saturated zone
Total Year
7 8 9 10 11 12
0.0 0.4 1.7 0.1 �0.2 0.3 16.00.2 0.2 �1.4 �0.6 �3.9 �4.3 �30.8�0.1 0.6 1.4 0.4 1.2 2.0 13.90.1 1.2 1.8 �0.0 �2.9 �2.1 �0.9
2.5 1.7 0.5 �1.0 0.3 �0.3 6.4�0.3 �1.5 �6.8 �6.3 �5.4 �2.6 �37.4�2.8 �5.3 0.6 5.4 4.9 1.4 17.1�0.6 �5.1 �5.7 �1.9 �0.3 �1.6 �14.0
�0.2 �0.1 1.9 6.3 2.1 �0.3 9.30.0 �0.4 �2.8 �3.2 �4.1 �5.2 �24.1�0.0 0.1 �2.1 �9.4 1.4 3.2 �6.8�0.2 �0.5 �3.1 �6.3 �0.6 �2.2 �21.7from station 1 to station 2, Flow2 is from station 2 to station 3 andh�1 (month columns) and g NHþ4 -N m meadow�1 year�1 (total year

Table 9 Mass balance for phosphate-P showing monthly and yearly rates of phosphate-P retention or loss in the saturated zone
PO3�4 -P
retentionMonth Total
Year1 2 3 4 5 6 7 8 9 10 11 12
1992Flow1 �0.09 �0.05 �0.02 �0.14 �0.61 �0.11 0.00 �0.14 �0.05 �0.10 �0.10 �0.06 �1.47Flow2 0.21 0.10 �0.25 �0.49 0.13 0.01 0.00 0.12 0.14 0.12 0.19 0.19 0.45Flow3 �0.18 �0.11 �0.17 0.10 �0.14 0.02 �0.05 �0.04 �0.09 �0.35 �0.50 �0.23 �1.75Total �0.06 �0.06 �0.45 �0.53 �0.62 �0.09 �0.05 �0.06 0.01 �0.33 �0.42 �0.11 �2.77
1993Flow1 0.49 �0.08 �0.10 �0.01 �0.00 0.00 �0.43 0.13 �0.00 �0.03 0.03 �0.08 �0.09Flow2 0.11 0.14 0.18 0.11 0.03 �0.04 0.28 0.32 0.10 �0.15 �0.30 �0.16 0.63Flow3 �0.48 �0.28 �0.73 �0.38 �0.09 �0.10 �0.61 �0.15 0.10 �0.21 0.22 0.37 �2.34Total 0.12 �0.22 �0.65 �0.28 �0.06 �0.13 �0.76 0.30 0.20 �0.39 �0.05 0.13 �1.79
1994Flow1 �0.32 �0.19 �0.02 �0.02 �0.03 0.00 0.00 0.01 �0.03 0.19 0.96 �0.01 0.54Flow2 0.23 0.15 �0.07 �0.10 0.06 �0.00 �0.00 0.01 0.04 0.07 0.11 0.14 0.65Flow3 �0.00 �0.07 �0.08 �0.19 �0.02 0.01 �0.01 �0.08 �0.11 �0.09 �0.14 0.11 �0.66Total �0.09 �0.11 �0.17 �0.30 0.01 0.01 �0.01 �0.06 �0.10 0.17 0.93 0.24 0.53
The results are made up from all three model sectional areas. Flow1 is from station 1 to station 2, Flow2 is from station 2 to station 3 andFlow3 is from station 3 to station 4. Units: g PO3�
4 -P m meadow�1 month�1 (month columns) and g PO3�4 -P m meadow�1 year�1 (total
year column).
332 C.C. Hoffmann et al.
together with atmospheric deposition of 0.46 g P mmeadow�1 y�1 net total retention added up to 0.99 g Pm meadow�1 y�1 (Table 7).
Input of phosphate to the meadow during stream waterrecharge of the meadow amounted to 0:018 g PO3�
4 -P in1992 (27days) and 0:012 g PO3�
4 -P in 1994 (20 days). Ground-water recharge in the same two periods was 0.043 and0:033 g PO3�
4 -P, respectively. Compared to the total loadof phosphate in groundwater recharging the meadow (Table7) the amount of phosphate which cannot be accounted forin these two summer periods only constitutes 2%. The lackof information about the flooding period in February–March1994 especially data on sedimentation makes the total phos-phate balance for 1994 uncertain.
Discussion
The saturated hydraulic conductivities were estimated tohave a relative error of 15% (coefficient of variation). This de-gree of accuracy is small compared to other studies, whichhave shown variations from tens of per cent to more than150% (Paivanen, 1973; Andersen, 2004). According to the soilprofile description the main body of the meadow consists ofmedium grained sand, and this may be the reason for therelative small error in measured hydraulic conductivity.Furthermore, in this study themeasured hydraulic conductiv-ities only vary between 12.1 m day�1 (i.e. 1.4 · 10�4 m s�1)and 37.5 m day�1 (i.e. 4.3 · 10�3 m s�1). Other studies haveshown hydraulic conductivities that varied 3–4–5 orders ofmagnitude (Paivanen, 1973; Maıtre et al., 2003; Andersen,2004; Angier et al., 2005) indicating much more heteroge-neous soil profiles as compared to this study.
In some riparian areas precipitation may contribute sig-nificantly to the total water input and may dilute chemicalcompounds such as nitrate (Maıtre et al., 2003). Precipita-
tion was not included in our estimates, but this error com-mitted was small: In the years 1992–1993–1994 totalprecipitation was 14.9, 17.9 and 22.6 m3 in the meadowtransect (21 m2). Compared to the groundwater flow thisconstitutes 5.2%, 5.9% and 10.5% for the three years. Ifevapotranspiration is subtracted, the relative contributionfrom net precipitation for the three years is in the rangeof 3–5%, as net precipitation from 1990 to 2000 in this areaamounts to approximately 400 mm y�1 and potential evapo-transpiration to 560 mm y�1 (Scharling and Kern-Hansen,2002).
In 1994 the groundwater discharge to the brook was low,only 215 m3 per meter meadow but precipitation of1076 mm was the highest in the three-year period. Precipi-tation in January, February and March 1994 was very high,350 mm, compared to 168 and 170 mm in 1992 and 1993,respectively. Due to the very high precipitation and snowfallin the whole catchment from December 1993 to March 1994the meadow was completely flooded in the period Februaryto March 1994 (approximately one month). For that reasonno measurements were taken in this period which prohib-ited trustworthy model predictions. It is not possible todetermine if this significant flood event was caused by highgroundwater discharge or impounded stream water causedby surface runoff as a result of heavy rainfall and snowmelt.
During summer months the meadow was also rechargedby stream water (Fig. 7). This observation is supported bysynchronous discharge measurements along the same reachof Voldby Brook in the River Gjern catchments area showingthat along this reach Voldby Brook recharges the riparianareas in low flow periods (Clausen, 1995; Kronvang et al.,1997; personal communication Clausen, Kronvang andSvendsen).
The nitrate removal from the groundwater movingthrough a riparian meadow as we report here, agree gener-

Groundwater flow and transport of nutrients through a riparian meadow – Field data and modelling 333
ally with other studies (Peterjohn and Correl, 1984; Cooper,1990; Haycock and Pinay, 1993; Cey et al., 1999; Clementet al., 2003; Maıtre et al., 2003;). However, unlike someof these studies, nitrate was not completely removed atour site. A possible explanation is that the width of themeadow is only 21 m and this is too short of a distance togive a complete nitrate removal, or formulated in anotherway, the groundwater residence time is too short to facili-tate a complete removal. Mean groundwater residence timevaried between 42 days during summer and 10 days duringwinter. Despite the longer summer residence time nitrateremoval is smaller because both nitrate concentration andnitrate load is lower during the summer. At wintertimewhen plant uptake of nitrate is insignificant, nitrate is mostlikely denitrified. Although the annual nitrate load de-creased from 1156 to 1104 g NO�3 -N m meadow�1 y�1 (i.e.550–525 kg NO�3 -N ha�1 y�1) in 1992–1993 to 364 g NO�3 -Nm meadow�1 y�1 (i.e. 173 kg NO�3 -N ha�1 y�1) in 1994 theremoval efficiency only increased by a few percent from59 and 65% in 1992–1993 to 68% in 1994. A possible explana-tion is that the denitrification process was limited by carbonavailability. The meadow aquifer sediments are sandy andthe content of organic matter (Fig. 5) is low in the saturatedpart. In the meadow at a depth of 50–100 cm the mean con-tent of organic matter was 3.2% and deeper at a depth of100–150 cm the mean content decreased to 1.6%. This isin line with the finding of Brettar and Hofle (2002) whofound a close correlation between organic matter contentand denitrification rates in a forest soil. Likewise, Hoffmannet al. (2000) showed for a riparian fen, that denitrificationwas non-detectable when the content of organic matterwas below 3%.
As pointed out by Correll (1996), there is considerableuncertainty on the exact role of riparian vegetation in ni-trate removal. Some studies have shown that plant uptakeof nitrogen and phosphorus can make a significant contribu-tion to the retention of these nutrients in riparian wetlands(Peterjohn and Correl, 1984; Lowrance et al., 1984; San-chez-Perez et al., 1991). Others claim that topography (Cir-mo and McDonnell, 1997; Clement et al., 2002; Vidon andHill, 2004b) and carbon availability (Cooper, 1990; Schipperet al., 1993; Brettar and Hofle, 2002) are more importantfactors for retention of nutrients in wetlands. In this studythe annual variation in nitrate concentration in groundwaterrecharging the meadow as well as the annual variation ingroundwater flow indicate that plant uptake of nitrate isof limited importance for nitrate removal in the meadow.Further, the position of the groundwater table, which isclose to the ground surface in winter and may decrease to1 m below ground in summer, suggests that denitrificationis more important than plant uptake.
The atmospheric deposition of nitrogen and phosphorusis of course available for plant uptake, but P-depositiononly constitutes 3–4% of total-P in above-ground standingstock and total-N deposition constitutes 9–21% of N instanding stock. Examining the position of the groundwatertable reveals that in the beginning of the growing season– April and May – and occasionally also later in the grow-ing season, the groundwater table is situated in the rootzone (Fig. 7). The nitrate load in groundwater rechargingthe meadow in April and May is also high enough to sup-port plant uptake of N (Table 2) even though only approx-
imately 22% of the groundwater flow occurs in the upperpart of the geological profile (layer 1) carrying 17–24%of the nitrate load. For a 60 day period (e.g. April andMay) nitrogen uptake amounts to 69 and 37 g (21 m2 mea-dow) in 1992 and 1993, respectively. Approximately 20% ofthe nitrate load recharging the meadow, 80 and40 g NO�3 -N in April–May 1992–1993, respectively, istransported in layer 1, and these amounts can fully sustainN-uptake in plants. On the contrary phosphate uptake inabove-ground biomass exceeds the phosphate load, andat the same time there is a net loss of phosphate viagroundwater discharge to the stream in 1992–1993. Themeadow was used for cattle grazing in summer until startof the study, and if the cattle received additional feed,for example commonly used concentrates, this may haveinfluenced P leaching from the meadow, because P-con-tent in cattle manure is high i.e. 2.0–2.6 kg P by the ani-mal grazing 165 days a year (Poulsen et al., 2001).
The consistently high concentration of ammonium at sta-tion 3 at a depth of 65 cm may be a result of denitrification,as the bacteria needs easy degradable carbon as an energysource, and mineralization of organic matter liberatesammonium. Comparing nitrate loads (Table 5) during theyear with ammonium concentration (Fig. 8) reveals thatammonium concentration is higher during months with highnitrate load (e.g. January 92–May 92 and January 93–March93) and lower during summer when nitrate load is small.This coincides with the result of the nitrate calculations,which showed that Flow2 (stations 2–3) always exhibitedthe highest nitrate removal (Table 6). Though the increasein ammonium concentration in the autumn months is notaccompanied by the same increase in nitrate load andtherefore other processes may be involved, such as mineral-ization of dead plant material when the growing seasonends.
The high nitrate load in 1992 and 1993 may have contrib-uted to the loss of phosphate from the saturated zone.Verhoeven and Arts (1987) have found phosphorus minerali-sation rates up to 2.3 kg P ha�1 y�1 in a fen with high nitrateload and groundwater through flow. In this meadow studyphosphate is retained in 1994 and this coincides with a de-crease in nitrate load to 364 g NO�3 -N m meadow�1 y�1
(i.e. 173 kg NO�3 -N ha�1 y�1). But also the groundwatertable may influence mobilisation of phosphorus. Meissneret al. (2004) found that fluctuations in groundwater tableto be the driving force for phosphorus mobilisation at fourdifferent study sites. Although the annual fluctuations ingroundwater table are significant in this study the annualpattern from year to year remains the same, and thereforefluctuation in groundwater level cannot alone explain whyphosphate is retained in 1994, but leached from the mea-dow in 1992–1993. There is a striking difference in nitrateload and nitrate removal between the first six months andthe last six month every year in the study period. Nitrateremoval in the first six months of 1992–1993–1994 is 506,569 and 183 g NO�3 -N m meadow�1, respectively, and dur-ing the last six months of 1992–1993–1994 it is 180, 145and 66 g NO�3 -N m meadow�1. Comparing these results withphosphate reveal that phosphate retention (or leaching) isopposite. During the first six months of 1992–1993–1994phosphate retention in the saturated zone amounts to�1.82, �1.22 and �0:56 g PO3�
4 -P m meadow�1 (i.e. leach-

334 C.C. Hoffmann et al.
ing), while retention in the last six months of 1992–1993–1994 is �0.96, �0,57 and ðþÞ 1:17 g PO3�
4 -P m meadow�1.Thus, the pattern is that when nitrate removal is high leach-ing of phosphate is high and when nitrate removal is lowerphosphate leaching decreases with approximately 50% in1992–1993 and results in retention of phosphate in 1994.
The flooding event in February–March 1994 is an elementof uncertainty to the results of the mass balance calcula-tions in 1994. We observed that the water level in some ofthe piezometers which were not drowned (i.e. still func-tional) showed the same water level as the floodwater,and therefore neither downwards nor upwards movementof water took place. But exchange of dissolved nutrientsmay have taken place by diffusion due to differences in con-centration of dissolved substances in surface water and soilwater. However, it is unclear exactly how this exchangemechanism may have acted both with respect to directionof concentration gradients and amount of substance ex-changed. Deposition of sediment and sediment associatedphosphorus may have taken place at the flooding event inFebruary–March 1994. Kronvang et al. (2002) estimatedfor a ten year period the sedimentation rate in the flood-plain at the mouth of River Gjern, to 2.1 kg dry weightm�2 y�1 while phosphorus deposition was estimated to8.2 g P m�2 y�1. But whether these figures reflect the depo-sition rates in the study site for this isolated event is diffi-cult to evaluate. The fate of the deposited sediments andsediment associated nutrients in the study site at VoldbyBrook is unknown but if the sediment associated nutrientswere mineralised and liberated in the saturated zone afterthe flooding event it is included in the mass balance forthe saturated zone.
Conclusion
Our study documents the importance of riparian ecotonesalong first order streams to reduce diffuse pollution fromagricultural areas. The hydrogeologic setting with an aqui-tard already at 2–3 m depth below the meadow surface al-low nitrate from shallow nitrate-rich groundwater to beremoved as water flows through the riparian aquifer.Although conditions for denitrification were not optimaldue to scarcity of organic matter, nitrate removal was sig-nificant. Construction of a model to calculate water andmass balances was a valuable tool to study variation intransport both in time and space. Plant uptake of nitrogenwas only significant in the beginning of the growing seasonwhile phosphorus uptake by plants was more difficult to val-idate, because the first two years of our study revealed anet loss of phosphorus from the meadow. Still plant produc-tion is important as a carbon source for denitrification asthe organic matter content in the meadow sediments isscarce. Periods with high nitrate removal was accompaniedby high phosphate leaching from the saturated zone, whileperiods with low nitrate removal was accompanied by signif-icant lower phosphate leaching or even retention of phos-phate in the saturated zone. The pronounced year to yearvariations in our nutrient budgets indicate that shorter stud-ies, for example based on only one year of observations,should be interpreted cautiously as representing a generalpicture of nutrient cyclings.
Acknowledgements
This study was supported by grants from the National Envi-ronmental Research Program, the Second Action Plan on theAquatic Environment and the National Environmental Re-search Institute. The excellent technical assistance of DorteNedergaard and Birte Eriksen is greatly acknowledged.
References
Amoozegar, A., Warrick, A.W., 1986. Hydraulic conductivity ofsaturated soils: field methods. In: Klute, Arnold (Ed.), Methodsof Soil Analysis, Part 1, second ed. American Society ofAgronomy, Inc., Soil Science Society of America Inc., Publisher,Madison, WI, USA, pp. 735–770.
Andersen, J.M., 1976. An ignition method for determination of totalphosphorus in lake sediments. Water Res. 10, 329–331.
Andersen, H.E., 2004. Hydrology and nitrogen balance of aseasonally inundated Danish floodplain wetland. Hydrol. Pro-cess. 18, 415–434.
Angier, J.T., McCarty, G.W., Prestegaard, K.L., 2005. Hydrology ofa first-order riparian zone and stream, mid-Atlantic coastalplain, Maryland. J. Hydrol. 309, 149–166.
Brettar, I., Hofle, M.g., 2002. Close correlation between the nitrateelimination rate by denitrification and the organic mattercontent in hardwood forest soils of the upper Rhine floodplain(France). Wetlands 22 (2), 214–224.
Cey, E.E., Rudolph, D.L., Aravena, R., Parkin, G., 1999. Role of theriparian zone in controlling the distribution and fate of agricul-tural nitrogen near a small stream in southern Ontario. J.Contaminant Hydrol. 37, 45–67.
Clausen, B., 1995. Discharge data collection and analysis strategiesin low flow studies. Nordic Hydrol. 26, 191–204.
Cirmo, C.P., McDonnell, J.J., 1997. Linking the hydrologic andbiogeochemical controls of nitrogen transport in near-streamzones of temperate-forested catchments: a review. J. Hydrol.199, 88–120.
Clement, J.-C., Pinay, G., Mormonier, P., 2002. Seasonal dynamicsof denitrification along topohydrosequences in three differentriparian wetlands. J. Environ. Qual. 31, 1025–1037.
Clement, J.-C., Aquilina, L., Bour, O., Plaine, K., Burt, T.P., Pinay,G., 2003. Hydrological flowpaths and nitrate removal rateswithin a riparian floodplain along a fourth-order stream inBrittany (France). Hydrol. Process. 17, 1177–1195.
Cooper, A.B., 1990. Nitrate depletion in the riparian zone andstream channel of a small headwater catchment. Hydrobiologia202, 13–26.
Correll, D.L. 1996. Buffer zones and water quality protection:general principles. In: Haycock, N.E., Burt, T.P., Goulding,K.W.T., Pinay, G. (Eds.) Buffer zones: Their processes andpotential in water protection. Proceedings of the InternationalConference on buffer Zones, September 1996. ISBN 0 9530051 00.
Groffman, P.M., Howard, G., Gold, A.J., Nelson, W.M., 1996.Microbial nitrate processing in shallow groundwater in a riparianforest. J. Environ. Qual. 25, 1309–1316.
Haycock, N.E., Pinay, G., 1993. Groundwater nitrate dynamics ingrass and poplar vegetated riparian buffer strips during winter.J. Environ. Qual. 22, 273–278.
Hoel, P.H., Port, S.C., Stone, C.J., 1971. Introduction to ProbabilityTheory. Houghton Mifflin Company, Boston.
Hoffmann, C.C., Rysgaard, S., Berg, P., 2000. Denitrification ratespredicted by Nitrogen-15 labeled nitrate microcosm studies,in situ measurements, and modeling. J. Environ. Qual. 29 (6),2020–2028.

Groundwater flow and transport of nutrients through a riparian meadow – Field data and modelling 335
Jackson, M.L., 1958. Soil chemical analysis. Prentice Hall, NewJersey.
Jacobs, T.C., Gilliam, J.W., 1985. Riparian losses of nitrate fromagricultural drainage waters. J. Environ. Qual. 14, 472–478.
Kronvang, B., Svendsen, L.M., Jensen, J.P., Dørge, J. 1997.Næringsstoffer – arealanvendelse og naturgenopretning (Landuse – nutrients and nature restoration). Tema-rapport DMU No.13 (Thematical report, National Environmental ResearchInstitute).
Kronvang, B., Falkum, Ø., Svendsen, L.M., Laubel, A., 2002.Deposition of sediment and phosphorous during overbank flood-ing. Verh. Internat. Verein. Limnol. 28, 1–5.
Lowrance, R.R., Todd, R.L., Fail Jr., J., Hendrickson Jr., O.,Leonard, R., Asmussen, L.E., 1984. Riparian forest as nutrientfilters in agricultural watersheds. Bioscience 34 (6), 374–377.
Luthin, J.N., Kirkham, D., 1949. A piezometer method for measur-ing permeability of soil in situ below a water table. Soil Sci. 68,348–358.
Maıtre, V., Cosandey, A.-C., Desagher, E., Parriaux, A., 2003.Effectiveness of groundwater nitrate removal in a river riparianarea: the importance of hydrogeological conditions. J. Hydrol.278, 76–93.
Mariotti, A., Landreu, A., Simon, B., 1988. 15N isotope biogeo-chemistry and natural denitrification process in groundwater:Application to the chalk aquifer of northern France. Geochim.Cosmochim. Acta 52, 1869–1878.
Meissner, R., Leinweber, P., (Eds.) 2004. Program for the preven-tion of diffuse pollution with phosphorus form degraded and re-wetted peat soils. UFZ Report Nr. 5, Centre for EnvironmentalResearch, Department of Soil Sciences.
Munsell soil color charts. 1994. Revised edition. Macbeth Division ofKollmorgan Instruments Corporation, New Windsor, NY, USA.
Ostrom, N.E., Hedin, L.O., von Fischer, J.C., Robertson, G.P.,2002. Nitrogen transformations and NO�3 removal at a soil-stream interface: a stable isotope approach. Ecol. Appl. 12 (4),1027–1043.
Paivanen, J., 1973. Hydraulic conductivity and water retention inpeat soils. Acta Forest. Fenn. 129, 1–67.
Peterjohn, W.T., Correl, D.L., 1984. Nutrient dynamics in anagricultural watershed: Observations on the role of a riparianforest. Ecology 65, 1466–1475.
Poulsen, H.D., Børsting, C.F., Rom, H.B., Sommer, S.G. 2001.Kvælstof, fosfor og kalium i husdyrgødning – normtal 2000(Nitrogen, phosphorus and potassium in manure – basic numbers2000 in Danish). DJF Rapport No. 36 Husdyrbrug.
Sanchez-Perez, J.M., Tremolieres, M., Carbiener, R. 1991. A site ofnatural purification for phosphates and nitrates carried by theRhine flood waters: the alluvial ash-elm forest. C.R. Acad. Sci.Paris t. 312, Serie IIIp. pp. 395–402.
Scharling, M., Kern-Hansen, C. 2002. Klimagrid – Danmark nedbørog for dampning 1990–2000. Danish Meteorological Institute,Technical Report 02-03.
Schipper, L.A., Cooper, A.B., Harfoot, C.G., Dyck, W.J., 1993.Regulators of denitrification in an organic riparian soil. Soil Biol.Biochem. 25 (7), 925–933.
Smith, R.L., Garabedian, S.P., Brooks, M.H., 1996. Comparison ofdenitrification activity measurements in groundwater usingcores and natural-gradient tracer tests. Environ. Sci. Technol.30, 3448–3456.
Svendsen, L.M., Kronvang, B., Kristensen, P., Græsbøl, P., 1995.Dynamics of phosphorus compounds in a lowland river system:importance of retention and non-point source. Hydrol. Process.9, 119–142.
Verhoeven, J.T.A., Arts, H.H.M., 1987. Nutrient dynamics in smallmesotrophic fens surrounded by cultivated land II. N and Paccumulation in plant biomass in relation to the release ofinorganic N and P in the peat soil. Oecologia 72, 557–561.
Vidon, P., Hill, A.R., 2004a. Denitrification and patterns of electrondonors and acceptors in eight riparian zones with contrastinghydrogeology. Biogeochemistry 71, 259–283.
Vidon, P.F.G., Hill, A.R., 2004b. Landscape controls on hydrology ofstream riparian zones. J. Hydrol. 292, 210–228.
Youngs, E.G., 1968. Shape factors for Kirkham’s piezometer methodfor determining the hydraulic conductivity of soil in situ for soilsoverlying an impermeable floor or infinitely permeable stratum.Soil Sci. 106 (3), 235–240.