groundwater modeling at pantex and recommendations of the
TRANSCRIPT

Groundwater Modeling at Pantexand
Recommendationsof the
Technical Advisory Group
STANDTechnical Report 2002 – 1
September 2002

STAND is a 501(c)(3) non-profit grassroots organizationdedicated to government that is accountable to the community,to citizen responsibility for the welfare of our communities, and
to a forum for public debate in which to find solutions.
STAND’s goal isthe protection of human health and the long-term
preservation of the natural resources entrusted to our care.
This project was funded by a grant from the Citizens’ Monitoring and Technical Assessment Fund.This fund was created as part of a 1998 court settlement between
the U.S. Department of Energy and 39 nonprofit peace and environmental groups around the country.The purpose of the fund is “to provide monies to ‘eligible organizations’ to procure technical and scientific
assistance to perform technical and scientific reviews and analyses of environmental management activitiesat DOE sites” and to disseminate those reviews and analyses.

Groundwater Modeling at Pantexand Recommendations
of theTechnical Advisory Group
prepared for
by
George Rice, Groundwater Hydrologist
September 2002


Executive SummaryThe Department of Energy (DOE) Pantex Plant is developing models to simulate groundwaterflow and contaminant transport. A Technical Advisory Group (TAG) was formed to examinegroundwater modeling issues at Pantex, review available models, and recommend those modelsit felt were appropriate to the situations at Pantex.
This report discusses: (1) groundwater models; (2) modeling issues and requirements in generaland at Pantex; (3) the TAG and its recommendations; and (4) the reliability of model results.
Computer models simulate groundwater flow and the movement of contaminants. They are usedfor a wide variety of purposes, including predicting the effects of pumpage, estimating contami-nant migration rates, estimating cleanup times, and designing monitoring networks. The valid-ity of model results depends on a large number of factors such as accurate site-specific informa-tion and an understanding of the range of geologic conditions in the subsurface.
Pantex is contaminated with a wide variety of hazardous materials, and contaminant flowpathsare complex. Contaminants migrate from land surface, through the upper unsaturated zone, tothe perched aquifer. They then may migrate through the lower unsaturated zone to the OgallalaAquifer. Thus, models used at Pantex must be able to simulate
· saturated and unsaturated flow in three dimensions,· the simultaneous movement of multiple contaminants, and· the chemical and physical processes that affect contaminant concentrations as
they move through the subsurface.
The TAG recommended that separate models be developed for each of three areas:· the Regional Ogallala Aquifer,· the Burning Grounds and the City of Amarillo wellfield north of Pantex, and· the southeast portion of Pantex (zones 11 and 12).
The TAG also recommended that model information, such as final input files, be made availableto the public. Both of the primary groundwater flow models recommended by the TAG(MODFLOW and FEMWATER) are available at no cost.
DOE accepted the TAG’s recommendations.
Model results are often presented to the public as if they are beyond question. However, modelresults are sometimes misleading or nonsensical. The public can, and should, question thereliability of model results. Interested citizens can raise the following questions:
· Are the assumptions incorporated into the model reasonable?· Are all significant physical features included?· Is the model based on site specific data?· Can the model predict the past? If not, with what confidence can it predict the
future?· Has a sensitivity study been done?· Are the results believable?


v


1
Groundwater Modeling at Pantex
1.0 Introduction
The Department of Energy (DOE) is developing models to simulate groundwater flow and contami-nant transport at Pantex. A Technical Advisory Group (TAG) was formed to examine modeling issuesat Pantex, review available models, and recommend appropriate models1.
This report discusses: (1) groundwater models, (2) modeling issues and requirements in general,and at Pantex, (3) the TAG and it’s recommendations, and (4) the reliability of model results.
Endnotes appear in Section 8.0 and technical terms are defined in Appendix 2 – Glossary.
2.0 Groundwater Models
2.1 General
Models are simplified descriptions of complex natural systems. As used here, the term modelmeans a computerized, mathematical2 representation of a groundwater system. Models simulategroundwater flow or the movement of contaminants. They are used for a wide variety of purposesincluding:
• Evaluating groundwater availability• Predicting the effects of pumpage on groundwater levels• Estimating the time required for contaminants to reach a receptor• Estimating contaminant concentrations at potential receptors• Designing and evaluating aquifer cleanup systems• Designing and evaluating contaminant containment systems• Estimating the time required to meet cleanup goals• Assessing past contaminant migration pathways• Designing monitoring networks• Delineating wellhead protection zones
There are a number of ways to classify models. The most common is to divide them into two types:groundwater flow models and contaminant transport models.
Groundwater flow models simulate the flow of water through the subsurface. Flow may be simu-lated through saturated or unsaturated (vadose) materials. Models that are capable of simulatingflow through unsaturated materials are more complex and require more data than models thatsimulate only saturated flow.
Contaminant transport models simulate the movement of contaminants through the subsurface.The simplest transport models simulate the movement of only a single contaminant (single compo-nent) and do not account for transformations that may occur along the flow path. More sophisticatedtransport models are capable of simultaneously simulating the movement of multiple contaminants(multi-component), and accounting for chemical transformations. These transformations mayinclude radioactive and biological decay, reactions with other contaminants, and interactions withgeologic materials. Sophisticated transport models are complex and require a great deal of data.Some transport models simulate both flow and transport. Others simulate only transport and mustbe used in conjunction with a flow model. Contaminant transport models are also called fate andtransport models.

2
Groundwater Modeling at Pantex
Models may also be classified as: two dimensional (2-D) or three dimensional (3-D), depending onwhether they simulate processes in two or three space dimensions; single phase or multi-phase,depending on whether they simulate the flow of one (e.g., water) or more (e.g., water, gas, oil,solvents) fluids; and finite difference or finite element. Finite difference and finite element refer to themathematical structure of models.
2.2 Processes that affect Contaminant Transport
Contaminants and other solutes being transported in groundwater are subject to a variety of pro-cesses that act to change their concentrations and reduce their migration rates. These processesinclude:
• Dispersion – the dilution of a contaminant due to spreading of the contaminant plume. Ananalogous process is the spreading (dispersion) of a plume of smoke from a smokestack.
• Radioactive decay – the disintegration of an atom to form other (daughter) products. Thedisintegration is accompanied by the release of energy (radiation).
• Biodegradation (biologic decay) – the transformation or destruction of organic contami-nants (e.g., trichloroethylene [TCE], toluene) by microorganisms. This process may convertone contaminant into another. For example, TCE biodegrades to dichloroethylene (DCE),and DCE biodegrades to vinyl chloride.
• Abiotic reactions – the transformation or destruction of contaminants by chemical reactionsthat do not involve microorganisms. This includes the oxidation or reduction of metals, andthe dehalogenation of organic contaminants.
• Sorption - a process that binds, usually temporarily, a contaminant to a mineral surface or toorganic matter. This temporary binding acts to reduce (retard) the contaminant migration ratewith respect to the groundwater. Some contaminants (e.g., nitrate) are not affected bysorption, and travel at the same speed as the groundwater. Others (e.g., most metals) arestrongly affected by sorption and travel much more slowly than the groundwater. [Note:Under some circumstances, metals will combine (complex) with other solutes (ligands).The metal-ligand complex is often much more mobile than the uncomplexed metal.]
• Precipitation – the combination of solutes to form a solid material. This often happens tometals, as when dissolved lead and carbonate combine to form the mineral cerussite.Precipitation reactions are often not reversible, and the precipitated contaminant is perma-nently removed from the groundwater.
• Volatilization/Vaporization – the formation of gasses that may emerge from water asvapors. Many volatile organic contaminants (e.g., TCE, toluene) may vaporize and travelupward through the unsaturated zone.
Some contaminant transport models are capable of simulating only one or two of these processes.The most sophisticated models can simulate all of them (see Appendix 1).
2.3 Conceptual Models
The first, and perhaps most important step in producing a computerized model, is the developmentof a conceptual model. It is not a computer model. A conceptual model is the modeler’s concept ofthe groundwater system and the processes that control flow and contaminant transport. The com-

3
Groundwater Modeling at Pantex
puterized model is based on the conceptual model. If the conceptual model is based on incorrectassumptions or incomplete information, the computerized model will probably not produce reliableresults.
A conceptual model for a groundwater flow model should describe all the significant features of theflow system and the relationships between them. These may include:
• Boundaries of the flow system• Stratigraphy• Aquifers and their hydraulic relationships to other geologic units• Relationships between groundwater and surface water• Groundwater levels• Groundwater flow directions• Groundwater sources (recharge)• Groundwater sinks (e.g., wells, springs)
A conceptual model for a contaminant transport model should address the major contaminants andthe processes that affect contaminant concentrations and migration rates. It should describe:
• Distributions of major contaminants• Contaminant sources• Contaminant sinks (e.g., extraction wells)• Potential contaminant receptors• Pathways from contaminant sources to receptors• Processes that affect contaminant transport (e.g., biodegradation, sorption)
Figures 2.3-1 and 2.3-2 are examples of conceptual models. Figure 2.3-1 is a schematic represen-tation of the major geologic units and contaminant pathways at Pantex. Figure 2.3-2 is a descriptionof the relationships between contaminant sources and potential receptors at the Pantex BurningGround.

4
Groundwater Modeling at Pantex
Figure 2.3-1 Conceptual Model-1Geologic Units and Contaminant Pathways at Pantex
(Adapted from DOE, 2001)

Groundwater Modeling at Pantex
5
Figure 2.3-2 Conceptual Model-2Relationships Between Sources and Receptors at Pantex Burning Ground
(Adapted from Draft in BWXT, 2001)

6
Groundwater Modeling at Pantex
2.4 Data Requirements
Groundwater models require site-specific data and information concerning the flow system andcontaminants. More sophisticated models(e.g., unsaturated flow models) require data in addition tothat required by less sophisticated models.
Data and information required by groundwater flow models include:
• Flow system boundaries• Depths and thicknesses of each geologic unit• For each geologic unit:
o Groundwater elevations or pressures (hydraulic head)o Recharge locations and rateso Discharge locations and rateso Hydraulic conductivitieso Effective porositieso Storage coefficientso Hydraulic conductivity/saturation relationships (for unsaturated materials)
Additional data required by contaminant transport models may include:
• Initial distributions and concentrations of contaminants• Locations of contaminant sources• For each geologic unit in which transport is simulated:
o Fluid chemistry, including concentrations of major solutes, pH, andoxidation-reduction potential
o Dispersion coefficientso Bulk densitieso Fraction of organic carbon
• For each simulated contaminant:o Partition coefficiento Biodegradation rate
3.0 Groundwater and Contamination at Pantex
There are three aquifers and two unsaturated zones at Pantex (Figure 2.3-1). The upper unsaturatedzone extends from ground surface to the water table of the perched aquifer (depth ranges from 260feet to 290 feet3 below ground surface). The average saturated thickness of the perched aquifer isapproximately 14 feet, and the maximum thickness is approximately 75 feet4. However, the perchedaquifer is absent in some areas (e.g., Burning Grounds, See Stoller, 2001, figure 2-15). Where it isabsent, a single unsaturated zone extends from ground surface to the water table of the OgallalaAquifer. The lower unsaturated zone extends from the bottom of the perched aquifer to the watertable of the Ogallala Aquifer (depth ranges from 350 feet to 425 feet below ground surface5). Thesaturated thickness of the Ogallala ranges from less than 25 feet to more than 400 feet6. TheDockum Group Aquifer immediately underlies the Ogallala7.
Groundwater flow directions in the perched aquifer vary depending on location8. Groundwater nearthe western plant boundary flows southeasterly, onto the plant. Groundwater in the eastern portion ofthe plant flows in all directions, with a significant amount flowing off-site to the east and southeast9.Groundwater in the Ogallala Aquifer flows from southwest to northeast10. Flow directions in theDockum Group Aquifer are not known11.

Groundwater Modeling at Pantex
7
The saturated and unsaturated zones at Pantex are contaminated with a wide variety of hazardousmaterials including: solvents12 (e.g., TCE, tetrachloroethylene [PCE]), metals13 (e.g., chromium,lead), and explosives14 (e.g., RDX, TNT).
The perched aquifer is contaminated with solvents, metals, and explosives15. The most widespreadcontaminant is RDX. The RDX plume in the southeastern portion of the plant (Zones 11 and 12)extends approximately 3.5 miles from north to south, and 2 miles from east to west. The RDX plumeextends approximately one half mile beyond the eastern plant boundary16.
The Ogallala Aquifer in the northern portion of the plant is contaminated with TCE and toluene17.Benzene and toluene have been found approximately one half mile north of the plant, near the City ofAmarillo’s well field18. High concentrations of metals (e.g., lead, thallium19) have also been found inthe Ogallala beneath Pantex. However, because background concentrations have yet to be estab-lished, the origin of these metals has not been determined.
Information on contaminants in the Dockum Group Aquifer is not available.
Additional information on groundwater and contamination at Pantex can be found in: Battelle (1997),DOE (2000h), Rice (2001a), and Stoller (2001).
4.0 Modeling Requirements and Deficiencies at Pantex
At Pantex the DOE has used, or intends to use, models to20:
• Predict contaminant migration rates• Predict contaminant concentrations at potential receptors• Evaluate alternate cleanup system designs• Design monitoring systems• Identify contaminant sources
4.1 Model Requirements at Pantex
The choice of models to be used at Pantex should be based on the characteristics of the groundwa-ter systems, the distribution of contaminants, and the types of contaminants present.
A wide variety of contaminants are present at Pantex. Water is transporting these contaminants fromnear ground surface, through the upper unsaturated zone, to the perched aquifer (see Figure 2.2-1).Upon reaching the perched aquifer, the bulk of the contaminants are probably transported laterally.Some of them, however, may migrate into the lower unsaturated zone, and toward the OgallalaAquifer. At any point along their flowpaths the contaminants are subject to the processes that affectcontaminant transport (see section 2.2).
In view of the above, the flow models used at Pantex should be able to simulate saturated andunsaturated flow in three dimensions. The transport models should simulate the simultaneousmovement of multiple contaminants, and account for the transformations that occur along theflowpaths. It is possible that other liquids (e.g., DNAPLs) are also present in the subsurface atPantex. If so, multi-phase models may be required. Either finite difference or finite element modelsmay be used.

Groundwater Modeling at Pantex
8
4.2 Conceptual Model Deficiencies and Data Gaps at Pantex
Several important features of the flow systems and the extent of contamination remain unknown atPantex.
• The extent of contamination in the Ogallala Aquifer is unknown. Large areas on the Pantexplant contain no Ogallala wells. These include the northwest portion of the plant, the areasaround playas 2 and 4, and the area between the Burning Grounds and the Pantex supplywells in the northeast corner of the plant21.
• The extent of the perched aquifer in the northern and western portions of Pantex, and to thenortheast of Pantex, is unknown. There are few or no monitor wells or borings in the perchedaquifer in these areas22.
• The lateral extent and hydraulic properties of the Dockum Group Aquifer at Pantex areunknown23. The direction of any groundwater flow between the Ogallala Aquifer and theDockum Group is also unknown24.
• Wastewater from the Pantex was discharged to Pantex Lake from 1942 until 197025. DOEhas not investigated the possibility that the wastes have contaminated groundwater near thelake.
Much of the site specific data required to develop defensible models of groundwater flow and con-taminant transport at Pantex have not been collected. Parameters for which no data, or an insuffi-cient amount of data, have been collected include:
• The hydraulic conductivity of Ogallala Aquifer• The hydraulic properties of the Dockum Group Aquifer26
• Relationships between hydraulic conductivity and degree of saturation• Parameters that control contaminant transport:
o Dispersion coefficientso Bulk densitieso Fraction of organic carbono Partition coefficientso Biodegradation rates
DOE acknowledges the existence of data gaps and other problems in its characterization of ground-water and contamination at Pantex27. It is correcting some of these deficiencies.
5.0 The TAG
The TAG was formed by DOE’s contractor, BWXT Pantex L.L.C., to make recommendations con-cerning groundwater models to be used at Pantex. TAG recommendations were based on a reviewof groundwater systems and modeling requirements at Pantex, and a review of available models.The TAG’s recommendations were not binding, and final decisions were made by the DOE.
5.1 Membership and Schedule
The following TAG members attended at least one meeting:
Ray Brady Panhandle Groundwater Conservation DistrictMichelle Bolwahnn BWXT

Groundwater Modeling at Pantex
9
Boyd Deaver, Chairman BWXTLarry Deschaine SAICRussel Edge DOE, AlbuquerqueDr. David Janecky Los Alamos National LaboratoryDr. Roger Peebles Texas Center for Applied Technology (for TNRCC)Dr. Ken Rainwater Texas Tech UniversityGeorge Rice STANDDr. Bridget Scanlon Texas Bureau of Economic GeologyDr. Jeff Stovall BWXT
The following also took part in or attended the meetings: Pam Allison (STAND), John Ford (Stoller),Tad Fox (SAIC), Tom Hicks (DOE), Shawn Leppert (Leppert Associates), Laura Pendlebury (DOE),Mike Space (Terradigm), Andrea Starnes (intern), Anna Stickrod (BWXT), and Dale Stout (BWXT).
The TAG held four meetings: August 2, 2001 - Pantex PlantAugust 30 and 31 - San Antonio, TXNovember 27, 2001 – Austin, TXFebruary 4, 2002 – Pantex Plant
5.2 Model Review and Recommendations
The TAG reviewed 19 groundwater flow and contaminant transport models. A brief description ofeach model is given in Appendix 1.
The TAG recommended a graded approach to modeling. Under this approach, relatively less com-plex models would be used initially. More complex models and model options would be used only asnecessary to address issues that require more sophisticated features (e.g., multiphase flow).
The TAG recommended the development of separate models for each of three areas.
� Regional Ogallala Aquifer. This area will be modeled with a saturated flow model. The bound-aries of this model may extend miles beyond the Pantex plant.
� Burning Ground and off-site areas to the north of the plant, including the City of Amarillo wellfield. This area will be modeled with a groundwater flow and transport model. The model willencompass the perched aquifer and Ogallala aquifer, as well as the unsaturated zones. Themodel will be linked to the regional Ogallala Aquifer model.
� Zones 11 and 12 on the southeast portion of the Plant, and the contaminated areas to thesouth and east of the plant. This area will also be modeled with a groundwater flow andtransport model. The model will encompass the perched aquifer and Ogallala aquifer, as wellas the unsaturated zones. The model will be linked to the regional Ogallala Aquifer model.
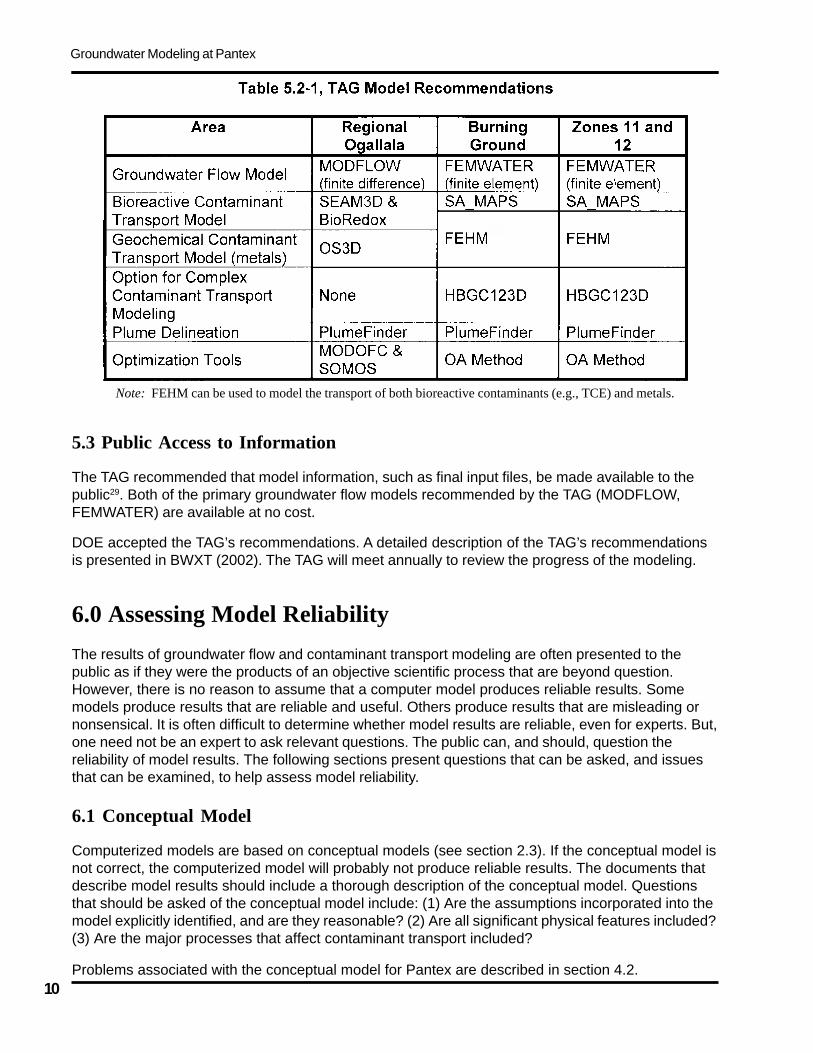
The Dockum Group Aquifer may also be included the models, depending on the results of futureinvestigations. The TAG’s model recommendations are presented in table 5.2-1.
In the future, the models for each area may be integrated into a single, comprehensive model. TheTAG also recommended the use of computerized tools to aid in determining the extent of contamina-tion (plume delineation) and to optimize the design of cleanup systems.
The TAG also recommended using the GMS graphical user interface (GUI). GUIs are computerprograms that aid model design and create maps of model results. Other GUIs such as ArgusONEand Groundwater Vistas may be used if necessary28.
Groundwater Modeling at Pantex
10
5.3 Public Access to Information
The TAG recommended that model information, such as final input files, be made available to thepublic29. Both of the primary groundwater flow models recommended by the TAG (MODFLOW,FEMWATER) are available at no cost.
DOE accepted the TAG’s recommendations. A detailed description of the TAG’s recommendationsis presented in BWXT (2002). The TAG will meet annually to review the progress of the modeling.
6.0 Assessing Model Reliability
The results of groundwater flow and contaminant transport modeling are often presented to thepublic as if they were the products of an objective scientific process that are beyond question.However, there is no reason to assume that a computer model produces reliable results. Somemodels produce results that are reliable and useful. Others produce results that are misleading ornonsensical. It is often difficult to determine whether model results are reliable, even for experts. But,one need not be an expert to ask relevant questions. The public can, and should, question thereliability of model results. The following sections present questions that can be asked, and issuesthat can be examined, to help assess model reliability.
6.1 Conceptual Model
Computerized models are based on conceptual models (see section 2.3). If the conceptual model isnot correct, the computerized model will probably not produce reliable results. The documents thatdescribe model results should include a thorough description of the conceptual model. Questionsthat should be asked of the conceptual model include: (1) Are the assumptions incorporated into themodel explicitly identified, and are they reasonable? (2) Are all significant physical features included?(3) Are the major processes that affect contaminant transport included?
Problems associated with the conceptual model for Pantex are described in section 4.2.
Note: FEHM can be used to model the transport of both bioreactive contaminants (e.g., TCE) and metals.

Groundwater Modeling at Pantex
11
6.2 Data
Models require input data, i.e., the values of the parameters that control groundwater flow andcontaminant transport. The values of these parameters may vary over wide ranges. For example,according to the scientific literature, the hydraulic conductivity of sandy aquifers ranges from lessthan one foot per day, to more than 1000 feet per day30. Thus, reliable model results require sitespecific data. When site specific data are not available, modelers may: (1) collect the necessarydata, or (2) rely on values reported in the literature, or (3) guess.
Modelers may ignore site specific data even when it is available. They may also use parametervalues that are at, or beyond, the extremes of literature values. In some cases, this may be legiti-mate. However, ignoring data and using extreme values is often a sign of problems, such as aseriously flawed conceptual model, or an attempt to force the model to produce a desired result.
The lack of site specific data at Pantex is discussed in section 4.2.
6.3 Reasonable Results
Models are usually used to predict future conditions or to evaluate alternate scenarios. Thus, weoften cannot say with certainty whether the results are correct. However, we can determine whethermodel results appear to be reasonable.
Occasionally, results are clearly nonsensical. For example; modeling done for the San AntonioWater System predicted that water levels in an aquifer would rise over a 50 year period, even aspumping was substantially increased over the 50 years31.
Most cases aren’t as clear as the example above. Predictions may seem farfetched, but we cannot‘prove’ them wrong. Modeling done for DOE32 – before TCE was discovered in the Ogallala Aquiferat the Burning Grounds – predicted it would take between 135 and 1580 years for TCE to travel fromPantex to the City of Amarillo’s Ogallala well field. A dubious result such as this should lead us toquestion the model assumptions behind it. In this case, the modeler used a very large retardationcoefficient for TCE33.
6.4 Verification (History Matching)
Models should be tested to determine whether they can reproduce conditions known to exist in thepast (e.g., water levels, contaminant distributions). This testing is called model verification, or historymatching. If a model cannot reproduce past conditions, we cannot have much confidence in itsability to predict future conditions.
6.5 Sensitivity Study
There is always some uncertainty associated with model input data (e.g., hydraulic conductivity,retardation coefficients). There is not a single ‘correct’ value for most parameters. Instead, there is arange of ‘reasonable’ values. A sensitivity study is a series of model simulations in which parametervalues are varied over their reasonable ranges, and the effect on model results is examined.
For example, a study might examine the sensitivity of predicted cleanup times to variations in retar-dation coefficients. If predicted cleanup times varied between 10 to 20 years, or 40 to 80 years – thismay be acceptable from the point of view of model sensitivity. However, if the predicted cleanuptimes ranged from 5 to 200 years, then the model results are too sensitive to reasonable variationsin input data. Model sensitivity may be reduced by collecting additional site specific data. The addi-tional data may reduce the reasonable range of values for input parameters.

Groundwater Modeling at Pantex
12
A sensitivity study should be part of every modeling project. Model results should not be presentedas a single ‘answer’, e.g., cleanup will be completed in 17 years. Rather, model results should bepresented as a range of reasonable predictions that are derived from a sensitivity study, e.g.,cleanup will probably be completed in 12 to 22 years.
6.6 Predicted vs Actual Conditions (Performance Monitoring)
As time goes by, model predictions should be compared to the conditions that actually develop. Forexample, after three years, actual conditions should be compared to the conditions the modelpredicted would exist after three years. Models may need to be adjusted to correct differencesbetween predicted and actual conditions.
7.0 References
Amarillo Globe-News, August 4, 2001.
Battelle, 1997; Three-Dimensional (3-D) Groundwater Flow Model and Contaminant Transport Modelfor U.S. Department of Energy Pantex Plant, Draft Final Report, prepared by Battelle ColumbusOperations, March 17, 1997.
BWXT 2001; Path Forward Recommendations for Groundwater Modeling at the DOE Pantex Plant,Presentation to TAG dated October 26, 2001 (presented November 27, 2001).
BWXT, 2002; Final Report, Recommendations of the 2001 Groundwater Modeling Technical Advi-sory Group for the Pantex Plant, January 2002.
DOE, 1998a; Environmental Information Document, October 1998.
DOE, 1998b; Safety Information Document, October 1998.
DOE, 2000a; Pantex Plant Burning Ground Monitoring Data Analysis Report for 1999, April 2000(citation uncertain).
DOE, 2000c; Pantex Plant Burning Ground Monitoring Data Analysis Report for Second Quarter2000 (April through June), September 2000.
DOE, 2000d; Protecting the Ogallala Aquifer, Recommendations for Characterization of Trichloroeth-ylene at the Pantex Burning Grounds, Final Report to the Secretary of Energy, May 5, 2000.
DOE, 2000f; Protecting the Ogallala Aquifer II, Recommendations for Characterization andRemediation of the Southeastern Plume at the Pantex Plant, June 9, 2000.
DOE, 2000h; Groundwater Program Management Action Process (GPMAP), June 2000.
DOE 2001; Meeting Notes, Public Presentation, April 2, 2001.
Freeze, R.A., and Cherry, J.A., 1979; Groundwater, Prentice-Hall Inc., Englewood Cliffs, NJ, 604 pp.
IT Corporation, 2000; Interim Corrective Measures Design: On-Site Stabilization and Treatment ofthe Pantex Perched Aquifer in the Zone 12 Area by Groundwater Extraction, GAC Filtration, andChemical Precipitation, Design Basis Document, Prepared by IT Corporation and S.M. StollerCorporation, August 2000.

Groundwater Modeling at Pantex
13
Rice, G., 2001a; Evaluation of Groundwater Characterization and Modeling at the Pantex Plant,STAND Technical Report 2001-1, June 2001.
Rice, G., 2001b; Evaluation of HDR/SAWS Modeling of the Carrizo-Wilcox Aquifer in Lee, Bastrop,and Milam Counties, Texas.
Stoller, S.M. Corporation, 2001; Final FY 2000 Summary and Progress Report for GroundwaterInvestigations at DOE Pantex Plant, January 29, 2001.
8.0 Endnotes1 BWXT, 2002.2 A brief review of model mathematics is presented in BWXT 2002, Appendix B.3 DOE, 2000f, page 1.4 Stoller, 2001, figure 2-15.5 Battelle, 1997, page 10.6 BWXT, 2002, Figure 2.16.7 Battelle, 1997, page 13.8 DOE, 2000h, page C-1; and Rice, 2001a, page 5.9 Battelle, 1997, page 41, figure 4-10.10 Rice, 2001a, figure 4.11 Battelle, 1997, page 13.12 DOE, 2000d, page 6; DOE 2000f, page 1; and Stoller, 2001, pages 1-54 and 1-83.13 DOE, 1998a, page 16-10; and DOE, 1998b, Appendix B; and Stoller, 2001, pp. 1-26, 1-43, and 1-69.14 DOE, 1998b, Appendix B; and Stoller, 2001, page 1-39.15 IT, 2000, page 3-1; and DOE 2000f, page 1.16 Stoller, 2001, figure 4-1.17 DOE, 2000a, page 17; and DOE, 2000c, pages 19 and 29.18 Amarillo Globe-News, August 4, 2001. Contaminants found within 200 yards of city well 623.19 Rice, 2001a, table 1.20 BWXT, 2002, pages 18 and 23.21 BWXT, 2002, Figure 2.15; and Stoller, 2001, figure 1-19.22 BWXT, 2002, Figures 2.8 and 2.9; and Stoller, 2001, figure 1-19.23 Battelle, 1997, page 13.24 DOE, 2000h, page C-9.25 DOE, 1998a, page 5-5.26 DOE, 2000h, page C-9.27 Stoller, 2001, chapter 6.28 BWXT, 2002, pages 49 and 50.29 BWXT, 2002, page 52.30 Freeze and Cherry, 1979, page 29.31 Rice, 2001b.32 IT, 2000, Appendix B, Pantex Fate and Transport Modeling in Support of Groundwater TreatmentSystem Expansion, Analysis of 1,2-DCA and TCE Outside of 25-Year Capture Zone, July 23, 1999,Table 2, well 06-44-307.33 IT, 2000, Appendix B, Pantex Fate and Transport Modeling in Support of Groundwater TreatmentSystem Expansion, Analysis of 1,2-DCA and TCE Outside of 25-Year Capture Zone, July 23, 1999,Table 1.

Groundwater Modeling at Pantex
14
Appendix 1 – Models Reviewed by the TAG
The following models were reviewed by the TAG. Additional information on each model canbe found in BWTX (2002) and at the website addresses provided below.
BioRedox-MT3DMS3-D contaminant transport. Multi-component dispersion, sorption, chemical transformations, andbiodegradation-redox reactions. Biodegradation mechanisms include oxidation, co-metabolism, andreductive dehalogenation. Also capable of simulating NAPL dissolution. Must be used in conjunctionwith a groundwater flow model.Website: http://www.enssi.com/P4-0-BioRedoxMain.htm
FEFLOW (Finite Element subsurface FLOW system)3-D groundwater flow, heat flow, and contaminant transport. Saturated and unsaturated flow. Ca-pable of simulating single component dispersion, sorption, and chemical reactions.Website: http://www.wasy.de/english/produkte/feflow/index.html
FEHM (Finite Element Heat and Mass transfer)3-D groundwater flow, heat flow, and contaminant transport. Saturated and unsaturated flow.Multiphase (gas, water, and oil), multi-component, flow through porous and fractured media.Website: http://www.ees5.lanl.gov/fehm
FEMWATER3-D groundwater flow and contaminant transport. Saturated and unsaturated flow. Capable ofsimulating dispersion, adsorption, decay, and biodegradation.
HBGC123D (HydroBioGeoChem123D)3-D contaminant transport and heat transfer in saturated and unsaturated materials. Capable ofsimulating multi-component dispersion, sorption, chemical and microbiological reactions. Accountsfor reaction kinetics. Must be used in conjunction with a groundwater flow model.Website: http://hbgc.esd.ornl.gov
MAGNAS3-D groundwater flow and contaminant transport. Saturated and unsaturated flow. Multiphase flow(water, air, and NAPL). Capable of simulating dispersion, sorption, volatilization, and mineral dissolu-tion and precipitation.Website http://www.hgl.com/software/MAGNAS.cfm
MODFLOW3-D groundwater flow. Website: http://water.usgs.gov/software/modflow-2000.html
MODFLOW-SURFACT3-D groundwater flow and contaminant transport. Saturated and unsaturated flow. Multi-componentflow capable of simulating dispersion, sorption, decay, and biodegradation.Website: http://www.hgl.com/software/M-SURFACT.cfm
MT3DMS (Modular Transport 3-D Multi-Species)3-D contaminant transport. Single component dispersion, sorption, and chemical reactions. Must beused in conjunction with a groundwater flow model.Website: http://hydro.geo.ua.edu/mt3d

Groundwater Modeling at Pantex
15
NAPL Simulator3-D contaminant transport in the saturated and unsaturated zones. Capable of simulatingmultiphase flow (water, NAPL, gas) and transport of a single solute.Website: http://www.epa.gov/ada/csmos/models/napl.html
NUFT (Nonisothermal Unsaturated-Saturated Flow and Transport model)A suite of 3-D groundwater flow and contaminant transport models. Saturated and unsaturated flow.Multiphase and multi-component.
OS3D (Operator Splitting 3-Dimensional reactive transport, also known as CRUNCH)3-D contaminant transport. Multi-component dispersion, mineral dissolution and precipitation reac-tions. Must be used in conjunction with a groundwater flow model.Website: http://www.earthsci.unibe.ch/tutorial/os3d.htm
Princeton Transport Code3-D groundwater flow and contaminant transport. Saturated and unsaturated flow. Multi-componentflow capable of simulating dispersion and sorption.Website: http://ftp.argusone.com/pub/PTC_Files/Ptc-hbk.pdf
RT3D (Reactive Transport in 3-Dimensions)3-D contaminant transport in saturated materials. Multi-component sorption, chemical reactions, andbiodegradation. Must be used in conjunction with a groundwater flow model. Website: http://bioprocess.pnl.gov/rt3d.htm
SA_MAPS (Stream-Aquifer Management and Planning Simulator)3-D groundwater flow and contaminant transport. Saturated and unsaturated flow. Multiphase flow(water, oil, and gas). Capable of simulating dispersion, diffusion, sorption, and biodegradation kinet-ics. SA MAPS is a family of codes that includes: BioF&T3D, BioSlurp, BioSVE, MARS, MOFAT,MOVER, OILVOL, and SOILPARA.Website: http://www.rasint.com/software.html
SEAM3D (Sequential Electron Acceptor Model, 3 Dimensional)3-D contaminant transport. Multi-component dispersion, sorption, and biodegradation. Must be usedin conjunction with a groundwater flow model.Website: http://gms.watermodeling.org/html/seam3d.html
TRACR3D3-D groundwater flow and contaminant transport. Saturated and unsaturated flow of air and water inporous or fractured media. Multi-component flow capable of simulating sorbtion and biokinetics.Website: http://www.ees5.lanl.gov/porous_media.html
TOUGH2 (Transport Of Unsaturated Groundwater and Heat, Version 2.0)3-D groundwater flow, heat flow, and contaminant transport. Saturated and unsaturated flow inporous and fractured media. Multiphase flow (water, air, NAPLs, and volatile organic compounds(VOCs)), mineral dissolution and precipitation.Website: http://www-esd.lbl.gov/TOUGH2/tough2v2.html
UTCHEM3-D groundwater flow, heat flow, and contaminant transport. Saturated and unsaturated flow.Multiphase (water, gas, oil) and multi-component. Capable of simulating dispersion, sorption, bio-degradation, and mineral dissolution and precipitation.Websites: http://www.epa.gov/ada/csmos/models/utchem.html andhttp://www.pe.utexas.edu/CPGE/UTCHEM

Groundwater Modeling at Pantex
16
Appendix 2 – Glossary
Aquifer: a saturated geologic formation capable of transmitting an economically significant quantity of water.
Biodegradation (biologic decay): the destruction of organic contaminants (e.g., TCE, toluene) by microor-ganisms. This process may convert one contaminant into another, e.g., TCE biodegrades to DCE, whichbiodegrades to vinyl chloride.
Bulk density: the density of a material, usually soil or rock, including pore spaces. The in-place or undis-turbed density. For example, the density of the minerals that make up a soil may be 170 pounds per cubic foot.But the bulk density of the soil; including pore spaces, organic matter, and minerals, may be 110 pounds percubic foot.
Capillary fringe: a zone immediately above the water table. The water in this zone is held by capillary forcesand cannot flow freely. Portions of the capillary fringe may be saturated.
Dehalogenation: the removal of a halogen atom (e.g., chloride, fluoride) from a molecule.
Discharge: the movement of water out of a groundwater system. Water may be discharged naturally throughsprings and evapotranspiration, or through man made structures such as wells and drains.
Dispersion: the dilution of a contaminant due to spreading of the contaminant plume. The spreading occurs inall directions; parallel to the flow (longitudinal dispersion) and perpendicular to flow (transverse dispersion). Itis caused by variations in groundwater flow directions and speeds. An analogous processes is the spreading(dispersion) of a plume of smoke from a smokestack.
DNAPL: Dense Non-Aqueous Phase Liquid. Liquids that are more dense than water. Hence, they tend tosink to the bottom of aquifers. Most chlorinated solvents (e.g., TCE, DCE) are DNAPLs. DNAPLs areliquids, sometimes referred to as ‘pure product’. They should not be confused with solutes – contaminants thatare dissolved in the groundwater.
Effective porosity (also see porosity): the amount of interconnected porosity available for the transmissionof fluids. Effective porosity is expressed as a ratio or percentage. In most materials, effective porosity andtotal porosity are nearly equal. However, some materials, such as clays, have high total porosities but loweffective porosities because the pore spaces are too narrow to allow water to flow freely. In other materials,such as volcanic rocks, the pore spaces may not be interconnected.
Graphical User Interface (GUI): a computer program; pre-processor and post-processor tools that allowmodelers to automate some aspects of model design (e.g., grid generation, calibration), integrate optimizationtools with models, and create maps of model results.
Hydraulic conductivity: a measure of the ability of a material allow water to flow through it. The higher thehydraulic conductivity of a material, the easier it is for water to flow through it. Hydraulic conductivity isexpressed as length per unit time (e.g., feet per day, centimeters per second).
Hydraulic head: the elevation of water in a well. Groundwater flows from areas of higher hydraulic head toareas of lower hydraulic head. Hydraulic head is a measure of the energy of groundwater and is the sum oftwo components; elevation head, and pressure head.

Groundwater Modeling at Pantex
17
LNAPL: Light Non-Aqueous Phase Liquid. Liquids that are less dense than water. Hence, they float on thewater table. Common LNAPLs include oil, gasoline, and diesel fuel. LNAPLs are liquids, sometimes referredto as ‘pure product’. They should not be confused with solutes – contaminants that are dissolved in thegroundwater.
NAPL: Non-Aqueous Phase Liquid. General term that includes DNAPLs and LNAPLs. NAPLs are liquids,sometimes referred to as ‘pure product’. They should not be confused with solutes – contaminants that aredissolved in the groundwater.
Organic: derived from plant or animal materials.
Organic carbon: carbon derived from organic sources (e.g., plant material). Distinguished from carbonderived from non-organic sources (e.g., atmospheric carbon dioxide, carbonate minerals). Organic carbonsorbs organic contaminants.
Oxidation: the addition of oxygen to an atom or molecule, or the removal of electrons from an atom ormolecule.
Partition coefficient: a measure of the degree to which a solute is adsorbed. Solutes with higher partitioncoefficients (e.g. TCE) are more strongly adsorbed (i.e., bound to the solid material of the aquifer) and migratemore slowly (are more retarded) than contaminants with lower partition coefficients (e.g., vinyl chloride). Fororganic contaminants, the partition coefficient increases as the amount of solid organic carbon in an aquiferincreases.
Porosity: a measure of void space in a material. The ratio of the volume of void spaces in a rock or sedimentto the total volume of the rock or sediment. Voids may be spaces between sand grains, fractures, or solutioncavities. In the saturated zone, the void spaces are completely filled with water. In the unsaturated zone, thevoids are filled with water and air.
Precipitation: the combination of solutes to form a solid material. Metals often precipitate, as when dissolvediron and carbonate combine to form the mineral siderite. Precipitation reactions are often not reversible, andthe precipitated contaminant is permanently removed from the groundwater.
Recharge: the entry of water into a groundwater system. Recharge often occurs along streambeds, alongmountain fronts, and through the bottoms of playas.
Reduction: the addition of electrons to an atom or molecule.
Retardation: Due to sorption, most contaminants move more slowly than the groundwater which transportsthem. Their movement is said to be retarded with respect to the groundwater.
Retardation coefficient: a measure of retardation - the rate at which a solute travels through a groundwatersystem, compared to the velocity of the groundwater. The ratio of the groundwater velocity to the solutevelocity. A solute with a retardation coefficient of 2 moves at ½ the velocity of the groundwater that is trans-porting it.
Saturated zone: a zone where the void spaces are completely filled with water or some other liquid.
Sensitivity study: a test of a model’s response to changes in parameter values or assumptions (e.g., hydraulicconductivity, boundary conditions).

Groundwater Modeling at Pantex
18
Sink, groundwater: see discharge.
Solute: a substance dissolved in a liquid.
Sorption: A process that binds, usually temporarily, a contaminant to a mineral surface or to organic matter. Thistemporary binding acts to reduce (retard) the contaminant migration rate with respect to the groundwater. Sorp-tion is a general term used to encompass the processes of absorption and adsorption.
Source, groundwater: see recharge.
Storage coefficient: a measure of the ability of an aquifer to store and release water. The volume of water anaquifer releases from or takes into storage, per unit surface area of the aquifer, per unit change in hydraulic head.
Unsaturated zone: a zone where the void spaces are not completely filled with water or some other liquid.
Vadose zone: the unsaturated zone plus the capillary fringe immediately above the water table. The capillaryfringe may be saturated.
Volatilization/Vaporization: the formation of gasses that may emerge from water as vapors.
2-D model: a model that simulates flow or contaminant transport in space two dimensions. The dimensionsmay be horizontal or vertical (cross section).
3-D model: a model that simulates flow or contaminant transport in three space dimensions.