groundwater management: capacity assessment at the local
TRANSCRIPT

Amit Pradhananga, Ph.D.Mae A. Davenport, Ph. D.andVanessa Perry, M.S.
December 4, 2015
GROUNDWATER MANAGEMENT: CAPACITY ASSESSMENT AT THE LOCAL LEVEL
A SURVEY OF MINNESOTA ASSOCIATION OF SOIL AND WATER CONSERVATION DISTRICTS
GROUNDWATER MANAGEMENT: CAPACITY ASSESSMENT AT THE LOCAL LEVELA SURVEY OF MINNESOTA ASSOCIATION OF SOIL AND WATER CONSERVATION DISTRICTS
Amit Pradhananga, Ph.D.Mae A. Davenport, Ph. D.andVanessa Perry, M.S.
Department of Forest Resources
College of Food, Agriculture and Natural Resource Sciences
University of Minnesota
115 Green Hall1530 Cleveland Avenue NorthSaint Paul, MN 55108-6112
www.forestry.umn.edu
A Final Technical Report Prepared for the
Minnesota Department of Natural Resources
December 4, 2015

i
Acknowledgements The authors would like to acknowledge and thank the Minnesota Department of Natural Resources (MNDNR), Minnesota Association of Soil and Water Conservation Districts (MASWCD), Minnesota Department of Health (MDH) and Minnesota Department of Agriculture (MDA) for their collaboration, and especially Sharon Pfeifer for her invaluable assistance with study design, participant recruitment, study outreach, and review and feedback on this report. We are especially thankful to LeAnn Buck, Carrie Raber, Mark Hauck, Mark Wettlaufer, and Margaret Wagner for their input on study design. The authors would also like to thank Dolly Parker and Kim Wielinksi at Government Training Services (GTS) Educational Events for their assistance with workshop registration. We are particularly grateful to the 188 SWCD staff survey respondents, and 126 pre-workshop and 99 post-workshop survey respondents. We would also like to thank Alyssa Prokott, undergraduate researcher, University of Minnesota for her assistance. This project and associated workshops were supported by funding from the Minnesota Department of Natural Resources. This work was also supported by the USDA National Institute of Food and Agriculture, Hatch project 229912, project number MIN-42-052. The contents of this report are solely the responsibility of the authors and do not necessarily represent the views of the funders. The cover page was created by Joseph Nowak III.
The University of Minnesota is committed to the policy that all persons shall have equal access to its programs, facilities, and employment without regard to race, color, creed, religion, national origin, sex, age, marital status, disability, public assistance status, veteran status, or sexual orientation.
Table of Contents Acknowledgements ........................................................................................................................................ i
Executive Summary ....................................................................................................................................... 2
Conceptual Framework ................................................................................................................................. 3
Baseline Capacity Assessment ...................................................................................................................... 5
Methods .................................................................................................................................................... 5
Findings ..................................................................................................................................................... 5
I. Respondent profile ....................................................................................................................... 7
II. Sources of information ................................................................................................................. 7
III. Client interactions ......................................................................................................................... 8
IV. Expertise about groundwater issues ............................................................................................ 8
V. Perspectives on groundwater issues ............................................................................................ 9
VI. Capacity assessment ................................................................................................................... 10
VII. Information needs ...................................................................................................................... 16
Workshop Evaluation .................................................................................................................................. 18
Methods .................................................................................................................................................. 18
Findings ................................................................................................................................................... 20
Discussion and Recommendations ............................................................................................................. 21
Literature Cited ........................................................................................................................................... 26
Appendices .................................................................................................................................................. 27
Appendix A: Baseline Capacity Assessment Email Contact Script .......................................................... 28
Appendix B: Baseline Capacity Assessment Questionnaire .................................................................... 30
Appendix C: Baseline Capacity Assessment Survey Findings .................................................................. 56
Appendix D: Pre-workshop Survey Questionnaire ................................................................................. 82
Appendix E: Post-workshop Survey Questionnaire ................................................................................ 86
Appendix F: Pre- and Post-workshop Findings ....................................................................................... 90

2
Executive Summary This report describes a capacity assessment of Minnesota Soil and Water Conservation District (SWCD) staff to engage in groundwater protection. The study was conducted by the Department of Forest Resources, University of Minnesota in partnership with the Minnesota Department of Natural Resources (MNDNR) and Minnesota Association of Soil and Water Conservation Districts (MASWCD). The overarching goal of the study was to examine local capacity and capacity building programs for groundwater management.
The primary objectives of the study were to:
1. Assess the capacity of SWCD staff to engage in groundwater protection 2. Evaluate the impact of tailored groundwater workshops on participants’ knowledge and
confidence about groundwater protection
The study was conducted in two stages. First, a baseline capacity assessment of SWCD staff was conducted using an online survey of SWCD staff. Findings from the baseline capacity assessment survey helped tailor workshops to the concerns and needs of SWCD staff in different geographic locations in Greater Minnesota. The workshops were evaluated using a pre/post survey design.
Findings from the baseline survey suggest that multiple capacity constraints to groundwater protection exist. SWCD staff are aware of groundwater issues, feel a sense of responsibility to protect groundwater but lack the resources and technical expertise needed to protect groundwater. SWCD staff respondents also identified as constraints the lack of (1) organizations or groups that provide meaningful feedback on groundwater protection, (2) organizational capacity to develop strategic, long term plans for groundwater protection, and (3) cross-jurisdictional/cross-sector groups to share data about and coordinate groundwater protection. Further, respondents identified financial resources, technical capacity and lack of training as primary capital constraints to groundwater protection. The types of assistance or support SWCD staff need to address their clientele’s groundwater concerns include (1) information on local groundwater quality and quantity trends, (2) funding for groundwater best management practices implementation, (3) information on studies on land use impacts on groundwater, and (4) better understanding of groundwater basics and surface-groundwater connections. Tailored workshops were offered by the MNDNR to help strengthen SWCD staff’s technical capacity on groundwater issues. Workshop evaluation revealed that workshop participants had a better understanding of groundwater issues, were more confident in their ability to address groundwater issues, and had more clarity about their and others’ role in groundwater protection. These findings highlight the need to continue to support similar workshops that provide much needed technical assistance to address groundwater issues. However, findings from the baseline survey also suggest that SWCD staff need support in building local capacity for groundwater protection. For example, SWCD staff need support in increasing local knowledge about groundwater protection and in defining and communicating local groundwater issues to a range of audiences. While the DNR workshops helped build individual capacity, future workshops should include local capacity building at multiple levels including relational, organizational and programmatic capacity. In this regard, opportunities exist for the state to partner with the University of Minnesota to develop and incorporate capacity building into existing programs and outreach efforts.

3
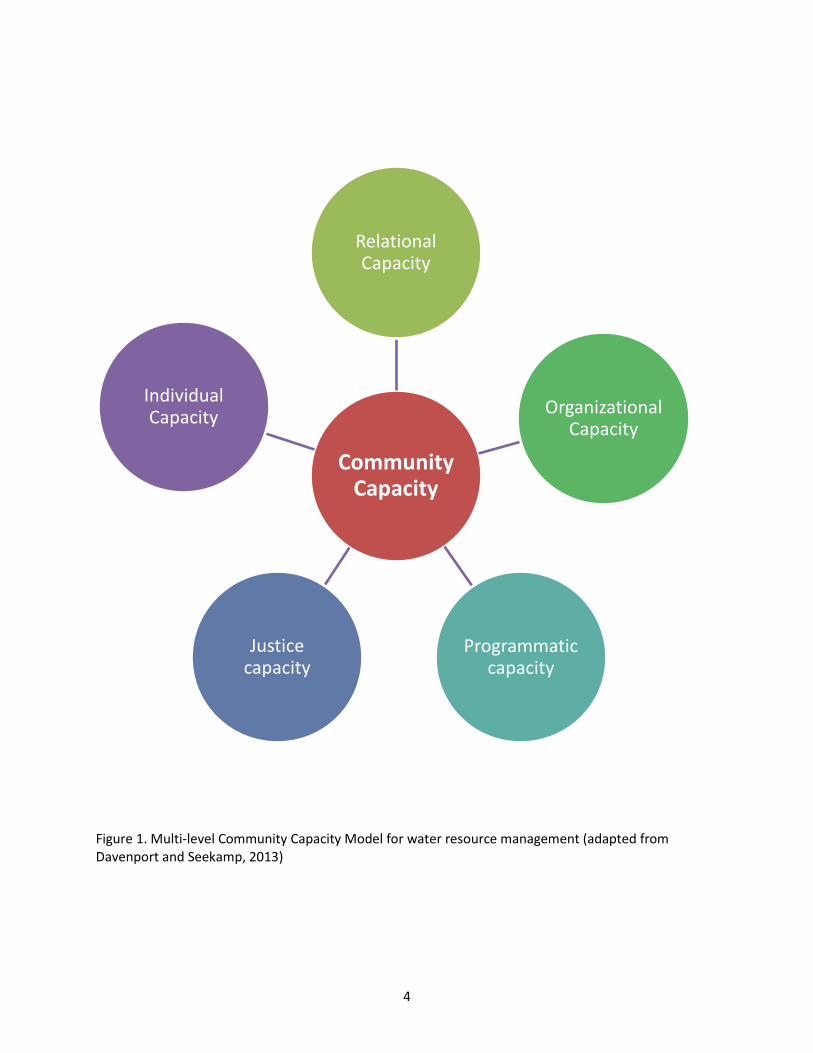
Conceptual Framework This study expands on a published model (see Multi-level Community Capacity Model, Davenport & Seekamp 2013, Davenport 2013) and recent research conducted by the principal investigator in Minnesota (Pradhananga & Davenport, 2012) which establishes five levels of community capacity: (1) individual, (2) relational, (3) organizational, (4) programmatic, and (5) justice that are integral to water resource management (Figure 1). Individual capacity includes an individual’s actions, beliefs, concerns, sense of responsibility, and ability to take action. Relational capacity includes knowledge exchange through social networks, norm development, and organizing action. Organizational capacity includes organizational leadership and development, partnerships, and collaborative decision making processes. Programmatic capacity includes stakeholder engagement, assessment, outcomes evaluation, and adaptation. Justice capacity includes perceived trust, fairness in and legitimacy of decision making.
The study is significant to water resource management and watershed planning efforts aimed at enhancing groundwater protection implementation strategies across the state. Study findings help identify and prioritize local capacity-building needs, and enhances the ability to design programs tailored to local needs and resources. Study findings will inform funding initiatives, statewide planning efforts, SWCD capacity building programs, public participation program development, and groundwater protection.
4
Figure 1. Multi-level Community Capacity Model for water resource management (adapted from Davenport and Seekamp, 2013)
Community Capacity
Relational Capacity
Organizational Capacity
Programmatic capacity
Justice capacity
Individual Capacity

5
Baseline Capacity Assessment
Methods Data were collected through an online survey of 359 SWCD staff throughout Minnesota. A list of SWCD staff was obtained from the Minnesota Association of Soil and Water Conservation Districts (MASWCD). The questionnaire was developed based on consultation with and feedback from representatives of MNDNR, MASWCD, Minnesota Department of Health (MDH) and Minnesota Department of Agriculture (MDA). An online version of the questionnaire was developed using Qualtrics (www.qualtrics.com, Provo, UT).
The questionnaire included a variety of fixed-choice and scale questions. The questionnaire asked respondents about their expertise in and sources of information about groundwater issues, their perspectives on groundwater issues, and assessed their capacity to protect groundwater. In addition, the questionnaire collected information about the respondents’ role in SWCD and sociodemographic information.
An adapted Dillman’s (2009) method was used to increase response rate. An email (Appendix A) with a personalized link to the survey questionnaire (Appendix B) was sent to all SWCD staff, excluding SWCD supervisors. This was followed with two email reminders that also included the link to the survey questionnaire. The personalized link allows survey access to only the intended recipients of the link, thus ensuring confidentiality. Qualtrics was used to keep track of survey respondents. The surveys were administered from April to May, 2015.
Survey responses were automatically coded and saved in a database within Qualtrics. The database was downloaded and data were analyzed using Statistical Package for Social Sciences (SPSS release 21.0). Basic descriptive statistics were conducted to determine frequency distribution and central tendency of individual variables.
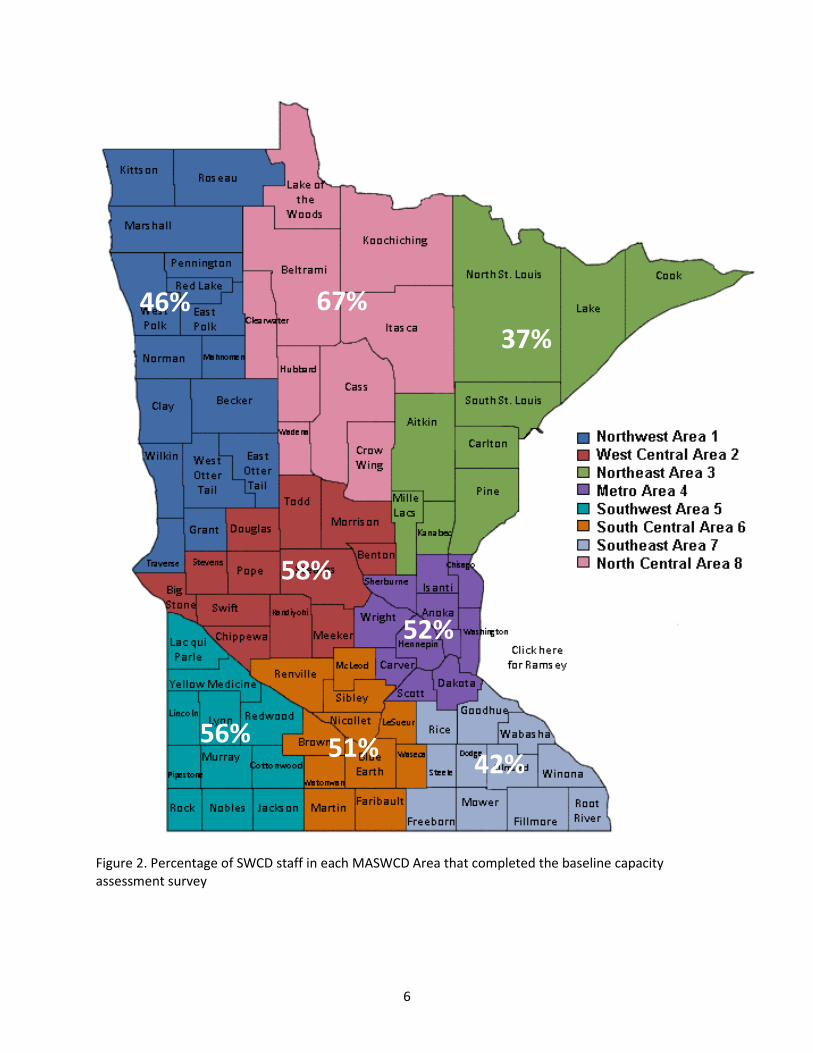
Findings Overall, 188 SWCD staff completed the survey for a response rate of 52%. The highest response rate was obtained in MASWCD Area 8 (67%) (Figure 2; Appendix C, Table 1).
6
Figure 2. Percentage of SWCD staff in each MASWCD Area that completed the baseline capacity assessment survey
46%
58%
37%
52%
56% 51% 42%
67%
7
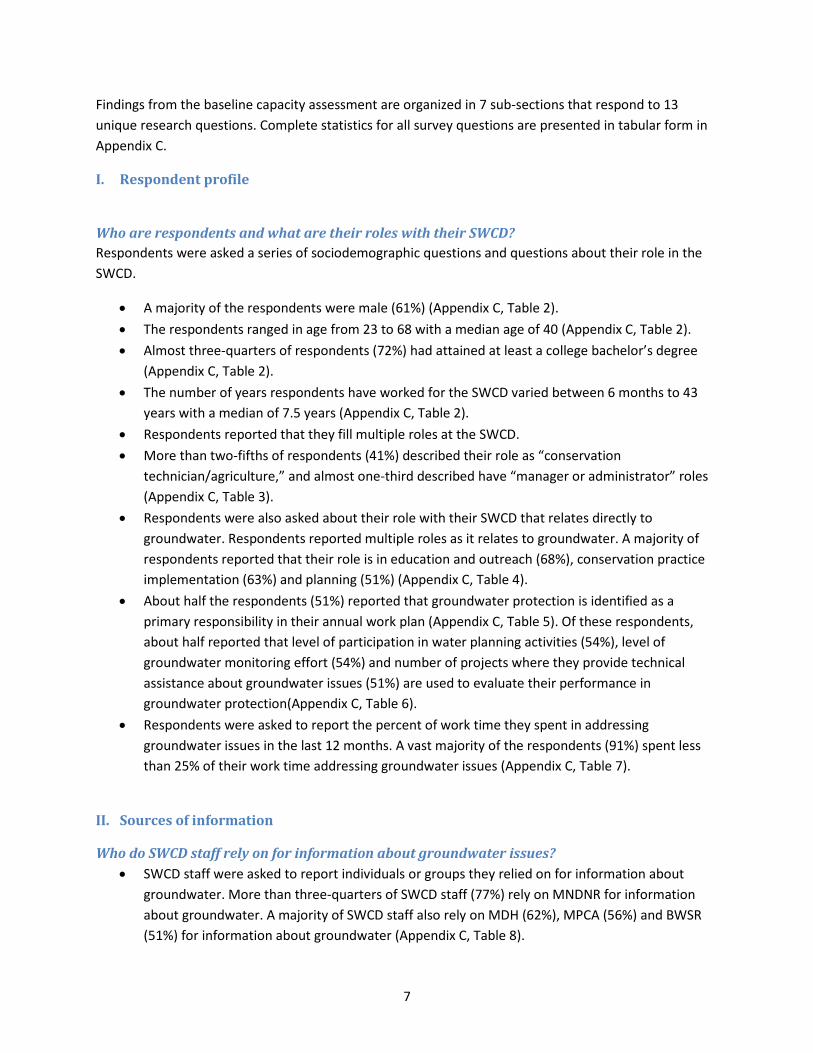
Findings from the baseline capacity assessment are organized in 7 sub-sections that respond to 13 unique research questions. Complete statistics for all survey questions are presented in tabular form in Appendix C.
I. Respondent profile
Who are respondents and what are their roles with their SWCD? Respondents were asked a series of sociodemographic questions and questions about their role in the SWCD.
• A majority of the respondents were male (61%) (Appendix C, Table 2). • The respondents ranged in age from 23 to 68 with a median age of 40 (Appendix C, Table 2). • Almost three-quarters of respondents (72%) had attained at least a college bachelor’s degree
(Appendix C, Table 2). • The number of years respondents have worked for the SWCD varied between 6 months to 43
years with a median of 7.5 years (Appendix C, Table 2). • Respondents reported that they fill multiple roles at the SWCD. • More than two-fifths of respondents (41%) described their role as “conservation
technician/agriculture,” and almost one-third described have “manager or administrator” roles (Appendix C, Table 3).
• Respondents were also asked about their role with their SWCD that relates directly to groundwater. Respondents reported multiple roles as it relates to groundwater. A majority of respondents reported that their role is in education and outreach (68%), conservation practice implementation (63%) and planning (51%) (Appendix C, Table 4).
• About half the respondents (51%) reported that groundwater protection is identified as a primary responsibility in their annual work plan (Appendix C, Table 5). Of these respondents, about half reported that level of participation in water planning activities (54%), level of groundwater monitoring effort (54%) and number of projects where they provide technical assistance about groundwater issues (51%) are used to evaluate their performance in groundwater protection(Appendix C, Table 6).
• Respondents were asked to report the percent of work time they spent in addressing groundwater issues in the last 12 months. A vast majority of the respondents (91%) spent less than 25% of their work time addressing groundwater issues (Appendix C, Table 7).
II. Sources of information
Who do SWCD staff rely on for information about groundwater issues? • SWCD staff were asked to report individuals or groups they relied on for information about
groundwater. More than three-quarters of SWCD staff (77%) rely on MNDNR for information about groundwater. A majority of SWCD staff also rely on MDH (62%), MPCA (56%) and BWSR (51%) for information about groundwater (Appendix C, Table 8).

8
• SWCD staff were also asked to rate the extent to which they relied on individuals or groups they selected as information sources about groundwater. A majority of SWCD staff reported that they relied on MNDNR (77%), MDH (82%), County staff (76%), MDA (70%) and MPCA (65%) moderately to a lot for information about groundwater (Appendix C, Table 9).
III. Client interactions
What client groups do SWCD staff interact with on groundwater issues? SWCD staff were asked about both the client groups they interact with on groundwater issues and the frequency of interactions. The client groups SWCD staff interacted with most often were private landowners, agricultural producers and state or regional governments.
• A vast majority of SWCD staff reported that they interacted with private landowners (81%) on groundwater issues (Appendix C, Table 10).
• A majority of SWCD staff also interacted with agricultural producers (69%), and local governments (63%) (Appendix C, Table 10).
• More than one-third of SWCD staff interacted with state or regional governments (40%) and watershed districts/watershed management organizations (38%) (Appendix C, Table 10).
• When asked about the extent to which they interact with these groups on a 5-pt scale from never (1) to all the time (5), SWCD staff reported interacting most often with state or regional governments (Mean = 3.38), followed by non-profit/advocacy organizations (Mean = 3.23) and agricultural producers (Mean = 3.22) (Appendix C, Table 11).
• SWCD staff were also asked if they thought the amount of time they spend interacting with clients on groundwater issues in the future would increase, decrease or stay the same. A majority of SWCD staff (72%) perceived that the amount of time they spend interacting with clients on groundwater issues in the future would increase (Appendix C, Table 12).
IV. Expertise about groundwater issues
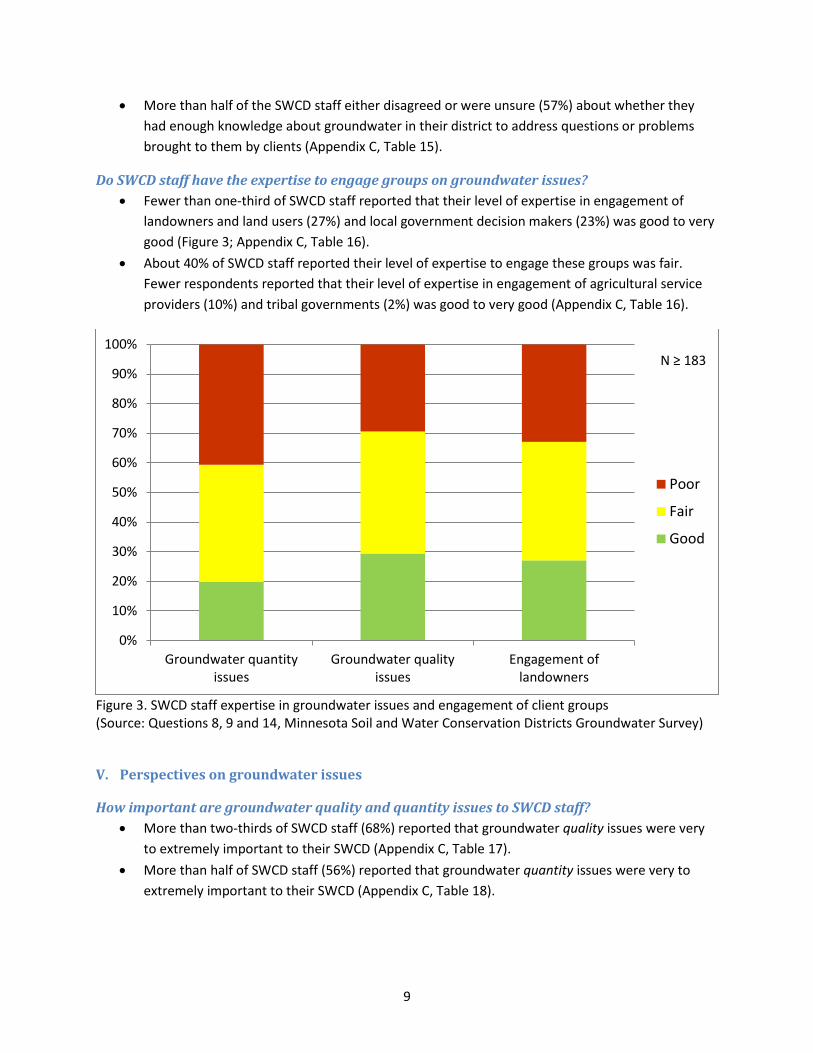
Do SWCD staff have the expertise and knowledge they need on groundwater issues? • Twenty percent of SWCD staff reported that their level of technical expertise in groundwater
quantity issues was good to very good, and 40% reported their level of technical expertise was fair (Figure 3; Appendix C, Table 13).
• Almost one-third of SWCD staff (29%) reported that their level of technical expertise in groundwater quality issues was good to very good, and 41% reported their level of technical expertise was fair (Figure 3; Appendix C, Table 14).
• SWCD staff were also asked to report their knowledge about groundwater issues. About half of the SWCD staff (52%) somewhat to strongly agreed that they have enough knowledge about local land use planning to work effectively with local governments to protect groundwater (Appendix C, Table 15).
• Similarly, about half of the SWCD staff (53%) somewhat to strongly agreed that they are confident in their knowledge of groundwater issues in their district (Appendix C, Table 15).
9
• More than half of the SWCD staff either disagreed or were unsure (57%) about whether they had enough knowledge about groundwater in their district to address questions or problems brought to them by clients (Appendix C, Table 15).
Do SWCD staff have the expertise to engage groups on groundwater issues? • Fewer than one-third of SWCD staff reported that their level of expertise in engagement of
landowners and land users (27%) and local government decision makers (23%) was good to very good (Figure 3; Appendix C, Table 16).
• About 40% of SWCD staff reported their level of expertise to engage these groups was fair. Fewer respondents reported that their level of expertise in engagement of agricultural service providers (10%) and tribal governments (2%) was good to very good (Appendix C, Table 16).
Figure 3. SWCD staff expertise in groundwater issues and engagement of client groups (Source: Questions 8, 9 and 14, Minnesota Soil and Water Conservation Districts Groundwater Survey)
V. Perspectives on groundwater issues
How important are groundwater quality and quantity issues to SWCD staff? • More than two-thirds of SWCD staff (68%) reported that groundwater quality issues were very
to extremely important to their SWCD (Appendix C, Table 17). • More than half of SWCD staff (56%) reported that groundwater quantity issues were very to
extremely important to their SWCD (Appendix C, Table 18).
0%
10%
20%
30%
40%
50%
60%
70%
80%
90%
100%
Groundwater quantityissues
Groundwater qualityissues
Engagement oflandowners
Poor
Fair
Good
N ≥ 183
10
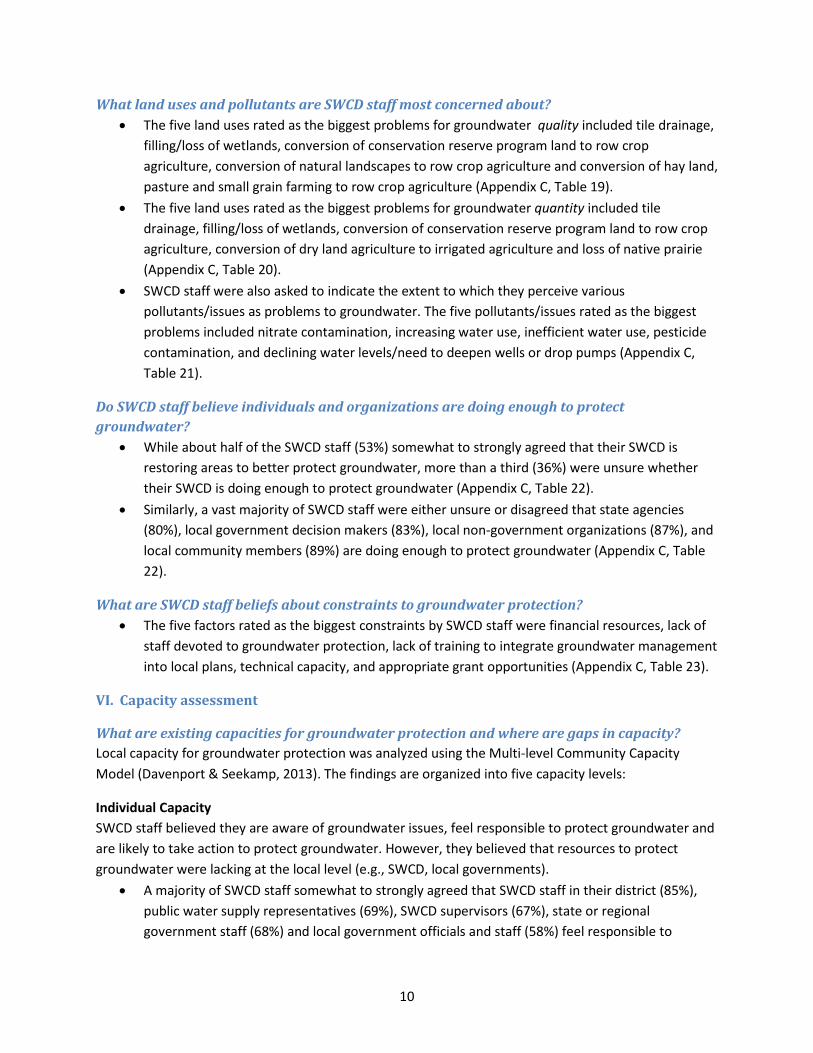
What land uses and pollutants are SWCD staff most concerned about? • The five land uses rated as the biggest problems for groundwater quality included tile drainage,
filling/loss of wetlands, conversion of conservation reserve program land to row crop agriculture, conversion of natural landscapes to row crop agriculture and conversion of hay land, pasture and small grain farming to row crop agriculture (Appendix C, Table 19).
• The five land uses rated as the biggest problems for groundwater quantity included tile drainage, filling/loss of wetlands, conversion of conservation reserve program land to row crop agriculture, conversion of dry land agriculture to irrigated agriculture and loss of native prairie (Appendix C, Table 20).
• SWCD staff were also asked to indicate the extent to which they perceive various pollutants/issues as problems to groundwater. The five pollutants/issues rated as the biggest problems included nitrate contamination, increasing water use, inefficient water use, pesticide contamination, and declining water levels/need to deepen wells or drop pumps (Appendix C, Table 21).
Do SWCD staff believe individuals and organizations are doing enough to protect groundwater?
• While about half of the SWCD staff (53%) somewhat to strongly agreed that their SWCD is restoring areas to better protect groundwater, more than a third (36%) were unsure whether their SWCD is doing enough to protect groundwater (Appendix C, Table 22).
• Similarly, a vast majority of SWCD staff were either unsure or disagreed that state agencies (80%), local government decision makers (83%), local non-government organizations (87%), and local community members (89%) are doing enough to protect groundwater (Appendix C, Table 22).
What are SWCD staff beliefs about constraints to groundwater protection? • The five factors rated as the biggest constraints by SWCD staff were financial resources, lack of
staff devoted to groundwater protection, lack of training to integrate groundwater management into local plans, technical capacity, and appropriate grant opportunities (Appendix C, Table 23).
VI. Capacity assessment
What are existing capacities for groundwater protection and where are gaps in capacity? Local capacity for groundwater protection was analyzed using the Multi-level Community Capacity Model (Davenport & Seekamp, 2013). The findings are organized into five capacity levels:
Individual Capacity SWCD staff believed they are aware of groundwater issues, feel responsible to protect groundwater and are likely to take action to protect groundwater. However, they believed that resources to protect groundwater were lacking at the local level (e.g., SWCD, local governments).
• A majority of SWCD staff somewhat to strongly agreed that SWCD staff in their district (85%), public water supply representatives (69%), SWCD supervisors (67%), state or regional government staff (68%) and local government officials and staff (58%) feel responsible to

11
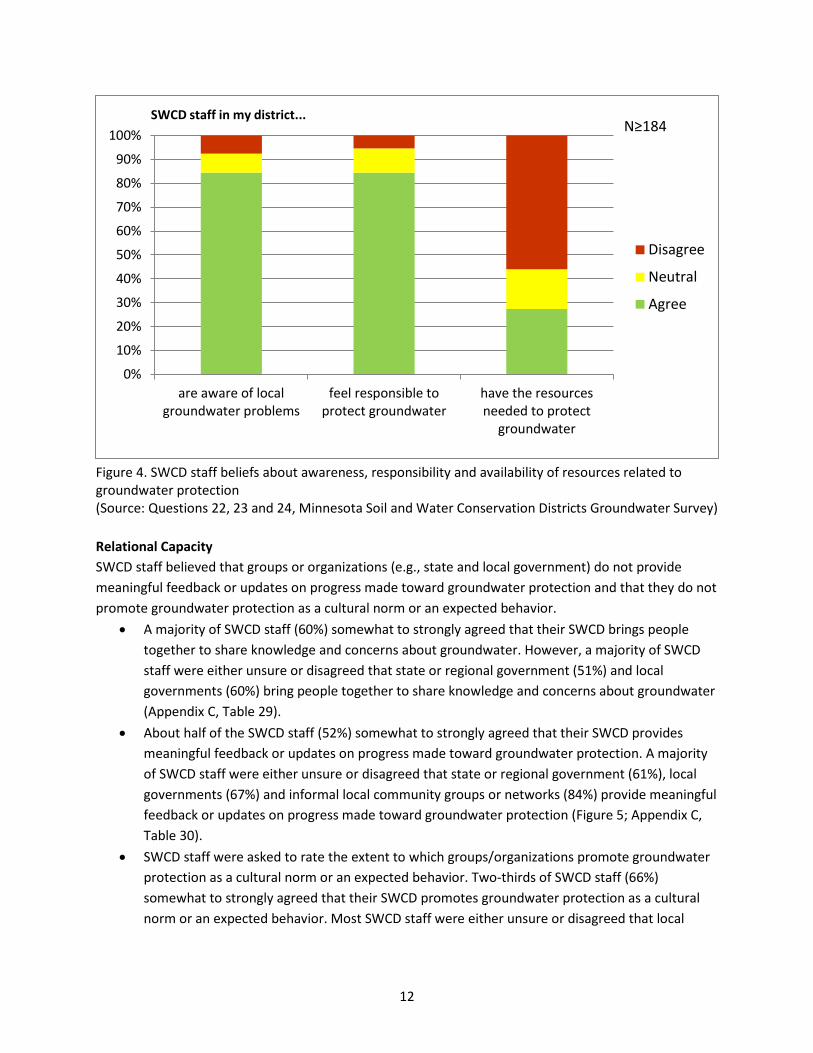
protect groundwater. A majority of SWCD staff (60%) were either unsure or disagreed that local community members feel responsible to protect groundwater (Figure 4; Appendix C, Table 24).
• About half of SWCD staff (52%) somewhat to strongly agreed that state or regional government staff have the resources needed to protect groundwater. A vast majority of SWCD staff were either unsure or disagreed that local government officials and staff (75%), local community members (79%), SWCD staff (73%) and SWCD supervisors (77%) have the resources needed to protect groundwater (Figure 4; Appendix C, Table 25).
• A vast majority of SWCD staff (85%) somewhat to strongly agreed that they are aware of local groundwater problems. About three quarters of SWCD staff somewhat to strongly agreed that public water suppliers (74%), state or regional government (75%) and SWCD supervisors (72%) are aware of local groundwater problems. A majority of SWCD staff were either unsure or disagreed that local non-government organization representatives (52%) and local community members (63%) are aware of local groundwater problems (Figure 4; Appendix C, Table 26).
• A vast majority of SWCD staff (89%) believed that it is somewhat to very likely that they will take action to protect groundwater. A majority of SWCD staff also believed that public water suppliers (74%), state or regional government staff (78%) and local government officials and staff (67%) are likely to take action. However, SWCD staff were not as certain about the likelihood that local community members would act to protect groundwater. A majority of SWCD staff were either unsure or disagreed (57%) that local community members are likely to take action to protect groundwater (Appendix C, Table 27).
• About two-thirds of SWCD staff (66%) somewhat to strongly agreed that they communicate effectively with community members to protect groundwater. However, SWCD staff were uncertain about the extent to which other individuals communicate effectively with community members. About one-third of SWCD staff neither agreed nor disagreed that state or regional government staff (33%), local government officials and staff (32%) and federal government staff (34%) communicate effectively with community members to protect groundwater (Appendix C, Table 28).
12
Figure 4. SWCD staff beliefs about awareness, responsibility and availability of resources related to groundwater protection (Source: Questions 22, 23 and 24, Minnesota Soil and Water Conservation Districts Groundwater Survey) Relational Capacity SWCD staff believed that groups or organizations (e.g., state and local government) do not provide meaningful feedback or updates on progress made toward groundwater protection and that they do not promote groundwater protection as a cultural norm or an expected behavior.
• A majority of SWCD staff (60%) somewhat to strongly agreed that their SWCD brings people together to share knowledge and concerns about groundwater. However, a majority of SWCD staff were either unsure or disagreed that state or regional government (51%) and local governments (60%) bring people together to share knowledge and concerns about groundwater (Appendix C, Table 29).
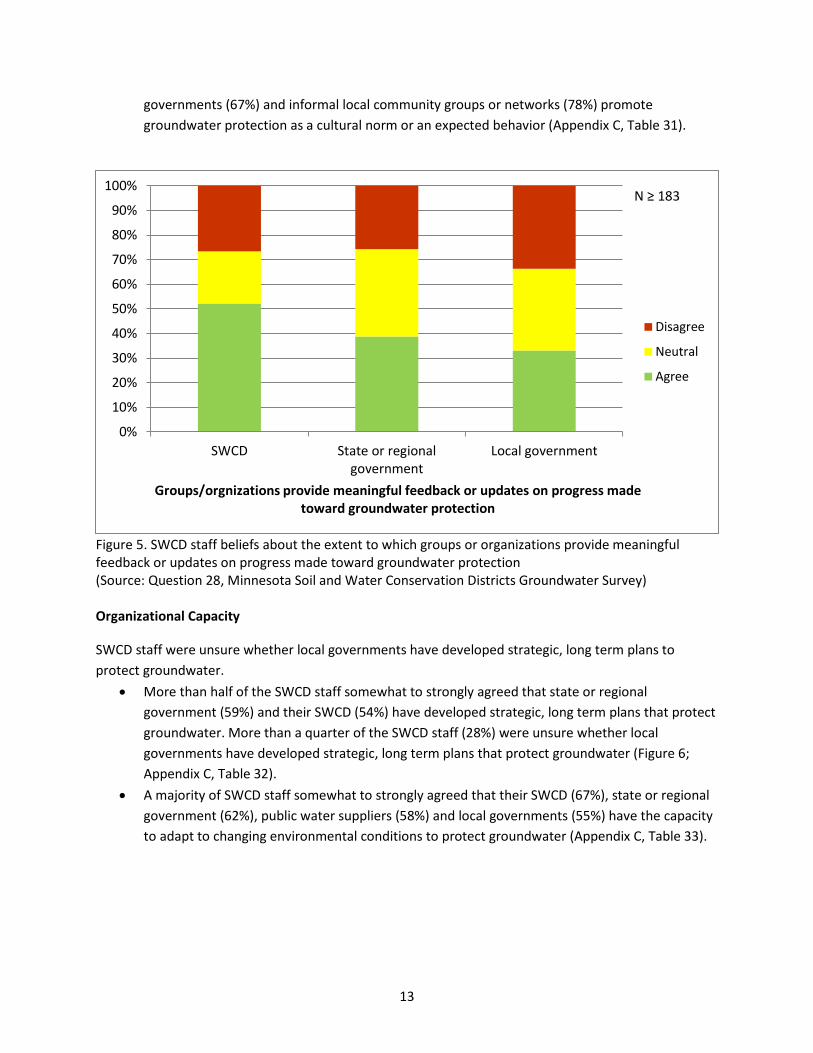
• About half of the SWCD staff (52%) somewhat to strongly agreed that their SWCD provides meaningful feedback or updates on progress made toward groundwater protection. A majority of SWCD staff were either unsure or disagreed that state or regional government (61%), local governments (67%) and informal local community groups or networks (84%) provide meaningful feedback or updates on progress made toward groundwater protection (Figure 5; Appendix C, Table 30).
• SWCD staff were asked to rate the extent to which groups/organizations promote groundwater protection as a cultural norm or an expected behavior. Two-thirds of SWCD staff (66%) somewhat to strongly agreed that their SWCD promotes groundwater protection as a cultural norm or an expected behavior. Most SWCD staff were either unsure or disagreed that local
0%
10%
20%
30%
40%
50%
60%
70%
80%
90%
100%
are aware of localgroundwater problems
feel responsible toprotect groundwater
have the resourcesneeded to protect
groundwater
SWCD staff in my district...
Disagree
Neutral
Agree
N≥184
13
governments (67%) and informal local community groups or networks (78%) promote groundwater protection as a cultural norm or an expected behavior (Appendix C, Table 31).
Figure 5. SWCD staff beliefs about the extent to which groups or organizations provide meaningful feedback or updates on progress made toward groundwater protection (Source: Question 28, Minnesota Soil and Water Conservation Districts Groundwater Survey) Organizational Capacity
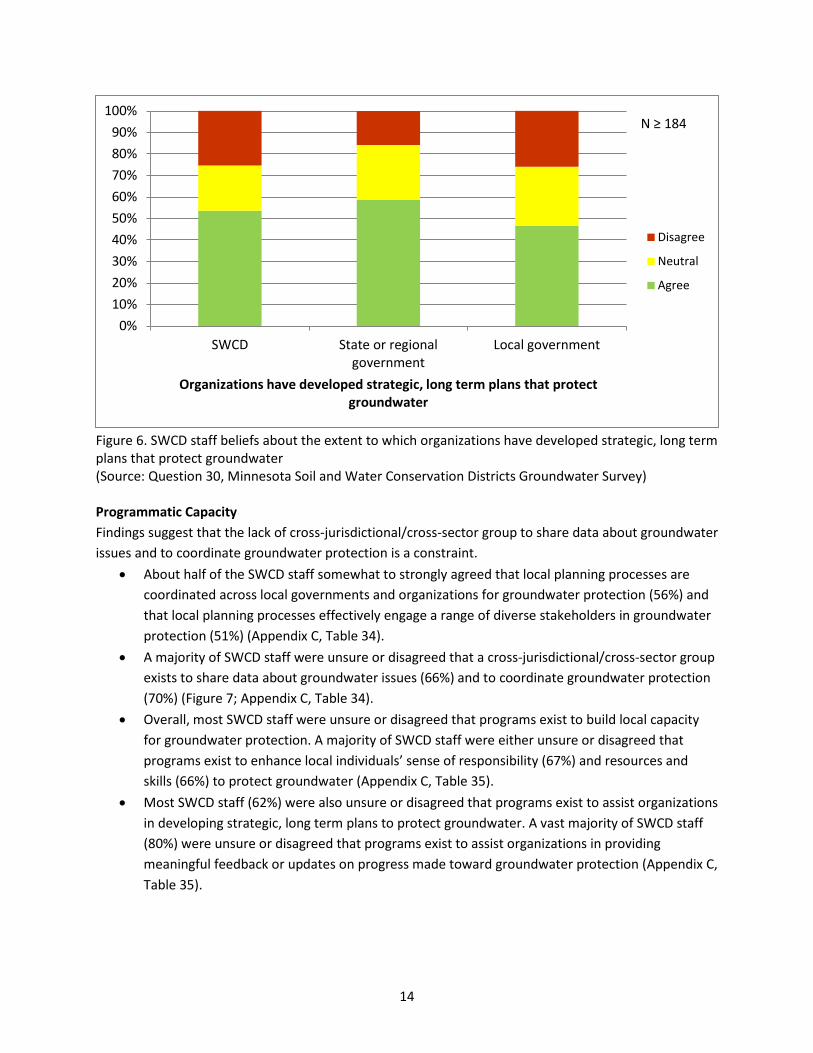
SWCD staff were unsure whether local governments have developed strategic, long term plans to protect groundwater.
• More than half of the SWCD staff somewhat to strongly agreed that state or regional government (59%) and their SWCD (54%) have developed strategic, long term plans that protect groundwater. More than a quarter of the SWCD staff (28%) were unsure whether local governments have developed strategic, long term plans that protect groundwater (Figure 6; Appendix C, Table 32).
• A majority of SWCD staff somewhat to strongly agreed that their SWCD (67%), state or regional government (62%), public water suppliers (58%) and local governments (55%) have the capacity to adapt to changing environmental conditions to protect groundwater (Appendix C, Table 33).
0%
10%
20%
30%
40%
50%
60%
70%
80%
90%
100%
SWCD State or regionalgovernment
Local government
Groups/orgnizations provide meaningful feedback or updates on progress made toward groundwater protection
Disagree
Neutral
Agree
N ≥ 183
14
Figure 6. SWCD staff beliefs about the extent to which organizations have developed strategic, long term plans that protect groundwater (Source: Question 30, Minnesota Soil and Water Conservation Districts Groundwater Survey) Programmatic Capacity Findings suggest that the lack of cross-jurisdictional/cross-sector group to share data about groundwater issues and to coordinate groundwater protection is a constraint.
• About half of the SWCD staff somewhat to strongly agreed that local planning processes are coordinated across local governments and organizations for groundwater protection (56%) and that local planning processes effectively engage a range of diverse stakeholders in groundwater protection (51%) (Appendix C, Table 34).
• A majority of SWCD staff were unsure or disagreed that a cross-jurisdictional/cross-sector group exists to share data about groundwater issues (66%) and to coordinate groundwater protection (70%) (Figure 7; Appendix C, Table 34).
• Overall, most SWCD staff were unsure or disagreed that programs exist to build local capacity for groundwater protection. A majority of SWCD staff were either unsure or disagreed that programs exist to enhance local individuals’ sense of responsibility (67%) and resources and skills (66%) to protect groundwater (Appendix C, Table 35).
• Most SWCD staff (62%) were also unsure or disagreed that programs exist to assist organizations in developing strategic, long term plans to protect groundwater. A vast majority of SWCD staff (80%) were unsure or disagreed that programs exist to assist organizations in providing meaningful feedback or updates on progress made toward groundwater protection (Appendix C, Table 35).
0%10%20%30%40%50%60%70%80%90%
100%
SWCD State or regionalgovernment
Local government
Organizations have developed strategic, long term plans that protect groundwater
Disagree
Neutral
Agree
N ≥ 184

15
Figure 7. SWCD staff beliefs about cross-jurisdictional/cross-sector coordination in groundwater protection (Source: Question 34, Minnesota Soil and Water Conservation Districts Groundwater Survey) Legitimacy, Trust and Fairness SWCD staff believed that they are an appropriate organization to make decisions about groundwater issues and that SWCDs are a trusted source of information about groundwater.
• A majority of SWCD staff somewhat to strongly agreed that SWCDs are an appropriate organization to make decisions about groundwater quality (69%) and quantity (55%) (Figure 8; Appendix C, Table 36).
• Almost two-thirds of SWCD staff (64%) somewhat to strongly agreed that community members and organizations trust groundwater information from their SWCD (Figure 8). However, a majority of respondents (53%) were unsure whether community members and organizations perceive that groundwater protection decisions in their district are fair (Figure 8; Appendix C, Table 36).
0%10%20%30%40%50%60%70%80%90%
100%
A cross-jurisdictional/cross-sectorgroup exists to share data about
groundwater issues.
A cross-jurisdictional/cross-sectorgroup exists to coordinategroundwater protection.
Disagree
Neutral
Agree
N ≥ 184

16
Figure 8. SWCD staff perspectives on SWCD legitimacy of decision making, trust in SWCD information on groundwater and fairness in decision making (Source: Question 34, Minnesota Soil and Water Conservation Districts Groundwater Survey)
VII. Information needs
What types of assistance or support do SWCD staff need to address their clientele’s groundwater concerns?
• The five types of assistance or support that SWCD staff selected most frequently were (1) information on local groundwater quality and quantity trends, (2) funding for best management practice implementation, (3) information on studies on land use impacts on groundwater, (4) better understanding of groundwater basics and surface-groundwater connections and, (5) grant opportunities to fund groundwater and drinking water protection activities in local plans (Appendix C, Table 37).
What areas of support do SWCD staff need to build local capacity for groundwater protection? • The five areas of support that SWCD staff selected most frequently were (1) increasing local
knowledge associated with groundwater protection, (2) defining and communicating local groundwater issues to a range of audiences, (3) accessing financial resources to implement
0%
10%
20%
30%
40%
50%
60%
70%
80%
90%
100%
SWCDs are anappropriate organizationto make decisions about
groundwater quality.
Community members andorganizations trust
groundwater informationfrom my SWCD.
Community members andorganizations perceive
that groundwaterprotection decisions in
my district are fair.
Disagree
Neutral
Agree
N ≥ 182
17
engagement/outreach activities, (4) developing cultural norms and expectations around groundwater protection, and (5) identifying community needs and concerns associated with groundwater (Appendix C, Table 38).
What are SWCD staff beliefs about the importance and effectiveness of work areas to address groundwater issues? While SWCD staff believe that local community member engagement is important to address groundwater issues, they believe that their SWCD is not effective at local community member engagement.
• Overall, the three most important work areas to address groundwater issues were local community member engagement, education and outreach, and conservation practice implementation (Appendix C, Table 39).
• On average, the three areas that SWCD staff believe their SWCD is most effective at include conservation practice implementation, administration and grant management, and education and outreach (Appendix C, Table 40).
• A majority of SWCD staff (81%) believed that conservation practice implementation is very to extremely important to address groundwater issues. A majority of respondents (79%) also believed that their SWCD is somewhat to very effective at conservation practice implementation (Appendix C, Tables 39, 40).
• While more than three-quarters of respondents (77%) believed that local community member engagement is very to extremely important, a little over half of the respondents (55%) believed that their SWCD is effective at local community member engagement (Appendix C, Tables 39, 40).

18
Workshop Evaluation
Methods MNDNR and MASWCD designed and offered four workshops in four selected areas of the state (Figure 9) from July through August, 2015. The findings from the capacity assessment survey helped develop workshops tailored to the concerns and needs of SWCD staff in four geographic locations in Greater Minnesota. The workshops were designed for SWCD staff in each region, although some additional resource managers or professionals also attended. The objectives of the workshop aligned with SWCD staff needs expressed in the baseline survey. The workshop objectives were to:
• Share current information on local hydrogeology, groundwater quality, and supply • Develop a better understanding of the connection between groundwater and surface water • Clarify roles regarding groundwater and drinking water management • Illustrate the impacts of land uses on groundwater quality and quantity • Present examples of SWCD “next” practices
The workshops were evaluated using a pre/post survey design. Data were collected through online surveys before and after the workshops. After prospective participants registered for the workshop, they were sent an email asking them to complete a pre-workshop survey (Appendix D) as a prerequisite to attending the workshop. The survey asked participants about their knowledge of groundwater quality and quantity, their confidence in their ability to address groundwater issues, and clarity of their role in groundwater management. After attending the workshop, participants were sent an email asking them to complete a post-workshop survey (Appendix E). The post-workshop survey replicated pre-workshop questions and included a brief workshop evaluation.
Participant responses to the pre-workshop and post-workshop surveys were compared for changes in participants’ perceived knowledge, confidence and clarity of roles using independent samples t-test. An alpha level of 0.05 was used for these analyses. Additionally, responses to the workshop evaluation were compiled and assessed to determine whether the workshop met intended outcomes. Findings from these analyses are presented in the next section.

19
Figure 9. Minnesota Department of Natural Resources Groundwater workshop areas (workshop offered in each colored area)

20
Findings Of the 145 workshop registrants who completed the pre-workshop survey, 126 attended the workshop. Of the 126 workshop participants, 99 completed the post-workshop survey for a response rate of 79%.
Pre- and post-workshop participants were asked to rate their knowledge in seven areas on a 5-point scale from very poor (1) to very good (5). They were also asked to rate the confidence in their ability in four areas on a 5-point scale from not at all (1) to extremely (5). Pre- and post-workshop participants were asked to rate the clarity of their and others’ role in groundwater or drinking water management.
• Respondents’ ratings of their knowledge in all seven areas were statistically higher after the workshop. The areas with the biggest increase in mean rating of knowledge include land use impacts on groundwater quantity (t = -4.303, p < 0.01), local groundwater supply (t = -3.922, p < 0.01) and connection between groundwater and surface water (t = -4.313, p < 0.01) (Appendix F, Table 3).
• A positive change in confidence in respondents’ ability was observed after the workshop. Participants were more confident in their ability to find information on groundwater issues (t = -5.075, p < 0.01), implement best management practices to protect drinking water (t = -3.721, p < 0.01), implement best management practices to protect groundwater (t = -3.642, p < 0.01) and find information on drinking water issues (t = -3.225, p < 0.01) after the workshop (Appendix F, Table 6).
• Participants reported that their role in groundwater or drinking water management was clearer after the workshop (t = -2.534, p < 0.05) (Appendix F, Table 7). Similarly, participants reported that the role of others (i.e., state and local agencies, governments, landowners and non-governmental organizations) was clearer after the workshop (t = -3.758, p < 0.01) (Appendix F, Table 8).
• Post- workshop participants were also asked to rate a series of statements on a 5-point scale from strongly disagree (1) to strongly agree (5). An overwhelming majority of participants somewhat to strongly agreed that they learned something new in this workshop (96%) and that the workshop was a good use of their time (94%) (Appendix F, Table 9).
• A majority of the participants somewhat to strongly agreed that they have a better understanding of the connections between groundwater and surface water (78%), land use impacts on groundwater (68%), local hydrogeology (66%), local groundwater quality (62%), and local groundwater supply (63%) after the workshop (Appendix F, Table 9).

21
Discussion and Recommendations This study has provided much needed insights on critical questions identified by resource managers. These questions include what are the perspectives of SWCD staff on groundwater issues, what are existing capacities for and constraints to groundwater protection at the local level, and what types of assistance or support do SWCD staff need for groundwater protection. The findings from the pre- and post-workshop survey and evaluation indicated that workshops tailored to the concerns and needs of participants produces positive results. These study findings should inform and enhance resource managers’ ability to design capacity building programs aimed at groundwater protection at the local level. Below we highlight major findings from the study and provide recommendations for future programming.
I. SWCD staff are concerned about groundwater issues but believe that organizations are not doing enough to address groundwater problems.
The findings from the capacity assessment survey suggest that groundwater quantity and quality issues are important to SWCD staff. SWCD staff are also concerned about the impact of various land use problems and pollutants/issues on groundwater quality and quantity. Tile drainage and filling/loss of wetlands were identified as the biggest land use problems to groundwater. Nitrate contamination, and increasing and inefficient water use were identified as major pollutants/issues affecting groundwater. However, SWCD staff believe that not enough is being done to protect groundwater. Most SWCD staff were either unsure or disagreed that their SWCD, state agencies, local government decision makers, local non-government decision makers, and local community members were doing enough to protect groundwater. These findings highlight the need to address groundwater problems at both the local and state levels. State level plans that integrate groundwater protection into broader water resource plans may assist local units by setting up a framework for groundwater management at the local level. SWCD staff also rely on state agencies such as MNDNR, MDH and MPCA for information about groundwater issues. State agencies should continue to provide information and resources to local decision makers to support local groundwater protection. Maintaining consistent messaging about groundwater issues will be an important strategy.
II. Multiple capital and capacity constraints to groundwater protection exist.
The biggest capital constraints to groundwater protection appear to be financial resources, staffing, and training to integrate groundwater management into local plans. Overall, most SWCD staff believed that SWCD and other government staff feel responsible for groundwater protection and are likely to take action. However, SWCD staff indicated that local decision makers (e.g., local government staff, SWCD staff) and community members lack the resources to address groundwater issues. Study findings indicate that most groups and organizations do not provide meaningful feedback or updates on progress made toward groundwater protection. The findings also suggest that while SWCDs may have the capacity to develop cultural norms (i.e., expected behaviors) around groundwater protection, local governments do not have that same capacity. The lack of strategic, long term plans to protect groundwater at the local level was also a constraint. The biggest challenge appears to be the lack of programmatic capacity to address groundwater issues. The lack of a widely shared vision for

22
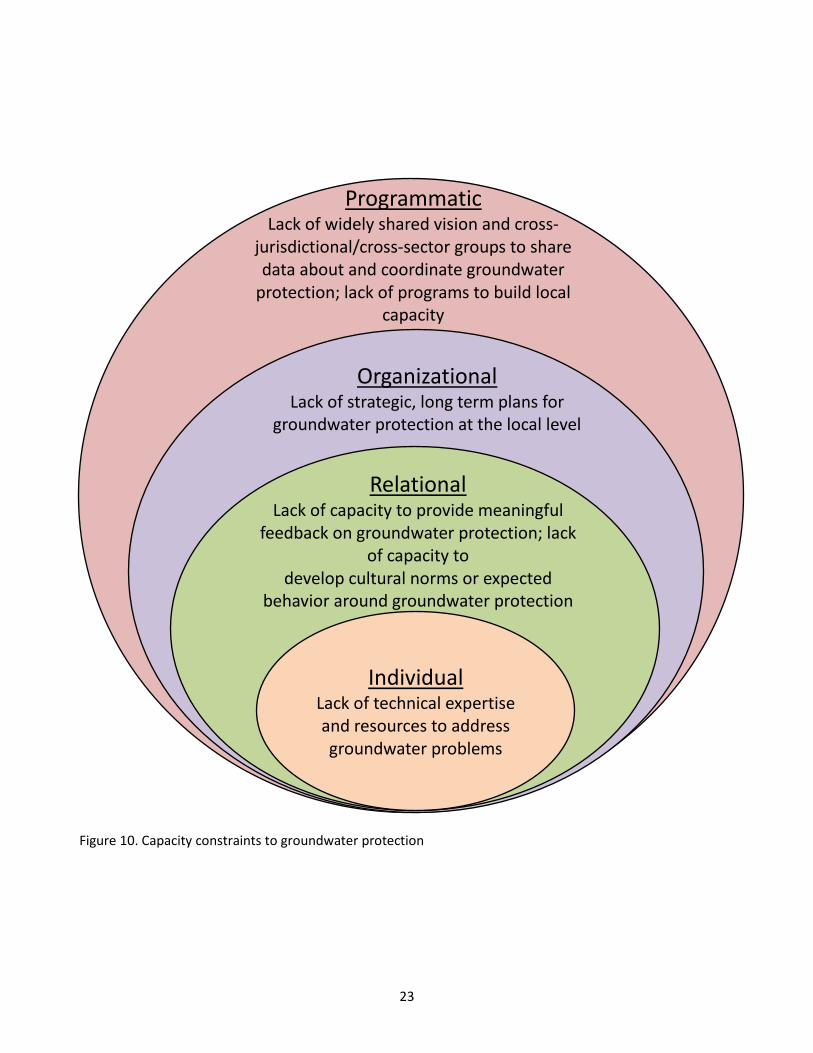
groundwater protection, and the lack of cross-jurisdictional groups to share data about groundwater issues and coordinate groundwater protection were important programmatic constraints. The lack of programs (e.g., training and professional development programs) to build local capacity was also a key constraint (Figure 10). These findings indicate that support is needed not only in increasing technical expertise, but also in building local capacity for groundwater protection. As the study participants indicated, support is needed in increasing local knowledge, communicating groundwater issues, developing cultural norms and identifying community needs and concerns associated with groundwater. These findings also suggest that long-term, cross-jurisdictional efforts are needed to protect groundwater.
III. Groundwater workshops tailored to the concerns and needs of participants significantly enhanced participants’ understanding of groundwater issues, increased confidence in their management abilities, and clarified groundwater management roles.
The workshops were developed based on the information needs identified in the baseline capacity assessment survey. Survey respondents identified the need for information on groundwater quality and quantity trends, information on land use impacts on groundwater and better understanding of groundwater basics and surface-groundwater connections. The findings from the pre- and post-workshop surveys indicate that the workshop met its objectives. There was a significant positive change in knowledge about groundwater issues among workshop participants. Further, the workshop also enhanced their confidence in their ability to find information about and implement best management practices to protect groundwater and drinking water. The workshops also clarified participants’ roles and the roles of other organizations in groundwater management. Findings from the post-workshop evaluation also indicate that workshop participants have a better understanding of groundwater issues.
23
Individual
Individual Lack of technical expertise and resources to address groundwater problems
Relational Lack of capacity to provide meaningful
feedback on groundwater protection; lack of capacity to
develop cultural norms or expected behavior around groundwater protection
Organizational Lack of strategic, long term plans for
groundwater protection at the local level
Programmatic Lack of widely shared vision and cross-
jurisdictional/cross-sector groups to share data about and coordinate groundwater
protection; lack of programs to build local capacity
Figure 10. Capacity constraints to groundwater protection

24
Recommendations
Table 1. Integrated findings and recommendations Findings Source Recommendations State agencies (e.g., DNR, MDH, MPCA, BWSR) are primary information sources about groundwater issues
Appendix C, Table 8 Promote information exchange across state agencies and maintain consistent messaging about groundwater issues
Lack of financial resources and technical expertise are a constraint: SWCD staff reported that they lack technical expertise in groundwater quality and quantity issues; financial resources, technical capacity and lack of training were primary constraints reported by SWCD staff
Appendix C, Tables 13, 14 and 23
Provide training and technical assistance in groundwater issues; support local organizations and community members with strategic funding programs
Lack of expertise in engagement of primary client groups (e.g., private landowners, agricultural producers) in groundwater issues are a constraint
Appendix C, Tables 10, 11 and 16
Provide training in and support for the engagement of landowners and agricultural producers; encourage and support community engagement in groundwater issues
High level of concern about the impact of land use problems and pollutants on groundwater quality and quantity; tile drainage and filling/loss of wetlands identified as primary land use problems
Appendix C, Tables 17 to 21 Prioritize and address land use problems of highest concern in local and state groundwater plans
Local capacity to bring people together to share knowledge and concerns about groundwater, provide meaningful feedback on groundwater protection and develop cultural norms or expected behavior for groundwater protection are constraints
Appendix C, Tables 29, 30 and 31
Identify and support formal and informal knowledge networks; highlight local “success stories” to promote groundwater protection as a cultural norm

25
Findings Source Recommendations Organizational capacity to develop strategic, long term plans for groundwater protection at the local level is a constraint
Appendix C, Table 32 Integrate groundwater protection goals into local and statewide water resource plans; provide funding and technical support for groundwater plans
Lack of widely shared vision and cross-jurisdictional/cross-sector groups to share data about and coordinate groundwater protection
Appendix C, Table 34 Promote information exchange across local and state organizations; conduct “visioning” sessions to find common ground and vision for statewide groundwater protection goals; proactively involve local and state decision makers to coordinate groundwater planning across multiple scales
Lack of programs to build community capacity is a constraint
Appendix C, Table 35 Provide training in or expand the scope of existing training programs to include training in capacity building
Groundwater workshops met its objectives; workshop participants have a better understanding of groundwater issues, are more confident in their ability, and are clearer about their and others’ roles in groundwater management
Appendix F, Tables 1-9 Continue support for similar workshops that provide much needed assistance to address groundwater issues
SWCD staff also indicated that they need support to build local capacity
Appendix C, Table 38 Expand future workshops to include capacity building

26
Literature Cited Davenport, M.A., & E. Seekamp. (2013). A multilevel model of community capacity for sustainable watershed
management. Society and Natural Resources: An International Journal, 26(9), 1101-1111. Dillman, D. A., Smyth, J. D., & Christian, L. M. (2009). Internet, mail, and mixed-mode surveys: the tailored
design method. John Wiley & Sons, Hoboken, NJ, ISBN-13: 978-0471698685. Pradhananga, A. & Davenport, M.A. (2013). A community capacity assessment study in the Minnehaha Creek
Watershed, Minnesota. St. Paul, MN: Department of Forest Resources, University of Minnesota. 64 pp.

27
Appendices

28
Appendix A: Baseline Capacity Assessment Email Contact Script
29
Subject: Minnesota Soil and Water Conservation Districts Groundwater Survey
Dear [First Name] [Last Name], I am writing to ask for your help in a statewide study to better understand Minnesota Soil and Water Conservation District (SWCD) staff opinions about technical capacity and engagement in groundwater protection. The study is being conducted by the University of Minnesota (UMN) with support and guidance from the Minnesota Association of Soil and Water Conservation Districts (MASWCD), Minnesota Department of Natural Resources (DNR), Minnesota Department of Health (MDH) and Minnesota Department of Agriculture (MDA). As a staff member in a Soil and Water Conservation District you have an important role to play in groundwater protection and an important perspective to share. The findings from this study will be used to guide future work direction and staff development needs to protect groundwater. The findings will also inform development of this summer’s tailored groundwater protection capacity-building workshops for SWCD staff. The study and workshops are in response to SWCD resolutions requesting MASWCD to help incorporate groundwater considerations into district planning efforts and assist with local implementation activities to promote the sustainable use and management of Minnesota’s groundwater resources It should take you approximately 30 minutes to complete the questionnaire. Please answer the questions to the best of your knowledge and as completely as possible. This survey is voluntary and completely confidential. Your responses will not be associated with your name or any personal information. Please click here to access the questionnaire. We would be happy to answer any questions or listen to any comments you may have about this study. Please feel free to contact me by phone at 651-690-9028 or by email at [email protected]. If you have any questions or concerns regarding the study and would like to talk to someone other than the researcher(s), you are encouraged to contact the University of Minnesota’s Research Subjects' Advocate Line, D-528 Mayo, 420 Delaware Street S.E., Minneapolis, Minnesota, 55455; telephone (612) 625-1650. I hope you enjoy completing the questionnaire and I look forward to receiving your response. Sincerely, LeAnn Buck Executive Director Minnesota Association of Soil and Water Conservation Districts

30
Appendix B: Baseline Capacity Assessment Questionnaire
31
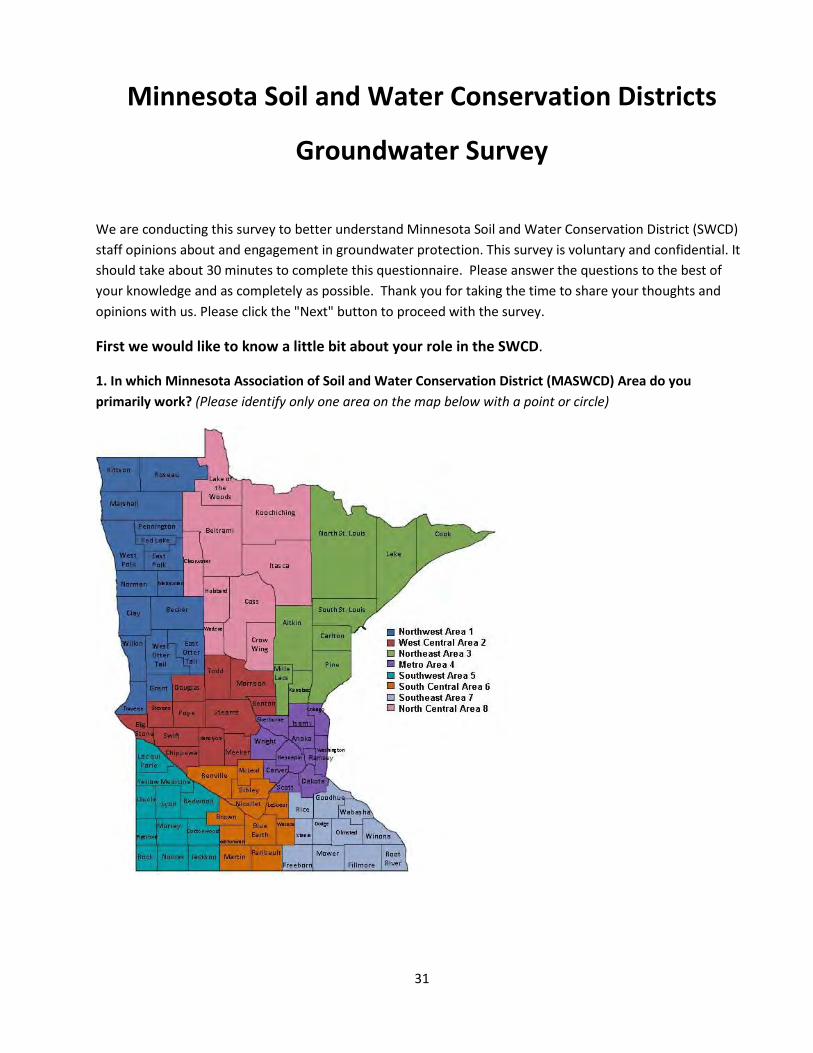
Minnesota Soil and Water Conservation Districts
Groundwater Survey
We are conducting this survey to better understand Minnesota Soil and Water Conservation District (SWCD) staff opinions about and engagement in groundwater protection. This survey is voluntary and confidential. It should take about 30 minutes to complete this questionnaire. Please answer the questions to the best of your knowledge and as completely as possible. Thank you for taking the time to share your thoughts and opinions with us. Please click the "Next" button to proceed with the survey.
First we would like to know a little bit about your role in the SWCD.
1. In which Minnesota Association of Soil and Water Conservation District (MASWCD) Area do you primarily work? (Please identify only one area on the map below with a point or circle)
32
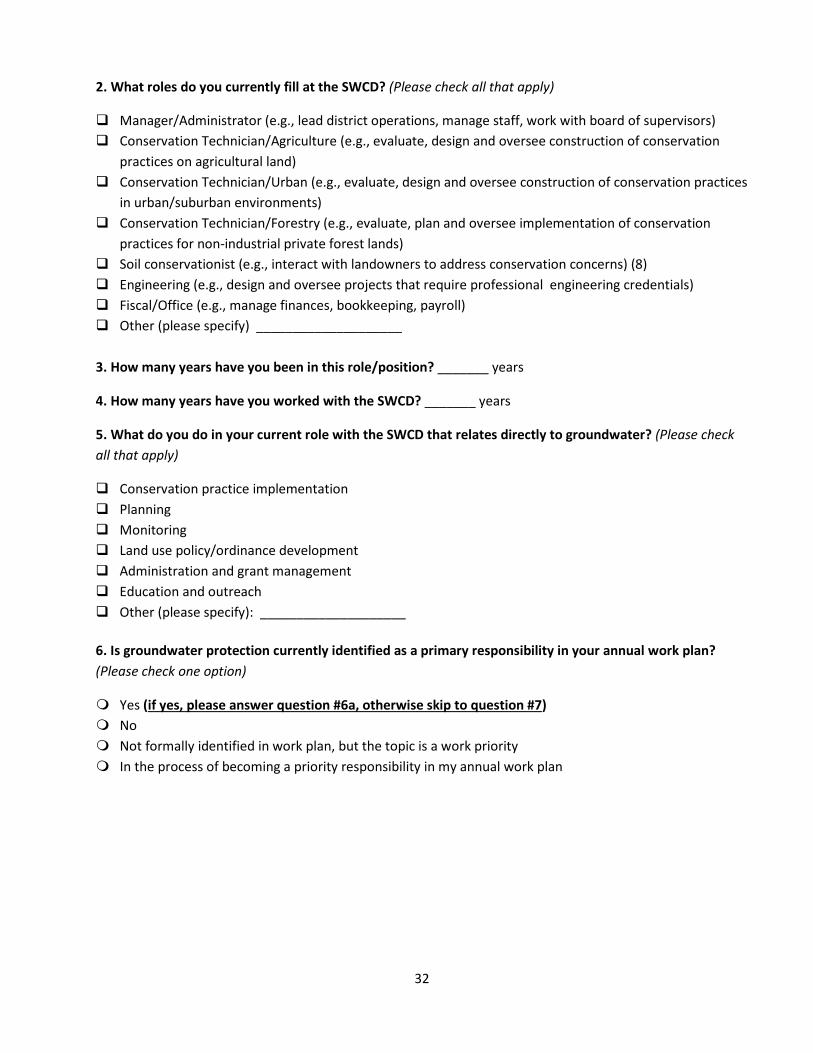
2. What roles do you currently fill at the SWCD? (Please check all that apply)
Manager/Administrator (e.g., lead district operations, manage staff, work with board of supervisors) Conservation Technician/Agriculture (e.g., evaluate, design and oversee construction of conservation
practices on agricultural land) Conservation Technician/Urban (e.g., evaluate, design and oversee construction of conservation practices
in urban/suburban environments) Conservation Technician/Forestry (e.g., evaluate, plan and oversee implementation of conservation
practices for non-industrial private forest lands) Soil conservationist (e.g., interact with landowners to address conservation concerns) (8) Engineering (e.g., design and oversee projects that require professional engineering credentials) Fiscal/Office (e.g., manage finances, bookkeeping, payroll) Other (please specify) ____________________
3. How many years have you been in this role/position? _______ years
4. How many years have you worked with the SWCD? _______ years
5. What do you do in your current role with the SWCD that relates directly to groundwater? (Please check all that apply)
Conservation practice implementation Planning Monitoring Land use policy/ordinance development Administration and grant management Education and outreach Other (please specify): ____________________ 6. Is groundwater protection currently identified as a primary responsibility in your annual work plan? (Please check one option)
Yes (if yes, please answer question #6a, otherwise skip to question #7) No Not formally identified in work plan, but the topic is a work priority In the process of becoming a priority responsibility in my annual work plan
33
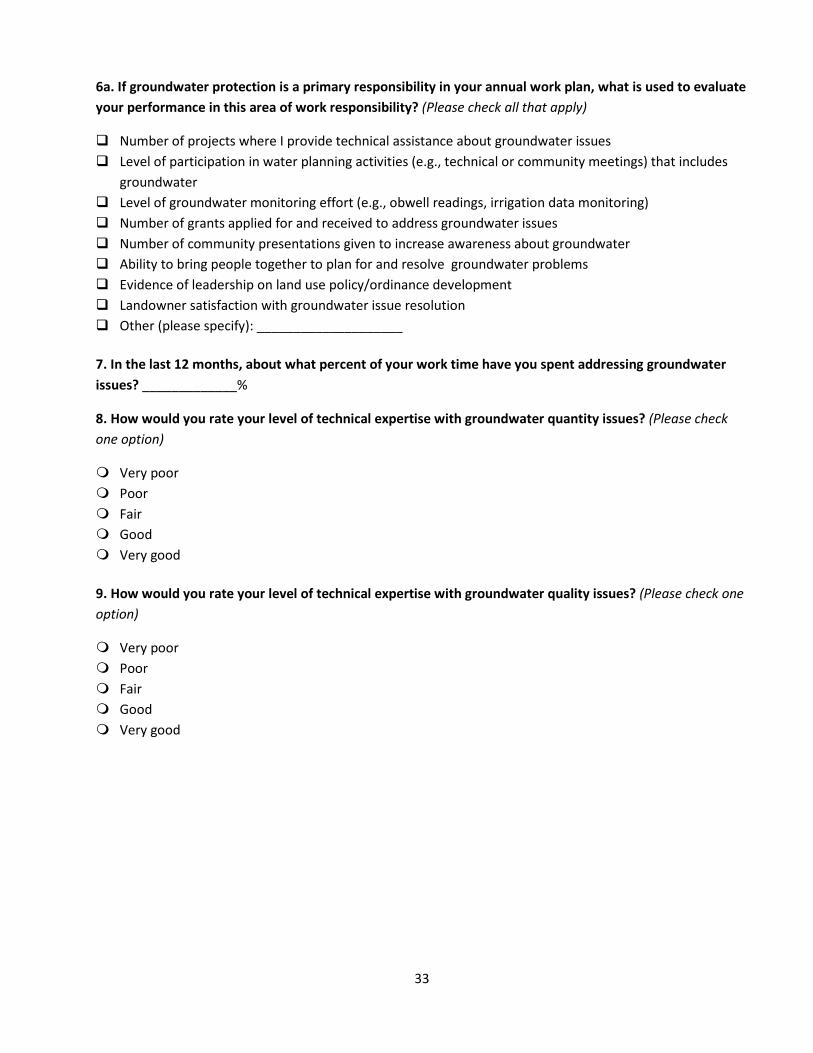
6a. If groundwater protection is a primary responsibility in your annual work plan, what is used to evaluate your performance in this area of work responsibility? (Please check all that apply)
Number of projects where I provide technical assistance about groundwater issues Level of participation in water planning activities (e.g., technical or community meetings) that includes
groundwater Level of groundwater monitoring effort (e.g., obwell readings, irrigation data monitoring) Number of grants applied for and received to address groundwater issues Number of community presentations given to increase awareness about groundwater Ability to bring people together to plan for and resolve groundwater problems Evidence of leadership on land use policy/ordinance development Landowner satisfaction with groundwater issue resolution Other (please specify): ____________________ 7. In the last 12 months, about what percent of your work time have you spent addressing groundwater issues? _____________%
8. How would you rate your level of technical expertise with groundwater quantity issues? (Please check one option)
Very poor Poor Fair Good Very good 9. How would you rate your level of technical expertise with groundwater quality issues? (Please check one option)
Very poor Poor Fair Good Very good
34
10. To what extent do you agree or disagree with the following statements? (Please circle one number for each row)
Strongly disagree
Somewhat disagree
Neither agree nor disagree
Somewhat agree
Strongly agree
I am confident in my knowledge of groundwater issues in my district. 1 2 3 4 5
I have enough knowledge about groundwater in my district to address questions or problems brought to me by clients.
1 2 3 4 5
I have enough knowledge about landowners and land users in my district to work effectively with them on groundwater issues on their land.
1 2 3 4 5
I have enough knowledge about local land use planning to work effectively with local governments to protect groundwater.
1 2 3 4 5
11. What individuals or groups do you rely on for information about groundwater issues? (Please check all that apply)
USDA National Resource Conservation Service (NRCS) MN Department of Natural Resources (DNR) Minnesota Department of Health (MDH) Minnesota Department of Agriculture (MDA) Minnesota Pollution Control Agency (MPCA) Minnesota Board of Soil and Water Resources (BWSR) Local watershed district/ watershed management organization Minnesota Geological Survey (MGS) County staff Municipal staff Tribal resource managers University researchers University of Minnesota Extension Consultants Providers (e.g., well drillers, seed, equipment) Landowners/land users Other (please specify): ____________________

35
11a. To what extent do you rely on the following individuals or groups for information about groundwater protection?
Not at all Slightly Moderately A lot
USDA National Resource Conservation Service (NRCS) 1 2 3 4 MN Department of Natural Resources (DNR) 1 2 3 4
Minnesota Department of Health (MDH) 1 2 3 4
Minnesota Department of Agriculture (MDA) 1 2 3 4 Minnesota Pollution Control Agency (MPCA) 1 2 3 4 Minnesota Board of Soil and Water Resources (BWSR) 1 2 3 4 Local watershed district/ watershed management organization 1 2 3 4
Minnesota Geological Survey (MGS) 1 2 3 4
County staff 1 2 3 4
Municipal staff 1 2 3 4
Tribal resource managers 1 2 3 4
University researchers 1 2 3 4
University of Minnesota Extension 1 2 3 4
Consultants 1 2 3 4
Providers (e.g., well drillers, seed, equipment) 1 2 3 4
Landowners/land users 1 2 3 4
Other (please specify): ____________________ 1 2 3 4

36
Next, we would like to know about your interactions with various client groups in groundwater issues.
12. What client groups do you interact with on groundwater issues? (Please check all that apply)
Agricultural producers Agricultural service providers (fertilizer and pesticide dealers and/or applicators, crop consultants) Timber/pulp producers Private landowners State or regional governments Local governments (e.g., city, township or county) Tribal governments Watershed districts/watershed management organizations Public water suppliers (e.g., municipal, rural water system, business, school) Non-profit/advocacy organizations (e.g., lake associations, wildlife organizations) Other (please specify): ____________________
12a. In the past 12 months, how often would you say that you have interacted with the following client groups on groundwater issues?
Never Rarely Sometimes Very often
All the time
Agricultural producers 1 2 3 4 5 Agricultural service providers (fertilizer and pesticide dealers and/or applicators, crop consultants)
1 2 3 4 5
Timber/pulp producers 1 2 3 4 5
Private landowners 1 2 3 4 5 State or regional governments 1 2 3 4 5 Local governments (e.g., city, township or county) 1 2 3 4 5
Tribal governments 1 2 3 4 5 Watershed districts/watershed management organizations 1 2 3 4 5
Public water suppliers (e.g., municipal, rural water system, business, school) 1 2 3 4 5
Non-profit/advocacy organizations (e.g., lake associations, wildlife organizations) 1 2 3 4 5
Other (please specify): ______________ 1 2 3 4 5

37
13. Do you think the percent of time you spend interacting with clients on groundwater issues in the future will... (Please check one option)
Increase Decrease Stay the same Don't know Next, we would like to know about your engagement with various groups on groundwater issues.
Please keep in mind the following definition of engagement when responding to these questions: Active discussion and problem solving that encourages and inspires others to get involved in groundwater protection. 14. How would you rate your level of expertise in engagement of the following groups in groundwater issues? (Please circle one number for each row)
Very poor Poor Fair Good Very good
Landowners and land users 1 2 3 4 5
Local government decision makers 1 2 3 4 5 Agricultural service providers (e.g., fertilizer and pesticide dealers, crop consultants)
1 2 3 4 5
Tribal governments 1 2 3 4 5
Now, we have a few questions about your perspectives on groundwater protection in your district.
15. How important are groundwater quality issues to your SWCD? (Please check one option) Not at all important Slightly important Moderately important Very important Extremely important
38
16. In your opinion, how much of a problem are the following land uses to groundwater quality in your district? (Please circle one number for each row)
Not a problem
Slight problem
Moderate problem
Severe problem
Conversion of dry land agriculture to irrigated agriculture 1 2 3 4
Conversion of natural landscapes to row crop agriculture 1 2 3 4
Conversion of hay land, pasture and small grain farming to row crop agriculture 1 2 3 4
Conversion of Conservation Reserve Program (CRP) land to row crop agriculture 1 2 3 4
Modification of crop rotations on irrigated land to include more water intensive crops 1 2 3 4
Filling/loss of wetlands 1 2 3 4
Loss of native prairie 1 2 3 4
Tile drainage 1 2 3 4
Urban development 1 2 3 4
Rural residential development 1 2 3 4
17. How important are groundwater quantity issues to your SWCD? (Please check one option)
Not at all important Slightly important Moderately important Very important Extremely important

39
18. In your opinion, how much of a problem are the following land uses to groundwater quantity in your district? (Please circle one number for each row)
Not a problem
Slight problem
Moderate problem
Severe problem
Conversion of dry land agriculture to irrigated agriculture 1 2 3 4
Conversion of natural landscapes to irrigated agriculture 1 2 3 4
Conversion of hay land, pasture and small grain farming to irrigated agriculture 1 2 3 4
Conversion of Conservation Reserve Program (CRP) land to row crop agriculture 1 2 3 4
Modification of crop rotations on irrigated land to include more water intensive crops 1 2 3 4
Filling/loss of wetlands 1 2 3 4
Loss of native prairie 1 2 3 4
Tile drainage 1 2 3 4
Urban development 1 2 3 4
Rural residential development 1 2 3 4
40
19. In your opinion, how much of a problem are the following to groundwater in your district? (Please circle one number for each row)
Not a problem
Slight problem
Moderate problem
Severe problem
Nitrate contamination 1 2 3 4
Pesticide contamination 1 2 3 4
Inefficient water use 1 2 3 4
Increasing water use 1 2 3 4
Declining water levels/need to deepen wells or drop pumps 1 2 3 4
Unsealed private wells 1 2 3 4
Arsenic 1 2 3 4 Contaminants of emerging concern (e.g., pharmaceuticals) 1 2 3 4
Bacterial contamination 1 2 3 4
Inadequate water supply to meet demand 1 2 3 4
Climate related impacts 1 2 3 4
Other (please specify):__________________ 1 2 3 4
41
20. To what extent do you agree or disagree with the following statements? (Please circle one number for each row)
Strongly disagree
Somewhat disagree
Neither agree nor disagree
Somewhat agree
Strongly agree
My SWCD is doing enough to protect groundwater. 1 2 3 4 5
My SWCD is restoring areas to better protect groundwater. 1 2 3 4 5
Local community members (e.g., landowners, farmers, residents) are doing enough to protect groundwater.
1 2 3 4 5
Local government decision makers (e.g., local elected/appointed officials and staff, public water suppliers) are doing enough to protect groundwater.
1 2 3 4 5
Local non-government (e.g., non-profit/advocacy) organizations are doing enough to protect groundwater.
1 2 3 4 5
State agencies are doing enough to protect groundwater. 1 2 3 4 5

42
21. In your opinion, to what extent do the following factors constrain your efforts to protect groundwater? (Please circle one number for each row)
Not a constraint
Slight constraint
Moderate constraint
Severe constraint
Other local issues taking priority over groundwater protection 1 2 3 4
Technical capacity 1 2 3 4
Financial resources 1 2 3 4
Lack of staff devoted to groundwater protection 1 2 3 4
Client/partner buy-in 1 2 3 4
Appropriate grant opportunities 1 2 3 4
Lack of supervisory/managerial support 1 2 3 4
Lack of sufficient technical assistance from the state 1 2 3 4
Lack of data/information on groundwater problems 1 2 3 4
Lack of training to integrate groundwater management into local plans 1 2 3 4
Lack of support for engaging landowners/landusers in groundwater protection
1 2 3 4
Lack of information about the effectiveness of conservation practices 1 2 3 4
Lack of technical expertise in crop input management 1 2 3 4
43
The next set of questions inquires about individual, community, and regional capacity to protect groundwater. Please answer these questions to the best of your ability. Your opinions are important to our baseline assessment of community capacity for groundwater protection.
22. To what extent do you agree or disagree that the following individuals feel responsible to protect groundwater? (Please circle one number for each row)
Strongly disagree
Somewhat disagree
Neither agree nor disagree
Somewhat agree
Strongly agree
SWCD supervisors 1 2 3 4 5
SWCD staff in my district 1 2 3 4 5 Local government officials and staff (e.g., local elected/appointed officials and staff)
1 2 3 4 5
Public water supply representatives 1 2 3 4 5 Local non-government (e.g., non-profit/advocacy) organization representatives
1 2 3 4 5
Local community members (e.g., landowners, farmers, residents) 1 2 3 4 5
State or regional government staff 1 2 3 4 5 Federal government staff (e.g., Natural Resource Conservation Service, US Fish and Wildlife Service)
1 2 3 4 5
Other (please specify): __________ 1 2 3 4 5
44
23. To what extent do you agree or disagree that the following have the resources needed to protect groundwater? (Please circle one number for each row)
Strongly disagree
Somewhat disagree
Neither agree nor disagree
Somewhat agree
Strongly agree
SWCD supervisors 1 2 3 4 5
SWCD staff in my district 1 2 3 4 5
Local government officials and staff (e.g., local elected/appointed officials and staff)
1 2 3 4 5
Public water suppliers 1 2 3 4 5
Local non-government (e.g., non-profit/advocacy) organization representatives
1 2 3 4 5
Local community members (e.g., landowners, farmers, residents) 1 2 3 4 5
State or regional government staff 1 2 3 4 5
Federal government staff (e.g., Natural Resource Conservation Service, US Fish and Wildlife Service)
1 2 3 4 5
Other (please specify): ____________ 1 2 3 4 5

45
24. To what extent do you agree or disagree that the following are aware of local groundwater problems? (Please circle one number for each row)
Strongly disagree
Somewhat disagree
Neither agree nor disagree
Somewhat agree
Strongly agree
SWCD supervisors 1 2 3 4 5
SWCD staff in my district 1 2 3 4 5
Local government officials and staff (e.g., local elected/appointed officials and staff)
1 2 3 4 5
Public water suppliers 1 2 3 4 5
Local non-government (e.g., non-profit/advocacy) organization representatives
1 2 3 4 5
Local community members (e.g., landowners, farmers, residents) 1 2 3 4 5
State or regional government staff 1 2 3 4 5
Federal government staff (e.g., Natural Resource Conservation Service, US Fish and Wildlife Service)
1 2 3 4 5
Other (please specify): ____________ 1 2 3 4 5
46
25. How likely are each of the following to take future action to protect groundwater? (Please circle one number for each row)
Very unlikely
Somewhat unlikely
Neither likely nor unlikely
Somewhat likely
Very likely
SWCD supervisors 1 2 3 4 5
SWCD staff in my district 1 2 3 4 5
Local government officials and staff (e.g., local elected/appointed officials and staff) 1 2 3 4 5
Public water suppliers 1 2 3 4 5 Local non-government (e.g., non-profit/advocacy) organization representatives
1 2 3 4 5
Local community members (e.g., landowners, farmers, residents) 1 2 3 4 5
State or regional government staff 1 2 3 4 5
Federal government staff (e.g., Natural Resource Conservation Service, US Fish and Wildlife Service)
1 2 3 4 5
Other (please specify): ___________ 1 2 3 4 5

47
26. To what extent do you agree or disagree that the following communicate effectively with community members to protect groundwater? (Please circle one number for each row)
Strongly disagree
Somewhat disagree
Neither agree nor disagree
Somewhat agree
Strongly agree
SWCD supervisors 1 2 3 4 5
SWCD staff in my district 1 2 3 4 5
Local government officials and staff (e.g., local elected/appointed officials and staff)
1 2 3 4 5
Public water suppliers 1 2 3 4 5
Local non-government (e.g., non-profit/advocacy) organization representatives
1 2 3 4 5
Local community members (e.g., landowners, farmers, residents) 1 2 3 4 5
State or regional government staff 1 2 3 4 5
Federal government staff (e.g., Natural Resource Conservation Service, US Fish and Wildlife Service)
1 2 3 4 5
Other (please specify): ____________ 1 2 3 4 5
48
27. To what extent do you agree or disagree that the following groups/organizations bring people together to share knowledge and concerns about groundwater? (Please circle one number for each row)
Strongly disagree
Somewhat disagree
Neither agree nor disagree
Somewhat agree
Strongly agree
My SWCD 1 2 3 4 5
Local governments (e.g., city, township) 1 2 3 4 5
Public water suppliers 1 2 3 4 5
Local non-government (e.g., non-profit/advocacy) organizations 1 2 3 4 5
Informal local community groups or networks 1 2 3 4 5
State or regional government 1 2 3 4 5
Federal government (e.g., Natural Resource Conservation Service, US Fish and Wildlife Service)
1 2 3 4 5
Other (please specify): _____________ 1 2 3 4 5
28. To what extent do you agree or disagree that the following groups/organizations provide meaningful feedback or updates on progress made toward groundwater protection? (Please circle one number for each row)
Strongly disagree
Somewhat disagree
Neither agree nor disagree
Somewhat agree
Strongly agree
My SWCD 1 2 3 4 5
Local governments (e.g., city, township) 1 2 3 4 5
Public water suppliers 1 2 3 4 5
Local non-government (e.g., non-profit/advocacy) organizations 1 2 3 4 5
Informal local community groups or networks 1 2 3 4 5
State or regional government 1 2 3 4 5
Federal government (e.g., Natural Resource Conservation Service, US Fish and Wildlife Service)
1 2 3 4 5
Other (please specify): _____________ 1 2 3 4 5

49
29. To what extent do you agree or disagree that the following groups/organizations promote groundwater protection as a cultural norm, or an expected behavior? (Please circle one number for each row)
Strongly disagree
Somewhat disagree
Neither agree nor disagree
Somewhat agree
Strongly agree
My SWCD 1 2 3 4 5
Local governments (e.g., city, township) 1 2 3 4 5
Public water suppliers 1 2 3 4 5
Local non-government (e.g., non-profit/advocacy) organizations 1 2 3 4 5
Informal local community groups or networks 1 2 3 4 5
State or regional government 1 2 3 4 5
Federal government (e.g., Natural Resource Conservation Service, US Fish and Wildlife Service)
1 2 3 4 5
Other (please specify): _____________ 1 2 3 4 5
30. To what extent do you agree or disagree that the following organizations have developed strategic, long term plans that protect groundwater? (Please circle one number for each row)
Strongly disagree
Somewhat disagree
Neither agree nor disagree
Somewhat agree
Strongly agree
My SWCD 1 2 3 4 5 Local governments (e.g., city, township) 1 2 3 4 5
Public water suppliers 1 2 3 4 5 Local non-government (e.g., non-profit/advocacy) organizations 1 2 3 4 5
State or regional government 1 2 3 4 5
Federal government (e.g., Natural Resource Conservation Service, US Fish and Wildlife Service)
1 2 3 4 5
Other (please specify): ____________ 1 2 3 4 5
50
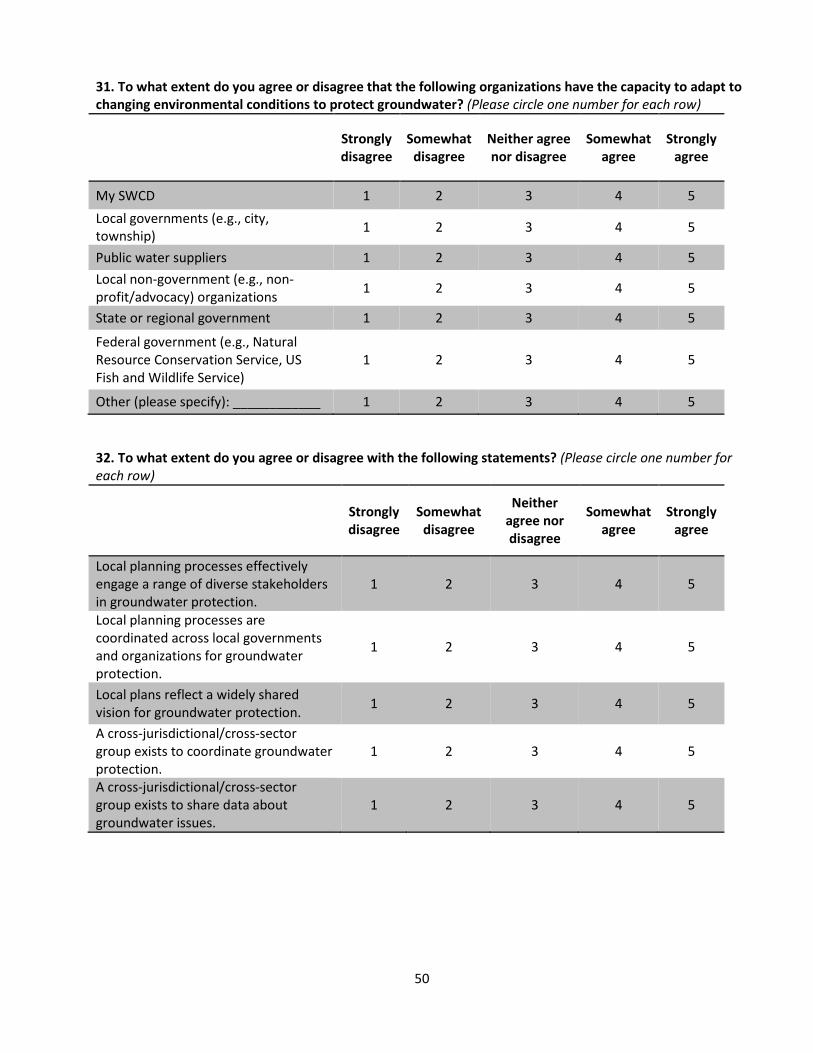
31. To what extent do you agree or disagree that the following organizations have the capacity to adapt to changing environmental conditions to protect groundwater? (Please circle one number for each row)
Strongly disagree
Somewhat disagree
Neither agree nor disagree
Somewhat agree
Strongly agree
My SWCD 1 2 3 4 5 Local governments (e.g., city, township) 1 2 3 4 5
Public water suppliers 1 2 3 4 5 Local non-government (e.g., non-profit/advocacy) organizations 1 2 3 4 5
State or regional government 1 2 3 4 5
Federal government (e.g., Natural Resource Conservation Service, US Fish and Wildlife Service)
1 2 3 4 5
Other (please specify): ____________ 1 2 3 4 5
32. To what extent do you agree or disagree with the following statements? (Please circle one number for each row)
Strongly disagree
Somewhat disagree
Neither agree nor disagree
Somewhat agree
Strongly agree
Local planning processes effectively engage a range of diverse stakeholders in groundwater protection.
1 2 3 4 5
Local planning processes are coordinated across local governments and organizations for groundwater protection.
1 2 3 4 5
Local plans reflect a widely shared vision for groundwater protection. 1 2 3 4 5
A cross-jurisdictional/cross-sector group exists to coordinate groundwater protection.
1 2 3 4 5
A cross-jurisdictional/cross-sector group exists to share data about groundwater issues.
1 2 3 4 5
51
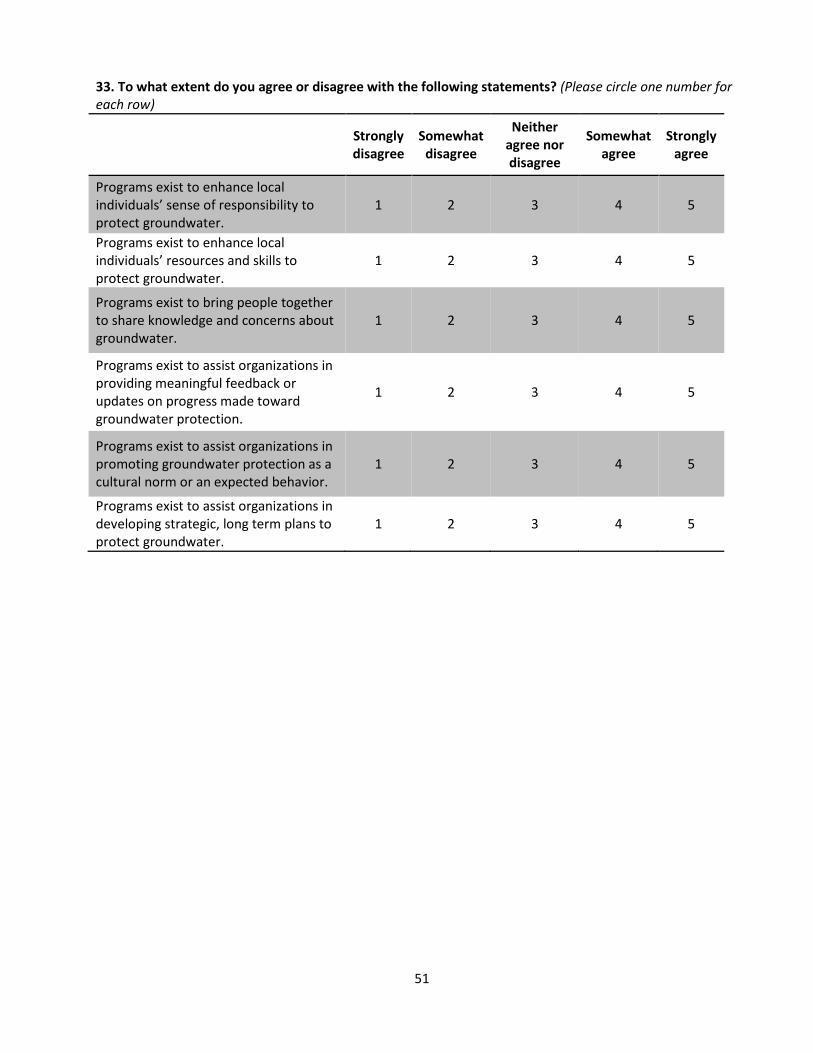
33. To what extent do you agree or disagree with the following statements? (Please circle one number for each row)
Strongly disagree
Somewhat disagree
Neither agree nor disagree
Somewhat agree
Strongly agree
Programs exist to enhance local individuals’ sense of responsibility to protect groundwater.
1 2 3 4 5
Programs exist to enhance local individuals’ resources and skills to protect groundwater.
1 2 3 4 5
Programs exist to bring people together to share knowledge and concerns about groundwater.
1 2 3 4 5
Programs exist to assist organizations in providing meaningful feedback or updates on progress made toward groundwater protection.
1 2 3 4 5
Programs exist to assist organizations in promoting groundwater protection as a cultural norm or an expected behavior.
1 2 3 4 5
Programs exist to assist organizations in developing strategic, long term plans to protect groundwater.
1 2 3 4 5

52
34. To what extent do you agree or disagree with the following statements? (Please circle one number for each row)
Strongly disagree
Somewhat disagree
Neither agree nor disagree
Somewhat agree
Strongly agree
SWCDs are an appropriate organization to make decisions about groundwater quality.
1 2 3 4 5
SWCDs are an appropriate organization to make decisions about groundwater quantity.
1 2 3 4 5
Community members and organizations trust groundwater information from my SWCD.
1 2 3 4 5
Community members and organizations perceive that groundwater protection decisions in my district are fair.
1 2 3 4 5

53
Next, we have a few questions about the types of assistance or support that would be useful to you to address your clientele’s groundwater concerns. 35. To help you address your clientele’s groundwater concerns, what types of assistance or support would be useful to you? (Please check all that apply) Better understanding of groundwater basics and surface-groundwater connections County geologic atlases for groundwater planning Information on studies on land use impacts on groundwater Information on historical groundwater studies and application in land use decision making Information on effectiveness of conservation practices Information and training on crop input management Long term monitoring data to develop trends in local and statewide ground water quality and quantity Information on statewide groundwater quality and quantity trends Information on local groundwater quality and quantity trends Assistance in identifying/prioritizing local threats to groundwater quality/quantity Information and training on various groundwater monitoring efforts and results Information on best management practices and programs to protect groundwater Clarification of the roles and responsibilities of the various governmental agencies in groundwater
(quantity/quality) and drinking water protection Funding for BMP implementation Grant opportunities to fund groundwater and drinking water protection activities in local plans Brochures on groundwater protection Other (please specify): ____________________
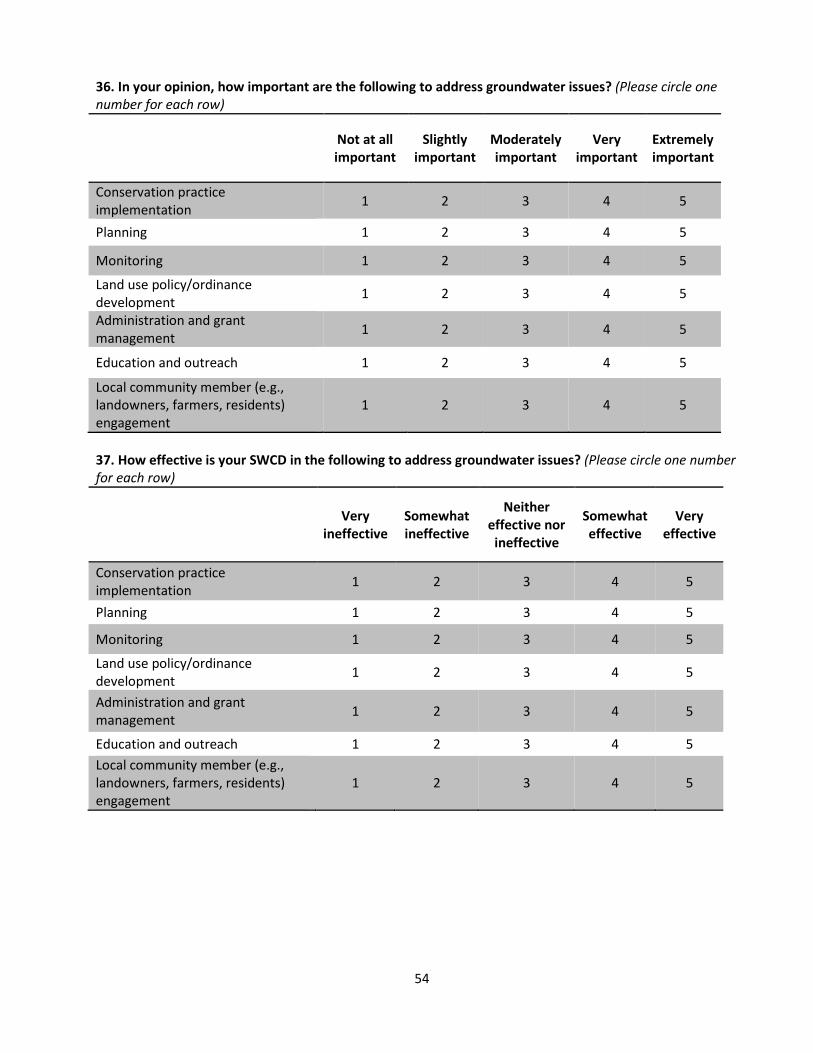
54
36. In your opinion, how important are the following to address groundwater issues? (Please circle one number for each row)
Not at all important
Slightly important
Moderately important
Very important
Extremely important
Conservation practice implementation 1 2 3 4 5
Planning 1 2 3 4 5
Monitoring 1 2 3 4 5
Land use policy/ordinance development 1 2 3 4 5
Administration and grant management 1 2 3 4 5
Education and outreach 1 2 3 4 5
Local community member (e.g., landowners, farmers, residents) engagement
1 2 3 4 5
37. How effective is your SWCD in the following to address groundwater issues? (Please circle one number for each row)
Very ineffective
Somewhat ineffective
Neither effective nor ineffective
Somewhat effective
Very effective
Conservation practice implementation 1 2 3 4 5
Planning 1 2 3 4 5
Monitoring 1 2 3 4 5
Land use policy/ordinance development 1 2 3 4 5
Administration and grant management 1 2 3 4 5
Education and outreach 1 2 3 4 5 Local community member (e.g., landowners, farmers, residents) engagement
1 2 3 4 5

55
38. To help you better engage with clients or build local capacity, what areas of support would be most useful to you? (Please check all that apply)
Identifying community needs and concerns associated with groundwater Increasing local knowledge associated with groundwater protection Defining and communicating local groundwater issues to a range of audiences Defining and communicating state groundwater issues to a range of audiences Inspiring diverse stakeholders to care about groundwater protection Building stronger relationships with landowners Developing stronger partnerships with local organizations Identifying and supporting local champions for groundwater protection Identifying local staff with groundwater expertise Bringing people together to share knowledge and concerns about groundwater Providing community members with meaningful feedback or updates on progress made toward
groundwater protection Developing cultural norms and expectations around groundwater protection Accessing financial resources to implement engagement/outreach activities Other (please specify): ____________________
Finally, we want to know a little bit about you in order to better understand some basic characteristics of the types of people responding to this survey. Remember, your responses to all of the survey questions are confidential.
39. In what year were you born? _____________
40. What is your gender? (Please check one option)
Male Female Prefer not to respond 41. What is the highest level of formal education you have completed? (Please check one option)
Did not finish high school Completed high school Some college but no degree Associate or vocational degree College bachelor's degree Some college graduate work Complete graduate degree (Master or PhD) Prefer not to respond 42. Do you have any other comments about your community or groundwater management?

56
Appendix C: Baseline Capacity Assessment Survey Findings
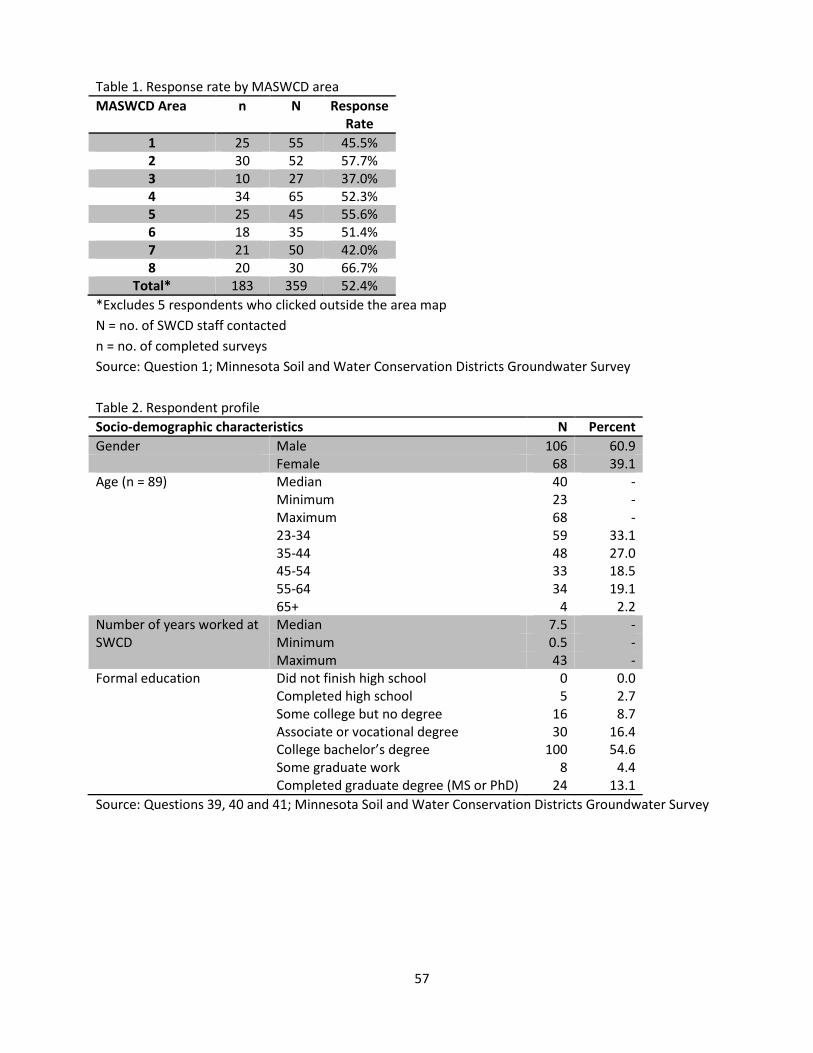
57
Table 1. Response rate by MASWCD area MASWCD Area n N Response
Rate 1 25 55 45.5% 2 30 52 57.7% 3 10 27 37.0% 4 34 65 52.3% 5 25 45 55.6% 6 18 35 51.4% 7 21 50 42.0% 8 20 30 66.7%
Total* 183 359 52.4% *Excludes 5 respondents who clicked outside the area map N = no. of SWCD staff contacted n = no. of completed surveys Source: Question 1; Minnesota Soil and Water Conservation Districts Groundwater Survey Table 2. Respondent profile Socio-demographic characteristics N Percent Gender Male 106 60.9 Female 68 39.1 Age (n = 89) Median 40 - Minimum 23 - Maximum 68 - 23-34 59 33.1 35-44 48 27.0 45-54 33 18.5 55-64 34 19.1 65+ 4 2.2 Number of years worked at SWCD
Median 7.5 - Minimum 0.5 - Maximum 43 -
Formal education Did not finish high school 0 0.0 Completed high school 5 2.7 Some college but no degree 16 8.7 Associate or vocational degree 30 16.4 College bachelor’s degree 100 54.6 Some graduate work 8 4.4 Completed graduate degree (MS or PhD) 24 13.1 Source: Questions 39, 40 and 41; Minnesota Soil and Water Conservation Districts Groundwater Survey
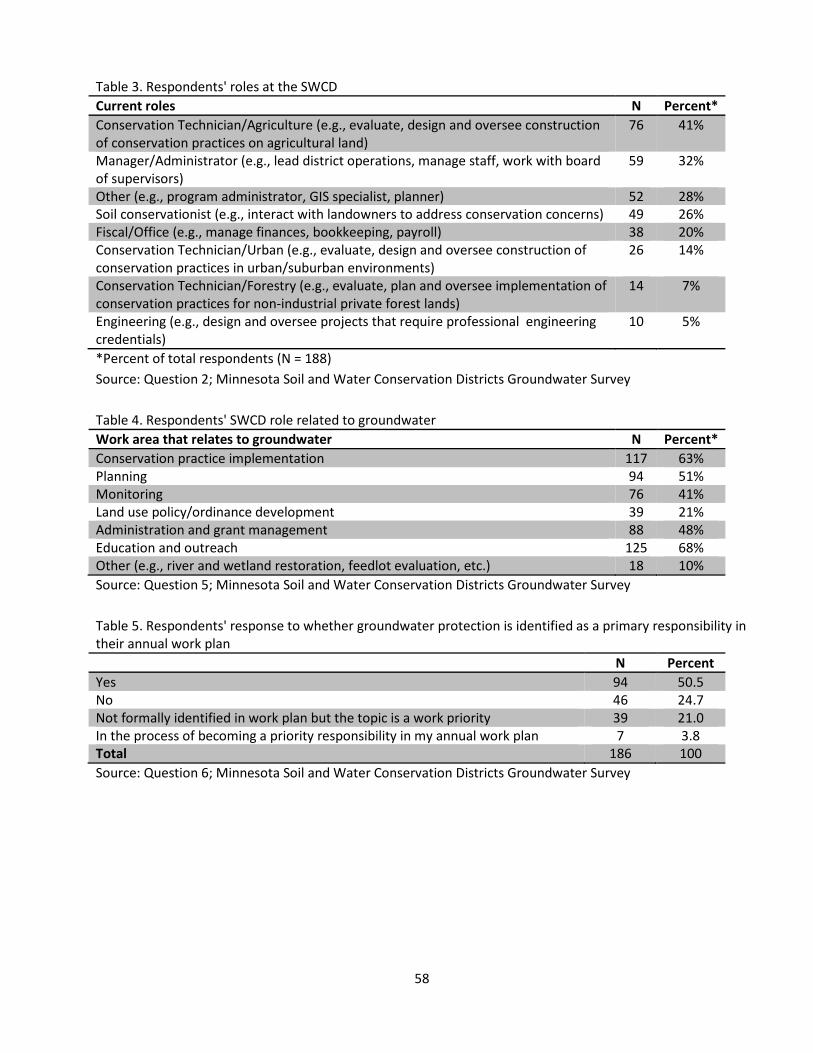
58
Table 3. Respondents' roles at the SWCD Current roles N Percent* Conservation Technician/Agriculture (e.g., evaluate, design and oversee construction of conservation practices on agricultural land)
76 41%
Manager/Administrator (e.g., lead district operations, manage staff, work with board of supervisors)
59 32%
Other (e.g., program administrator, GIS specialist, planner) 52 28% Soil conservationist (e.g., interact with landowners to address conservation concerns) 49 26% Fiscal/Office (e.g., manage finances, bookkeeping, payroll) 38 20% Conservation Technician/Urban (e.g., evaluate, design and oversee construction of conservation practices in urban/suburban environments)
26 14%
Conservation Technician/Forestry (e.g., evaluate, plan and oversee implementation of conservation practices for non-industrial private forest lands)
14 7%
Engineering (e.g., design and oversee projects that require professional engineering credentials)
10 5%
*Percent of total respondents (N = 188) Source: Question 2; Minnesota Soil and Water Conservation Districts Groundwater Survey Table 4. Respondents' SWCD role related to groundwater Work area that relates to groundwater N Percent* Conservation practice implementation 117 63% Planning 94 51% Monitoring 76 41% Land use policy/ordinance development 39 21% Administration and grant management 88 48% Education and outreach 125 68% Other (e.g., river and wetland restoration, feedlot evaluation, etc.) 18 10% Source: Question 5; Minnesota Soil and Water Conservation Districts Groundwater Survey Table 5. Respondents' response to whether groundwater protection is identified as a primary responsibility in their annual work plan N Percent Yes 94 50.5 No 46 24.7 Not formally identified in work plan but the topic is a work priority 39 21.0 In the process of becoming a priority responsibility in my annual work plan 7 3.8 Total 186 100 Source: Question 6; Minnesota Soil and Water Conservation Districts Groundwater Survey
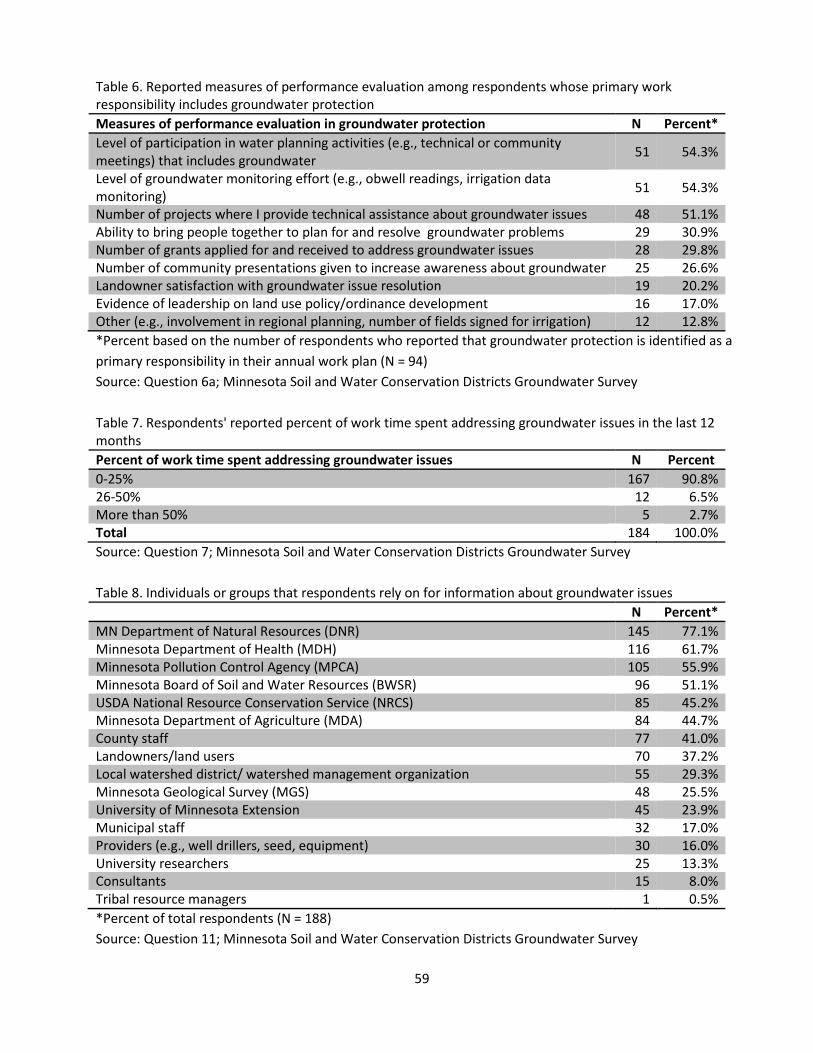
59
Table 6. Reported measures of performance evaluation among respondents whose primary work responsibility includes groundwater protection Measures of performance evaluation in groundwater protection N Percent* Level of participation in water planning activities (e.g., technical or community meetings) that includes groundwater 51 54.3%
Level of groundwater monitoring effort (e.g., obwell readings, irrigation data monitoring) 51 54.3%
Number of projects where I provide technical assistance about groundwater issues 48 51.1% Ability to bring people together to plan for and resolve groundwater problems 29 30.9% Number of grants applied for and received to address groundwater issues 28 29.8% Number of community presentations given to increase awareness about groundwater 25 26.6% Landowner satisfaction with groundwater issue resolution 19 20.2% Evidence of leadership on land use policy/ordinance development 16 17.0% Other (e.g., involvement in regional planning, number of fields signed for irrigation) 12 12.8% *Percent based on the number of respondents who reported that groundwater protection is identified as a primary responsibility in their annual work plan (N = 94) Source: Question 6a; Minnesota Soil and Water Conservation Districts Groundwater Survey Table 7. Respondents' reported percent of work time spent addressing groundwater issues in the last 12 months Percent of work time spent addressing groundwater issues N Percent 0-25% 167 90.8% 26-50% 12 6.5% More than 50% 5 2.7% Total 184 100.0% Source: Question 7; Minnesota Soil and Water Conservation Districts Groundwater Survey Table 8. Individuals or groups that respondents rely on for information about groundwater issues N Percent* MN Department of Natural Resources (DNR) 145 77.1% Minnesota Department of Health (MDH) 116 61.7% Minnesota Pollution Control Agency (MPCA) 105 55.9% Minnesota Board of Soil and Water Resources (BWSR) 96 51.1% USDA National Resource Conservation Service (NRCS) 85 45.2% Minnesota Department of Agriculture (MDA) 84 44.7% County staff 77 41.0% Landowners/land users 70 37.2% Local watershed district/ watershed management organization 55 29.3% Minnesota Geological Survey (MGS) 48 25.5% University of Minnesota Extension 45 23.9% Municipal staff 32 17.0% Providers (e.g., well drillers, seed, equipment) 30 16.0% University researchers 25 13.3% Consultants 15 8.0% Tribal resource managers 1 0.5% *Percent of total respondents (N = 188) Source: Question 11; Minnesota Soil and Water Conservation Districts Groundwater Survey

60
Table 9. Extent to which respondents rely on individuals or groups for information about groundwater
N Meana SD Not
at a
ll
Slig
htly
Mod
erat
ely
A lo
t
MN Department of Natural Resources (DNR) 143 3.08 0.75 0.7% 22.4% 45.5% 31.5%
Minnesota Department of Health (MDH) 116 3.07 0.68 0.9% 17.2% 56.0% 25.9% County staff 76 3.07 0.74 0.0% 23.7% 46.1% 30.3% Minnesota Department of Agriculture (MDA) 84 2.93 0.72 0.0% 29.8% 47.6% 22.6%
Minnesota Pollution Control Agency (MPCA) 104 2.85 0.76 1.0% 34.6% 43.3% 21.2%
Local watershed district/ watershed management organization 55 2.84 0.74 0.0% 36.4% 43.6% 20.0%
Municipal staff 31 2.77 0.76 3.2% 32.3% 48.4% 16.1% Minnesota Board of Soil and Water Resources (BWSR) 96 2.76 0.76 1.0% 40.6% 39.6% 18.8%
University researchers 24 2.75 0.85 4.2% 37.5% 37.5% 20.8% USDA National Resource Conservation Service (NRCS) 85 2.72 0.68 0.0% 41.2% 45.9% 12.9%
Minnesota Geological Survey (MGS) 48 2.71 0.77 2.1% 41.7% 39.6% 16.7% University of Minnesota Extension 45 2.67 0.77 2.2% 44.4% 37.8% 15.6% Landowners/land users 69 2.67 0.76 4.3% 37.7% 44.9% 13.0% Consultants 15 2.47 0.64 6.7% 40.0% 53.3% 0.0% Providers (e.g., well drillers, seed, equipment) 30 2.40 0.72 6.7% 53.3% 33.3% 6.7%
Tribal resource managers 1 4.00 - 0.0% 0.0% 0.0% 1.0% Source: Question 11a; Minnesota Soil and Water Conservation Districts Groundwater Survey; Respondents were asked to respond to this question only for the individuals and groups they selected in question 11 aResponses based on a four-point scale from not at all (1) to a lot (4) Table 10. Client groups respondents interact with on groundwater issues N Percent* Private landowners 152 80.9% Agricultural producers 130 69.1% Local governments (e.g., city, township or county) 119 63.3% State or regional governments 75 39.9% Watershed districts/watershed management organizations 72 38.3% Public water suppliers (e.g., municipal, rural water system, business, school) 54 28.7% Agricultural service providers (fertilizer and pesticide dealers and/or applicators, crop consultants) 41 21.8%
Non-profit/advocacy organizations (e.g., lake associations, wildlife organizations) 40 21.3% Timber/pulp producers 2 1.1% Tribal governments 2 1.1% *Percent of total respondents (N = 188) Source: Question 12; Minnesota Soil and Water Conservation Districts Groundwater Survey
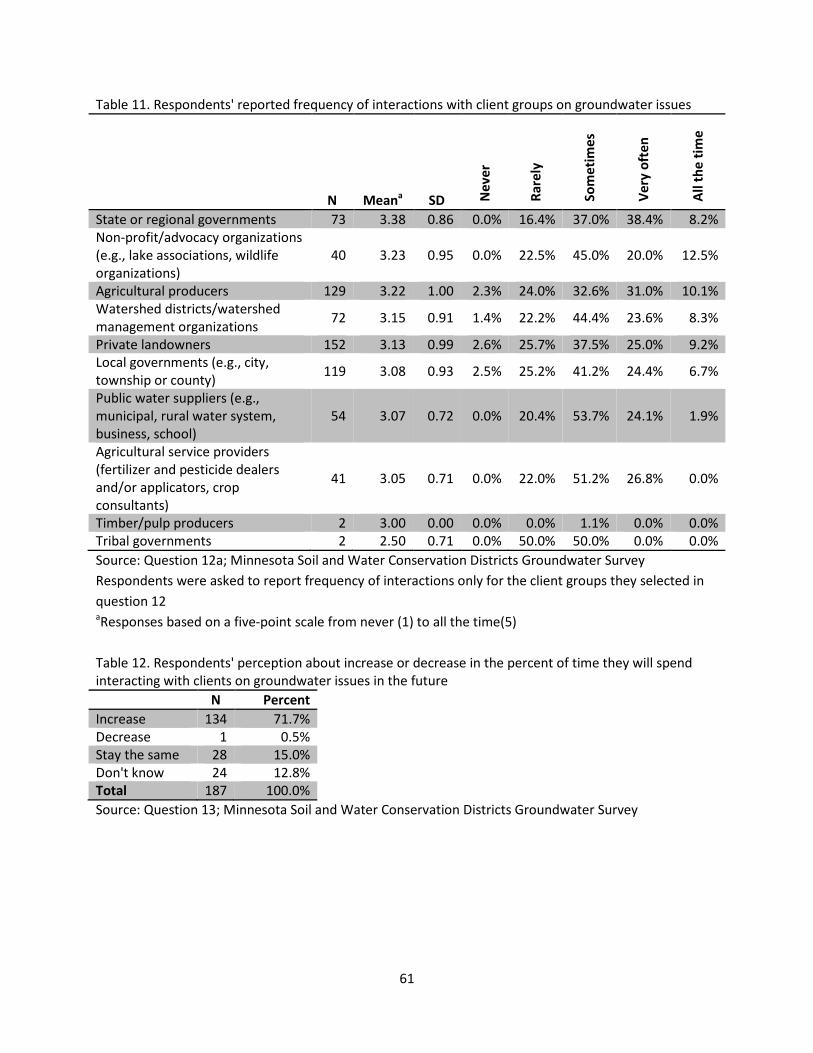
61
Table 11. Respondents' reported frequency of interactions with client groups on groundwater issues
N Meana SD Nev
er
Rare
ly
Som
etim
es
Very
oft
en
All t
he ti
me
State or regional governments 73 3.38 0.86 0.0% 16.4% 37.0% 38.4% 8.2% Non-profit/advocacy organizations (e.g., lake associations, wildlife organizations)
40 3.23 0.95 0.0% 22.5% 45.0% 20.0% 12.5%
Agricultural producers 129 3.22 1.00 2.3% 24.0% 32.6% 31.0% 10.1% Watershed districts/watershed management organizations 72 3.15 0.91 1.4% 22.2% 44.4% 23.6% 8.3%
Private landowners 152 3.13 0.99 2.6% 25.7% 37.5% 25.0% 9.2% Local governments (e.g., city, township or county) 119 3.08 0.93 2.5% 25.2% 41.2% 24.4% 6.7%
Public water suppliers (e.g., municipal, rural water system, business, school)
54 3.07 0.72 0.0% 20.4% 53.7% 24.1% 1.9%
Agricultural service providers (fertilizer and pesticide dealers and/or applicators, crop consultants)
41 3.05 0.71 0.0% 22.0% 51.2% 26.8% 0.0%
Timber/pulp producers 2 3.00 0.00 0.0% 0.0% 1.1% 0.0% 0.0% Tribal governments 2 2.50 0.71 0.0% 50.0% 50.0% 0.0% 0.0% Source: Question 12a; Minnesota Soil and Water Conservation Districts Groundwater Survey Respondents were asked to report frequency of interactions only for the client groups they selected in question 12 aResponses based on a five-point scale from never (1) to all the time(5) Table 12. Respondents' perception about increase or decrease in the percent of time they will spend interacting with clients on groundwater issues in the future N Percent Increase 134 71.7% Decrease 1 0.5% Stay the same 28 15.0% Don't know 24 12.8% Total 187 100.0% Source: Question 13; Minnesota Soil and Water Conservation Districts Groundwater Survey
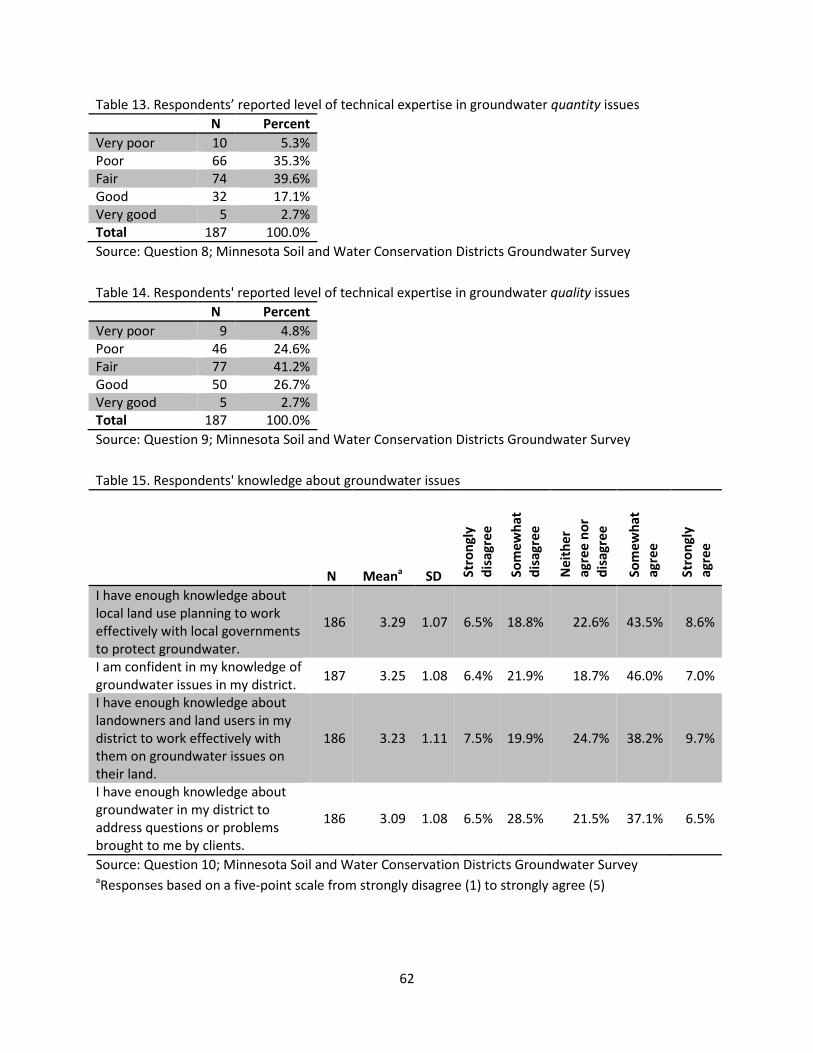
62
Table 13. Respondents’ reported level of technical expertise in groundwater quantity issues N Percent Very poor 10 5.3% Poor 66 35.3% Fair 74 39.6% Good 32 17.1% Very good 5 2.7% Total 187 100.0% Source: Question 8; Minnesota Soil and Water Conservation Districts Groundwater Survey Table 14. Respondents' reported level of technical expertise in groundwater quality issues N Percent Very poor 9 4.8% Poor 46 24.6% Fair 77 41.2% Good 50 26.7% Very good 5 2.7% Total 187 100.0% Source: Question 9; Minnesota Soil and Water Conservation Districts Groundwater Survey Table 15. Respondents' knowledge about groundwater issues
N Meana SD Stro
ngly
di
sagr
ee
Som
ewha
t di
sagr
ee
Nei
ther
ag
ree
nor
disa
gree
Som
ewha
t ag
ree
Stro
ngly
ag
ree
I have enough knowledge about local land use planning to work effectively with local governments to protect groundwater.
186 3.29 1.07 6.5% 18.8% 22.6% 43.5% 8.6%
I am confident in my knowledge of groundwater issues in my district. 187 3.25 1.08 6.4% 21.9% 18.7% 46.0% 7.0%
I have enough knowledge about landowners and land users in my district to work effectively with them on groundwater issues on their land.
186 3.23 1.11 7.5% 19.9% 24.7% 38.2% 9.7%
I have enough knowledge about groundwater in my district to address questions or problems brought to me by clients.
186 3.09 1.08 6.5% 28.5% 21.5% 37.1% 6.5%
Source: Question 10; Minnesota Soil and Water Conservation Districts Groundwater Survey aResponses based on a five-point scale from strongly disagree (1) to strongly agree (5)
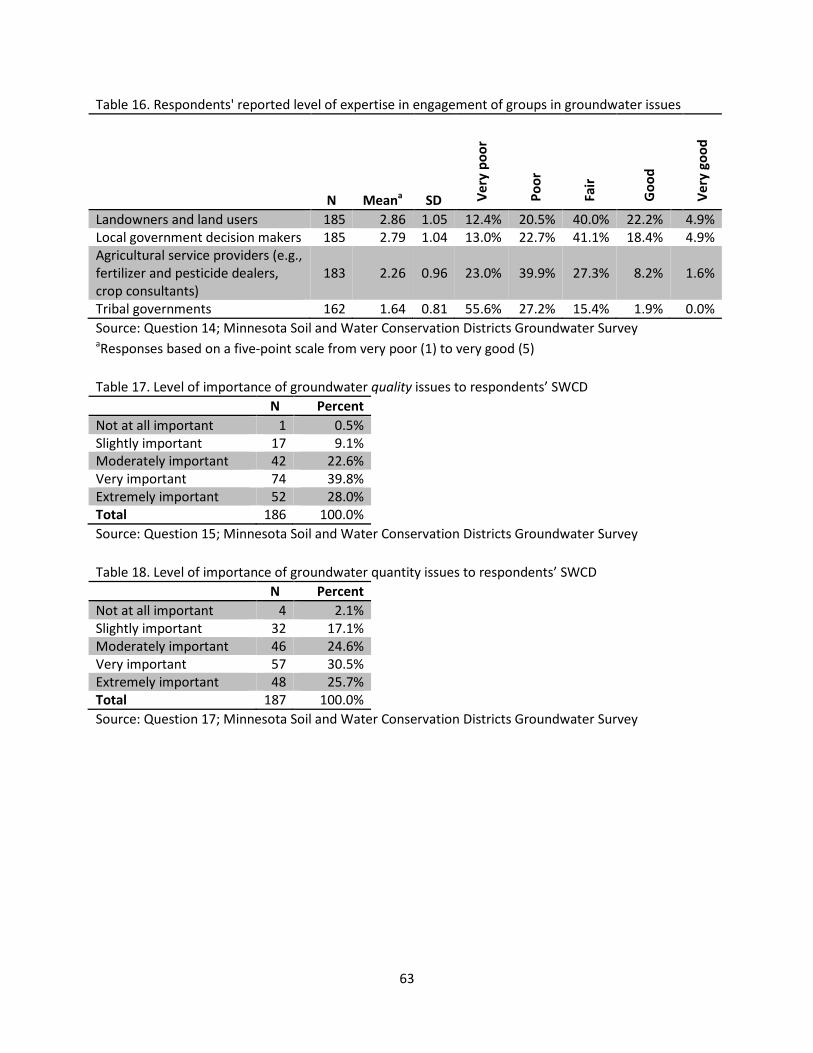
63
Table 16. Respondents' reported level of expertise in engagement of groups in groundwater issues
N Meana SD Very
poo
r
Poor
Fair
Goo
d
Very
goo
d
Landowners and land users 185 2.86 1.05 12.4% 20.5% 40.0% 22.2% 4.9% Local government decision makers 185 2.79 1.04 13.0% 22.7% 41.1% 18.4% 4.9% Agricultural service providers (e.g., fertilizer and pesticide dealers, crop consultants)
183 2.26 0.96 23.0% 39.9% 27.3% 8.2% 1.6%
Tribal governments 162 1.64 0.81 55.6% 27.2% 15.4% 1.9% 0.0% Source: Question 14; Minnesota Soil and Water Conservation Districts Groundwater Survey aResponses based on a five-point scale from very poor (1) to very good (5) Table 17. Level of importance of groundwater quality issues to respondents’ SWCD N Percent Not at all important 1 0.5% Slightly important 17 9.1% Moderately important 42 22.6% Very important 74 39.8% Extremely important 52 28.0% Total 186 100.0% Source: Question 15; Minnesota Soil and Water Conservation Districts Groundwater Survey Table 18. Level of importance of groundwater quantity issues to respondents’ SWCD N Percent Not at all important 4 2.1% Slightly important 32 17.1% Moderately important 46 24.6% Very important 57 30.5% Extremely important 48 25.7% Total 187 100.0% Source: Question 17; Minnesota Soil and Water Conservation Districts Groundwater Survey
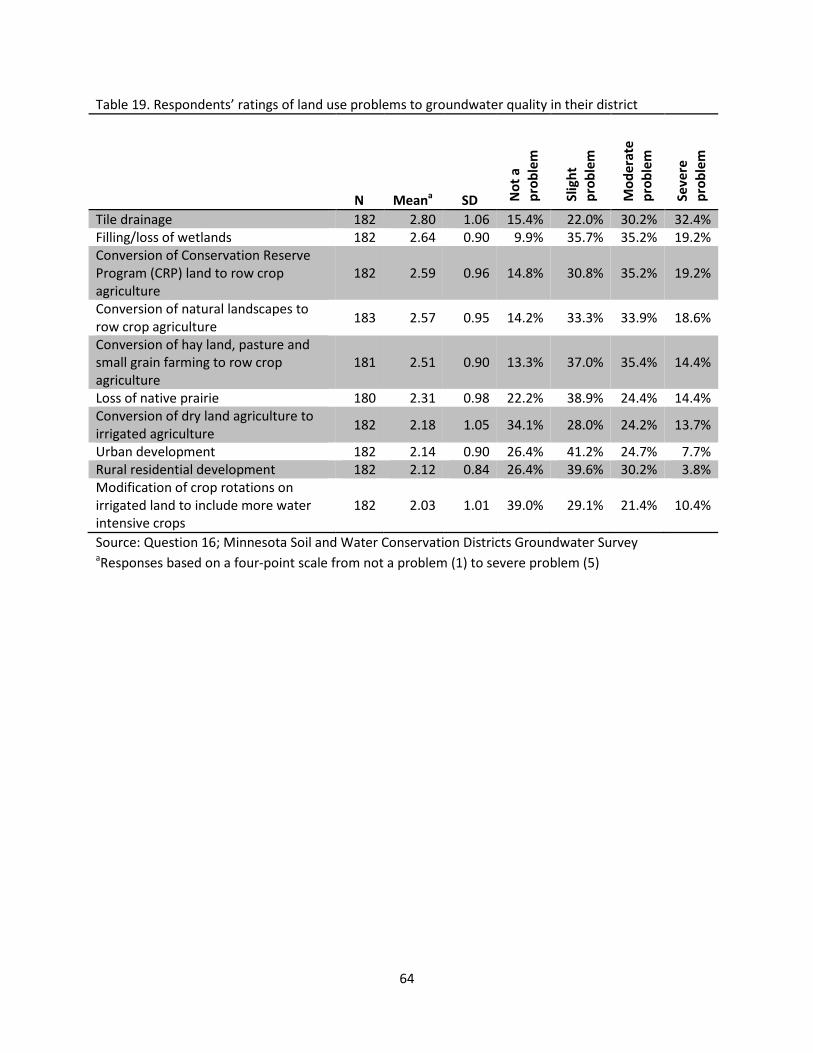
64
Table 19. Respondents’ ratings of land use problems to groundwater quality in their district
N Meana SD Not
a
prob
lem
Slig
ht
prob
lem
Mod
erat
e pr
oble
m
Seve
re
prob
lem
Tile drainage 182 2.80 1.06 15.4% 22.0% 30.2% 32.4% Filling/loss of wetlands 182 2.64 0.90 9.9% 35.7% 35.2% 19.2% Conversion of Conservation Reserve Program (CRP) land to row crop agriculture
182 2.59 0.96 14.8% 30.8% 35.2% 19.2%
Conversion of natural landscapes to row crop agriculture 183 2.57 0.95 14.2% 33.3% 33.9% 18.6%
Conversion of hay land, pasture and small grain farming to row crop agriculture
181 2.51 0.90 13.3% 37.0% 35.4% 14.4%
Loss of native prairie 180 2.31 0.98 22.2% 38.9% 24.4% 14.4% Conversion of dry land agriculture to irrigated agriculture 182 2.18 1.05 34.1% 28.0% 24.2% 13.7%
Urban development 182 2.14 0.90 26.4% 41.2% 24.7% 7.7% Rural residential development 182 2.12 0.84 26.4% 39.6% 30.2% 3.8% Modification of crop rotations on irrigated land to include more water intensive crops
182 2.03 1.01 39.0% 29.1% 21.4% 10.4%
Source: Question 16; Minnesota Soil and Water Conservation Districts Groundwater Survey aResponses based on a four-point scale from not a problem (1) to severe problem (5)
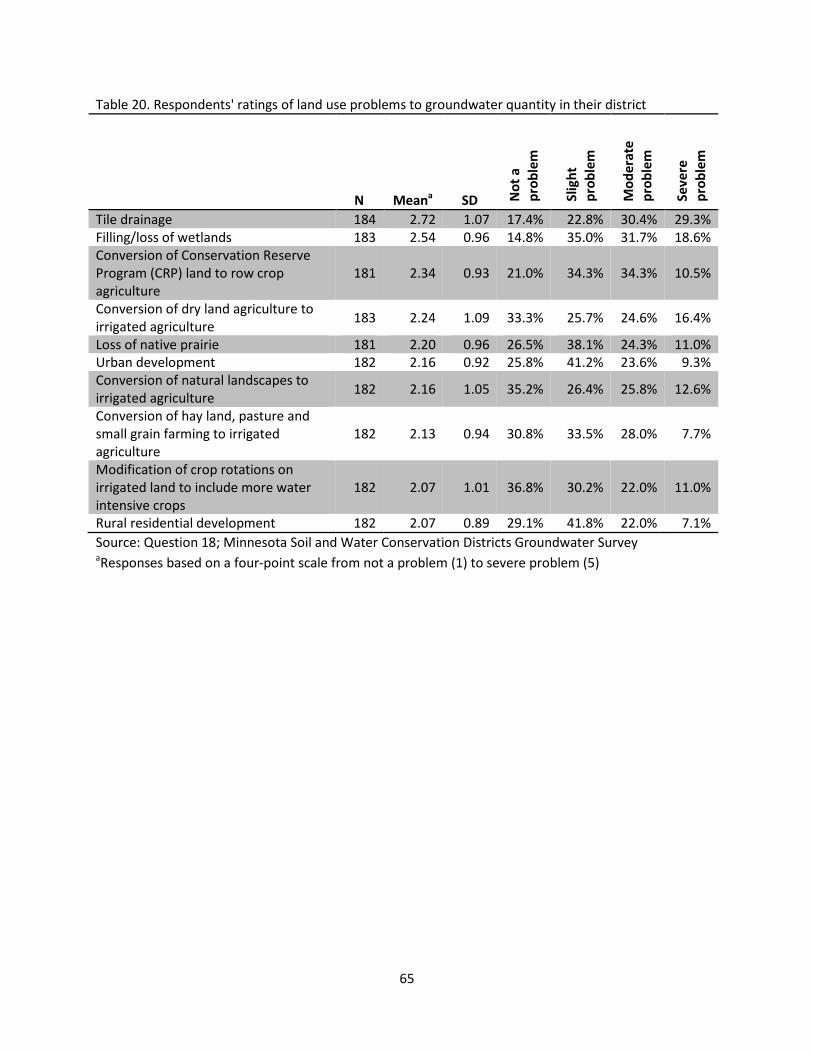
65
Table 20. Respondents' ratings of land use problems to groundwater quantity in their district
N Meana SD Not
a
prob
lem
Slig
ht
prob
lem
Mod
erat
e pr
oble
m
Seve
re
prob
lem
Tile drainage 184 2.72 1.07 17.4% 22.8% 30.4% 29.3% Filling/loss of wetlands 183 2.54 0.96 14.8% 35.0% 31.7% 18.6% Conversion of Conservation Reserve Program (CRP) land to row crop agriculture
181 2.34 0.93 21.0% 34.3% 34.3% 10.5%
Conversion of dry land agriculture to irrigated agriculture 183 2.24 1.09 33.3% 25.7% 24.6% 16.4%
Loss of native prairie 181 2.20 0.96 26.5% 38.1% 24.3% 11.0% Urban development 182 2.16 0.92 25.8% 41.2% 23.6% 9.3% Conversion of natural landscapes to irrigated agriculture 182 2.16 1.05 35.2% 26.4% 25.8% 12.6%
Conversion of hay land, pasture and small grain farming to irrigated agriculture
182 2.13 0.94 30.8% 33.5% 28.0% 7.7%
Modification of crop rotations on irrigated land to include more water intensive crops
182 2.07 1.01 36.8% 30.2% 22.0% 11.0%
Rural residential development 182 2.07 0.89 29.1% 41.8% 22.0% 7.1% Source: Question 18; Minnesota Soil and Water Conservation Districts Groundwater Survey aResponses based on a four-point scale from not a problem (1) to severe problem (5)
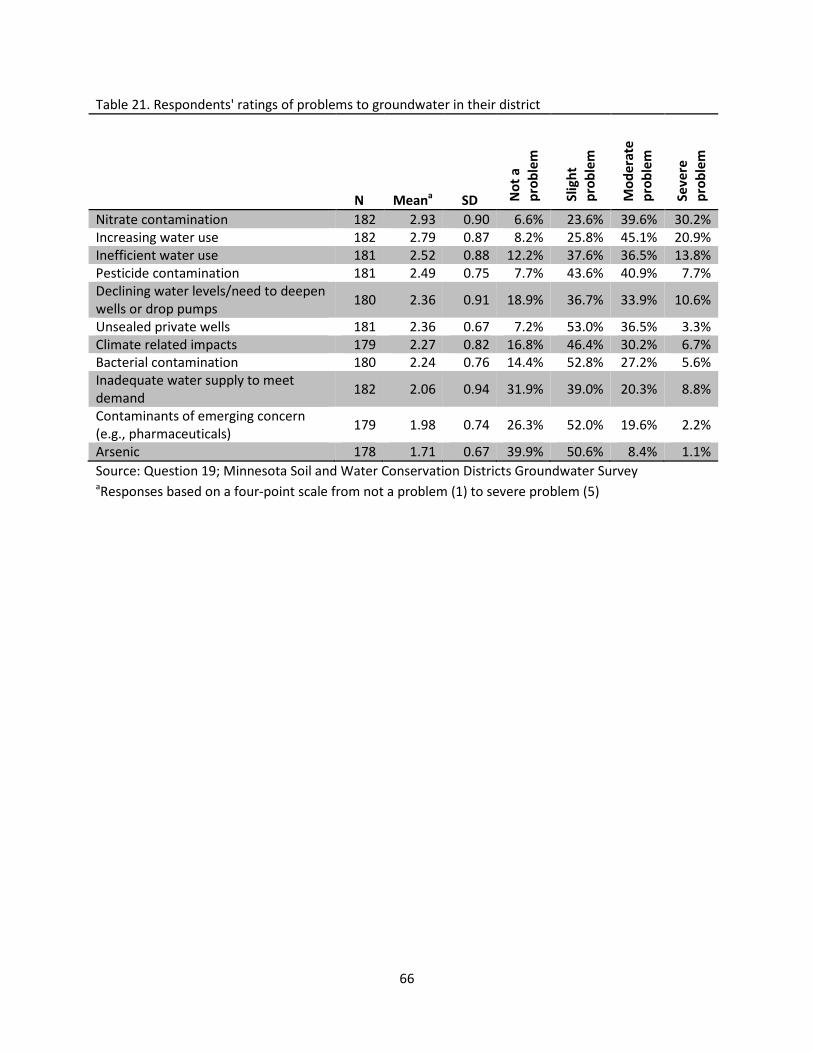
66
Table 21. Respondents' ratings of problems to groundwater in their district
N Meana SD Not
a
prob
lem
Slig
ht
prob
lem
Mod
erat
e pr
oble
m
Seve
re
prob
lem
Nitrate contamination 182 2.93 0.90 6.6% 23.6% 39.6% 30.2% Increasing water use 182 2.79 0.87 8.2% 25.8% 45.1% 20.9% Inefficient water use 181 2.52 0.88 12.2% 37.6% 36.5% 13.8% Pesticide contamination 181 2.49 0.75 7.7% 43.6% 40.9% 7.7% Declining water levels/need to deepen wells or drop pumps 180 2.36 0.91 18.9% 36.7% 33.9% 10.6%
Unsealed private wells 181 2.36 0.67 7.2% 53.0% 36.5% 3.3% Climate related impacts 179 2.27 0.82 16.8% 46.4% 30.2% 6.7% Bacterial contamination 180 2.24 0.76 14.4% 52.8% 27.2% 5.6% Inadequate water supply to meet demand 182 2.06 0.94 31.9% 39.0% 20.3% 8.8%
Contaminants of emerging concern (e.g., pharmaceuticals) 179 1.98 0.74 26.3% 52.0% 19.6% 2.2%
Arsenic 178 1.71 0.67 39.9% 50.6% 8.4% 1.1% Source: Question 19; Minnesota Soil and Water Conservation Districts Groundwater Survey aResponses based on a four-point scale from not a problem (1) to severe problem (5)
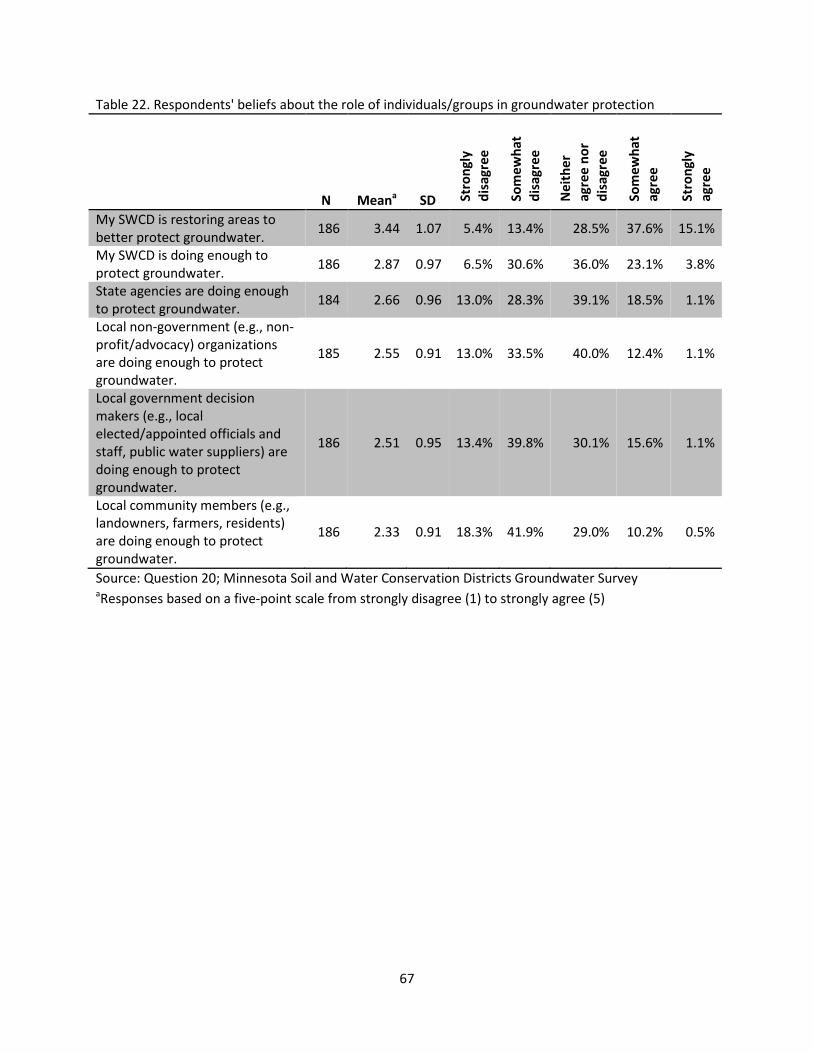
67
Table 22. Respondents' beliefs about the role of individuals/groups in groundwater protection
N Meana SD Stro
ngly
di
sagr
ee
Som
ewha
t di
sagr
ee
Nei
ther
ag
ree
nor
disa
gree
Som
ewha
t ag
ree
Stro
ngly
ag
ree
My SWCD is restoring areas to better protect groundwater. 186 3.44 1.07 5.4% 13.4% 28.5% 37.6% 15.1%
My SWCD is doing enough to protect groundwater. 186 2.87 0.97 6.5% 30.6% 36.0% 23.1% 3.8%
State agencies are doing enough to protect groundwater. 184 2.66 0.96 13.0% 28.3% 39.1% 18.5% 1.1%
Local non-government (e.g., non-profit/advocacy) organizations are doing enough to protect groundwater.
185 2.55 0.91 13.0% 33.5% 40.0% 12.4% 1.1%
Local government decision makers (e.g., local elected/appointed officials and staff, public water suppliers) are doing enough to protect groundwater.
186 2.51 0.95 13.4% 39.8% 30.1% 15.6% 1.1%
Local community members (e.g., landowners, farmers, residents) are doing enough to protect groundwater.
186 2.33 0.91 18.3% 41.9% 29.0% 10.2% 0.5%
Source: Question 20; Minnesota Soil and Water Conservation Districts Groundwater Survey aResponses based on a five-point scale from strongly disagree (1) to strongly agree (5)

68
Table 23. Respondents' reported constraints to groundwater protection
N Meana SD Not
a
cons
trai
nt
Slig
ht
cons
trai
nt
Mod
erat
e co
nstr
aint
Seve
re
cons
trai
nt
Financial resources 184 3.18 0.80 3.3% 14.7% 42.9% 39.4% Lack of staff devoted to groundwater protection 184 3.01 0.89 7.1% 17.9% 42.4% 32.6%
Lack of training to integrate groundwater management into local plans
184 2.77 0.90 7.1% 33.2% 35.9% 23.9%
Technical capacity 183 2.73 0.80 5.5% 32.8% 45.4% 16.4% Appropriate grant opportunities 183 2.67 0.82 6.0% 37.7% 39.9% 16.4% Other local issues taking priority over groundwater protection 184 2.64 0.85 9.8% 31.0% 44.6% 14.7%
Lack of data/information on groundwater problems 182 2.63 0.94 10.4% 37.9% 29.7% 22.0%
Client/partner buy-in 182 2.56 0.94 13.7% 34.6% 33.5% 18.1% Lack of support for engaging landowners/land users in groundwater protection
184 2.48 0.87 12.0% 40.8% 34.2% 13.0%
Lack of sufficient technical assistance from the state 183 2.45 0.84 12.0% 41.0% 36.6% 10.4%
Lack of technical expertise in crop input management 183 2.43 0.91 16.4% 36.6% 34.4% 12.6%
Lack of information about the effectiveness of conservation practices 183 2.39 0.89 15.3% 42.1% 30.6% 12.0%
Lack of supervisory/managerial support 181 1.86 0.93 44.8% 30.9% 18.2% 6.1%
Source: Question 21; Minnesota Soil and Water Conservation Districts Groundwater Survey aResponses based on a four-point scale from not a constraint (1) to severe constraint (5)
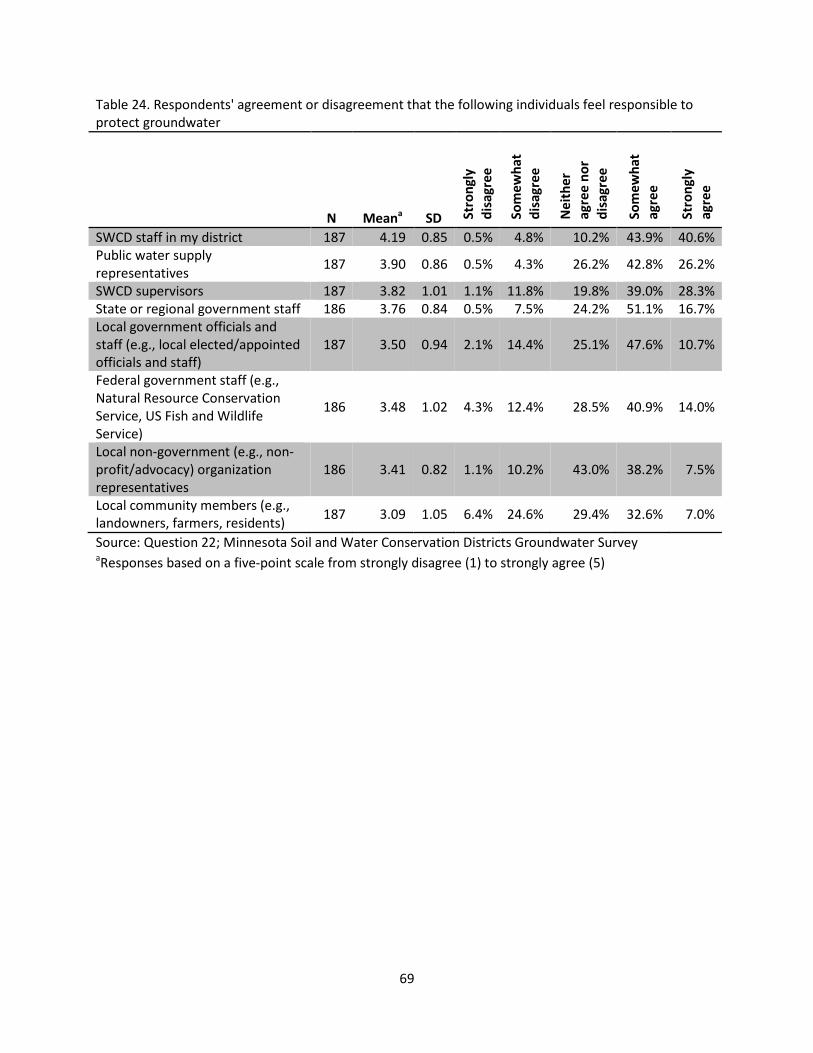
69
Table 24. Respondents' agreement or disagreement that the following individuals feel responsible to protect groundwater
N Meana SD Stro
ngly
di
sagr
ee
Som
ewha
t di
sagr
ee
Nei
ther
ag
ree
nor
disa
gree
Som
ewha
t ag
ree
Stro
ngly
ag
ree
SWCD staff in my district 187 4.19 0.85 0.5% 4.8% 10.2% 43.9% 40.6% Public water supply representatives 187 3.90 0.86 0.5% 4.3% 26.2% 42.8% 26.2%
SWCD supervisors 187 3.82 1.01 1.1% 11.8% 19.8% 39.0% 28.3% State or regional government staff 186 3.76 0.84 0.5% 7.5% 24.2% 51.1% 16.7% Local government officials and staff (e.g., local elected/appointed officials and staff)
187 3.50 0.94 2.1% 14.4% 25.1% 47.6% 10.7%
Federal government staff (e.g., Natural Resource Conservation Service, US Fish and Wildlife Service)
186 3.48 1.02 4.3% 12.4% 28.5% 40.9% 14.0%
Local non-government (e.g., non-profit/advocacy) organization representatives
186 3.41 0.82 1.1% 10.2% 43.0% 38.2% 7.5%
Local community members (e.g., landowners, farmers, residents) 187 3.09 1.05 6.4% 24.6% 29.4% 32.6% 7.0%
Source: Question 22; Minnesota Soil and Water Conservation Districts Groundwater Survey aResponses based on a five-point scale from strongly disagree (1) to strongly agree (5)

70
Table 25. Respondents' agreement or disagreement that the following individuals have the resources needed to protect groundwater
N Meana SD Stro
ngly
di
sagr
ee
Som
ewha
t di
sagr
ee
Nei
ther
ag
ree
nor
disa
gree
Som
ewha
t ag
ree
Stro
ngly
ag
ree
State or regional government staff 184 3.41 0.98 3.3% 14.7% 30.4% 40.8% 10.9%
Federal government staff (e.g., Natural Resource Conservation Service, US Fish and Wildlife Service)
186 3.30 0.97 3.8% 16.1% 35.5% 35.5% 9.1%
Public water suppliers 186 3.27 0.89 1.6% 19.4% 34.4% 39.2% 5.4% Local non-government (e.g., non-profit/advocacy) organization representatives
186 2.83 0.78 3.8% 28.0% 50.5% 16.7% 1.1%
Local government officials and staff (e.g., local elected/appointed officials and staff)
186 2.72 1.02 8.6% 40.3% 26.3% 20.4% 4.3%
Local community members (e.g., landowners, farmers, residents) 185 2.70 1.01 10.8% 34.1% 34.1% 16.8% 4.3%
SWCD staff in my district 186 2.62 1.09 12.9% 43.0% 16.7% 24.2% 3.2% SWCD supervisors 187 2.53 1.08 16.0% 41.2% 19.8% 19.8% 3.2% Source: Question 23; Minnesota Soil and Water Conservation Districts Groundwater Survey aResponses based on a five-point scale from strongly disagree (1) to strongly agree (5)
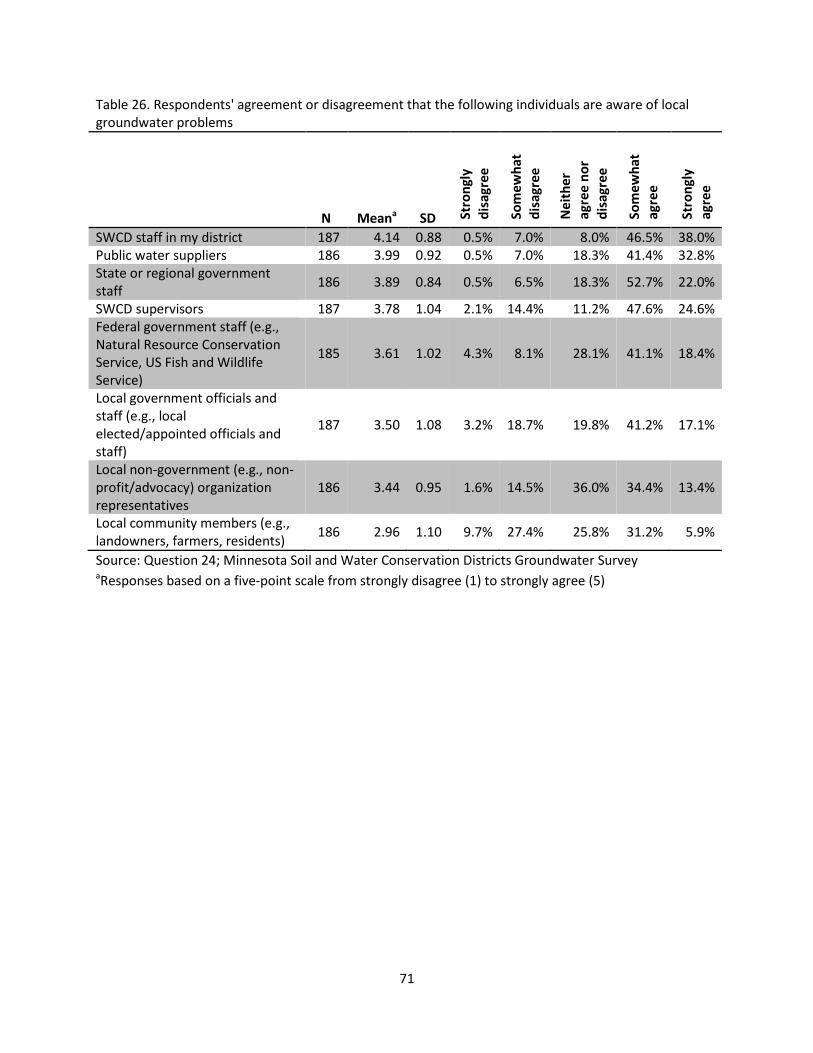
71
Table 26. Respondents' agreement or disagreement that the following individuals are aware of local groundwater problems
N Meana SD Stro
ngly
di
sagr
ee
Som
ewha
t di
sagr
ee
Nei
ther
ag
ree
nor
disa
gree
Som
ewha
t ag
ree
Stro
ngly
ag
ree
SWCD staff in my district 187 4.14 0.88 0.5% 7.0% 8.0% 46.5% 38.0% Public water suppliers 186 3.99 0.92 0.5% 7.0% 18.3% 41.4% 32.8% State or regional government staff 186 3.89 0.84 0.5% 6.5% 18.3% 52.7% 22.0%
SWCD supervisors 187 3.78 1.04 2.1% 14.4% 11.2% 47.6% 24.6% Federal government staff (e.g., Natural Resource Conservation Service, US Fish and Wildlife Service)
185 3.61 1.02 4.3% 8.1% 28.1% 41.1% 18.4%
Local government officials and staff (e.g., local elected/appointed officials and staff)
187 3.50 1.08 3.2% 18.7% 19.8% 41.2% 17.1%
Local non-government (e.g., non-profit/advocacy) organization representatives
186 3.44 0.95 1.6% 14.5% 36.0% 34.4% 13.4%
Local community members (e.g., landowners, farmers, residents) 186 2.96 1.10 9.7% 27.4% 25.8% 31.2% 5.9%
Source: Question 24; Minnesota Soil and Water Conservation Districts Groundwater Survey aResponses based on a five-point scale from strongly disagree (1) to strongly agree (5)
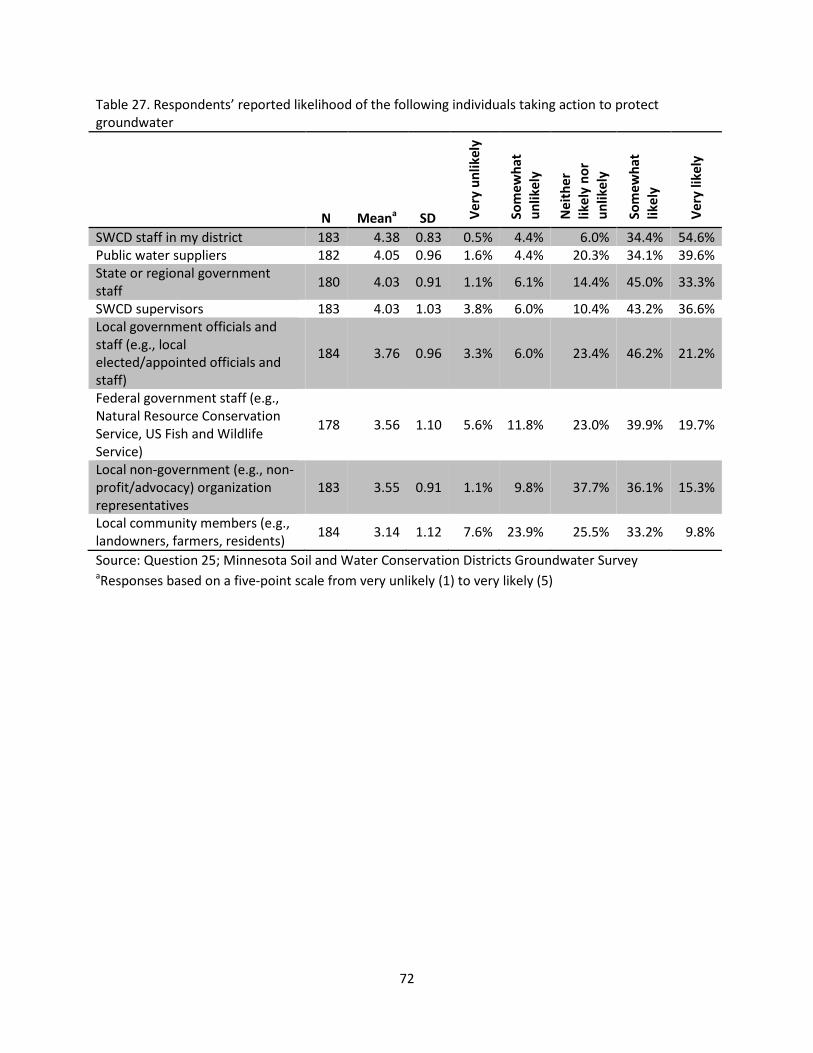
72
Table 27. Respondents’ reported likelihood of the following individuals taking action to protect groundwater
N Meana SD Very
unl
ikel
y
Som
ewha
t un
likel
y
Nei
ther
lik
ely
nor
unlik
ely
Som
ewha
t lik
ely
Very
like
ly
SWCD staff in my district 183 4.38 0.83 0.5% 4.4% 6.0% 34.4% 54.6% Public water suppliers 182 4.05 0.96 1.6% 4.4% 20.3% 34.1% 39.6% State or regional government staff 180 4.03 0.91 1.1% 6.1% 14.4% 45.0% 33.3%
SWCD supervisors 183 4.03 1.03 3.8% 6.0% 10.4% 43.2% 36.6% Local government officials and staff (e.g., local elected/appointed officials and staff)
184 3.76 0.96 3.3% 6.0% 23.4% 46.2% 21.2%
Federal government staff (e.g., Natural Resource Conservation Service, US Fish and Wildlife Service)
178 3.56 1.10 5.6% 11.8% 23.0% 39.9% 19.7%
Local non-government (e.g., non-profit/advocacy) organization representatives
183 3.55 0.91 1.1% 9.8% 37.7% 36.1% 15.3%
Local community members (e.g., landowners, farmers, residents) 184 3.14 1.12 7.6% 23.9% 25.5% 33.2% 9.8%
Source: Question 25; Minnesota Soil and Water Conservation Districts Groundwater Survey aResponses based on a five-point scale from very unlikely (1) to very likely (5)

73
Table 28. Respondents' agreement or disagreement that the following individuals communicate effectively with community members to protect groundwater
N Meana SD Stro
ngly
di
sagr
ee
Som
ewha
t di
sagr
ee
Nei
ther
ag
ree
nor
disa
gree
Som
ewha
t ag
ree
Stro
ngly
ag
ree
SWCD staff in my district 187 3.70 0.99 1.1% 14.4% 18.7% 45.5% 20.3% State or regional government staff 184 3.27 0.94 2.2% 20.1% 33.2% 37.5% 7.1%
Public water suppliers 184 3.20 0.91 2.7% 18.5% 41.3% 31.0% 6.5% SWCD supervisors 187 3.16 1.00 3.2% 25.7% 31.0% 32.1% 8.0% Local government officials and staff (e.g., local elected/appointed officials and staff)
185 3.05 0.99 4.9% 26.5% 32.4% 31.4% 4.9%
Federal government staff (e.g., Natural Resource Conservation Service, US Fish and Wildlife Service)
184 3.04 1.06 9.2% 20.1% 33.7% 31.0% 6.0%
Local non-government (e.g., non-profit/advocacy) organization representatives
183 3.01 0.86 3.8% 20.8% 50.8% 20.2% 4.4%
Local community members (e.g., landowners, farmers, residents) 184 2.60 0.91 12.0% 32.1% 40.8% 14.1% 1.1%
Source: Question 26; Minnesota Soil and Water Conservation Districts Groundwater Survey aResponses based on a five-point scale from strongly disagree (1) to strongly agree (5)
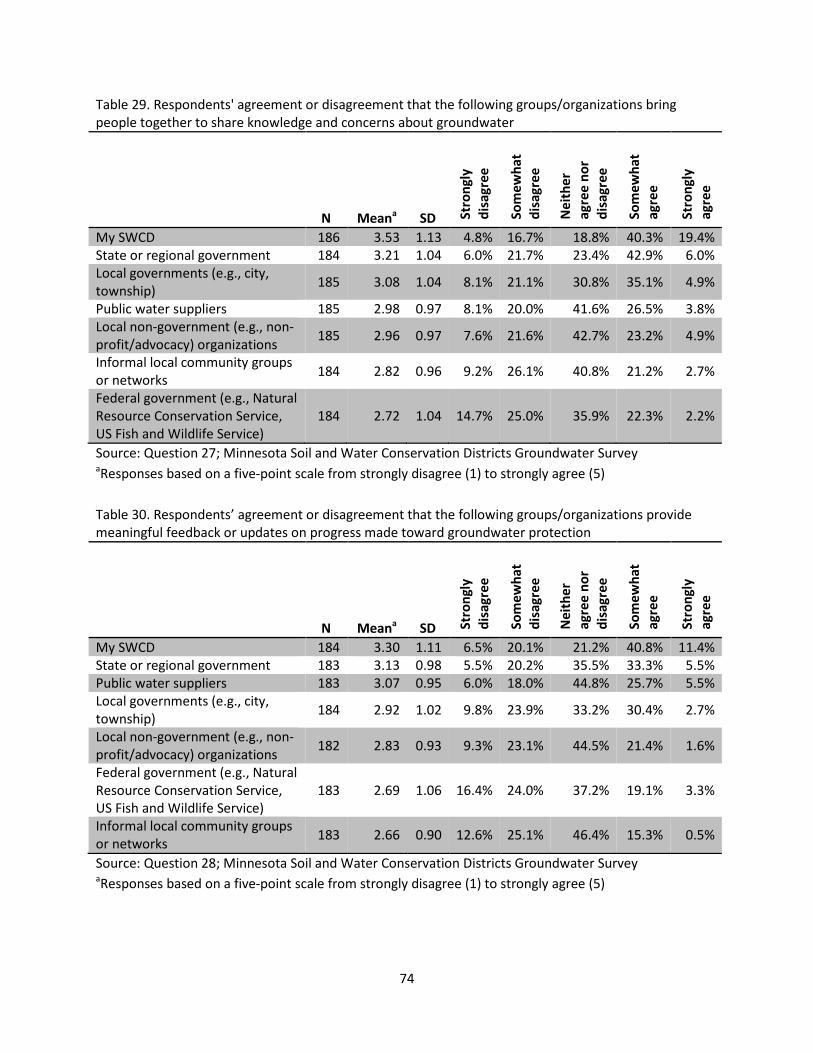
74
Table 29. Respondents' agreement or disagreement that the following groups/organizations bring people together to share knowledge and concerns about groundwater
N Meana SD Stro
ngly
di
sagr
ee
Som
ewha
t di
sagr
ee
Nei
ther
ag
ree
nor
disa
gree
Som
ewha
t ag
ree
Stro
ngly
ag
ree
My SWCD 186 3.53 1.13 4.8% 16.7% 18.8% 40.3% 19.4% State or regional government 184 3.21 1.04 6.0% 21.7% 23.4% 42.9% 6.0% Local governments (e.g., city, township) 185 3.08 1.04 8.1% 21.1% 30.8% 35.1% 4.9%
Public water suppliers 185 2.98 0.97 8.1% 20.0% 41.6% 26.5% 3.8% Local non-government (e.g., non-profit/advocacy) organizations 185 2.96 0.97 7.6% 21.6% 42.7% 23.2% 4.9%
Informal local community groups or networks 184 2.82 0.96 9.2% 26.1% 40.8% 21.2% 2.7%
Federal government (e.g., Natural Resource Conservation Service, US Fish and Wildlife Service)
184 2.72 1.04 14.7% 25.0% 35.9% 22.3% 2.2%
Source: Question 27; Minnesota Soil and Water Conservation Districts Groundwater Survey aResponses based on a five-point scale from strongly disagree (1) to strongly agree (5) Table 30. Respondents’ agreement or disagreement that the following groups/organizations provide meaningful feedback or updates on progress made toward groundwater protection
N Meana SD Stro
ngly
di
sagr
ee
Som
ewha
t di
sagr
ee
Nei
ther
ag
ree
nor
disa
gree
Som
ewha
t ag
ree
Stro
ngly
ag
ree
My SWCD 184 3.30 1.11 6.5% 20.1% 21.2% 40.8% 11.4% State or regional government 183 3.13 0.98 5.5% 20.2% 35.5% 33.3% 5.5% Public water suppliers 183 3.07 0.95 6.0% 18.0% 44.8% 25.7% 5.5% Local governments (e.g., city, township) 184 2.92 1.02 9.8% 23.9% 33.2% 30.4% 2.7%
Local non-government (e.g., non-profit/advocacy) organizations 182 2.83 0.93 9.3% 23.1% 44.5% 21.4% 1.6%
Federal government (e.g., Natural Resource Conservation Service, US Fish and Wildlife Service)
183 2.69 1.06 16.4% 24.0% 37.2% 19.1% 3.3%
Informal local community groups or networks 183 2.66 0.90 12.6% 25.1% 46.4% 15.3% 0.5%
Source: Question 28; Minnesota Soil and Water Conservation Districts Groundwater Survey aResponses based on a five-point scale from strongly disagree (1) to strongly agree (5)

75
Table 31. Respondents' agreement or disagreement that the following groups/organizations promote groundwater protection as a cultural norm, or an expected behavior
N Meana SD Stro
ngly
di
sagr
ee
Som
ewha
t di
sagr
ee
Nei
ther
ag
ree
nor
disa
gree
Som
ewha
t ag
ree
Stro
ngly
ag
ree
My SWCD 183 3.64 1.05 2.7% 15.8% 15.8% 45.9% 19.7% State or regional government 181 3.36 0.99 5.5% 12.2% 32.0% 41.4% 8.8% Public water suppliers 182 3.31 0.97 4.9% 12.6% 37.4% 36.8% 8.2% Federal government (e.g., Natural Resource Conservation Service, US Fish and Wildlife Service)
182 3.08 1.08 11.0% 14.8% 35.7% 31.9% 6.6%
Local non-government (e.g., non-profit/advocacy) organizations 182 3.07 1.01 7.1% 19.2% 40.7% 25.8% 7.1%
Local governments (e.g., city, township) 182 3.06 0.96 6.0% 20.9% 37.9% 31.3% 3.8%
Informal local community groups or networks 182 2.87 0.91 7.7% 23.1% 46.7% 19.8% 2.7%
Source: Question 29; Minnesota Soil and Water Conservation Districts Groundwater Survey aResponses based on a five-point scale from strongly disagree (1) to strongly agree (5) Table 32. Respondents' agreement or disagreement that the following organizations have developed strategic, long term plans that protect groundwater
N Meana SD Stro
ngly
di
sagr
ee
Som
ewha
t di
sagr
ee
Nei
ther
ag
ree
nor
disa
gree
Som
ewha
t ag
ree
Stro
ngly
ag
ree
State or regional government 184 3.47 1.00 6.0% 9.8% 25.5% 48.9% 9.8% Public water suppliers 184 3.39 0.98 6.0% 7.6% 38.0% 38.0% 10.3% My SWCD 185 3.37 1.19 8.1% 17.3% 21.1% 36.8% 16.8% Local governments (e.g., city, township) 185 3.19 1.10 9.2% 16.8% 27.6% 38.4% 8.1%
Federal government (e.g., Natural Resource Conservation Service, US Fish and Wildlife Service)
183 2.98 1.09 13.1% 15.3% 36.6% 30.1% 4.9%
Local non-government (e.g., non-profit/advocacy) organizations 184 2.74 0.90 12.0% 20.7% 49.5% 17.4% 0.5%
Source: Question 30; Minnesota Soil and Water Conservation Districts Groundwater Survey aResponses based on a five-point scale from strongly disagree (1) to strongly agree (5)

76
Table 33. Respondents' agreement or disagreement that the following organizations have the capacity to adapt to changing environmental conditions to protect groundwater
N Meana SD Stro
ngly
di
sagr
ee
Som
ewha
t di
sagr
ee
Nei
ther
ag
ree
nor
disa
gree
Som
ewha
t ag
ree
Stro
ngly
ag
ree
My SWCD 183 3.68 1.05 3.8% 12.0% 16.9% 46.4% 20.8% State or regional government 182 3.64 0.98 4.4% 7.7% 23.4% 46.5% 15.4% Public water suppliers 183 3.51 0.96 4.4% 9.3% 27.9% 47.5% 10.9% Local governments (e.g., city, township) 184 3.36 1.09 7.6% 14.1% 23.4% 44.0% 10.9%
Federal government (e.g., Natural Resource Conservation Service, US Fish and Wildlife Service)
184 3.34 1.03 4.9% 15.8% 31.5% 36.4% 11.4%
Local non-government (e.g., non-profit/advocacy) organizations 184 3.17 0.96 6.5% 13.0% 42.9% 31.5% 6.0%
Source: Question 31; Minnesota Soil and Water Conservation Districts Groundwater Survey aResponses based on a five-point scale from strongly disagree (1) to strongly agree (5) Table 34. Respondents' beliefs about local planning processes
N Meana SD Stro
ngly
di
sagr
ee
Som
ewha
t di
sagr
ee
Nei
ther
ag
ree
nor
disa
gree
Som
ewha
t ag
ree
Stro
ngly
ag
ree
Local planning processes are coordinated across local governments and organizations for groundwater protection.
185 3.36 1.04 4.3% 20.5% 19.5% 46.5% 9.2%
Local planning processes effectively engage a range of diverse stakeholders in groundwater protection.
185 3.26 1.13 7.0% 22.2% 19.5% 40.5% 10.8%
Local plans reflect a widely shared vision for groundwater protection.
184 3.17 1.04 7.1% 17.9% 34.2% 32.6% 8.2%
A cross-jurisdictional/cross-sector group exists to share data about groundwater issues.
184 2.96 1.05 8.7% 25.5% 31.5% 29.3% 4.9%
A cross-jurisdictional/cross-sector group exists to coordinate groundwater protection.
185 2.88 1.10 10.8% 27.6% 31.4% 23.2% 7.0%
Source: Question 32; Minnesota Soil and Water Conservation Districts Groundwater Survey aResponses based on a five-point scale from strongly disagree (1) to strongly agree (5)
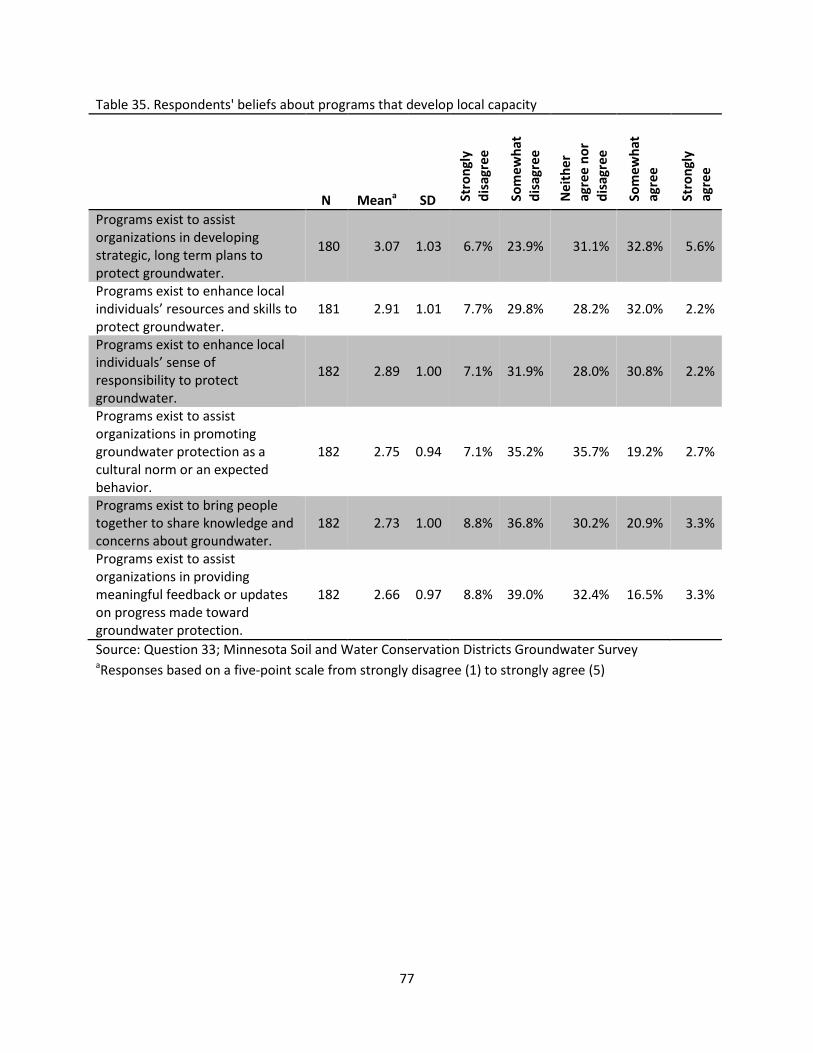
77
Table 35. Respondents' beliefs about programs that develop local capacity
N Meana SD Stro
ngly
di
sagr
ee
Som
ewha
t di
sagr
ee
Nei
ther
ag
ree
nor
disa
gree
Som
ewha
t ag
ree
Stro
ngly
ag
ree
Programs exist to assist organizations in developing strategic, long term plans to protect groundwater.
180 3.07 1.03 6.7% 23.9% 31.1% 32.8% 5.6%
Programs exist to enhance local individuals’ resources and skills to protect groundwater.
181 2.91 1.01 7.7% 29.8% 28.2% 32.0% 2.2%
Programs exist to enhance local individuals’ sense of responsibility to protect groundwater.
182 2.89 1.00 7.1% 31.9% 28.0% 30.8% 2.2%
Programs exist to assist organizations in promoting groundwater protection as a cultural norm or an expected behavior.
182 2.75 0.94 7.1% 35.2% 35.7% 19.2% 2.7%
Programs exist to bring people together to share knowledge and concerns about groundwater.
182 2.73 1.00 8.8% 36.8% 30.2% 20.9% 3.3%
Programs exist to assist organizations in providing meaningful feedback or updates on progress made toward groundwater protection.
182 2.66 0.97 8.8% 39.0% 32.4% 16.5% 3.3%
Source: Question 33; Minnesota Soil and Water Conservation Districts Groundwater Survey aResponses based on a five-point scale from strongly disagree (1) to strongly agree (5)

78
Table 36. Respondents' beliefs about legitimacy, trust and fairness in decision making about groundwater
N Meana SD Stro
ngly
di
sagr
ee
Som
ewha
t di
sagr
ee
Nei
ther
ag
ree
nor
disa
gree
Som
ewha
t ag
ree
Stro
ngly
ag
ree
SWCDs are an appropriate organization to make decisions about groundwater quality.
183 3.75 0.97 1.6% 11.5% 18.0% 47.5% 21.3%
Community members and organizations trust groundwater information from my SWCD.
182 3.75 0.84 1.1% 4.9% 29.7% 46.7% 17.6%
SWCDs are an appropriate organization to make decisions about groundwater quantity.
183 3.46 1.05 3.8% 16.4% 24.6% 40.4% 14.8%
Community members and organizations perceive that groundwater protection decisions in my district are fair.
182 3.31 0.78 1.6% 8.2% 53.3% 30.8% 6.0%
Source: Question 34; Minnesota Soil and Water Conservation Districts Groundwater Survey aResponses based on a five-point scale from strongly disagree (1) to strongly agree (5)

79
Table 37. Types of assistance or support to address clientele's groundwater concerns N Percent* Information on local groundwater quality and quantity trends 144 76.6% Funding for BMP implementation 144 76.6% Information on studies on land use impacts on groundwater 141 75.0% Better understanding of groundwater basics and surface-groundwater connections 138 73.4% Grant opportunities to fund groundwater and drinking water protection activities in local plans 136 72.3%
Information on effectiveness of conservation practices 135 71.8% Assistance in identifying/prioritizing local threats to groundwater quality/quantity 131 69.7% Information on best management practices and programs to protect groundwater 123 65.4% Long term monitoring data to develop trends in local and statewide ground water quality and quantity 119 63.3%
Clarification of the roles and responsibilities of the various governmental agencies in groundwater (quantity/quality) and drinking water protection 117 62.2%
Information on historical groundwater studies and application in land use decision making 106 56.4%
Information and training on various groundwater monitoring efforts and results 105 55.9% Brochures on groundwater protection 103 54.8% Information and training on crop input management 98 52.1% County geologic atlases for groundwater planning 92 48.9% Information on statewide groundwater quality and quantity trends 92 48.9% Other (e.g., effective communication plan, innovative funding for landowner practices) 10 5.3%
*Percent of total respondents (N = 188) Source: Question 35; Minnesota Soil and Water Conservation Districts Groundwater Survey

80
Table 38. Areas of support to better engage with clients or build local capacity N Percent* Increasing local knowledge associated with groundwater protection 147 78.2% Defining and communicating local groundwater issues to a range of audiences 146 77.7% Accessing financial resources to implement engagement/outreach activities 132 70.2% Developing cultural norms and expectations around groundwater protection 116 61.7% Identifying community needs and concerns associated with groundwater 115 61.2% Identifying local staff with groundwater expertise 105 55.9% Inspiring diverse stakeholders to care about groundwater protection 100 53.2% Building stronger relationships with landowners 100 53.2% Bringing people together to share knowledge and concerns about groundwater 100 53.2% Providing community members with meaningful feedback or updates on progress made toward groundwater protection 95 50.5%
Developing stronger partnerships with local organizations 88 46.8% Identifying and supporting local champions for groundwater protection 82 43.6% Defining and communicating state groundwater issues to a range of audiences 74 39.4% Other (e.g., long term program funding, information about water use) 5 2.7% Increasing local knowledge associated with groundwater protection 147 78.2% Defining and communicating local groundwater issues to a range of audiences 146 77.7% Accessing financial resources to implement engagement/outreach activities 132 70.2% *Percent of total respondents (N = 188) Source: Question 38; Minnesota Soil and Water Conservation Districts Groundwater Survey Table 39. Reported importance of the following to address groundwater issues
N Meana SD Not
at a
ll im
port
ant
Slig
htly
im
port
ant
Som
ewha
t im
port
ant
Very
im
port
ant
Extr
emel
y im
port
ant
Local community member (e.g., landowners, farmers, residents) engagement
180 4.43 0.74 0.0% 1.1% 11.7% 30.6% 56.7%
Education and outreach 179 4.30 0.80 0.0% 2.2% 14.5% 34.1% 49.2% Conservation practice implementation 180 4.12 0.84 0.6% 3.9% 14.4% 45.0% 36.1%
Planning 179 3.97 0.79 0.0% 3.9% 20.7% 49.7% 25.7% Land use policy/ordinance development 178 3.95 0.81 0.0% 3.9% 23.6% 46.1% 26.4%
Monitoring 179 3.89 0.82 0.6% 5.0% 21.2% 50.8% 22.3% Administration and grant management 178 3.53 0.88 0.6% 11.2% 35.4% 39.9% 12.9%
Source: Question 36; Minnesota Soil and Water Conservation Districts Groundwater Survey aResponses based on a five-point scale from not at all important (1) to extremely important (5)
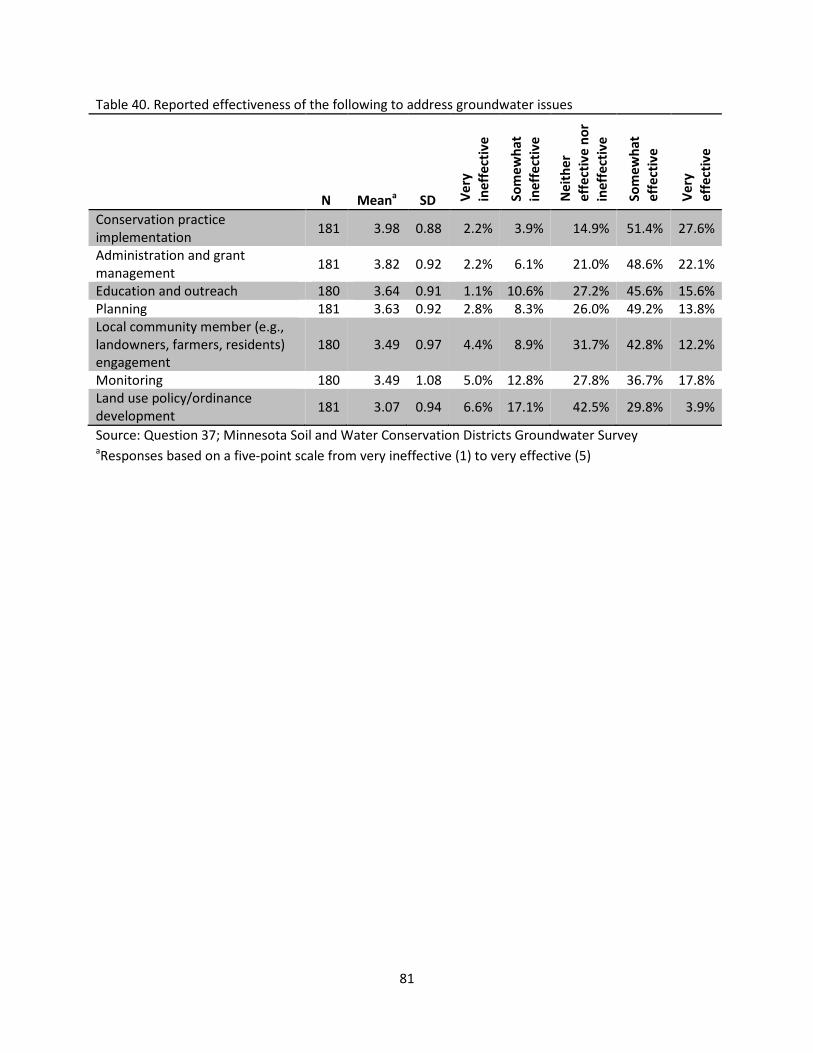
81
Table 40. Reported effectiveness of the following to address groundwater issues
N Meana SD Very
in
effe
ctiv
e
Som
ewha
t in
effe
ctiv
e
Nei
ther
ef
fect
ive
nor
inef
fect
ive
Som
ewha
t ef
fect
ive
Very
ef
fect
ive
Conservation practice implementation 181 3.98 0.88 2.2% 3.9% 14.9% 51.4% 27.6%
Administration and grant management 181 3.82 0.92 2.2% 6.1% 21.0% 48.6% 22.1%
Education and outreach 180 3.64 0.91 1.1% 10.6% 27.2% 45.6% 15.6% Planning 181 3.63 0.92 2.8% 8.3% 26.0% 49.2% 13.8% Local community member (e.g., landowners, farmers, residents) engagement
180 3.49 0.97 4.4% 8.9% 31.7% 42.8% 12.2%
Monitoring 180 3.49 1.08 5.0% 12.8% 27.8% 36.7% 17.8% Land use policy/ordinance development 181 3.07 0.94 6.6% 17.1% 42.5% 29.8% 3.9%
Source: Question 37; Minnesota Soil and Water Conservation Districts Groundwater Survey aResponses based on a five-point scale from very ineffective (1) to very effective (5)

82
Appendix D: Pre-workshop Survey Questionnaire
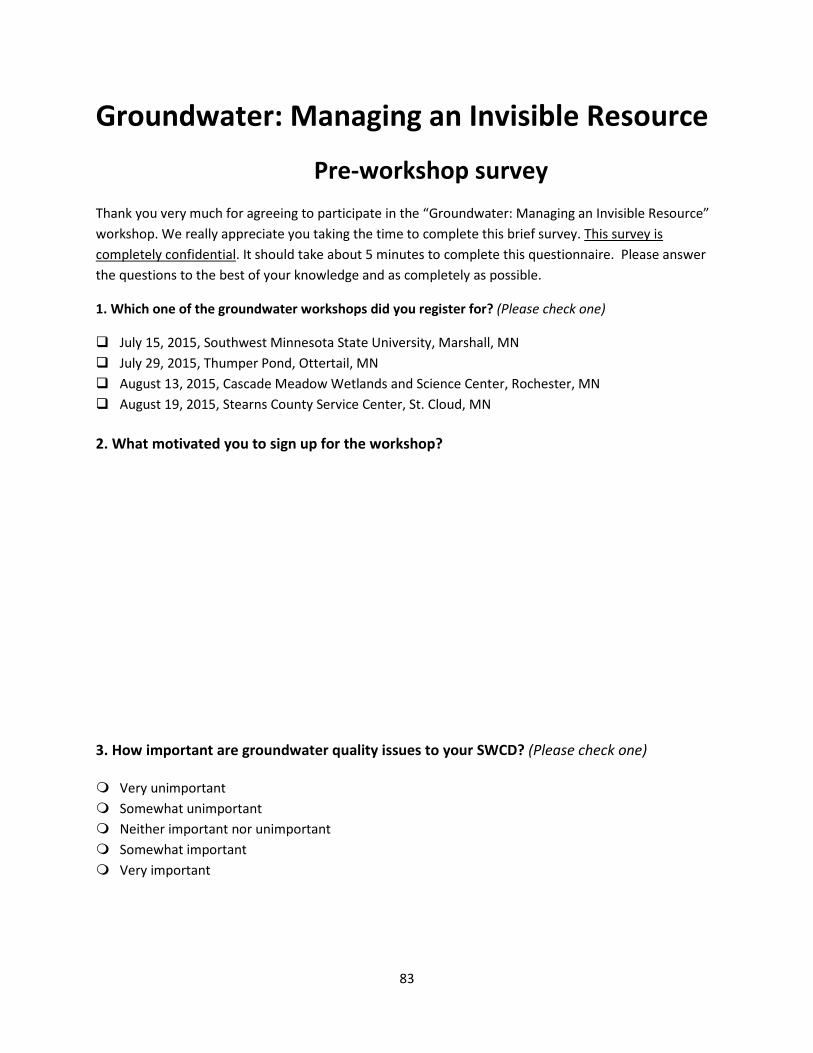
83
Groundwater: Managing an Invisible Resource
Pre-workshop survey Thank you very much for agreeing to participate in the “Groundwater: Managing an Invisible Resource” workshop. We really appreciate you taking the time to complete this brief survey. This survey is completely confidential. It should take about 5 minutes to complete this questionnaire. Please answer the questions to the best of your knowledge and as completely as possible.
1. Which one of the groundwater workshops did you register for? (Please check one)
July 15, 2015, Southwest Minnesota State University, Marshall, MN July 29, 2015, Thumper Pond, Ottertail, MN August 13, 2015, Cascade Meadow Wetlands and Science Center, Rochester, MN August 19, 2015, Stearns County Service Center, St. Cloud, MN 2. What motivated you to sign up for the workshop?
3. How important are groundwater quality issues to your SWCD? (Please check one) Very unimportant Somewhat unimportant Neither important nor unimportant Somewhat important Very important

84
4. How would you rate your knowledge of the following? (Please circle one number for each row)
Very poor Poor Fair Good Very good
Local hydrogeology 1 2 3 4 5
Local groundwater quality 1 2 3 4 5
Local groundwater supply 1 2 3 4 5
Land use impacts on groundwater quality 1 2 3 4 5
Land use impacts on groundwater quantity 1 2 3 4 5
Local groundwater trends 1 2 3 4 5
Connection between groundwater and surface water 1 2 3 4 5
5. How confident are you in your ability to…? (Please circle one number for each row)
Not at all Slightly Somewhat Very Extremely
Find the information you need on groundwater issues 1 2 3 4 5
Find the information you need on drinking water issues 1 2 3 4 5
Implement best management practices to protect groundwater 1 2 3 4 5
Implement best management practices to protect drinking water 1 2 3 4 5
6. How clear or unclear to you is your role in groundwater or drinking water management? (Please check one)
Very unclear Somewhat unclear Neither clear nor unclear Somewhat clear Very clear

85
7. How clear or unclear to you is the role of others (i.e., state and local agencies, governments, landowners, non-governmental organizations) in groundwater or drinking water management? (Please check one)
Very unclear Somewhat unclear Neither clear nor unclear Somewhat clear Very clear

86
Appendix E: Post-workshop Survey Questionnaire

87
Groundwater: Managing an Invisible Resource
Pre-workshop survey Thank you very much for agreeing to participate in the “Groundwater: Managing an Invisible Resource” workshop. We really appreciate you taking the time to complete this brief survey. This survey is completely confidential. It should take about 5 minutes to complete this questionnaire. Please answer the questions to the best of your knowledge and as completely as possible.
1. Which one of the groundwater workshops did you register for? (Please check one)
July 15, 2015, Southwest Minnesota State University, Marshall, MN July 29, 2015, Thumper Pond, Ottertail, MN August 13, 2015, Cascade Meadow Wetlands and Science Center, Rochester, MN August 19, 2015, Stearns County Service Center, St. Cloud, MN 2. To what extent do you agree or disagree with the following statements?
Strongly disagree
Somewhat disagree
Neither agree nor
disagree Somewhat
agree Strongly
agree I learned something new in this workshop. 1 2 3 4 5 The workshop was a good use of my time. 1 2 3 4 5 I have a better understanding of the connections between groundwater and surface water after this workshop.
1 2 3 4 5
I have a better understanding of land use impacts on groundwater after this workshop.
1 2 3 4 5
I have a better understanding of local hydrogeology after this workshop. 1 2 3 4 5
I have a better understanding of local groundwater quality after this workshop. 1 2 3 4 5
I have a better understanding of local groundwater supply after this workshop. 1 2 3 4 5

88
3. How important are groundwater quality issues to your SWCD? (Please check one) Very unimportant Somewhat unimportant Neither important nor unimportant Somewhat important Very important 4. How would you rate your knowledge of the following? (Please circle one number for each row)
Very poor Poor Fair Good Very good
Local hydrogeology 1 2 3 4 5
Local groundwater quality 1 2 3 4 5
Local groundwater supply 1 2 3 4 5
Land use impacts on groundwater quality 1 2 3 4 5
Land use impacts on groundwater quantity 1 2 3 4 5
Local groundwater trends 1 2 3 4 5
Connection between groundwater and surface water 1 2 3 4 5
5. How clear or unclear to you is your role in groundwater or drinking water management? (Please check one)
Very unclear Somewhat unclear Neither clear nor unclear Somewhat clear Very clear
6. How clear or unclear to you is the role of others (i.e., state and local agencies, governments, landowners, non-governmental organizations) in groundwater or drinking water management? (Please check one)
Very unclear Somewhat unclear Neither clear nor unclear Somewhat clear Very clear

89
7. How confident are you in your ability to…? (Please circle one number for each row)
Not at all Slightly Somewhat Very Extremely
Find the information you need on groundwater issues 1 2 3 4 5
Find the information you need on drinking water issues 1 2 3 4 5
Implement best management practices to protect groundwater 1 2 3 4 5
Implement best management practices to protect drinking water 1 2 3 4 5
8. Please reflect back to why you signed up for this workshop. Did you meet your goals? Please explain.
9. What did you like about this workshop?
10. What would you have liked to hear about that you did not?
11. What has this workshop inspired you to do to address groundwater and drinking water management in your area?
12. Do you have any other comments about the workshop?

90
Appendix F: Pre- and Post-workshop Findings

91
Table 1. Respondents' knowledge in the following areas before the workshop
N Mean SD* Very poor Poor Fair Good
Very good
Land use impacts on groundwater quality 145 3.61 0.83 2.1% 4.8% 33.8% 48.3% 11.0%
Connection between groundwater and surface water 145 3.37 0.87 2.8% 9.0% 46.2% 33.1% 9.0%
Land use impacts on groundwater quantity 145 3.26 0.86 2.8% 13.1% 46.2% 31.7% 6.2%
Local groundwater quality 145 3.15 0.90 3.4% 19.3% 40.0% 33.1% 4.1% Local hydrogeology 144 2.97 0.89 5.6% 22.2% 44.4% 25.7% 2.1% Local groundwater supply 144 2.95 0.91 6.9% 21.5% 42.4% 27.8% 1.4% Local groundwater trends 145 2.84 1.00 11.7% 22.1% 38.6% 25.5% 2.1% *Standard Deviation
Table 2. Respondents' knowledge in the following areas after the workshop
N Mean SD* Very poor Poor Fair Good
Very good
Land use impacts on groundwater quality 98 4.01 0.68 0.0% 0.0% 22.4% 54.1% 23.5%
Connection between groundwater and surface water 98 3.81 0.71 0.0% 2.0% 30.6% 52.0% 15.3%
Land use impacts on groundwater quantity 98 3.73 0.84 0.0% 6.1% 33.7% 40.8% 19.4%
Local groundwater quality 98 3.53 0.88 1.0% 11.2% 32.7% 43.9% 11.2% Local groundwater supply 97 3.40 0.85 1.0% 13.4% 37.1% 41.2% 7.2% Local hydrogeology 98 3.33 0.82 2.0% 11.2% 43.9% 37.8% 5.1% Local groundwater trends 98 3.28 0.85 0.0% 18.4% 42.9% 31.6% 7.1% *Standard Deviation
Table 3. Difference between pre and post workshop participants in their knowledge of the following areas N Mean
Mean differencea tb
Pre-workshop
Post-workshop
Pre-workshop
Post-workshop
Land use impacts on groundwater quantity 145 98 3.26 3.73 0.48 -4.303*
Local groundwater supply 144 97 2.95 3.40 0.45 -3.922* Connection between groundwater and surface water
145 98 3.37 3.81 0.44 -4.313*
Local groundwater trends 145 98 2.84 3.28 0.43 -3.633* Land use impacts on groundwater quality 145 98 3.61 4.01 0.40 -4.079*
Local groundwater quality 145 98 3.15 3.53 0.38 -3.271*
Local hydrogeology 144 98 2.97 3.33 0.36 -3.247* aDifference between post-workshop and pre-workshop means; bt-test statistic (Independent Samples t-test); *p < 0.01

92
Table 4. Respondents' confidence in their ability to get information in the following areas before the workshop
N Mean SD* Not
at all Slightly Somewhat Very Extremely
Find the information you need on drinking water issues 145 3.14 0.90 3.4% 17.9% 44.8% 28.3% 5.5%
Implement best management practices to protect groundwater 145 3.13 0.84 3.4% 16.6% 45.5% 32.4% 2.1%
Implement best management practices to protect drinking water
145 3.10 0.86 3.4% 16.6% 51.0% 24.1% 4.8%
Find the information you need on groundwater issues 145 2.97 0.81 3.4% 20.7% 53.8% 19.3% 2.8%
*Standard deviation
Table 5. Respondents' confidence in their ability to get information in the following areas after the workshop
N Mean SD* Not
at all Slightly Somewhat Very Extremely
Find the information you need on drinking water issues 98 3.50 0.80 1.0% 9.2% 35.7% 46.9% 7.1%
Implement best management practices to protect groundwater 98 3.49 0.69 0.0% 7.1% 40.8% 48.0% 4.1%
Implement best management practices to protect drinking water
98 3.49 0.75 0.0% 7.1% 44.9% 39.8% 8.2%
Find the information you need on groundwater issues 98 3.47 0.71 1.0% 5.1% 43.9% 45.9% 4.1%
*Standard deviation
Table 6. Difference between pre and post workshop participants in the confidence in their ability to get information in the following areas N Mean
Mean differencea tb
Pre-workshop
Post-workshop
Pre-workshop
Post-workshop
Find the information you need on groundwater issues
145 98 2.97 3.47 0.50 -5.075*
Implement best management practices to protect drinking water
145 98 3.10 3.49 0.39 -3.721*
Implement best management practices to protect groundwater
145 98 3.13 3.49 0.36 -3.642*
Find the information you need on drinking water issues
145 98 3.14 3.50 0.36 -3.225*
aDifference between post-workshop and pre-workshop means; bt-test statistic (Independent Samples t-test); *p < 0.01
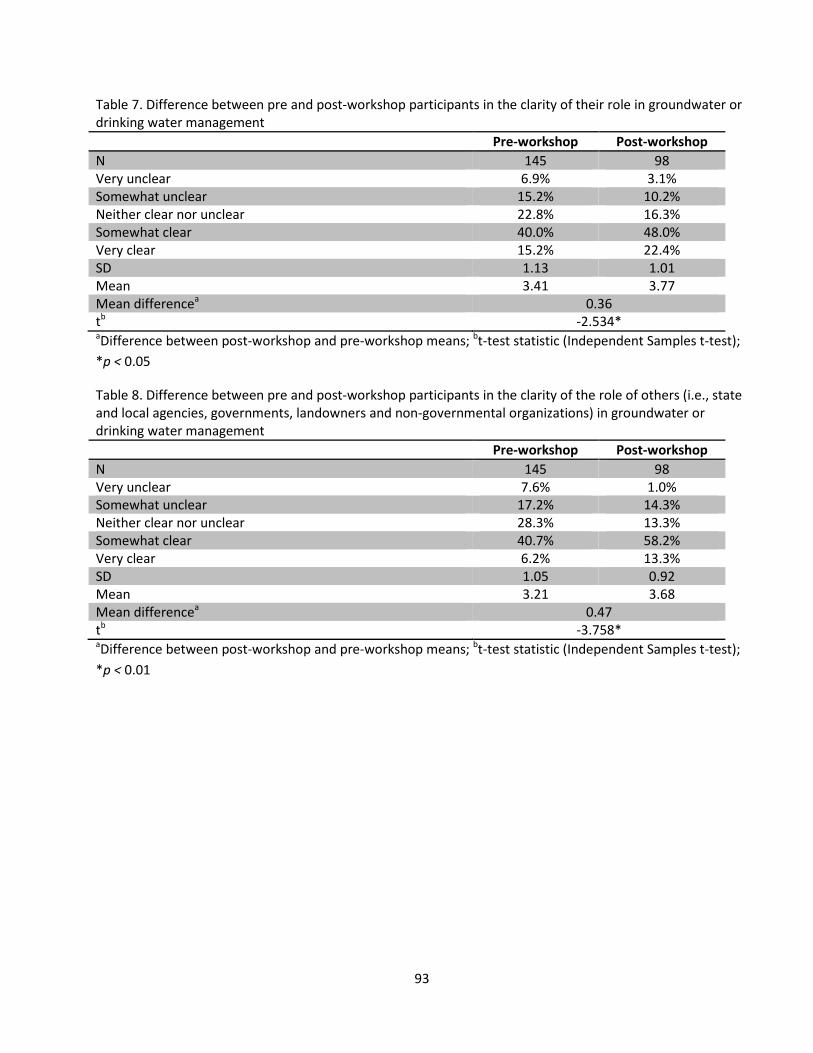
93
Table 7. Difference between pre and post-workshop participants in the clarity of their role in groundwater or drinking water management Pre-workshop Post-workshop N 145 98 Very unclear 6.9% 3.1% Somewhat unclear 15.2% 10.2% Neither clear nor unclear 22.8% 16.3% Somewhat clear 40.0% 48.0% Very clear 15.2% 22.4% SD 1.13 1.01 Mean 3.41 3.77 Mean differencea 0.36 tb -2.534* aDifference between post-workshop and pre-workshop means; bt-test statistic (Independent Samples t-test); *p < 0.05
Table 8. Difference between pre and post-workshop participants in the clarity of the role of others (i.e., state and local agencies, governments, landowners and non-governmental organizations) in groundwater or drinking water management Pre-workshop Post-workshop N 145 98 Very unclear 7.6% 1.0% Somewhat unclear 17.2% 14.3% Neither clear nor unclear 28.3% 13.3% Somewhat clear 40.7% 58.2% Very clear 6.2% 13.3% SD 1.05 0.92 Mean 3.21 3.68 Mean differencea 0.47 tb -3.758* aDifference between post-workshop and pre-workshop means; bt-test statistic (Independent Samples t-test); *p < 0.01

94
Table 9. Workshop participants' agreement or disagreement with the following statements
N Mean SD* Stro
ngly
di
sagr
ee
Som
ewha
t di
sagr
ee
Nei
ther
ag
ree
nor
disa
gree
Som
ewha
t ag
ree
Stro
ngly
ag
ree
I learned something new in this workshop. 97 4.55 0.65 0.0% 2.1% 2.1% 35.1% 60.8%
The workshop was a good use of my time. 95 4.39 0.73 0.0% 4.2% 2.1% 44.2% 49.5%
I have a better understanding of the connections between groundwater and surface water after this workshop.
97 4.06 0.79 0.0% 3.1% 18.6% 47.4% 30.9%
I have a better understanding of land use impacts on groundwater after this workshop.
97 3.86 0.85 0.0% 6.2% 25.8% 44.3% 23.7%
I have a better understanding of local hydrogeology after this workshop. 97 3.84 0.91 0.0% 8.2% 25.8% 40.2% 25.8%
I have a better understanding of local groundwater quality after this workshop.
97 3.69 0.91 0.0% 11.3% 26.8% 43.3% 18.6%
I have a better understanding of local groundwater supply after this workshop.
97 3.68 0.96 1.0% 12.4% 23.7% 43.3% 19.6%
*Standard deviation