groundwater flow, heat transport, and water table position
TRANSCRIPT
Groundwater flow, heat transport, and water table position
within volcanic edifices:
Implications for volcanic processes in the Cascade Range
Shaul HurwitzU.S. Geological Survey, Menlo Park, California, USA
Kenneth L. KippU.S. Geological Survey, Denver, Colorado, USA
Steven E. Ingebritsen and Mark E. ReidU.S. Geological Survey, Menlo Park, California, USA
Received 1 May 2003; revised 8 August 2003; accepted 27 August 2003; published 11 December 2003.
[1] The position of the water table within a volcanic edifice has significant implicationsfor volcano hazards, geothermal energy, and epithermal mineralization. We have modifiedthe HYDROTHERM numerical simulator to allow for a free-surface (water table) upperboundary condition and a wide range of recharge rates, heat input rates, andthermodynamic conditions representative of continental volcano-hydrothermal systems.An extensive set of simulations was performed on a hypothetical stratovolcano systemwith unconfined groundwater flow. Simulation results suggest that the permeabilitystructure of the volcanic edifice and underlying material is the dominant control on watertable elevation and the distribution of pressures, temperatures, and fluid phases at depth.When permeabilities are isotropic, water table elevation decreases with increasing heatflux and increases with increasing recharge, but when permeabilities are anisotropic, theseeffects can be much less pronounced. Several conditions facilitate the ascent of ahydrothermal plume into a volcanic edifice: a sufficient source of heat and magmaticvolatiles at depth, strong buoyancy forces, and a relatively weak topography-driven flowsystem. Further, the plume must be connected to a deep heat source through a pathwaywith a time-averaged effective permeability �1 � 10�16 m2, which may be maintainedby frequent seismicity. Topography-driven flow may be retarded by low permeabilityin the edifice and/or the lack of precipitation recharge; in the latter case, the water tablemay be relatively deep. Simulation results were compared with observations from theQuaternary stratovolcanoes along the Cascade Range of the western United States to inferhydrothermal processes within the edifices. Extensive ice caps on many Cascade Rangestratovolcanoes may restrict recharge on the summits and uppermost flanks. Both thesimulation results and limited observational data allow for the possibility that the watertable beneath the stratovolcanoes is relatively deep. INDEX TERMS: 1829 Hydrology:
Groundwater hydrology; 3210 Mathematical Geophysics: Modeling; 3230 Mathematical Geophysics:
Numerical solutions; 8424 Volcanology: Hydrothermal systems (8135); 9350 Information Related to
Geographic Region: North America; KEYWORDS: groundwater flow, volcanic edifice, Cascade Range, water
table, numerical simulations, stratovolcano
Citation: Hurwitz, S., K. L. Kipp, S. E. Ingebritsen, and M. E. Reid, Groundwater flow, heat transport, and water table position
within volcanic edifices: Implications for volcanic processes in the Cascade Range, J. Geophys. Res., 108(B12), 2557,
doi:10.1029/2003JB002565, 2003.
1. Introduction
[2] Groundwater dynamics within a volcanic edifice playa dominant role in volcano hazards, geothermal energy, andepithermal mineralization. The potential for slope failure,
lahar generation, and phreatic eruptions is strongly depen-dent on the position of the water table within the volcanicedifice. In the unsaturated zone above the water table,pressures in the liquid phase are negative (subatmospheric)and can act as a weakly cohesive force in unconsolidatedshallow material. In fully saturated porous media, fluidpressures are positive, reducing effective stress and increas-ing the potential for slope failure [Terzaghi, 1943; Iverson
JOURNAL OF GEOPHYSICAL RESEARCH, VOL. 108, NO. B12, 2557, doi:10.1029/2003JB002565, 2003
This paper is not subject to U.S. copyright.Published in 2003 by the American Geophysical Union.
ECV 1 - 1
and Reid, 1992; Reid and Iverson, 1992; Lopez andWilliams, 1993]. Further, the rates, patterns, and mecha-nisms of pressure transmission and transport of heat andmass will be distinctly different in the unsaturated zoneabove the water table and the underlying saturated zone, forinstance, pressure increases originating at depth will not bereadily transmitted above the water table nor will soluteswith an affinity for the liquid phase.[3] There is little direct knowledge of water table eleva-
tion and geometry in active volcanic cones because fewdeep drill holes are located on or near volcanic summits. Asingle deep well on the summit of Kilauea Volcano, Hawaii,reveals that the water table is approximately 490 m belowthe ground surface [Keller et al., 1979; Hurwitz et al.,2002]. In humid regions such as Kilauea (1–3 m per yearof precipitation [Takasaki, 1993]), hydrogeologists wouldtypically expect to encounter the water table much closer tothe land surface; its great depth at Kilauea reflects the highpermeability of unaltered to weakly altered lava flowsrelative to most Earth materials. In fact, the pioneering
hydrogeologist O.E. Meinzer referred to the hydrology ofHawaiian volcanoes as ‘‘. . .freakish in every respect. . .’’[Stearns and Clark, 1930] mainly because of phenomenarelated to the high near-surface permeabilities.[4] Thoughmany volcanoes host summit crater lakes [e.g.,
Varekamp and Rowe, 2000], it is often unclear whether thesurface of these lakes represents the water table elevation orthat of a ‘‘perched’’ water body underlain by an unsaturatedzone containing liquid water at subatmospheric fluid pres-sures. At Newberry Volcano, Oregon, a 932-m-deep well wasdrilled near the crater lakes, yet there is still disagreement asto whether the water table coincides with lake level [Sammelet al., 1988] or is much deeper [e.g., Black, 1983].[5] Previous numerical modeling studies provide limited
insight into the factors controlling water table positionwithin volcanic edifices. Pioneering studies of hydrothermalcirculation such as those by Norton and Knight [1977] andCathles [1977] neglected topography entirely and assumedsingle-phase flow. Later work by Hayba and Ingebritsen[1997] included multiphase (steam-liquid) flow and gave
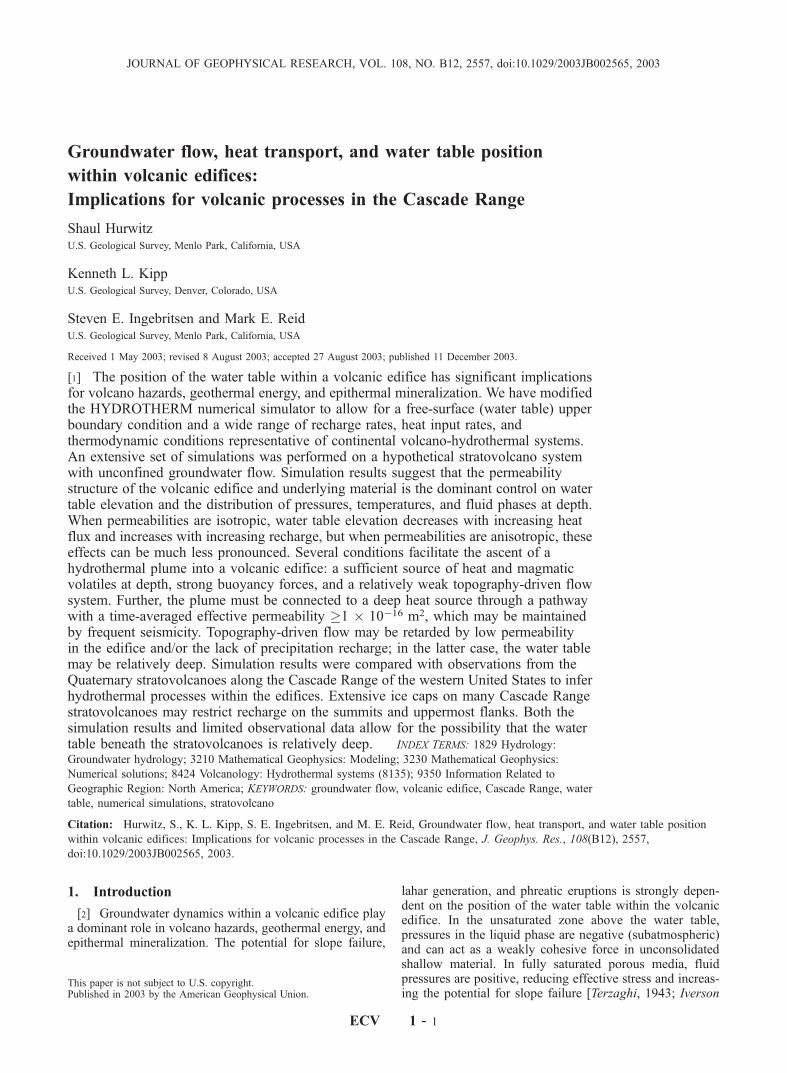
Figure 1. Map showing location of major volcanoes along the Cascade Range volcanic arc,northwestern United States.
ECV 1 - 2 HURWITZ ET AL.: WATER TABLE WITHIN VOLCANIC EDIFICES

some consideration to topography but assumed that watertable position was fixed in space and time.[6] A pioneering work on water table elevation in moun-
tainous terrain [Jamieson and Freeze, 1983] was followedby the most relevant theoretical work to date on the subject[Forster and Smith, 1988a, 1988b, 1989]. These authorsdeveloped a finite element code allowing for a free-surfaceupper boundary condition and did a parametric analysis ofthe effects of topography, permeability, recharge, and heatflow on the elevation and geometry of the water table. Theirstudy was limited to single-phase (liquid water) flow andinvoked maximum heat flow values (�120 mW m�2) thatare considerably lower than those representative of mostactive volcanoes. Forster and Smith [1988b, 1989] also didnot address the anisotropy of permeability (kx generally>kz), a factor that is often significant in volcanic terrains dueto the layering of lavas [cf. Souza and Voss, 1987] and otherflow deposits [cf. Winograd, 1971].[7] In this paper we describe the results of numerical
simulations of multiphase groundwater flow under condi-tions representing active volcanic systems with steep flanks.The simulations are conditioned on recharge rates (up to1 m yr�1), and heat input rates (10 s of megawatts or up to�4Wm�2) typical of stratovolcanoes in the Cascade Range,northwest United States (Figure 1). Both the basic equationsof groundwater flow and heat transport and the results ofForster and Smith [1988b, 1989] suggest that permeabilitystructure, recharge rate, and heat input rate will be dominantcontrolling factors. The objective of these simulations is toquantify the relative importance of these factors in control-ling water table elevation, phase distribution, and thermalstructure within volcanic edifices. To account for relevantboundary conditions we have modified the high-temperature,multiphase groundwater flow and heat transport simulatorHYDROTHERM [Hayba and Ingebritsen, 1994] by intro-ducing a free-surface upper boundary condition.[8] After summarizing the simulation results we attempt
to relate them to the sparse field observations from volca-noes along the Cascade Range. We hope that this analysiswill enhance understanding of flow and transport withinvolcanic edifices and help to guide additional fieldwork.Such an understanding has implications for geothermal andepithermal mineral resources as well as volcanic hazards.
2. Mathematical Approaches andNumerical Techniques
[9] The computer program HYDROTHERM [Hayba andIngebritsen, 1994] simulates heat transport and two-phase(liquid and vapor) groundwater flow in three dimensionsand includes pure water equations of state in the tempera-ture range of 0�–1200�C and pressure range of 5 � 104–1� 109 Pa. Finite difference numerical techniques are usedfor spatial and temporal discretization of the differentialequations. Simultaneous solutions are obtained for thedependent variables, pressure and enthalpy, which togetheruniquely define the thermodynamic state of the system.[10] We introduced several major modifications to the
original HYDROTHERM code to enable our simulations.They include (1) the ability to simulate unsaturated ground-water flow, (2) precipitation recharge and seepage surfaceboundary conditions at the land surface, and (3) the ability to
simulate variable temperature at a specified pressure bound-ary. This enhanced version of the code can simulate large-scale drainage of a saturated domain but is frequentlyunstable when simulating saturation of a zone containingstagnant air.
2.1. Flow and Transport Equations
[11] The groundwater flow equation is based on conser-vation of water mass in a volume element given by
@ f rwSw þ rsSsð Þ½ @t
�r�kkrwrwmw
rpþ rwgez½
� r�kkrsrsms
rpþ rsgez½ � qw � qs ¼ 0; ð1Þ
where p is pressure and the subscripts w and s refer to liquidwater and steam, respectively; other symbols are defined inTable 1. The terms involving steam are not present in theair-water zone above the water table.[12] Because any point in the simulation domain may be in
either a single-phase zone, a two-phase one-component(steam-liquid water) zone below the water table, or a two-phase two-component (air-liquid water) zone above the watertable, the saturation constraint equation is generalized to
Sw þ Sg ¼ 1; ð2Þ
Table 1. Definition of Symbols in Equations
Definition Units
Symbol
ez unit vector in thez-coordinate direction
(– )
g gravitational constant (m/s2)h specific enthalpy (J/kg)I identity matrix of rank 3 (– )�k permeability tensor (m2)
kr relative permeability (– )Km medium thermal
conductivity(W/m-K)
Nu Nusselt number (– )p fluid pressure (Pa)pc capillary pressure (Pa)q boundary flux or source/sink (kg/m2-s); (kg/m3-s)S volumetric saturation (– )t time (s)T temperature (�C)rT temperature gradient (�C/m)v volumetric flux
(Darcy velocity)(m/s)
m viscosity (Pa-s)r density (kg/m3)f porosity (– )
Subscriptsa airc capillary effectsf the flowing fluid mixture
(single- or two-phase)g gasH enthalpyi phase im the porous medium and
fluid and gasR precipitation recharger rock or residual saturations steamw liquid water
HURWITZ ET AL.: WATER TABLE WITHIN VOLCANIC EDIFICES ECV 1 - 3

where Sg represents the saturation of either steam or air. Thevolumetric flux or Darcy velocity for phase i is obtainedfrom Darcy’s Law as
vi ¼ ��kkrimi
rpþ rigez½ : ð3Þ
[13] The heat transport equation is based upon the con-servation of enthalpy, a derived property containing bothinternal energy and flow energy, in both fluid and solidphases:
@
@tf rwhwSw þ rshsSsð Þ þ 1� fð Þrrhr½ � r KmrT
þr frwhwvw þr frshsvs � qh ¼ 0; ð4Þ
where Km is an effective thermal conduction coefficient thatdoes not depend on liquid saturation or porosity. A detailedderivation of the equation is given by Faust and Mercer[1979]. As was the case for the flow equation (1), the termsinvolving steam are not present in the air-water zone abovethe water table.
2.2. Water Table Position and Unconfined Flow
[14] The water table is defined as a surface of atmo-spheric pressure. From the fluid pressure field solution ofHYDROTHERM we calculate the position of a water tablein each column of the simulation domain. Capillarypressure, which is the pressure difference between theliquid and gas phases in the two-phase (air-water) zoneabove the water table, is defined by
pc ¼ pa � pw: ð5Þ
Linear functions were adopted for water saturation and forrelative permeability as a function of capillary pressure. Thelinear water saturation function is
1� Sw
1� Swr¼ pc � pcb
pcr � pcbfor pcb < pc < pcr; ð6aÞ
Sw ¼ 1 for pc � pcb; ð6bÞ
Sw ¼ Swr for pc � pcr; ð6cÞ
where pcb is the capillary pressure at the bubbling point andpcr is the capillary pressure at the residual water saturation.Liquid flow ceases for pc � pcr. In dry environments or inareas with deep water tables, the capillary pressure can bevery large and the corresponding liquid-phase pressurecan be a large negative value. The HYDROTHERMequation-of-state tables are limited to pressures greater than5 � 104 Pa (0.5 atm), and we arbitrarily enforce this lowerlimit for water property calculations in the air-water zone.This approximation is unlikely to induce any serious error tothe simulations because at low hydrodynamic pressuresthere is little heat transport by advection.
2.3. Recharge Boundary Condition
[15] For unconfined groundwater systems a useful landsurface boundary condition is a precipitation recharge fluxwith associated heat advection. This can be treated as a netflux after accounting for evapotranspiration. Heat advectionqHR at such a boundary SR is given by
qHR xð Þ ¼ hR T ; pð ÞrR T ; pð ÞqFR for x on SR; ð7Þ
where the precipitation enthalpy hR and density rR arecalculated at a specified temperature and atmosphericpressure, qFR is the recharge flux across the land surfaceboundary (m3 m�2 s�1), SR is the area over which theprecipitation boundary condition exists (m2), and x is thevector of spatial position along boundary SR. The rechargeflux flows generally downward through the partiallysaturated zone to the water table.
2.4. Surface-of-Seepage Boundary Condition
[16] A surface-of-seepage boundary condition allowsgroundwater discharge to occur where the water tableintercepts a sloping land surface. We implement this con-dition along sloping boundaries by using alternating thin(z dimension � r dimension) ‘‘seeping’’ cells and wide(z � r) cells (Figure 2, inset). The seeping cells allowhorizontal discharge, and the wide cells allow verticalprecipitation recharge at a specified rate.[17] Along a sloping land surface, such as a mountainside
or volcanic cone, a seepage surface often occupies the lowerportion of the slope, whereas the upper portion receivesprecipitation recharge. The ‘‘hinge point’’ for steady stateflow between seepage and recharge can be adjusted itera-tively [e.g., Forster and Smith, 1988a]. Our discretizationapproach obviates the need to iteratively relocate the hingepoint: a seeping cell becomes nonseeping if the seepage ratebecomes positive (inflow to the domain); conversely, non-seeping cells become seeping cells if pressure rises aboveatmospheric pressure. These tests are applied at the end ofeach time step in the numerical scheme. If any seeping cellswitches condition, the subsequent time step reflects thenew boundary condition state.
2.5. Modified Constant Pressure-EnthalpyBoundary Condition
[18] In multidimensional simulations of groundwaterflow and heat transport, the upper (land surface) boundaryis commonly treated as a constant pressure and constantenthalpy (or temperature) boundary. Constant-in-timelateral boundaries also are common. The version ofHYDROTHERM documented by Hayba and Ingebritsen[1994], like most hydrothermal models, requires that bothpressure and enthalpy be held constant-in-time at a boundaryfor each simulation period. In the modified version of thesimulator, these conditions were decoupled, allowing foradvective flux of enthalpy through a boundary with constantpressure. For flow into the domain, the enthalpy (ortemperature) of the incoming fluid is specified, and foroutflow, the enthalpy of the outgoing fluid is that of theambient fluid at the boundary and is determined by solutionof the heat transport equation. This combination of flow andheat transport boundary conditions will be referred to asspecified pressure and associated enthalpy (temperature)
ECV 1 - 4 HURWITZ ET AL.: WATER TABLE WITHIN VOLCANIC EDIFICES
boundary conditions. Under certain flow regimes thisapproach leads to more realistic estimates of near-boundarytemperatures.
3. Simulation Assumptions and Simplifications
[19] The most important simplification in our numericalsimulation study is the emphasis on quasi steady statesolutions obtained for particular sets of boundary conditionsand parameter values. This approach is similar to previousstudies that solved equations for steady state groundwaterflow and heat transport [Forster and Smith, 1988a, 1988b,1989]. We emphasize steady state results because thisallows us to more readily isolate the sensitivity of keyparameters and boundary conditions. However, naturalvolcanic hydrothermal systems likely never achieve a truesteady state. To obtain quasi steady state solutions we rantransient simulations to near equilibrium; this entailedsimulation times of 30,000–50,000 years. This timescalefor near equilibrium is long compared to the eruptionintervals of active Cascade Range volcanoes, which areon the order of 200–2000 years. Further, in some rapidlydeforming or highly reactive systems, the key controllingparameter, permeability, can vary on timescales of less than1 year [Nur and Walder, 1992; Martin and Lowell, 1997;Moore et al., 1994; Hurwitz et al., 2002].[20] Several other simplifying assumptions are not sig-
nificantly limiting for purposes of this study. For example,the circulating fluid was assumed to be pure water, and the
finite difference approach used by HYDROTHERMrequires us to represent the edifice by stairsteps rather thana plane slope (Figure 2). In the lack of much experimentaland theoretical data for volcanic rocks at high temperature,we selected a linear relative permeability function betweenliquid and steam zones. Additional assumptions specific tothe work reported here are (1) a simplified linear saturationcurve and relative permeability function between the landsurface and the water table, (2) an artificially high value forcapillary pressure at residual water saturation in order tofacilitate precipitation recharge and the approach to steadystate, and (3) no water vapor in the gas (air) phase, meaningthat boiling at the water table cannot be simulated. Thesesimplifications are consistent with our emphasis on steadystate results and our lack of interest in the exact dynamics offlow in the unsaturated zone above the water table. We alsoignored any thermal lapse rate in the precipitation recharge(likely 5�–6�C per km elevation); instead, we invoked aconstant value of 5�C. Similarly, we neglected variation ofatmospheric pressure with elevation. Hayba and Ingebritsen[1994] list and discuss assumptions incorporated into theprevious version of HYDROTHERM.
4. Model Configuration and Boundary andInitial Conditions
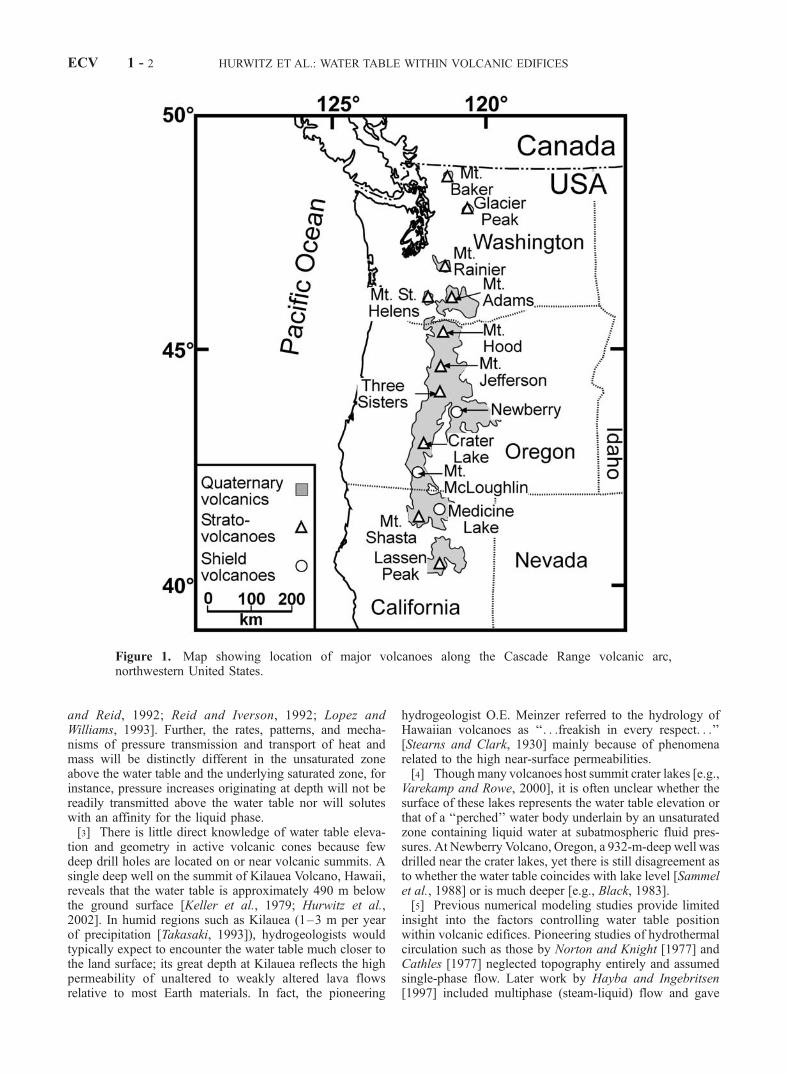
[21] The model domain is a radial cross section through acylinder of radius 8.3 km and height 3.5 km overlain by acone with base radius 3.0 km and height 1.5 km (Figure 2).
Figure 2. Finite difference grid employed in numerical simulations. Shading indicates low-permeabilitybasal unit. Also shown are the area with high basal heat flow (thick line on bottom left); a high-vertical-permeability conduit adjacent to the left-hand boundary incorporated in simulation series J, K, and L; andlocation of the mass source incorporated in simulation series L. Inset shows recharge and seepageboundary cells on the cone. See Table 3 for descriptions of simulation series.
HURWITZ ET AL.: WATER TABLE WITHIN VOLCANIC EDIFICES ECV 1 - 5

The left edge of the cross section coincides with the centralaxis of the cylinder and cone. The cone, representing theedifice, has a surface slope of 27�. The cross section isdivided into 105 columns and 43 rows, with 2760 activecells. Simulations were carried out using cylindrical coor-dinates and representative boundary conditions.[22] The left-hand boundary was treated as insulating and
impermeable. The upper (land surface) boundary wasdivided into two regions. The horizontal region of theupper boundary was assigned a net precipitation flux of0.05 m yr�1 in all simulations (Table 2), whereas the netprecipitation flux on the cone region was specified for eachsimulation (Table 3). The temperature of the net precipita-tion flux in both regions was 5�C. The right-hand boundarywas maintained at the initial hydrostatic fluid pressure andthe associated fluid temperature. The bottom boundary wasimpermeable and was divided into two zones, each with aspecified constant heat flux: a zone with a radius of either2100 or 2950 m beneath the cone with very high heat fluxof up to 2700 mW m�2 (up to 62 MW total heat input)representing a magmatic heat source and a zone at largerradial distances with a basal heat flux of 100 mW m�2
representing typical geothermal conditions in Quaternaryvolcanic terrain [Hasabe et al., 1970; Ingebritsen et al.,1994].[23] Initial pressure conditions were 1 atm between ele-
vations of 3500 m (base of cone) and 5000 m (peak) and ahydrostatic pressure distribution between 3500 m and thebase of the domain. These initial conditions result in a fullysaturated flow system (Sw = 1 at t = 0). Initial temperatureswere based on a temperature of 5�C at the ground surfaceand a thermal gradient of 50�C km�1.
5. Key Parameters
[24] In this section we discuss the open questions and thehypotheses that motivate the parameters selected for exam-ination, and the plausible ranges for the simulation param-eters listed in Tables 2 and 3. The hydrodynamic regime inan active volcano will depend primarily on the magmaticheat supply, the pattern and rates of precipitation (and other)recharge, and the permeability structure of the edifice. Thelatter is subject to the greatest uncertainty. In crystallinerock, permeabilities are highly heterogeneous and rangeover at least eight orders of magnitude at the scale of in situhydraulic testing [Brace, 1980, 1984]. This huge rangeresults largely from the variability of fracture density,aperture, and geometry and is also strongly influenced bythe degree of hydrothermal alteration and fracture filling.
Further, volcanic cones consist mainly of roughly slope-parallel layered lava flows and pyroclastic units. Thisimplies that permeability anisotropy should be significant,at least at shallow depths. Direct measurements of perme-ability anisotropy are rare, and it is often neglected innumerical models. In some simulations, we examined thegeneral effects of anisotropic permeability by varying theratio of horizontal (kx) to vertical (kz) permeability.[25] Previous numerical simulations of groundwater flow
and heat transport in the Cascade Range [Ingebritsen et al.,1992] invoked permeabilities on the order of 10�14 m2 forQuaternary volcanic rocks in order to simulate the nearlyisothermal temperature profiles observed at relatively shal-low depths. Lower permeabilities on the order of 10�16 m2
or less were required to successfully simulate the conduc-tion-dominated thermal regime observed in older rocks atgreater depths [Sammel et al., 1988; Ingebritsen et al.,1992].[26] The near-surface permeabilities required to accom-
modate the high precipitation recharge rates observed inQuaternary rocks of the Oregon Cascade (0.7–1.3 m yr�1
[Ingebritsen et al., 1992; Manga, 1997]) are on the order of10 [Ingebritsen et al., 1992] to 103 times [Manga, 1996]larger than those that provide best matching of the near-surface thermal regime. To effectively match both therecharge rate and the thermal observations requires a strongdecay in permeability between the land surface and �1-kmdepth. Therefore in a few simulations presented here(series K), we invoked a stepwise permeability decreasewith depth that approximates the permeability-depth curvefor the active continental crust suggested by Manning andIngebritsen [1999]. In these simulations, permeability was1 � 10�13 m2 (isotropic) in the upper 1 km and decreasedstepwise to 1 � 10�17 m2 at the base of the model, andrecharge on the cone was 1.0 m yr�1. To represent thepossible influence of a high-vertical-permeability conduitfor ascending magmatic fluids we included a permeableconduit adjacent to the left-hand boundary (Figure 2) in afew simulations (series J and L). However, in most simu-lations reported here we did not attempt to representcomplexities such as depth-dependent permeability orvertical structures but instead invoked a simple two-layerpermeability model similar to that employed by Forster andSmith [1988a, 1988b, 1989] (Figure 2).[27] Advective heat discharge from Cascade Range
hydrothermal features can be used as a crude proxy formagmatic heat input because both geochemical data andthermal arguments indicate that many hot spring groupsrepresent lateral outflow from Quaternary silicic volcaniccenters [Ingebritsen et al., 1989]. Heat transfer rates forindividual Cascade Range hot spring groups vary from <1to �90 MW [Mariner et al., 1990; Ingebritsen et al., 1994].A heat loss of 1 MW translates to crystallization and coolingof silicic magma at a rate of 15–20 km3 Ma�1 [Ingebritsenand Sanford, 1998, p. 183]. Thus the larger hot spring heattransfer rates observed in the Cascade Range are unlikely tobe sustained over geologic time though they have beenshown to be essentially constant over a multidecadal time-scale [Ingebritsen et al., 2001]. Estimates of heat dischargerates from summit fumaroles are relatively rare and rangefrom �10 MW at Mt. Hood [Friedman et al., 1982] andMt. Rainier [Frank, 1995] to 12–82 MW at Mt. Baker in
Table 2. Constant Simulation Parameters
Parameter Value
Porosity of basal unit 0.01Porosity of conduit 0.15Thermal conductivity of basal unit 2.5 W m�1 K�1
Thermal conductivity of upper unit 2.0 W m�1 K�1
Thermal conductivity of conduit 2.0 W m�1 K�1
Rock density 2500 kg m�3
Precipitation temperature 5�CRadius of intense heat source 2.1 or 2.9 kmRadius of cylindrical region 8.3 kmPrecipitation on the cylinder upper boundary 0.05 m yr�1
Background basal heat flow 100 mW m�2
ECV 1 - 6 HURWITZ ET AL.: WATER TABLE WITHIN VOLCANIC EDIFICES
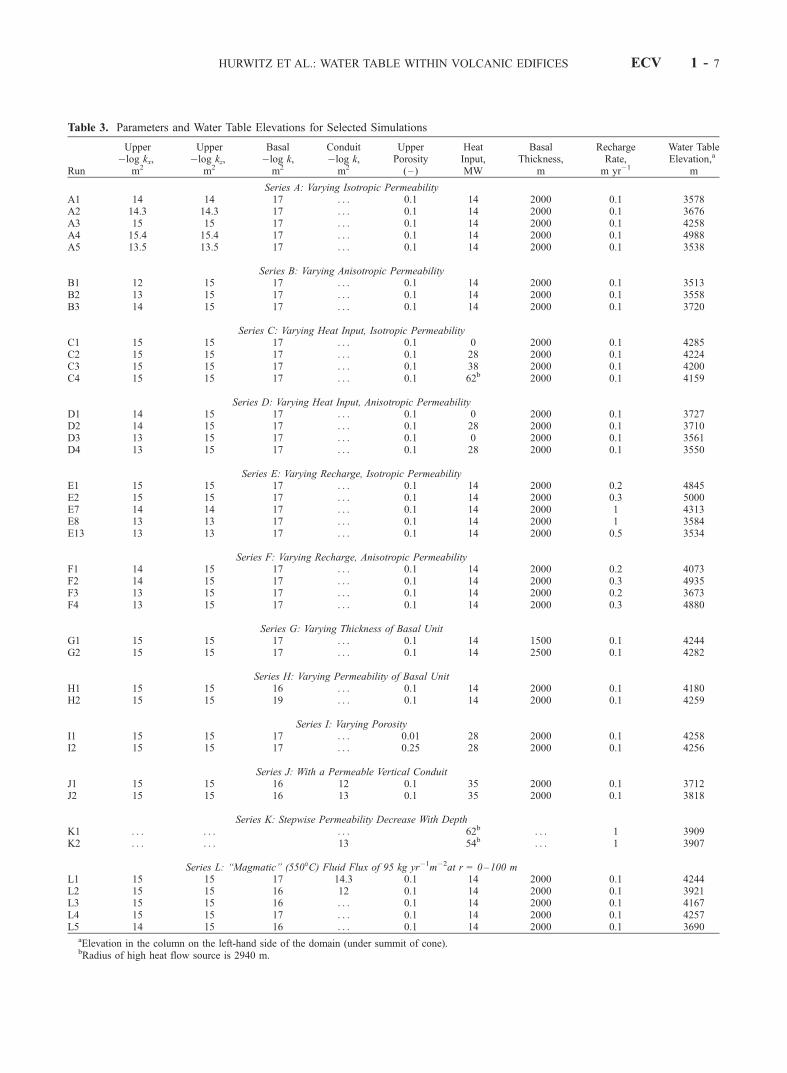
Table 3. Parameters and Water Table Elevations for Selected Simulations
Run
Upper�log kx,
m2
Upper�log kz,
m2
Basal�log k,m2
Conduit�log k,m2
UpperPorosity(– )
HeatInput,MW
BasalThickness,
m
RechargeRate,m yr�1
Water TableElevation,a
m
Series A: Varying Isotropic PermeabilityA1 14 14 17 . . . 0.1 14 2000 0.1 3578A2 14.3 14.3 17 . . . 0.1 14 2000 0.1 3676A3 15 15 17 . . . 0.1 14 2000 0.1 4258A4 15.4 15.4 17 . . . 0.1 14 2000 0.1 4988A5 13.5 13.5 17 . . . 0.1 14 2000 0.1 3538
Series B: Varying Anisotropic PermeabilityB1 12 15 17 . . . 0.1 14 2000 0.1 3513B2 13 15 17 . . . 0.1 14 2000 0.1 3558B3 14 15 17 . . . 0.1 14 2000 0.1 3720
Series C: Varying Heat Input, Isotropic PermeabilityC1 15 15 17 . . . 0.1 0 2000 0.1 4285C2 15 15 17 . . . 0.1 28 2000 0.1 4224C3 15 15 17 . . . 0.1 38 2000 0.1 4200C4 15 15 17 . . . 0.1 62b 2000 0.1 4159
Series D: Varying Heat Input, Anisotropic PermeabilityD1 14 15 17 . . . 0.1 0 2000 0.1 3727D2 14 15 17 . . . 0.1 28 2000 0.1 3710D3 13 15 17 . . . 0.1 0 2000 0.1 3561D4 13 15 17 . . . 0.1 28 2000 0.1 3550
Series E: Varying Recharge, Isotropic PermeabilityE1 15 15 17 . . . 0.1 14 2000 0.2 4845E2 15 15 17 . . . 0.1 14 2000 0.3 5000E7 14 14 17 . . . 0.1 14 2000 1 4313E8 13 13 17 . . . 0.1 14 2000 1 3584E13 13 13 17 . . . 0.1 14 2000 0.5 3534
Series F: Varying Recharge, Anisotropic PermeabilityF1 14 15 17 . . . 0.1 14 2000 0.2 4073F2 14 15 17 . . . 0.1 14 2000 0.3 4935F3 13 15 17 . . . 0.1 14 2000 0.2 3673F4 13 15 17 . . . 0.1 14 2000 0.3 4880
Series G: Varying Thickness of Basal UnitG1 15 15 17 . . . 0.1 14 1500 0.1 4244G2 15 15 17 . . . 0.1 14 2500 0.1 4282
Series H: Varying Permeability of Basal UnitH1 15 15 16 . . . 0.1 14 2000 0.1 4180H2 15 15 19 . . . 0.1 14 2000 0.1 4259
Series I: Varying PorosityI1 15 15 17 . . . 0.01 28 2000 0.1 4258I2 15 15 17 . . . 0.25 28 2000 0.1 4256
Series J: With a Permeable Vertical ConduitJ1 15 15 16 12 0.1 35 2000 0.1 3712J2 15 15 16 13 0.1 35 2000 0.1 3818
Series K: Stepwise Permeability Decrease With DepthK1 . . . . . . . . . 62b . . . 1 3909K2 . . . . . . 13 54b . . . 1 3907
Series L: ‘‘Magmatic’’ (550�C) Fluid Flux of 95 kg yr�1m�2at r = 0–100 mL1 15 15 17 14.3 0.1 14 2000 0.1 4244L2 15 15 16 12 0.1 14 2000 0.1 3921L3 15 15 16 . . . 0.1 14 2000 0.1 4167L4 15 15 17 . . . 0.1 14 2000 0.1 4257L5 14 15 16 . . . 0.1 14 2000 0.1 3690
aElevation in the column on the left-hand side of the domain (under summit of cone).bRadius of high heat flow source is 2940 m.
HURWITZ ET AL.: WATER TABLE WITHIN VOLCANIC EDIFICES ECV 1 - 7

1975 [Frank and Post, 1976] (see Figure 1 for locations ofCascade Range volcanoes). Apart from the clear transientincrease observed at Mt. Baker in 1975, there are few dataon the time variation of heat discharge from summitfumaroles. We assumed magmatic heat input rates of 0–62 MW in the different simulations (Table 3).[28] Few models of volcano-hydrothermal systems have
examined the role of a magmatic fluid as a mass source.Hanson [1996] showed that several factors act to focusmagmatic fluids within young transient hydrothermal sys-tems so that magmatic fluids can locally dominate meteoricfluids. The upward flux of magmatic fluids depends mainlyon the depth, composition, and dimensions of the magmabody. In selected simulations we included a mass source atthe bottom-left corner of the domain (radius 0–100 m) torepresent magmatic fluid input (series L). The flux that weinvoked (95 kg yr�1 m�2 at 550�C) is within the rangesimulated by Hanson [1996].[29] Parameters other than permeability, recharge rate, and
heat input rate (Table 3) display much less variability and aresecondary. The upper simulation unit, consisting of the coneand the upper part of the cylinder (Figure 2), was assigned aconstant thermal conductivity of 2.0 W m�1 K�1, consistentwith the range of thermal conductivities measured on coreand cuttings from the Cascade Range [Blackwell et al., 1982;Ingebritsen et al., 1994]. A slightly larger thermal conduc-tivity of 2.5 W m�1 K�1 was assigned to the basal unitbecause at temperatures higher than about 500�C, radiationbecomes an important heat transfer mechanism, resultingin higher thermal conductivities [Clauser, 1988; Buettner etal., 1998].
6. Results
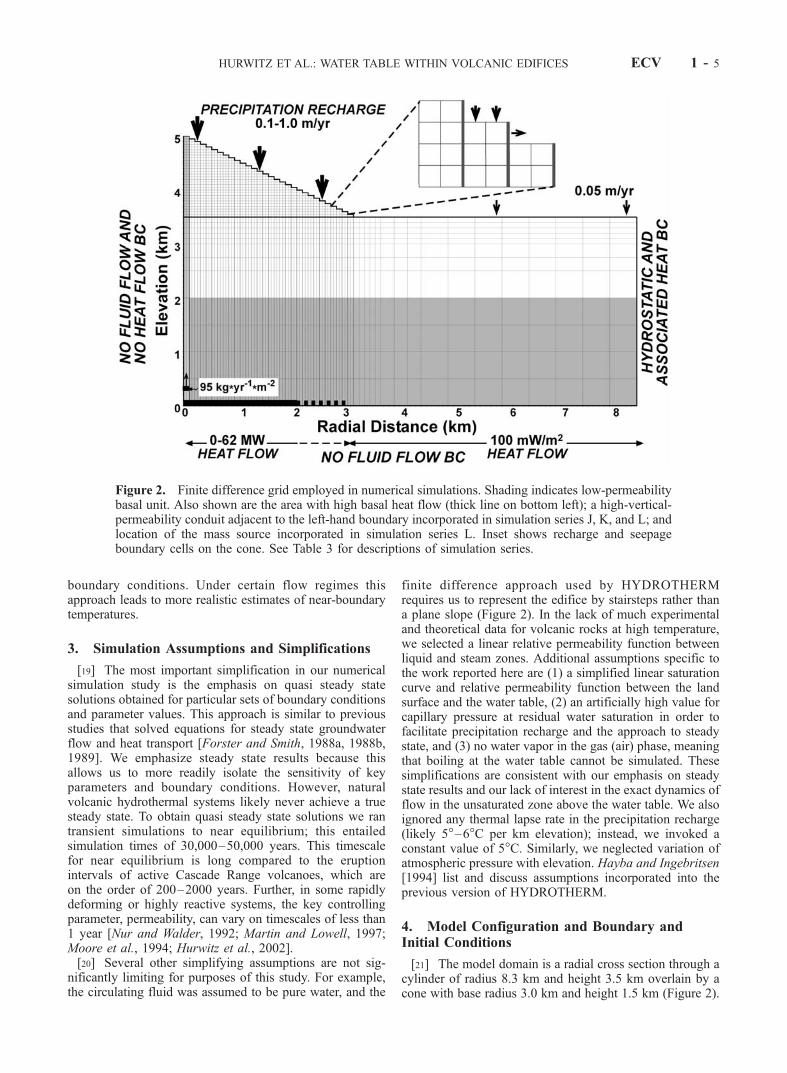
[30] Results from a suite of numerical experiments aresummarized in Table 3 and Figures 3–13. These showsteady state water table elevations, isotherms, fluid-phasedistributions, groundwater flow vectors, and temperatureand pressure profiles for selected simulations. The simula-tions were run in a transient mode (equations (1)–(4)) toquasi steady state (30,000–50,000 years); the criteria fordetermining an approximate steady state were a global heatand mass balance (output and input agreeing to within 1%)and a stable water table configuration (sum of absolutechanges for all columns between successive 200-year-longtime steps less than 10 m).[31] In most cases we treated the upper simulation unit,
which includes the cone and the upper 1500 m of thecylinder (Figure 2), as homogeneous and either isotropicor anisotropic with respect to permeability. The range ofisotropic permeabilities that we were able to consider waseffectively limited by the amount of recharge that could beaccepted (at low k values) and the penetration of coldrecharge to great depths at high k values (Figure 3). Forvertical permeabilities (kz) <5 � 10�15 m2, recharge rates�0.1 m yr�1 cause ponding on the upper boundary of thedomain. For vertical permeabilities >1 � 10�13 m2, coldprecipitation recharge flows rapidly to great depths (<10�Cwater at depths exceeding 2 km) such that the enthalpy atambient pressure is outside the HYDROTHERM equation-of-state tables. Precipitation recharge of 1 m yr�1 requiresk � 1 � 10�14 m2 in the upper unit. With a heterogeneous
permeability structure in the domain, high near-surfacekz (1 � 10�13 m2), and a strong depth-dependence of kz(Table 3, simulation series K1), we were able to simulaterecharge rates of 1.0 m yr�1 and a large basal heat input(62 MW). Varying porosity has no effect on the steady stateresults (series I in Table 3).[32] Relatively small changes in the values of the key
controlling parameters, particularly permeability and itsanisotropy, can lead to very large changes in water tableelevation, thermal structure, and phase distribution. Watertable position is sensitive to the value of isotropic perme-ability (Figure 4a and Table 3, simulation series A), consist-ent with the results of Forster and Smith [1988a, 1988b,1989]. Low permeability and high recharge leads to asaturated edifice, whereas high permeability and lowrecharge lead to a deep water table. However, the elevationof the water table is less sensitive to the value of kx for a fixedvalue of kz (Figure 4b and Table 3, simulation series B).[33] Variations in the basal heat input have a large effect
on the deep thermal structure but little effect on water tableelevation for both isotropic (Figure 5a and Table 3, simu-lation series C) and anisotropic permeabilities (Figure 5band Table 3, simulation series D). In contrast, variationsin the precipitation recharge rate have a large effect onwater table elevation (Figure 3) and a minor effect on thedeep thermal structure for both isotropic (Figure 6a) andanisotropic (Figure 6b) permeabilities (Table 3, simulationseries E and F, respectively).
Figure 3. Elevation of the water table under the peak ofthe volcano as a function of isotropic permeability andprecipitation recharge. Heat input in these simulations was14 MW and the permeability of the 2-km-thick basal unit(Figure 2) was 1 � 10�17 m2. Triangles represent simulationresults.
ECV 1 - 8 HURWITZ ET AL.: WATER TABLE WITHIN VOLCANIC EDIFICES

[34] The simulation results are not particularly sensitiveto the thickness of the low-permeability basal unit (Figure 7aand Table 3, simulation series G), but its permeability(Table 3, simulation series H) has a large effect on thethermal structure (Figure 7b), hydrodynamics, and distribu-tion of fluid phases. Under steady state conditions, theintense basal heating at the center of the simulation domaingenerates a convective flow pattern at depth. In all simu-lations with a basal heat input �14 MW, supercritical fluidand steam occur in the basal unit (Figure 8). For basal unitpermeabilities �1 � 10�17 m2, lower density fluids areconfined to the basal unit. When basal unit permeability isincreased to 1 � 10�16 m2, advective heat transport at depthbecomes significant and a steam plume can rise to nearthe water table (Figures 9c, 11c, and 11d). Cold rechargealso penetrates the basal unit, and a much more activeconvection cell forms. The permeability threshold of about1 � 10�16 m2 for transition from conduction- to advection-dominated conditions, clearly evident in this result, issimilar to that defined by previous studies [Norton and
Knight, 1977; Smith and Chapman, 1983; Manning et al.,1993; Hayba and Ingebritsen, 1997].[35] In simulation series J (Table 3) we introduce a high-
vertical-permeability conduit with a radius of 100 m at thecenter of the simulation domain (Figure 2). Beneath thecenter of the cone this enhances cold recharge, reducestemperatures, and suppresses steam formation. If basal unitpermeability is �1 � 10�16 m2 a hydrothermal plume willstill develop, but it is offset toward the flanks rather thancentrally located (Figures 10a and 10b, compare simula-tions J1 and J2 with simulation H1 in Figure 9c).[36] In simulation series K (Table 3) we invoke a stepwise
approximation of Manning and Ingebritsen’s [1999] per-meability-depth relation (log k = �14 � 3.2 log z, with z inkilometers). This permeability-depth relation, with near-surface k = 1 � 10�13 m2 and k = 1 � 10�17 m2 at thebase of the cylinder, permits both high precipitationrecharge rates (1 m yr�1) and high basal heat input rates(62 MW). The active topography-driven flow system con-fines steam to the deep sections of the domain (Figure 10c:
Figure 4. Effects of (a) varying isotropic permeability, with constant heat input and recharge rates(Table 3, simulation series A) and (b) varying anisotropic permeability, with constant heat input andrecharge rates (Table 3, simulation series B). Thin lines indicate water table elevations; thick dashed andsolid lines indicate 100� and 150�C isotherms, respectively. Gray shading is basal unit. See Table 3 fordetails of individual simulations.
HURWITZ ET AL.: WATER TABLE WITHIN VOLCANIC EDIFICES ECV 1 - 9

simulation K1). If a vertical conduit is added to thispermeability structure, cold recharge is enhanced andisotherms beneath the summit are further suppressed(Figure 10d: simulation K2).[37] In simulation series L we include a mass source at
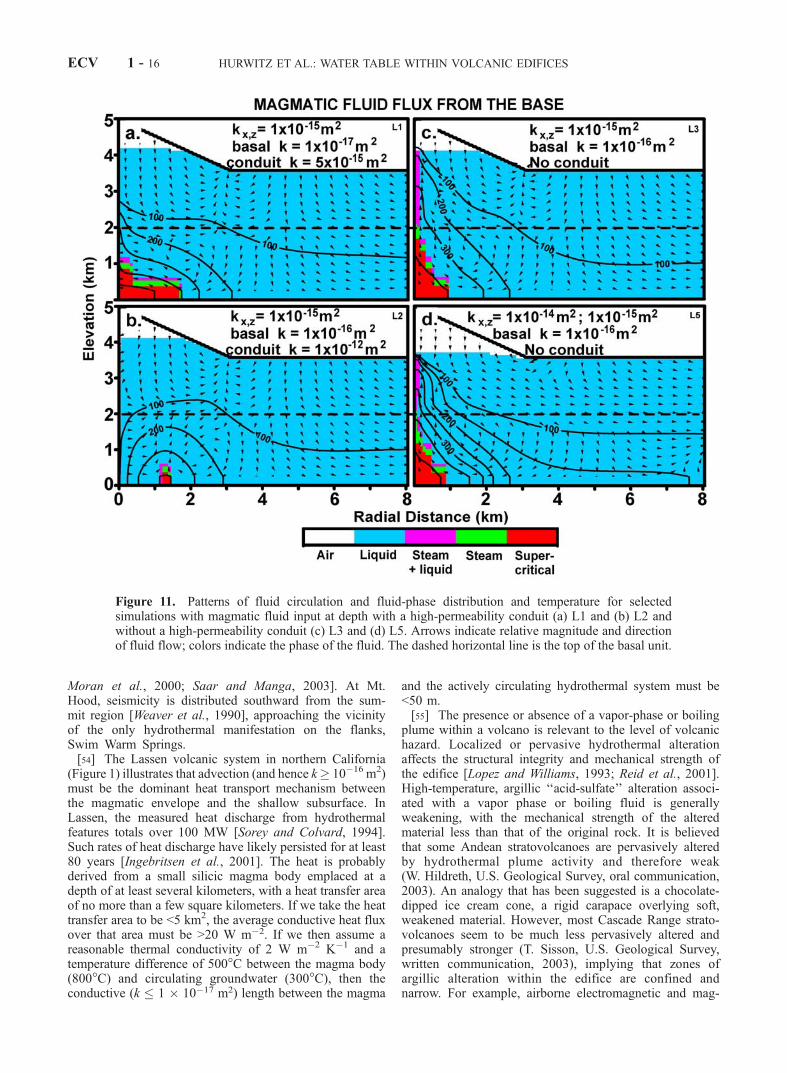
depth to represent the effects of fluid released by crystal-lizing magma. We invoke a flux of 95 kg yr�1 m�2 at550�C over r from 0 to 100 m. This value is within therange simulated by Hanson [1996] and equates to about0.1 kg s�1 of mass and 0.2 MW of heat. It is compatiblewith the focused heat input rate for this simulation series(14 MW) if one assumes that the heat is derived fromcooling magma releasing �0.5 wt % water. Such rates offluid input at depth have a negligible effect on theelevation of the water table (Table 3: compare simulationsA3 and H1, without a mass source at depth, to equivalentL4 and L3 with a mass source). However, the deep masssource has a significant effect on temperature and thedistribution of fluid phases. In simulations L3 and L5with a deep fluid source (Figure 11) a boiling plume
extends all the way to the water table, whereas the topof the boiling plume falls several hundred meters short ofthe water table in a comparable simulation without a deepfluid source (Figure 9: simulation H1). In simulations withboth a deep fluid source and a central, high-vertical-permeability conduit, cold recharge penetrates deep intothe domain and suppresses temperatures (Figure 11: sim-ulations L1 and L2).[38] Simulated fluid pressures within and below the cone
depend in large part on the water table elevation and themixture of fluid phases present at depth. The range ofpossible pressures is roughly bracketed by cold waterhydrostats with zero-pressure intercepts at 0- and 1500-mdepth (Figure 12). In cases with moderate permeabilitiesand high recharge rates, there must be a large verticalgradient for downward flow such that the pressure gradientbelow the water table is significantly less than hydrostatic(Figure 12: simulation E2). The pressure gradient canalso be subhydrostatic where low-density fluids (steam,supercritical fluid, boiling mixtures) are present at depth
Figure 5. Effects of varying heat input with (a) isotropic permeability and recharge rate and(b) anisotropic permeability and recharge rate. Thin lines indicate water table elevations; thick dashed andsolid lines indicate 100� and 150�C isotherms, respectively. Gray shading is basal unit. See Table 3 fordetails of individual simulations.
ECV 1 - 10 HURWITZ ET AL.: WATER TABLE WITHIN VOLCANIC EDIFICES

(Figure 12, departures from hydrostatic gradient below�3-km depth). The calculated pressure profile for simula-tion L3 (Figure 12) indicates that the mass flux that weinvoked in simulation series L had little effect on fluidpressures at depth.[39] In most simulations, heat transport is advection
dominated in the upper unit and conduction dominated inthe lower permeability basal unit. To evaluate the relativeefficiency of advective and conductive heat transport withinthe simulation domain, we compute a cell Nusselt number,Nu, the ratio of advective plus conductive heat flux toconductive heat flux alone, using the magnitudes of thetwo vector components:
Nu ¼rf vf��
��hf þ Km rTj jKm rTj j : ð8Þ
[40] The vector components of the temperature gradientare computed using a three-point difference formula span-ning the node location. The subscript f indicates properties
of the flowing fluid mixture (single or two phase). Thevalue of Nu approaches 100 in parts of the upper unit and isgenerally <2 in the lower unit when the permeability of thatunit is k � 1 � 10�17 m2 (Figure 13). The extremely highvalue of log Nu (4.6) at depth in simulation H1 (Figure 13)illustrates efficient transport of heat by advection adjacent tothe left-hand boundary when the basal permeability is atleast 1 � 10�16 m2.
7. Discussion
[41] The modified version of the HYDROTHERM sim-ulator used in this study allows improved representation ofvolcanic hydrothermal systems. It permits exploration of afree-surface (water table) upper boundary configuration anda wide range of recharge rates, heat input rates, andhydraulic parameters.
7.1. Permeability as a Controlling Parameter
[42] The permeability structure of the volcanic edificeand underlying material is the dominant control on many
Figure 6. Effects of varying recharge rate on the cone with (a) isotropic permeability and heat input and(b) anisotropic permeability and heat input. Thin lines indicate water table elevations; thick dashed andsolid lines indicate 100� and 150�C isotherms, respectively. Gray shading is basal unit. See Table 3 fordetails of individual simulations.
HURWITZ ET AL.: WATER TABLE WITHIN VOLCANIC EDIFICES ECV 1 - 11

system state variables of interest, including water tableconfiguration and, more generally, the distribution ofpressures, temperatures, and fluid phases at depth. For agiven permeability structure, variations in heat input havea small effect on water table elevation and a large effect onthe deep thermal structure (Figures 4a and 4b), whereasvariations in the precipitation recharge rate have a largeeffect on water table elevation and a small effect on thedeep thermal structure (Figures 5a and 5b).[43] When permeabilities are isotropic, water table eleva-
tion decreases with increasing heat flux, consistent withresults of Forster and Smith [1988b, 1989] (Figure 5a). Thisis because high heat flow tends to decrease fluid viscosity,increasing hydraulic conductivity so that the same amountof topography-driven flow can be accommodated with amilder water table gradient. Moreover, our simulationsshow that a water table within a homogeneous, isotropiccone only exists for a restricted range of recharge rates andpermeabilities (Figure 3). Outside this range, the cone iseither unsaturated or fully saturated. When permeabilitiesare anisotropic this effect can be much less pronounced(Figure 5b).
[44] Our simulations suggest that several conditionsfacilitate the ascent of a hydrothermal plume (defined forour purposes as a plume with elevated fluid temperaturescontaining some vapor): a sufficient heat source at depth toinduce strong buoyancy forces; a deep flux of exsolvedmagmatic volatiles; a relatively weak topography-drivenflow system; and the existence of a moderate-permeability(k � 10�16 m2) pathway between the deep high-temperaturesource and the shallow interior of the cone.[45] The inferred limiting permeability of k � 10�16 m2
for the transition between advection- and conduction-dominated thermal regimes (Figure 9: simulation H1) isconsistent with previous theoretical studies. High rates ofheat exchange between magma and groundwater permitonly a thin ‘‘conductive boundary layer’’ (k � 10�17 m2)between magma and actively circulating fluid [cf. Lister,1974; Lowell and Germanovich, 1994].[46] Forster and Smith [1989] demonstrated that an
optimum permeability configuration for focused hydrother-mal discharge is a subvertical, high-permeability conduitembedded in a moderate-permeability matrix. In the contextof a volcanic edifice, the summit vent area (Figure 2) is an
Figure 7. Effects of varying (a) basal unit thickness and (b) basal unit permeability. Thin lines indicatewater table elevations; thick dashed and solid lines indicate 100� and 150�C contours, respectively. Grayshading is basal unit. See Table 3 for details of individual simulations.
ECV 1 - 12 HURWITZ ET AL.: WATER TABLE WITHIN VOLCANIC EDIFICES

obvious candidate location for the top of a conduit. How-ever, a high-permeability conduit underlying the summitwill not necessarily promote development of a hydrothermalplume because of the competing effect of topography-driven recharge (Figure 11).
7.2. Application to Stratovolcanoes in theCascade Range
[47] The scarcity of deep drill holes on Cascade Rangevolcanoes limits our ability to directly infer the elevation ofthe water table or measure temperatures and pressures atdepth. However, there are some data to guide our interpre-tation of the simulation results, including observations offumaroles and thermal springs and a few borehole-temper-ature profiles, mainly from edifice flanks.[48] There are important physiographic and hydrogeologic
differences between the low-angle shield volcanoes and thesteep stratovolcanoes in the Cascade Range (Figure 1). Theshields have summit elevations of approximately 2500 mabove mean sea level (msl), are usually ice free, and havelittle visible fumarolic activity. Newberry in Oregon and
Medicine Lake in northern California, the best exploredshield volcanoes in the Cascade Range, have shallow summitcalderas partly occupied by lakes and road networks thathave facilitated drilling of centrally located drill holes.Drilling has encountered temperatures of 265�C at a depthof 930 m in well USGS-N2 at Newberry Caldera [Sammel etal., 1988] and 260�C at 2450 m in well 31-17 at MedicineLake [Lutz et al., 2000]. At Newberry, well bore temperatureprofiles indicate a complex pattern of high-temperatureadvective heat transport below about 300-m depth and seemto constrain the water table position to 0–300 m depth.[49] Our simulations (Figure 2 and Table 3) focus on the
steeper stratovolcanoes. These are believed to pose greatervolcanic hazards than the shields because of their tendencytoward more explosive eruptions and potential for slopefailure and lahar generation. Stratovolcano summit elevationsin the Cascade Range vary from �3000 m (Mt. St. Helensafter the 1980 eruption) to�4400 m above msl (Mt. Rainier).Most stratovolcanoes have thick and extensive icecaps fillingsummit craters and flank valleys [Driedger and Kennard,1986; Kennard and Driedger, 1986]. Of the Cascade Range
Figure 8. Patterns of fluid circulation, fluid-phase, and temperature for simulations (a) A1 and (b) A3with varying isotropic permeability, and (c) B1 and (d) B3 with varying anisotropic permeability. Arrowsindicate relative magnitude and direction of fluid flow; colors indicate the phase of the fluid. In all ofthese simulations the permeability of the basal unit was 1 � 10�17 m2, basal heat input was 14 MW, andrecharge into the cone was 0.1 m yr�1 (Table 3). The dashed horizontal line is the top of the basal unit.
HURWITZ ET AL.: WATER TABLE WITHIN VOLCANIC EDIFICES ECV 1 - 13

stratovolcanoes, only the Crater Lake caldera, Oregon(former Mt. Mazama), has a large, exposed lake, althoughMt. Rainier has a small lake under ice in one of its summitcraters. Fumarolic activity at most of the stratovolcanoes isfocused at the summit or within the summit crater withadditional but generally less extensive activity on the flanks(e.g., Mt. Rainier, Mt. St. Helens, Mt. Hood, Mt. Shasta).At Mt. Baker, fumarolic activity occurs on the margins of theicecap at Sherman Crater, approximately 400 m below thesummit [Frank and Post, 1976]. At some stratovolcanoesthere is no apparent fumarolic activity (Mt. Jefferson,Mt. Adams). In the Cascade Range, lateral outflow ofhydrothermal fluid from beneath many stratovolcanoesappears to feed high-chloride hot springs located up to tensof kilometers away [Ingebritsen et al., 1989].[50] Among theCascadeRange stratovolcanoes (Figure 1),
Mt. Hood, Oregon, is relatively rich in drill hole informationowing to geothermal reconnaissance in the 1970s and early1980s. Even at Mt. Hood, however, all of the drill holes areat least a 5-km lateral distance from the summit, and the
highest wellhead is nearly a 2-km vertical distance belowthe summit. Temperature profiles in drill holes indicate thatheat flow increases toward the summit region, suggestingthat the buoyancy forces advecting heat upward are rela-tively strong in comparison to the topography-driven flowsystem [Nathenson and Tilling, 1993]. The deep Pucci drillhole near Timberline Lodge was drilled to 1130-m depthfrom an elevation of 1628 m (1800 m below the summit).The standing water level in the Pucci well was 573 m belowthe land surface after completion of drilling in 1980[Robison et al., 1981]. Bottom hole temperature was76�C. These data suggest that the water table under thevolcano is relatively deep unless groundwater beneaththe summit region is impounded by dikes, as originallyproposed by O. E. Meinzer [Stearns and Clark, 1930] forHawaiian volcanoes. An alternative explanation of thePucci well water-level observations is that the water tableis relatively shallow and that there is a large potentialgradient for downward flow. For example, in simulationE2 the water table is located at the land surface, but the
Figure 9. Patterns of fluid circulation, fluid-phase distribution, and temperature in simulations withrelatively high heat input (28 MW) and (a) isotropic permeability and (b) anisotropic permeability andsimulations with lower heat input (14 MW) and (c) relatively high basal permeability and (d) low basalpermeability. Arrows indicate relative magnitude and direction of fluid flow; colors indicate the phase ofthe fluid. In all of these simulations recharge into the cone was 0.1 m yr�1. The dashed horizontal line isthe top of the basal unit.
ECV 1 - 14 HURWITZ ET AL.: WATER TABLE WITHIN VOLCANIC EDIFICES

calculated pressure at 1130-m depth (Figure 12) wouldindicate a water table about 700 m below land surface.[51] These sparse observations from Cascade Range
stratovolcanoes best compare with simulations having adeep mass source, high heat input rates, k � 1 � 10�16 m2
in the basal unit, anisotropic permeability in the upper unit,and a low precipitation-recharge rate (e.g., Figure 11:simulation L5). In such simulations the water table is nearthe base of the cone and a vapor phase and the 100�Cisotherm are near the water table. This and similar simula-tions seem to capture the essential components of the system.[52] The inferred low recharge rates are not consistent
with watershed-scale water budget studies in Quaternaryrocks of the Oregon Cascades that suggest precipitationrecharge rates on the order of 1 m yr�1 [Ingebritsen et al.,1992; Manga, 1997]. We speculate that near-summitrecharge rates are significantly lower than those from thewater budget studies because precipitation on a high edificefalls as snow and accumulates into thick glaciers that formseals, retarding percolation into the volcanic cone. Mostglacial ice melts below the firn line, well below the summit
of the volcano. This could tend to reduce subsummit watertable elevations and weaken the topography-driven flowsystems, enhancing the probability of significant hydrother-mal upflow.[53] The inference of a permeable conduit existing from
the land surface to near-magma depths contrasts withresults of laboratory experiments in crystalline rocksand theoretical studies, which have demonstrated that inhydrothermal systems secondary mineral precipitation andthermomechanical forces can decrease permeabilities from1 � 10�16 m2 to less than 1 � 10�20 m2 in as little asseveral days [Vaughan et al., 1986; Moore et al., 1994;Martin and Lowell, 1997]. Perhaps frequent seismicityis required to maintain sufficient effective permeabilityfor hydrothermal upflow over time. Several sets ofobservations suggest a causal relationship between deephydrothermal circulation and low-level seismicity [Saarand Manga, 2003]. At Mt. Rainier, Mt. St. Helens, andMt. Hood (Figure 1), several high-frequency volcano-tectonic earthquakes occur each month at depths of3 km or greater beneath the summit [Moran, 1994;
Figure 10. Patterns of fluid circulation, fluid-phase distribution, and temperature showing effects of apermeable vertical conduit in simulations (a) J1 and (b) J2 and effects of permeability decreasing withdepth in simulations (c) K1 with a vertical permeable conduit and (d) K2 without a vertical conduit.Arrows indicate relative magnitude and direction of fluid flow; colors indicate the phase of the fluid. Thedashed horizontal line is the top of the basal unit.
HURWITZ ET AL.: WATER TABLE WITHIN VOLCANIC EDIFICES ECV 1 - 15
Moran et al., 2000; Saar and Manga, 2003]. At Mt.Hood, seismicity is distributed southward from the sum-mit region [Weaver et al., 1990], approaching the vicinityof the only hydrothermal manifestation on the flanks,Swim Warm Springs.[54] The Lassen volcanic system in northern California
(Figure 1) illustrates that advection (and hence k� 10�16 m2)must be the dominant heat transport mechanism betweenthe magmatic envelope and the shallow subsurface. InLassen, the measured heat discharge from hydrothermalfeatures totals over 100 MW [Sorey and Colvard, 1994].Such rates of heat discharge have likely persisted for at least80 years [Ingebritsen et al., 2001]. The heat is probablyderived from a small silicic magma body emplaced at adepth of at least several kilometers, with a heat transfer areaof no more than a few square kilometers. If we take the heattransfer area to be <5 km2, the average conductive heat fluxover that area must be >20 W m�2. If we then assume areasonable thermal conductivity of 2 W m�2 K�1 and atemperature difference of 500�C between the magma body(800�C) and circulating groundwater (300�C), then theconductive (k � 1 � 10�17 m2) length between the magma
and the actively circulating hydrothermal system must be<50 m.[55] The presence or absence of a vapor-phase or boiling
plume within a volcano is relevant to the level of volcanichazard. Localized or pervasive hydrothermal alterationaffects the structural integrity and mechanical strength ofthe edifice [Lopez and Williams, 1993; Reid et al., 2001].High-temperature, argillic ‘‘acid-sulfate’’ alteration associ-ated with a vapor phase or boiling fluid is generallyweakening, with the mechanical strength of the alteredmaterial less than that of the original rock. It is believedthat some Andean stratovolcanoes are pervasively alteredby hydrothermal plume activity and therefore weak(W. Hildreth, U.S. Geological Survey, oral communication,2003). An analogy that has been suggested is a chocolate-dipped ice cream cone, a rigid carapace overlying soft,weakened material. However, most Cascade Range strato-volcanoes seem to be much less pervasively altered andpresumably stronger (T. Sisson, U.S. Geological Survey,written communication, 2003), implying that zones ofargillic alteration within the edifice are confined andnarrow. For example, airborne electromagnetic and mag-
Figure 11. Patterns of fluid circulation and fluid-phase distribution and temperature for selectedsimulations with magmatic fluid input at depth with a high-permeability conduit (a) L1 and (b) L2 andwithout a high-permeability conduit (c) L3 and (d) L5. Arrows indicate relative magnitude and directionof fluid flow; colors indicate the phase of the fluid. The dashed horizontal line is the top of the basal unit.
ECV 1 - 16 HURWITZ ET AL.: WATER TABLE WITHIN VOLCANIC EDIFICES

netic data from Mt. Rainier show that hydrothermallyaltered rock (mostly buried) occurs mainly within theupper west flank of the volcano, where it is associatedwith a zone of open fractures and radial dikes emplacedduring episodes of heightened magmatic activity. Much ofthe altered material under the summit was removed by theOsceola Mudflow 5600 years ago [Vallance and Scott,1997]. Currently, negligible amounts of altered rock lie inthe volcano’s core, where stronger rocks would impedecollapse retrogression and limit the volumes and inunda-tion areas of debris flows [Finn et al., 2001; Reid et al.,2001].[56] The presence or absence of a hydrothermal plume
within a volcano is also relevant to the potential forgeothermal resources and mineralization. Our simulationssuggest that only under a narrow range of conditions(e.g., Figure 8, simulation H1; Figure 11, simulation L3)will a high water table (thus sufficient water for produc-tion) and a significant hydrothermal plume develop withinthe edifice. Therefore expensive drilling for geothermalexploration on upper flanks of Cascade Range stratovol-canoes is unlikely to be productive. The simulationresults also suggest that ore minerals associated withargillic acid-sulfate alteration, usually related to a boilingfluid, may often be restricted to deeper parts of the
edifice and/or to fracture zones near the central vent ofthe volcano.
7.3. Implications of a Deep Water Table
[57] Both our simulation results and the sparse fieldobservations from Mt. Hood suggest that water tableswithin Cascade Range stratovolcanoes may be relativelydeep, as seems to be the case for many Hawaiian volcanoes,despite high recharge rates [e.g., Stearns and Clark, 1930;Stearns and MacDonald, 1946]. A deep water table hasimplications for several classes of volcanic hazards.For instance, above the water table there cannot be signif-icantly elevated fluid pressures to enhance the potentialfor slope failure (although there could be local zones ofperched water). Phreatic eruptions from volcanoes withdeep water tables are not likely to occur in response togroundwater flow toward the conduit [Mastin, 1997] butmight be triggered instead by shallow intrusion and local-ized recharge by melted snow and ice. Water to generatelahars would be unlikely to come from the saturated zonebut might be supplied by snow and ice and shallowgroundwater ‘‘perched’’ on low-permeability altered zones.[58] A cone that is fully saturated by cold groundwater
under near-hydrostatic conditions will tend to suppresshydrothermal upflow. Thus the presence of hydrothermaldischarge or pervasive alteration high on the edifice
Figure 12. Calculated pressure profiles near the axis of thedomain (r = 25 m) for selected simulations. Gray shading isbasal unit.
Figure 13. Calculated temperature (dashed) and log Nu(solid) profiles for simulations H1 and H2 (Figures 9c and9d and Table 3) at a radial distance of 25 m from the axis ofthe domain. Gray shading is basal unit.
HURWITZ ET AL.: WATER TABLE WITHIN VOLCANIC EDIFICES ECV 1 - 17

supports the supposition that topography-driven downflowis somehow restricted. The necessary restriction may berelated to permeability heterogeneity and/or the availabilityof precipitation recharge. As the edifice evolves overgeologic time, there may be a positive feedback betweenhydrothermal alteration and water table elevation as alter-ation tends to decrease the permeability of the rock as wellas its mechanical strength [Hurwitz et al., 2002].
7.4. Future Work
[59] The simulations we report here lay a foundation forfuture field and theoretical investigations. Deep drillinghigh on stratovolcanoes in the Cascade Range is logisticallychallenging, expensive, and unlikely to occur in the nearfuture. Thus observational investigations must rely oninference. We suggest that high-resolution airborne mea-surements of electrical resistivity, magnetic susceptibility,and visible/infrared imaging spectrometry (AVIRIS), thatwere applied successfully at Mt. Rainier [Crowley andZimbelman, 1997; Finn et al., 2001] may help to betterdefine the distribution of hydrothermal fluids and/or alter-ation within volcanic edifices. Long-term, high-frequencymeasurements of steam and gas discharge and correlation ofthese data with seismic and stress measurements may allowinferences regarding the dynamics of these systems, inparticular the relationship between hydrothermal circula-tion, deformation, and seismicity. Finally, field observationand mapping of groundwater discharge under late summerconditions may help to define water table elevations.[60] In this paper we have focused on quasi steady state
numerical simulations in order to evaluate the sensitivity ofwater table elevation and hydrothermal circulation to con-trolling parameters and to facilitate comparison with steadystate results reported by previous investigators. The result-ing suite of quasi-steady solutions (Table 3), obtainedthrough long-term transient simulations, also prepares theway for meaningful simulation of shorter-term transienteffects. It defines feasible sets of initial conditions forsimulation of transient processes such as injection of mag-matic heat and fluids, changes in the rates and distributionof precipitation recharge, or system modification due togeothermal development.
8. Summary and Conclusions
[61] We have modified the HYDROTHERM numericalsimulator to include several additional types of boundaryconditions, which allowed simulations that represent conti-nental volcano-hydrothermal systems. We evaluated thesensitivity of water table elevation and hydrothermal circu-lation to a wide range of recharge rates, heat input rates, andhydraulic parameters. Simulation results were compared toobservations from the Quaternary stratovolcanoes along theCascade Range in the western United States to obtaininformation about hydrothermal processes.[62] The permeability structure of the volcanic edifice and
underlying material is the dominant control on water tableconfiguration and the distribution of pressures, temper-atures, and fluid phases at depth. Active hydrothermalcirculation within the edifice requires a pathway with atime-averaged permeability of at least k � 10�16 m2 to existbetween a high-temperature source and the interior of the
cone. Such a permeability may be maintained by frequentseismicity. In our simulations with a low-permeability basalunit (�1 � 10�17), heat transport at depth is dominated byconduction and temperatures at shallow depths remain wellbelow the boiling curve.[63] Several conditions facilitate the ascent of a hydro-
thermal plume into a volcanic edifice: a sufficient source ofheat and magmatic volatiles at depth, strong buoyancyforces, and a relatively weak topography-driven flow sys-tem. Deep recharge of cold groundwater may be restrictedby low edifice permeability and/or the lack of precipitation.Extensive ice cover on most Cascade Range stratovolcanoesmay restrict recharge beneath the summits.[64] Both our simulation results and the sparse field
observations allow the possibility that the water tablebeneath Cascade Range stratovolcanoes is relatively deep,implying (1) a weak topography-driven flow system,enhancing the probability of hydrothermal upflow, (2) anabsence of significantly elevated fluid pressures in theuppermost part of the cone, (3) that phreatic eruptions fromsuch volcanoes are not likely to occur in response togroundwater flow toward the conduit, and (4) that largevolumes of water necessary to generate lahars would beunlikely to come from the saturated zone but might besupplied by snow, ice, and shallow ‘‘perched’’ groundwater.
[65] Acknowledgments. We thank Grant Garven, Larry Mastin,Martin Saar, Tom Sisson, and Claire Tiedeman for very helpful commentsand constructive reviews.
ReferencesBlack, G. L., Newberry hydrology, Oreg. Dep. Geol. Miner. Ind. Open FileRep. O-83-3, pp. 29–36, 1983.
Blackwell, D. D., R. G. Bowen, D. A. Hull, J. Riccio, and J. L. Steele, Heatflow, arc volcanism, and subduction in northern Oregon, J. Geophys.Res., 87, 8735–8754, 1982.
Brace, W. F., Permeability of crystalline and argillaceous rocks, Int. J. RockMech. Min. Sci. Geomech. Abstr., 17, 241–251, 1980.
Brace, W. F., Permeability of crystalline rocks: New in situ measurements,J. Geophys. Res., 89, 4327–4330, 1984.
Buettner, R., B. Zimanowski, J. Blumm, and L. Hagemann, Thermal con-ductivity of a volcanic rock material (olivine-melilitite) in the temperaturerange between 288 and 1470 K, J. Volcanol. Geotherm. Res., 80, 293–302, 1998.
Cathles, L. M., An analysis of the cooling of intrusives by ground-waterconvection which includes boiling, Econ. Geol., 72, 804–826, 1977.
Clauser, C., Opacity: The concept of radiative thermal conductivity, inHandbook of Terrestrial Heat-Flow Density Determination, edited byR. Haenel, pp. 143–165, Kluwer Acad., Norwell, Mass., 1988.
Crowley, J. K., and D. R. Zimbelman, Mapping hydrothermally alteredrocks on Mount Rainier, Washington, with Airborne Visible/InfraredImaging Spectrometer (AVIRIS) data, Geology, 25, 559–562, 1997.
Driedger, C. L., and P. M. Kennard, Ice volumes on Cascade volcanoes:Mount Rainier, Mount Hood, Three Sisters, and Mount Shasta, U.S.Geol. Surv. Prof. Pap., 1365, 28, 1986.
Faust, C. R., and J. W. Mercer, Geothermal reservoir simulation, 1, Math-ematical models for liquid- and vapor-dominated hydrothermal systems,Water Resour. Res., 15, 23–30, 1979.
Finn, C. A., T. W. Sisson, and M. Deszcz-Pan, Aerogeophysical measure-ments of collapse-prone hydrothermally altered zones at Mount RainierVolcano, Nature, 409, 600–603, 2001.
Forster, C. B., and L. Smith, Groundwater flow systems in mountainousterrain, 1, Numerical modeling technique, Water Resour. Res., 24, 999–1010, 1988a.
Forster, C. B., and L. Smith, Groundwater flow systems in mountainousterrain: 2. Controlling factors,Water Resour. Res., 24, 1011–1023, 1988b.
Forster, C. B., and L. Smith, The influence of groundwater flow on thermalregimes in mountainous terrain: A model study, J. Geophys. Res., 94,9439–9451, 1989.
Frank, D. G., Surficial extent and conceptual model of hydrothermal systemat Mount Rainier, Washington, J. Volcanol. Geotherm. Res., 65, 51–80,1995.
ECV 1 - 18 HURWITZ ET AL.: WATER TABLE WITHIN VOLCANIC EDIFICES
Frank, D. G., and A. S. Post, Hydrothermal activity at Mount Baker,Washington, U.S. Geol. Surv. Prof. Pap., 1000, 170–171, 1976.
Friedman, J. D., D. L. Williams, and D. Frank, Structural and heat flowimplications of infrared anomalies at Mt. Hood, Oregon, 1972–1977,J. Geophys. Res., 87, 2793–2803, 1982.
Hanson, R. B., Hydrodynamics of magmatic and meteoric fluids in thevicinity of granitic intrusions, Spec. Pap. Geol. Soc. Am., 315, 251–259, 1996.
Hasabe, K., N. Fujii, and S. Uyeda, Thermal processes under island arcs,Tectonophysics, 10, 335–355, 1970.
Hayba, D. O., and S. E. Ingebritsen, The computer model HYDROTHERM,a three-dimensional finite-difference model to simulate ground-waterflow and heat transport in the temperature range of 0 to 1,200 degreesCelsius, U.S. Geol. Surv. Water Res. Invest. Rep. 94-4045, 85 pp., 1994.
Hayba, D. O., and S. E. Ingebritsen, Multiphase groundwater flow nearcooling plutons, J. Geophys. Res., 102, 12,235–12,252, 1997.
Hurwitz, S., S. E. Ingebritsen, and M. L. Sorey, Episodic thermal perturba-tions associated with groundwater flow: An example from Kilauea Vol-cano, Hawaii, J. Geophys. Res., 107(B11), 2297, doi:10.1029/2001JB001654, 2002.
Ingebritsen, S. E., and W. E. Sanford, Groundwater in Geologic Processes,Cambridge Univ. Press, New York, 1998.
Ingebritsen, S. E., D. R. Sherrod, and R. H. Mariner, Heat flow and hydro-thermal circulation in the Cascade Range, north-central Oregon, Science,243, 1458–1462, 1989.
Ingebritsen, S. E., D. R. Sherrod, and R. H. Mariner, Rates and patterns ofgroundwater flow in the Cascade Range volcanic arc, and the effect onsubsurface temperatures, J. Geophys. Res., 97, 4599–4627, 1992.
Ingebritsen, S. E., R. H. Mariner, and D. R. Sherrod, Hydrothermal systemsof the Cascade Range, north-central Oregon, U.S. Geol. Surv. Prof. Pap.,1044-L, 86, 2 plates, 1994.
Ingebritsen, S. E., D. L. Galloway, E. M. Colvard, M. L. Sorey, and R. H.Mariner, Time-variation of hydrothermal discharge at selected sites in thewestern United States: Implications for monitoring, J. Volcanol.Geotherm. Res., 111, 1–23, 2001.
Iverson, R. M., and M. E. Reid, Gravity-driven groundwater flow and slopefailure potential, 1, Elastic effective-stress model, Water Resour. Res., 28,925–938, 1992.
Jamieson, G. R., and R. A. Freeze, Determining hydraulic conductivitydistributions in a mountainous area using mathematical modeling,Ground Water, 21, 168–177, 1983.
Keller, G. V., L. T. Grose, J. C. Murray, and C. K. Skokan, Results of anexperimental drill hole at the summit of Kilauea Volcano, Hawaii,J. Volcanol. Geotherm. Res., 5, 345–385, 1979.
Kennard, P. M., and C. L. Driedger, Estimated ice volumes on Cascadevolcanoes: Mounts Baker, Glacier, Adams, and Jefferson (abstract), Geol.Soc. Am. Abstr. Programs, 18, 124, 1986.
Lister, C. R. B., On the penetration of water into hot rock, Geophys. J. R.Astron. Soc., 39, 465–509, 1974.
Lopez, D. L., and S. N. Williams, Catastrophic volcanic collapse: Relationto hydrothermal processes, Science, 260, 1794–1796, 1993.
Lowell, R. P., and L. N. Germanovich, On the temporal evolution of high-temperature hydrothermal systems at ocean ridge crests, J. Geophys. Res.,99, 565–575, 1994.
Lutz, S. J., J. B. Hulen, and A. Schriener, Alteration, geothermometry, andgranitoid in Well 37-17, Medicine Lake Volcano geothermal system,California, paper presented at 25th Workshop on Geothermal ReservoirEngineering, Stanford Univ., Stanford, Calif., 2000.
Manga, M., Hydrology of spring-dominated streams in the OregonCascades, Water Resour. Res., 32, 2435–2439, 1996.
Manga, M., A model for discharge in spring-dominated streams andimplications for the transmissivity and recharge of Quaternary volcanicsin the Oregon Cascades, Water Resour. Res., 33, 1813–1822, 1997.
Manning, C. E., and S. E. Ingebritsen, Permeability of the continental crust:Implications of geothermal data and metamorphic systems, Rev. Geo-phys., 37, 127–150, 1999.
Manning, C. E., S. E. Ingebritsen, and D. K. Bird, Missing mineral zones incontact metamorphosed basalts, Am. J. Sci., 293, 894–938, 1993.
Mariner, R. H., T. S. Presser, W. C. Evans, and M. K. W. Pringle, Dischargerates of fluid and heat by thermal springs of the Cascade Range,Washington, Oregon, and northern California, J. Geophys. Res., 95,19,517–19,532, 1990.
Martin, J. T., and R. P. Lowell, On thermoelasticity and silica precipitationin hydrothermal systems: Numerical modeling of laboratory experiments,J. Geophys. Res., 102, 12,095–12,107, 1997.
Mastin, L. G., Evidence for water influx from a caldera lake during theexplosive eruption of 1790, Kilauea Volcano, Hawaii, J. Geophys. Res.,102, 20,093–20,109, 1997.
Moore, D. E., D. A. Lockner, and J. D. Byerlee, Reduction of permeabilityin granite at elevated temperatures, Science, 265, 1558–1561, 1994.
Moran, S. C., Seismicity at Mount St. Helens, 1987–1992: Evidence forrepressurization of an active magmatic system, J. Geophys. Res., 99,4341–4354, 1994.
Moran, S. C., D. R. Zimbelman, and S. D. Malone, A model for themagmatic-hydrothermal system at Mount Rainier, Washington, fromseismic and geochemical observations, Bull. Volcanol., 61, 425–436,2000.
Nathenson, M., and R. I. Tilling, Conductive heat transfer from an isother-mal magma chamber and its application to the measured heat flow dis-tribution from Mount Hood, Oregon, Trans. Geotherm. Resour. Counc.,17, 141–148, 1993.
Norton, D., and J. E. Knight, Transport phenomena in hydrothermal sys-tems: Cooling plutons, Am. J. Sci., 277, 937–981, 1977.
Nur, A., and J. Walder, Hydraulic pulses in the Earth’s crust, in FaultMechanics and Transport Properties of Rocks: A Festschrift in Honorof W. F. Brace, edited by B. Evans and T. F. Wong, pp. 461–474, Aca-demic, San Diego, Calif., 1992.
Reid, M. E., and R. M. Iverson, Gravity-driven groundwater flow and slopefailure potential: 2. Effects of slope morphology, material properties, andhydraulic heterogeneity, Water Resour. Res., 28, 939–950, 1992.
Reid, M. E., T. W. Sisson, and D. L. Brien, Volcano collapse promoted byhydrothermal alteration and edifice shape, Mount Rainier, Washington,Geology, 29, 779–782, 2001.
Robison, J. H., L. S. Forcella, and M. W. Gannett, Data from geothermaltest wells near Mount Hood, Oregon, U.S. Geol. Surv. Open File Rep. OF81-1002, 26 pp., 1981.
Saar, M. O., and M. Manga, Seismicity induced by seasonal groundwaterrecharge at Mt. Hood, Oregon, Earth Planet. Sci. Lett., 214, 605–618,2003.
Sammel, E. A., S. E. Ingebritsen, and R. H. Mariner, The hydrothermalsystem at Newberry Volcano, Oregon, J. Geophys. Res., 93, 10,149–10,162, 1988.
Smith, L., and D. S. Chapman, On the thermal effects of groundwater flow,J. Geophys. Res., 88, 593–608, 1983.
Sorey, M. L., and E. M. Colvard, Measurements of heat and mass flow fromthermal areas in Lassen Volcanic National Park, California, U.S. Geol.Surv. Water Res. Invest. Rep., 94-4180-A, 35, 1994.
Souza, W. R., and C. I. Voss, Analysis of an anisotropic coastal aquifersystem using variable-density flow and transport simulation, J. Hydrol.,92, 17–41, 1987.
Stearns, H. T., and W. O. Clark, Geology and water resources of theKau District, Hawaii, U.S. Geol. Surv. Water Supply Pap., 616, 194,1930.
Stearns, H. T., and G. A. MacDonald, Geology and ground-water resourceson the island of Hawaii, Hawaii Div. Hydrogr. Bull., 9, 362 pp., 1946.
Takasaki, K. J., Ground water in Kilauea and adjacent areas of Mauna LoaVolcano, Hawaii, U.S. Geol. Surv. Open File Rep., 93-82, 28, 1993.
Terzaghi, K., Theoretical Soil Mechanics, 528 pp., John Wiley, Hoboken,N. J., 1943.
Vallance, J. W., and K. M. Scott, The Osceola Mudflow from MountRainier: Sedimentology and hazard implications of a huge clay-richdebris flow, Geol. Soc. Am. Bull., 109, 143–163, 1997.
Varekamp, J. C., and G. L. Rowe (Eds.), Crater Lakes, J. Volcanol.Geotherm. Res., 97, 508 pp., 2000.
Vaughan, P. J., D. E. Moore, C. A. Morrow, and J. D. Byerlee, Role ofcracks in progressive permeability reduction during flow of heatedaqueous fluids through granite, J. Geophys. Res., 91, 7517–7530, 1986.
Weaver, C. S., R. D. Norris, and C. Trisler-Jonientz, Results of seismologicalmonitoring in the Cascades Range 1962–1989: Earthquakes, eruptions,avalanches, and other curiosities, Geosci. Can., 17, 158–162, 1990.
Winograd, I. J., Hydrogeology of ash-flow tuff: A preliminary statement,Water Resour. Res., 7, 994–1006, 1971.
�����������������������S. Hurwitz, S. E. Ingebritsen, and M. E. Reid, U.S. Geological Survey,
345 Middlefield Road, MS 439, Menlo Park, CA 94025, USA. ([email protected])K. L. Kipp, U.S. Geological Survey, Denver Federal Center, MS 413,
Box 25406, Denver, CO 80225, USA.
HURWITZ ET AL.: WATER TABLE WITHIN VOLCANIC EDIFICES ECV 1 - 19