groundwater calculations for depleted uranium disposed of as … · email: [email protected]....
TRANSCRIPT

ANL/EAD/TM-111
Groundwater Calculations for Depleted Uranium Disposed of as Uranium Tetrafluoride (UF4)
Environmental Assessment DivisionArgonne National Laboratory
Operated by The University of Chicago,under Contract W-31-109-Eng-38, for the
United States Department of Energy

Argonne National Laboratory
Argonne National Laboratory, with facilities in the states of Illinois and Idaho, isowned by the United States Government and operated by The Universityof Chicago under the provisions of a contract with the Department of Energy.
This technical memorandum is a product of Argonne’s Environmental AssessmentDivision (EAD). For information on the division's scientific and engineeringactivities, contact:
Director, Environmental Assessment DivisionArgonne National LaboratoryArgonne, Illinois 60439-4832Telephone (630) 252-3107
Presented in this technical memorandum are preliminary results of ongoing workor work that is more limited in scope and depth than that described in formalreports issued by the EAD.
Publishing support services were provided by Argonne’s Information and Publishing Division (for more information, see IPD’s home page: http://www.ipd.anl.gov/).
Disclaimer
This report was prepared as an account of work sponsored by an agency of theUnited States Government. Neither the United States Government nor any agencythereof, nor The University of Chicago, nor any of their employees or officers,makes any warranty, express or implied, or assumes any legal liability orresponsibility for the accuracy, completeness, or usefulness of any information,apparatus, product, or process disclosed, or represents that its use would notinfringe privately owned rights. Reference herein to any specific commercialproduct, process, or service by trade name, trademark, manufacturer, or otherwisedoes not necessarily constitute or imply its endorsement, recommendation, orfavoring by the United States Government or any agency thereof. The views andopinions of document authors expressed herein do not necessarily state or reflectthose of the United States Government or any agency thereof, Argonne NationalLaboratory, or The University of Chicago.
Available electronically at http://www.doe.gov/bridge
Available for a processing fee to U.S. Department of Energy and its contractors, in paper, from:
U.S. Department of EnergyOffice of Scientific and Technical InformationP.O. Box 62Oak Ridge, TN 37831-0062phone: (865) 576-8401fax: (865) 576-5728email: [email protected]

ANL/EAD/TM-111
Groundwater Calculations for Depleted Uranium Disposed of as Uranium Tetrafluoride (UF4)
by D. Tomasko
Environmental Assessment DivisionArgonne National Laboratory, 9700 South Cass Avenue, Argonne, Illinois 60439
July 2001
Work sponsored by U.S. Department of Energy, Office of Nuclear Energy, Science and Technology

This report is printed on recycled paper.

iii
CONTENTS
ABSTRACT . . . . . . . . . . . . . . . . . . . . . . . . . . . . . . . . . . . . . . . . . . . . . . . . . . . . . . . . . . . . . . . 1
1 INTRODUCTION . . . . . . . . . . . . . . . . . . . . . . . . . . . . . . . . . . . . . . . . . . . . . . . . . . . . . . 1
2 SOURCE TERM . . . . . . . . . . . . . . . . . . . . . . . . . . . . . . . . . . . . . . . . . . . . . . . . . . . . . . . 3
3 CALCULATIONS . . . . . . . . . . . . . . . . . . . . . . . . . . . . . . . . . . . . . . . . . . . . . . . . . . . . . . 6
4 DISCUSSION . . . . . . . . . . . . . . . . . . . . . . . . . . . . . . . . . . . . . . . . . . . . . . . . . . . . . . . . . . 21
5 REFERENCES . . . . . . . . . . . . . . . . . . . . . . . . . . . . . . . . . . . . . . . . . . . . . . . . . . . . . . . . . 22
FIGURES
1 Breakthrough Curves for a Trench, Vault, and Mine for a Fairly Mobile, Low-Solubility Uranium Complex . . . . . . . . . . . . . . . . . . . . . . . . . . . . . . . . . . . . . . . . . . 7
2 Breakthrough Curves for a Trench, Vault, and Mine for a Fairly Immobile, Low-Solubility Uranium Complex . . . . . . . . . . . . . . . . . . . . . . . . . . . . . . . . . . . . . . . . . . 10
3 Breakthrough Curves for a Trench for a Fairly Mobile, Very Soluble Uranium Complex . . . . . . . . . . . . . . . . . . . . . . . . . . . . . . . . . . . . . . . . . . . . . . . . . . . . . . 12
4 Breakthrough Curves for a Vault for a Fairly Mobile, Very Soluble Uranium Complex . . . . . . . . . . . . . . . . . . . . . . . . . . . . . . . . . . . . . . . . . . . . . . . . . . . . . . 12
5 Breakthrough Curves for a Mine for a Fairly Mobile, Very Soluble Uranium Complex . . . . . . . . . . . . . . . . . . . . . . . . . . . . . . . . . . . . . . . . . . . . . . . . . . . . . . 13
6 Breakthrough Curves for a Trench for a Fairly Immobile, Very Soluble Uranium Complex . . . . . . . . . . . . . . . . . . . . . . . . . . . . . . . . . . . . . . . . . . . . . . . . . . . . . . 15
7 Breakthrough Curves for a Vault for a Fairly Immobile, Very Soluble Uranium Complex . . . . . . . . . . . . . . . . . . . . . . . . . . . . . . . . . . . . . . . . . . . . . . . . . . . . . . 15
8 Breakthrough Curves for a Mine for a Fairly Immobile, Very Soluble Uranium Complex . . . . . . . . . . . . . . . . . . . . . . . . . . . . . . . . . . . . . . . . . . . . . . . . . . . . . . 16

iv
TABLES
1 Footprint Areas for the Long-Term Disposal of UF4 . . . . . . . . . . . . . . . . . . . . . . . . . . . . 5
2 Duration Times for Contaminant Sources . . . . . . . . . . . . . . . . . . . . . . . . . . . . . . . . . . . . 5
3 Summary of Hydrological Parameters Used for the Disposal Calculations . . . . . . . . . . . 7
4 Maximum Concentrations and Occurrence Times for Long-Term Disposal of UF4 . . . . 9
5 Summary of Concentrations at 1,000 Years at the Water Table for Long-Term Disposal of UF4 . . . . . . . . . . . . . . . . . . . . . . . . . . . . . . . . . . . . . . . . . . . . . . . . . . . . . . . . 11
6 Lengths of Disposal Cell Footprint Parallel to the Direction of Groundwater Flow . . . . 17
7 Dilution Factors for Mixing at the Water Table . . . . . . . . . . . . . . . . . . . . . . . . . . . . . . . . 17
8 Summary of Concentrations at 1,000 Years after Dilution at the Water Table . . . . . . . . 18
9 Maximum Concentrations and Occurrence Times for Long-Term Disposal of UF4 after Dilution . . . . . . . . . . . . . . . . . . . . . . . . . . . . . . . . . . . . . . . . . . . . . . . . . . . . . 19

1
GROUNDWATER CALCULATIONS FOR DEPLETED URANIUMDISPOSED OF AS URANIUM TETRAFLUORIDE (UF4)
by
D. Tomasko
ABSTRACT
This report discusses calculations performed to estimate the impacts ongroundwater from the long-term disposal of depleted uranium in the form ofuranium tetrafluoride (UF4) in a trench, vault, and mined cavity. The calculationswere done for a deep groundwater system, typical of conditions in the westernUnited States. They were performed for two initial inventories of UF4: 500,000and 630,000 metric tons. Disposal was in either 30- or 50-gal drums. All of thecontaminant and radioactivity concentrations at the water table are predicted to bevery low, even for a fairly mobile compound. In general, concentrations after1,000 years at the water table would be about an order of magnitude greater fordisposal in a deep mine than for disposal in a trench or vault. The largest activityconcentration at the water table after 1,000 years would be derived from a failedmine that releases a fairly mobile and very soluble uranium complex; it would beabout 8.6 × 10⁻⁶ pCi/L for 500,000 metric tons of UF4 disposed of in 30-gal drums.The smallest activity concentrations at the water table after 1,000 years would, ingeneral, be derived from a failed trench (1.2 × 10⁻⁹ pCi/L), if the contaminantreached the water table as schoepite. Although all the activity concentrations atthe water table after 1,000 years are predicted to be small, maximum activityconcentrations could still be large, even after dilution. Maximum activityconcentrations of uranium would exceed 900 pCi/L for a failed disposal facilityif a very soluble and mobile uranium complex formed. If the solubility of theuranium compound was small (2.4 × 10⁻³ g/L), the resulting activityconcentrations would be small, less than 2.5 pCi/L. The estimated time for thesemaximum concentrations would range from 65,000 to 2,000,000 years.
1 INTRODUCTION
This report discusses calculations performed to estimate the impacts on groundwaterproduced from the long-term disposal of depleted uranium in the form of uranium tetrafluoride (UF4)

2
in an engineered trench, a vault, and a mined cavity. The calculations were done for a deepgroundwater system, typical of conditions in the western portion of the country. Calculations wereperformed for two initial inventories of UF4: 500,000 and 630,000 metric tons (t). These values areconsistent with 560,000 and 705,000 t of disposed uranium hexafluoride (UF6), respectively,discussed in Folga and Kier (2001). Disposal was in either 30- or 50-gal drums. Where possible, thecalculations follow the same format as those reported in the Programmatic Environmental ImpactStatement for Alternative Strategies for the Long-Term Management and Use of Depleted UraniumHexafluoride (PEIS) published by the U.S. Department of Energy (DOE 1997).

3
UF4 �12
O2(g) � 4H2O � 4HF(aq) � UO3·2H2O . (1)
3UF4 � O2(g) � 6H2O �12HF(aq) � U3O8 . (2)
2 SOURCE TERM
Solid UF4 in storage poses no direct threat to groundwater resources. However, UF4 is anunstable compound that can dissolve and react with oxygen and water to form more complexcompounds. These compounds can then migrate into the groundwater system and be transported byexisting hydraulic gradients.
In order to perform transport calculations for the groundwater, a source term is needed. Thissource term requires an estimate of the length of time that uranium is being introduced into thesystem and its initial concentration at the discharge point. For simplicity, the source term is assumedto behave like a unit step function (Hildebrand 1976) that has a value C0 for a time t and thenreturns to zero. This initial concentration, C0, is assumed to be equal to the solubility of either UF4
or the solubility of one of the many possible uranium compound complexes. The duration of thesource term, t, can be estimated as the dissolution time for the entire inventory of UF4 in thedisposal area.
After exposure to water, UF4 dissolves and then undergoes hydrolysis. Dissolution to asolubility limit is assumed to be instantaneous. The time for hydrolysis, however, can be significant.If the hydrolysis time is long compared to the travel time to a potential receptor, the dissolved formof uranium at the receptor will be UF4. However, if the hydrolysis time is short compared to thetravel time, other uranium compounds are possible.
In the presence of oxygen and water, UF4 is unstable and dissolves and chemically reacts.The reported solubility of UF4 ranges from about 0.03 to 0.1 g/L at 25�C, per information fromOak Ridge National Laboratory in 1960 on Atomic Energy Commission Report AECD-3412 andfrom Kozak et al. (1992). UF4 can also chemically react with oxygen and water to form schoepite(UO3·2H2O) via the following chemical reaction:
In addition, the following reaction can occur, producing triuranium octaoxide (U3O8):
The U3O8 produced in the reaction given by Equation 2 can then form schoepite under oxidizingconditions. The solubility of schoepite is approximately 2.4 × 10⁻³ g/L (Kozak et al. 1992).
Because of its corrosive properties, the HF released by the above reactions is assumed toreact with material such as Portland cement grout and carbonate in limestone formations, releasing

4
t �Mt
VASoli
, (3)
carbonates into solution. Because of such reactions, the HF is assumed to be removed from thegroundwater pathway and is not considered to be a risk at the location of potential receptors.
Dissolved carbonate released by reactions involving HF can have a significant effect on theaqueous chemistry and solubility of uranium (U[VI]) through the formation of strong anioniccarbonato complexes (DOE and U.S. Environmental Protection Agency [EPA] 1999). Some of thesecompounds include dioxouranium carbonate species: UO2CO3, UO2(CO3)2, and UO2(CO3)3. Thepredominant species formed depends on the pH of the system. Under neutral conditions (pH = 7.0),the predominant form is UO2(CO3)2. For slightly acidic conditions (pH = 6.0), such as those expectedin the presence of the released HF, the predominant form is UO2CO3 (Langmuir 1978). The solubilityof UO2CO3 is reported as 0.028 g/L (Gmelin 1983). If nitrogen is also present in solution, additionaluranium complexes can form. One of these, an ammonium carbonate uranium complex that has thechemical formula (NH4)4(UO2(CO3)3, has a solubility of 23 g/L (Gmelin 1983).
As the above discussion indicates, the final form of uranium in solution at the location ofa potential receptor is a complex function of the reaction time of the dissolved phase present relativeto the transport time to a potential receptor, the physical and chemical attributes of the disposalfacility, and the geochemistry of the receiving water. Because the reaction rate for UF4 hydrolysisis not well known (Kozak et al. 1992), and because the geochemistry of the groundwater is site-specific, a range of solubilities was selected to bracket the calculations. At the low end of thesolubility range, the solubility is assumed to be equal to that of schoepite (2.4 × 10⁻³ g/L). Becausegroundwater uranium concentrations produced by schoepite during long-term disposal are very small(Tomasko 1997a), a smaller solubility was not needed for the present analyses. At the high end ofthe solubility range, the solubility is assumed to be four orders of magnitude greater (24 g/L). Thisvalue is similar to the solubility of the ammonium carbonate uranium complex mentioned above.
An intermediate set of calculations could also be performed for this study. Here, thesolubility would be set to equal the solubility of UF4 (approximately 0.1 g/L). For this calculation,the hydrolysis of UF4 would be assumed to be slow when compared with the transport time to apotential receptor. For this condition, UF4 would remain in solution and not react significantly. Itsinitial concentration at the point of discharge to the environment would be equal to its solubility(0.1 g/L). Because this value lies within the range selected for the analyses, a separate analysis wasnot performed for the intermediate solubility.
Because the disposed radioactive material is assumed to be soluble, it will act as a sourceof contamination for a number of years. The duration time for the source can be estimated by usingthe following expression:

5
where A is the area of the disposal facility footprint, Mt is the total initial inventory of contaminant(500,000 and 630,000 t of UF4), Soli is the solubility of the ith radioactive material (i.e., 2.4 × 10⁻³ or24 g/L), and V is the infiltration velocity of water.
For a dry climate, the quantity of water infiltrating a soil column is approximately 1% ofthe annual precipitation (Rice et al. 1989). For an average annual precipitation of 10 in. in an aridclimate (Tomasko 1997a), the net rate of water infiltration is 0.1 in./yr (2.54 × 10⁻³ m/yr). The rangeof the solubilities of the potential radioactive dissolution products for Equation 3 is 2.4 × 10⁻³ to24 g/L, as discussed above. Footprint areas for the different disposal options are listed in Table 1(Folga and Kier 2001).
A list of duration times for the various sources of contamination estimated with Equation 3are given in Table 2 for disposal in a trench, vault, and deep mine. Except for the highly solubleuranium complex, all source durations are very long, exceeding 33 million years. The shortest sourceduration is 3,320 years for disposing of 500,000 t of UF4 in 30-gal drums in a mine in which waterreacts with the radioactive material to form a very soluble (24 g/L) uranium complex.
TABLE 1 Footprint Areas (in hectares) for the Long-Term Disposal of UF4
500,000 t 630,000 t
Disposal Method 30-gal Drums 50-gal Drums 30-gal Drums 50-gal Drums
Trench 20.6 17.4 25.5 21.6 Vault 25.4 31.6 31.6 37.9 Mine 247 187 310 234
TABLE 2 Duration Times (in years) for Contaminant Sources
500,000 t 630,000 t
FacilitySolubility
(g/L) 30-gal Drums 50-gal Drums 30-gal Drums 50-gal Drums
Trench 2.4×10⁻³ 398,000,000 471,000,000 501,000,000 593,000,00024 39,800 47,100 50,100 59,300
Vault 2.4×10⁻³ 323,000,000 260,000,000 407,000,000 328,000,00024 32,300 26,000 40,700 32,800
Mine 2.4×10⁻³ 33,200,000 43,800,000 41,200,000 54,700,00024 3,320 4,380 4,120 5,470

6
D � V , (4)
� 0.1L ,
3 CALCULATIONS
A one-dimensional analytical solution of the advection/dispersion equation was used tocalculate the concentrations of the various radioactive contaminants (Tomasko 1997b). Thecalculations were performed for a time of 1,000 years, to be consistent with calculations done for thePEIS (DOE 1997), and for groundwater directly beneath the footprint of the disposal facility.Longitudinal transport was not included because the times required for transport to a point 1,000 ftfrom the disposal facility are much shorter (about 50 to 500 years for a groundwater velocity of110 ft/yr and for transport velocities that are 5 to 50 times slower, respectively, than the velocity ofthe groundwater [retardations of 5 and 50]) than the times required for transport through theunsaturated zone (60,000 to 300,000 years for a deep mine with a thickness of 100 ft and for atrench/vault with a thickness of 500 ft, respectively, and a retardation of 5. Because of this shortertravel time, concentrations at a distance of 1,000 ft from the facility would be essentially the sameas those calculated for a point directly below the facility footprint. In addition to groundwatercalculations performed at 1,000 years, the calculations were extended to determine the maximumconcentration that would be achieved and the time of this maximum value.
Longitudinal dispersion was calculated by using the following expression (Bear 1972):
where is the dispersivity of the formation and V is the infiltration velocity of the water (0.1 in./yr).Dispersivity was assumed to be scale-dependent (Lallamand-Barres and Peaudecerf 1978), i.e.,
where L is the separation distance between the source release point and the point of interest (thewater table directly below the disposal facility footprint). For the trench/vault, longitudinaldispersion was 0.4 ft2/yr; for the mine, the dispersion was 0.083 ft2/yr. A summary of parameters forthe disposal calculations is given in Table 3.
As a contaminant is transported by groundwater, it may have an apparent velocity that isless than the velocity of the water because of sorption. This process is known as retardation (Freezeand Cherry 1979). Because retardation of a dissolved radionuclide is a site-specific parameter thathas a high degree of uncertainty, two values were used to bound the calculations, 5 and 50. Thesevalues represent a fairly mobile contaminant (retardation of 5) and a contaminant that undergoessubstantial sorption along its flow path (retardation of 50).
Figure 1 shows breakthrough curves of the dimensionless concentration (concentration ata time t divided by the initial concentration of the contaminant, i.e., C/C0) for schoepite at the water

7
FIGURE 1 Breakthrough Curves for a Trench, Vault, and Mine for a Fairly Mobile, Low-Solubility Uranium Complex
TABLE 3 Summary of Hydrological Parameters Used for the Disposal Calculations
Parameter Trench Vault Mine
Depth to water table (ft) 500 500 100Infiltration velocity of water (ft/yr) 8.33×10⁻³ 8.33×10⁻³ 8.33×10⁻³
Saturated zone water velocity (ft/yr) 110 110 110Longitudinal dispersion in unsaturated zone (ft2/yr) 0.4 0.4 0.083Longitudinal dispersion in saturated zone (ft2/yr) 11,000 11,000 11,000Retardation 5 and 50 5 and 50 5 and 50Thickness of saturated zone (ft) 100 100 100Porosity 0.1 0.1 0.1Hydraulic conductivity of saturated zone (ft/yr) 11,000 11,000 11,000Hydraulic gradient in saturated zone 0.001 0.001 0.001

8
table as a function of time for disposal in a vault or trench and in a mine for fairly mobile conditions(retardation of 5). For the time scale shown, there are no differences between the breakthroughcurves for disposal in 30- or 50-gal drums. Because of the long durations of the source possible withschoepite (Table 3), the maximum concentration at the water table can equal the initial concentration(i.e., C/C0 = 1.0). In a trench or vault, the maximum concentration would be reached after about550,000 years (Table 4). In a mine, the maximum concentration would be reached after about200,000 years. Maximum concentrations for a mine occur earlier because of the shorter traveldistance from the mine to the water table (100 versus 500 ft). For more sorption (retardation of 50),the peak concentration (C/C0 = 1) for a trench or vault would be reached after approximately5 million years (Table 4) as shown in Figure 2. For a mine, this concentration would be reached afterabout 2 million years.
The dimensionless concentrations for schoepite released from a trench or vault after1,000 years are 2.1 × 10⁻⁹ and 6.1 × 10⁻²¹ for retardations of 5 and 50, respectively (Table 5). For amine, the dimensionless concentrations after 1,000 years would be 3.9 × 10⁻⁹ and 1.7 × 10⁻⁹ forretardations of 5 and 50, respectively. As shown in Table 4, for a specific activity of 2.4 × 10⁻⁷ Ci/g(Tomasko 1997a), the maximum uranium activity concentration from a failed trench, vault, or minewould be 576 pCi/L (1 pCi or picocurie = 1 × 10-12 Ci or curies).
By multiplying the dimensionless concentrations shown in Figures 1 and 2 by the initialconcentration of the source (2.4 × 10⁻³ g/L), the uranium concentrations after 1,000 years for a failedtrench or vault would be 5.0 × 10⁻¹² and 1.5 × 10⁻²³ g/L for retardations of 5 and 50, respectively(Table 5). For a failed mine, the uranium concentrations would be 9.5 × 10⁻¹² and 4.0 × 10⁻¹² forretardations of 5 and 50, respectively.
By multiplying the uranium concentration in g/L by the specific activity of the compound(Ci/g), the uranium activity concentration for the compound can be found. For a specific activity of2.4 × 10-7 Ci/g for schoepite (Tomasko 1997a), the uranium activity concentrations from a failedtrench or vault at 1,000 years would be 1.2 × 10⁻⁶ and 3.6 × 10⁻¹⁸ pCi/L, for retardations of 5 and 50,respectively. For a failed mine, the activity concentration of the uranium would be 2.3 × 10⁻⁶ and9.6 × 10-7 pCi/L for retardations of 5 and 50, respectively.
If the solubility of the uranium were increased by four orders of magnitude to 24 g/L, theduration time of the source from a failed disposal facility would be decreased by a factor of 10,000(Table 2). Figures 3 through 5 show the breakthrough curves for a highly soluble uranium complexfrom a trench, vault, and mine, respectively. For the higher solubility cases, the maximumdimensionless concentration (C/C0) reached is less than 1.0, and the maximum occurs much earlierin time (Table 4). A maximum dimensionless uranium concentration of 0.39 occurs for a failedtrench in which 630,000 t of UF4 are disposed of in 50-gal drums. This maximum would occur afterabout 315,000 years for an assumed retardation of 5. For an initial source term concentration of24 g/L, the maximum concentration would be 9.4 g/L. The smallest dimensionless maximum

9
TABLE 4 Maximum Concentrations and Occurrence Times for Long-Term Disposal of UF4
500,000 t in 30-gal Drums 500,000 t in 50-gal Drums
Solubility(g/L) R
aFacility C/C0
Concentration(g/L)
b
ActivityConcentration
(pCi/L)c C/C0
Concentration(g/L)
b
ActivityConcentration
(pCi/L)c
2.4×10⁻³
5 Trench 1.0550,000 yr
2.4×10⁻³
576 1.0550,000 yr
2.4×10⁻³
576
Vault 1.0550,000 yr
2.4×10⁻³
576 1.0550,000 yr
2.4×10⁻³
576
Mine 1.0200,000 yr
2.4×10⁻³
576 1.0200,000 yr
2.4×10⁻³
576
50 Trench 1.05,000,000 yr
2.4×10⁻³
576 1.05,000,000 yr
2.4×10⁻³
576
Vault 1.05,000,000 yr
2.4×10⁻³
576 1.05,000,000 yr
2.4×10⁻³
576
Mine 1.0 2,000,000 yr
2.4×10⁻³
576 1.02,000,000 yr
2.4×10⁻³
576
24 5 Trench 0.27310,000 yr
6.5 1.0×10⁶
0.32315,000 yr
7.7 1.2×10⁶
Vault 0.22305,000 yr
5.3 5.3×10⁵
0.18300,000 yr
4.3 6.9×10⁵
Mine 0.0660,000 yr
1.4 2.2×10⁵
0.0865,000 yr
1.9 1.6×10⁵
50 Trench 0.0432,900,000 yr
1.0 1.6×10⁵
0.0362,850,000 yr
0.9 1.4×10⁵
Vault 0.0222,850,000 yr
0.5 8.0×10⁴
0.0172,800,000 yr
0.4 6.4×10⁴
Mine 0.006450,000 yr
0.14 2.2×10⁴
0.0082445,000 yr
0.2 3.2×10⁴
630,000 t in 30-gal drums 630,000 t in 50-gal drums
Solubility(g/L) R
aFacility C/C0
Concentration(g/L)
b
ActivityConcentration
(pCi/L)c
C/C0
Concentration(g/L)
b
ActivityConcentration
(pCi/L)c
2.4×10⁻³
5 Trench 1.0550,000 yr
2.4×10⁻³
576 1.0550,000 yr
2.4×10⁻³
576
Vault 1.0550,000 yr
2.4×10⁻³
576 1.0550,000 y
2.4×10⁻³
576
Mine 1.0200,000 yr
2.4×10⁻³
576 1.0200,000 yr
2.4×10⁻³
576
50 Trench 1.05,000,000 yr
2.4×10⁻³
576 1.05,000,000 yr
2.4×10⁻³
576
Vault 1.05,000,000 yr
2.4×10⁻³
576 1.05,000,000 yr
2.4×10⁻³
576
Mine 1.0 2,000,000 yr
2.4×10⁻³
576 1.02,000,000 yr
2.4×10⁻³
576

10
FIGURE 2 Breakthrough Curves for a Trench, Vault, and Mine for a Fairly Immobile, Low-Solubility Uranium Complex
TABLE 4 (Cont.)
630,000 t in 30-gal drums 630,000 t in 50-gal drums
Solubility(g/L) R
aFacility C/C0
Concentration(g/L)
b
ActivityConcentration
(pCi/L)c
C/C0
Concentration(g/L)
b
ActivityConcentration
(pCi/L)c
24 5 Trench 0.34310,000 yr
8.2 1.3×10⁶
0.39315,000 yr
9.4 1.5×10⁶
Vault 0.28310,000 yr
6.7 1.1×10⁶
0.23308,000 yr
5.5 8.8×10⁵
Mine 0.07565,000 yr
1.8 2.9×10⁵
0.175,000 yr
2.4 3.8×10⁵
50 Trench 0.0332,800,000 yr
0.8 1.3×10⁵
0.0282,700,000 yr
0.7 1.1×10⁵
Vault 0.0282,900,000 yr
0.7 1.1×10⁵
0.02252,870,000 yr
0.5 8.0×10⁴
Mine 0.0075452,000 yr
0.2 3.2×10⁴
0.01452,000 yr
0.2 3.2×10⁴
aR = retardation factor.
bConcentration is found by multiplying the dimensionless concentration, C/C0, by the compound’s solubility.
cActivity concentration is found by multiplying the concentration of a compound by its specific activity.

11
TABLE 5 Summary of Concentrations at 1,000 Years at the Water Table for Long-TermDisposal of UF4
500,000 t in 30-gal Drums 500,000 t in 50-gal Drums
Solubility(g/L) Facility C/C0
Concentration(g/L)
ActivityConcentration
(pCi/L) C/C0
Concentration(g/L)
ActivityConcentration
(pCi/L)
2.4×10⁻³
Trench 2.1×10⁻⁹
6.1×10⁻²¹
5.0×10⁻¹²
1.5×10⁻²³
1.2×10⁻⁶
3.6×10⁻¹⁸
2.1×10⁻⁹
6.1×10⁻²¹
5.0×10⁻¹²
1.5×10⁻²³
1.2×10⁻⁶
3.6×10⁻¹⁸
Vault 2.1×10⁻⁹
6.1×10⁻²¹
5.0×10⁻¹²
1.5×10⁻²³
1.2×10⁻⁶
3.6×10⁻¹⁸
2.1×10⁻⁹
6.1×10⁻²¹
5.0×10⁻¹²
1.5×10⁻²³
1.2×10⁻⁶
3.6×10⁻¹⁸
Mine 3.9×10⁻⁹
1.7×10⁻⁹
9.5×10⁻¹²
4.0×10⁻¹²
2.3×10⁻⁶
9.6×10⁻⁷
3.9×10⁻⁹
1.7×10⁻⁹
9.5×10⁻¹²
4.0×10⁻¹²
2.3×10⁻⁶
9.6×10⁻⁷
24 Trench 1.9×10⁻¹¹
3.4×10⁻²¹
4.5×10⁻¹⁰
8.1×10⁻²⁰
7.2×10⁻⁵
1.3×10⁻¹⁴
1.9×10⁻¹¹
3.6×10⁻²¹
4.6×10⁻¹⁰
8.7×10⁻²⁰
7.3×10⁻⁵
1.4×10⁻¹⁴
Vault 2.2×10⁻¹¹
3.0×10⁻²¹
5.3×10⁻¹⁰
7.2×10⁻²⁰
8.5×10⁻⁵
1.2×10⁻¹⁴
1.1×10⁻¹¹
2.7×10⁻²¹
2.5×10⁻¹⁰
6.4×10
-20
4.0×10⁻⁵
1.0×10⁻¹⁴
Mine 5.6×10⁻¹⁰
5.5×10⁻¹²
1.4×10⁻⁸
1.3×10⁻¹⁰
2.2×10⁻³
2.1×10⁻⁵
5.8×10⁻¹⁰
7.3×10⁻¹²
1.4×10⁻⁸
1.8×10⁻¹⁰
2.2×10⁻³
2.8×10⁻⁵
630,000 t in 30-gal Drums 630,000 t in 50-gal Drums
Solubility(g/L) Facility C/C0
Concentration(g/L)
ActivityConcentration
(pCi/L) C/C0 ConcentrationActivity
Concentration
2.4×10⁻³
Trench 2.1×10⁻⁹
6.1×10⁻²¹
5.0×10⁻¹²
1.5×10⁻²³
1.2×10⁻⁶
3.6×10⁻¹⁸
2.1×10⁻⁹
6.1×10⁻²¹
5.0×10⁻¹²
1.5×10⁻²³
1.2×10⁻⁶
3.6×10⁻¹⁸
Vault 2.1×10⁻⁹
6.1×10⁻²¹
5.0×10⁻¹²
1.5×10⁻²³
1.2×10⁻⁶
3.6×10⁻¹⁸
2.1×10⁻⁹
6.1×10⁻²¹
5.0×10⁻¹²
1.5×10⁻²³
1.2×10⁻⁶
3.6×10⁻¹⁸
Mine 3.9×10⁻⁹
1.7×10⁻⁹
9.5×10⁻¹²
4.0×10⁻¹²
2.3×10⁻⁶
9.6×10⁻⁷
3.9×10⁻⁹
1.7×10⁻⁹
9.5×10⁻¹²
4.0×10⁻¹²
2.3×10⁻⁶
9.6×10⁻⁷
24 Trench 1.8×10⁻¹¹
3.8×10⁻²¹
4.4×10⁻¹⁰
9.0×10⁻²⁰
7.1×10⁻⁵
1.4×10⁻¹⁴
2.4×10⁻¹¹
4.0×10⁻²¹
5.6×10⁻¹⁰
9.7×10⁻²⁰
9.0×10⁻⁵
1.6×10⁻¹⁴
Vault 2.0×10⁻¹¹
3.4×10⁻²¹
4.7×10⁻¹⁰
8.2×10⁻²⁰
7.6×10⁻⁵
1.3×10⁻¹⁴
2.0×10⁻¹¹
3.0×10⁻²¹
4.8×10⁻¹⁰
7.3×10⁻²⁰
7.6×10⁻⁵
1.2×10⁻¹⁴
Mine 5.4×10⁻¹⁰
6.8×10⁻¹²
1.3×10⁻⁸
1.6×10⁻¹⁰
2.1×10⁻³
2.6×10⁻⁵
7.4×10⁻¹⁰
9.3×10⁻¹²
1.8×10⁻⁸
2.2×10⁻¹⁰
2.9×10⁻³
3.6×10⁻⁵

12
FIGURE 3 Breakthrough Curves for a Trench for a Fairly Mobile, Very Soluble Uranium Complex
FIGURE 4 Breakthrough Curves for a Vault for a Fairly Mobile, Very Soluble Uranium Complex

13
FIGURE 5 Breakthrough Curves for a Mine for a Fairly Mobile, Very Soluble Uranium Complex
SA �4.18 × 10²³
At1/2 3.3 × 10¹⁰, (6)
concentration, 0.06, would occur for a mine after about 60,000 years. For an initial source termconcentration of 24 g/L, the maximum concentration would be 1.4 g/L.
In order to estimate the activity concentration for the highly soluble uranium complex, itschemical composition must be known. The actual chemical composition and also the solubility ofthis compound are site-specific parameters that depend on the geochemistry present. For the presentcalculations, the highly soluble uranium complex is assumed to be (NH4)4[UO2(CO3)]3 .
The specific activity, SA, of a carrier-free radionuclide (i.e., one that does not contain anyother isotopes of the radionuclide) can be estimated by using the following relationship (Cember1989):
where A is the molecular weight of the compound and t1/2 is its half life in seconds. For a molecularweight of 492 g/mole, the specific activity of the highly soluble uranium complex is approximately1.6 × 10-7 Ci/g. For this specific activity, the maximum uranium activity concentrations at the watertable for a retardation of 5 would all be very large, exceeding 160,000 pCi/L (Table 4).

14
Df �VdT
IL v
� 1 , (7)
If the highly soluble uranium complex is significantly retarded (retardation of 50), themaximum uranium concentrations at the water table would be smaller than those discussed above(Table 4 and Figures 6 through 8). For this case, the largest dimensionless concentration, 0.043,would occur after 2.9 million years for a failed trench in which 500,000 t of UF4 were disposed ofin 30-gal drums. The smallest maximum dimensionless concentration, 0.006, would occur after450,000 years for a failed mine in which 500,000 t of UF4 were disposed of in 30-gal drums.Although these dimensionless concentrations are less than 1.0, the uranium activity concentrationswould still be very large, exceeding 22,000 pCi/L.
Although the maximum uranium activity concentrations at the water table would be verylarge for any of the scenarios, dimensionless concentrations, actual concentrations, and activityconcentrations after 1,000 years would be very small (Table 5). For a fairly mobile form of highlysoluble uranium (retardation of 5), the maximum activity concentration would be 2.9 × 10⁻³ pCi/Lfor a failed mine in which 630,000 t of UF4 were disposed of in 50-gal drums. For a retardation of50, the maximum activity concentration of uranium after 1,000 years would be 3.6 × 10⁻⁵ pCi/L, onceagain for a failed mine in which 630,000 t of UF4 were disposed of in 50-gal drums.
If the form of uranium released was fairly mobile schoepite, the maximum activityconcentration at the water table after 1,000 years would be 2.3 × 10⁻⁶ pCi/L for disposing of the UF4
in a mine. This value would be independent of the size of the storage container or the total mass thatwas disposed of because of the very long duration of the source.
All of the above estimated concentrations and activity concentrations were values for waterwithin the unsaturated soil column. At the water table, additional dilution will occur when thecontaminated water from the unsaturated enters the zone of saturation and mixes with initially cleanwater. The amount of dilution, Df , can be estimated with the following expression (Tomasko 1997a):
where
I = rate of water infiltration,
L = length of the disposal cell footprint parallel for the direction ofgroundwater flow,
T = thickness of the saturated zone of groundwater, and
v = porosity or water content of the unsaturated zone.

15
FIGURE 6 Breakthrough Curves for a Trench for a Fairly Immobile,Very Soluble Uranium Complex
FIGURE 7 Breakthrough Curves for a Vault for a Fairly Immobile,Very Soluble Uranium Complex

16
FIGURE 8 Breakthrough Curves for a Mine for a Fairly Immobile,Very Soluble Uranium Complex
Vd � K�h , (8)
The magnitude of the Darcy velocity, Vd, in Equation 7 is given by the following expression(Freeze and Cherry 1979):
where K is the hydraulic conductivity of the saturated zone of groundwater and �h is the localhydraulic gradient present (change in water level with distance).
In order to estimate the amount of dilution at the water table, the length of the disposalfacility parallel to the direction of groundwater flow is required. As indicated in Table 1, each of thealternative disposal facilities (trench, vault, and mine) has a footprint area that is a function of thenumber of drums required for disposing of the UF4. For the present calculations, the footprints areassumed to be square and oriented with two of their opposite sides parallel to the direction ofgroundwater flow. The length of the facility parallel to the direction of groundwater flow is thenequal to the square root of the footprint area (Table 6).
In addition to the lengths of the disposal facilities parallel to the direction of groundwaterflow, the magnitude of the Darcy velocity is required. For a hydraulic conductivity of 11,000 ft/yrand a hydraulic gradient of 0.001 (Table 3), the magnitude of the Darcy velocity is 11 ft/yr. For a

17
TABLE 6 Lengths of Disposal Cell Footprint (in meters) Parallel to theDirection of Groundwater Flow
500,000 t 630,000 t
Facility 30-gal Drums 50-gal Drums 30-gal Drums 50-gal Drums
Trench 454 417 505 465 Vault 504 562 562 616 Mine 1,570 1,370 1,760 1,530
TABLE 7 Dilution Factors for Mixing at the Water Table
500,000 t 630,000 t
Facility 30-gal Drums 50-gal Drums 30-gal Drums 50-gal Drums
Trench 885 964 797 865Vault 798 716 716 653Mine 256 294 229 262
saturated zone thickness of 100 ft, an infiltration velocity of 0.1 in./yr, and a porosity of 0.1(Table 3), the dilution factors for the three disposal facilities are given in Table 7. The dilution factorranges from 229 for disposing of 630,000 t of UF4 in a mine to 964 for disposing of 500,000 t of UF4
in a trench in 50-gal drums. In general, the larger the facility (i.e., length of the disposal facility ina direction parallel to the direction of groundwater flow), the smaller the amount of dilution. Asummary of concentration and activity concentrations after 1,000 years after mixing with initiallyclean water in the saturated zone is given in Table 8; maximum concentrations and activityconcentrations after dilution are given in Table 9.

18
TABLE 8 Summary of Concentrations at 1,000 Years after Dilution at the Water Table
500,000 t in 30-gal Drums 500,000 t in 50-gal Drums
Solubility(g/L) Facility C/C0
Concentration(g/L)
ActivityConcentration
(pCi/L) C/C0
Concentration(g/L)
ActivityConcentration
(pCi/L)
2.4×10⁻³
Trench 2.4×10⁻¹²
6.9×10⁻²⁴
5.8×10⁻¹⁵
1.7×10⁻²⁶
1.4×10⁻⁹
4.1×10⁻²¹
2.2×10⁻¹²
6.3×10⁻²⁴
5.2×10⁻¹⁵
1.6×10⁻²⁶
1.2×10⁻⁹
3.7×10⁻²¹
Vault 2.6×10⁻¹²
7.6×10⁻²⁴
6.3×10⁻¹⁵
1.9×10⁻²⁶
1.5×10⁻⁹
4.5×10⁻²¹
2.9×10⁻¹²
8.5×10⁻²⁴
7.0×10⁻¹⁵
2.1×10⁻²⁶
1.7×10⁻⁹
5.0×10⁻²¹
Mine 1.5×10⁻¹¹
6.6×10⁻¹²
3.7×10⁻¹⁴
1.6×10⁻¹⁴
9.0×10⁻⁹
3.8×10⁻⁹
1.3×10⁻¹¹
5.8×10⁻¹²
3.2×10⁻¹⁴
1.4×10⁻¹⁴
7.8×10⁻⁹
3.3×10⁻⁹
24 Trench 2.2×10⁻¹⁴
3.8×10⁻²⁴
5.1×10⁻¹³
9.2×10⁻²³
8.1×10⁻⁸
1.5×10⁻¹⁷
2.0×10⁻¹⁴
3.5×10⁻²⁴
4.7×10⁻¹³
8.5×10⁻²³
7.5×10⁻⁸
1.4×10⁻¹⁷
Vault 2.8×10⁻¹⁴
3.8×10⁻²⁴
6.6×10⁻¹³
9.0×10⁻²³
1.1×10⁻⁷
1.5×10⁻¹⁷
3.1×10⁻¹⁴
4.2×10⁻²⁴
7.4×10⁻¹³
1.0×10⁻²²
1.2×10⁻⁷
1.6×10⁻¹⁷
Mine 2.2×10⁻¹²
2.2×10⁻¹⁴
5.5×10⁻¹¹
5.1×10⁻¹³
8.6×10⁻⁶
8.2×10⁻⁸
1.9×10⁻¹²
1.9×10⁻¹⁴
4.6×10⁻¹¹
4.5×10⁻¹³
7.4×10⁻⁶
7.2×10⁻⁸
630,000 t in 30-gal drums 630,000 t in 50-gal drums
Solubility(g/L) Facility C/C0
Concentration(g/L)
ActivityConcentration
(pCi/L) C/C0 ConcentrationActivity
Concentration
2.4×10⁻³
Trench 2.6×10⁻¹²
7.7×10⁻²⁴
6.3×10⁻¹⁵
1.9×10⁻²⁶
1.5×10⁻⁹
4.5×10⁻²¹
2.4×10⁻¹²
7.1×10⁻²⁴
5.8×10⁻¹⁵
1.7×10⁻²⁶
1.4×10⁻⁹
4.2×10⁻²¹
Vault 2.9×10⁻¹²
7.7×10⁻²⁴
7.0×10⁻¹⁵
5.0×10⁻²¹
1.7×10⁻⁹
1.2×10⁻¹⁵
3.2×10⁻¹²
9.3×10⁻²⁴
7.7×10⁻¹⁵
2.3×10⁻²⁶
1.8×10⁻⁹
5.5×10⁻²¹
Mine 1.7×10⁻¹¹
7.4×10⁻¹²
4.1×10⁻¹⁴
1.8×10⁻¹⁴
1.0×10⁻⁸
4.2×10⁻⁹
1.5×10⁻¹¹
6.5×10⁻¹²
3.6×10⁻¹⁴
1.5×10⁻¹⁴
8.8×10⁻⁹
3.7×10⁻⁹
24 Trench 2.3×10⁻¹⁴
4.8×10⁻²⁴
5.5×10⁻¹³
1.1×10⁻²²
8.9×10⁻⁸
1.8×10⁻¹⁷
2.1×10⁻¹⁴
4.4×10⁻²⁴
5.0×10⁻¹³
1.1×10⁻²²
8.0×10⁻⁸
1.8×10⁻¹⁷
Vault 2.8×10⁻¹⁴
4.8×10⁻²⁴
6.6×10⁻¹³
1.2×10⁻²²
1.1×10⁻⁷
1.8×10⁻¹⁷
3.1×10⁻¹⁴
5.2×10⁻²⁴
7.4×10⁻¹³
1.3×10⁻²²
1.2×10⁻⁷
2.1×10⁻¹⁷
Mine 2.4×10⁻¹²
3.0×10⁻¹⁴
5.7×10⁻¹¹
7.0×10⁻¹³
9.2×10⁻⁶
1.1×10⁻⁷
2.1×10⁻¹²
2.6×10⁻¹⁴
5.0×10⁻¹¹
6.2×10⁻¹³
8.0×10⁻⁶
9.9×10⁻⁸
19
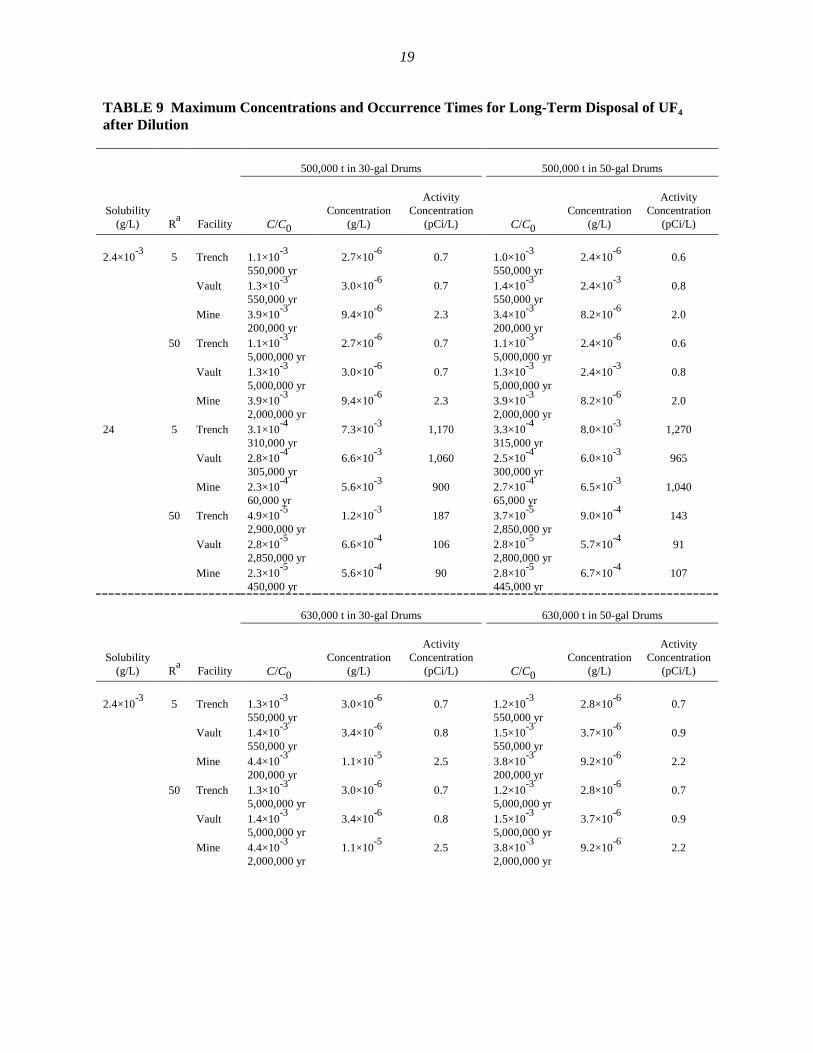
TABLE 9 Maximum Concentrations and Occurrence Times for Long-Term Disposal of UF4
after Dilution
500,000 t in 30-gal Drums 500,000 t in 50-gal Drums
Solubility(g/L) R
aFacility C/C0
Concentration(g/L)
ActivityConcentration
(pCi/L) C/C0
Concentration(g/L)
ActivityConcentration
(pCi/L)
2.4×10⁻³
5 Trench 1.1×10⁻³
550,000 yr2.7×10
-60.7 1.0×10
-3
550,000 yr2.4×10
-60.6
Vault 1.3×10⁻³
550,000 yr3.0×10
-60.7 1.4×10
-3
550,000 yr2.4×10
-30.8
Mine 3.9×10⁻³
200,000 yr9.4×10
-62.3 3.4×10
-3
200,000 yr8.2×10
-62.0
50 Trench 1.1×10⁻³
5,000,000 yr2.7×10
-60.7 1.1×10
-3
5,000,000 yr2.4×10
-60.6
Vault 1.3×10⁻³
5,000,000 yr3.0×10
-60.7 1.3×10
-3
5,000,000 yr2.4×10
-30.8
Mine 3.9×10⁻³
2,000,000 yr
9.4×10⁻⁶
2.3 3.9×10⁻³
2,000,000 yr8.2×10
-62.0
24 5 Trench 3.1×10⁻⁴
310,000 yr7.3×10
-31,170 3.3×10
-4
315,000 yr8.0×10
-31,270
Vault 2.8×10⁻⁴
305,000 yr6.6×10
-31,060 2.5×10
-4
300,000 yr6.0×10
-3965
Mine 2.3×10⁻⁴
60,000 yr5.6×10
-3900 2.7×10
-4
65,000 yr6.5×10
-31,040
50 Trench 4.9×10⁻⁵
2,900,000 yr1.2×10
-3187 3.7×10
-5
2,850,000 yr9.0×10
-4143
Vault 2.8×10⁻⁵
2,850,000 yr6.6×10
-4106 2.8×10
-5
2,800,000 yr5.7×10
-491
Mine 2.3×10⁻⁵
450,000 yr5.6×10
-490 2.8×10
-5
445,000 yr6.7×10
-4107
630,000 t in 30-gal Drums 630,000 t in 50-gal Drums
Solubility(g/L) R
aFacility C/C0
Concentration(g/L)
ActivityConcentration
(pCi/L) C/C0
Concentration(g/L)
ActivityConcentration
(pCi/L)
2.4×10⁻³
5 Trench 1.3×10⁻³
550,000 yr3.0×10
-60.7 1.2×10
-3
550,000 yr2.8×10
-60.7
Vault 1.4×10⁻³
550,000 yr3.4×10
-60.8 1.5×10
-3
550,000 yr3.7×10
-60.9
Mine 4.4×10⁻³
200,000 yr1.1×10
-52.5 3.8×10
-3
200,000 yr9.2×10
-62.2
50 Trench 1.3×10⁻³
5,000,000 yr3.0×10
-60.7 1.2×10
-3
5,000,000 yr2.8×10
-60.7
Vault 1.4×10⁻³
5,000,000 yr3.4×10
-60.8 1.5×10
-3
5,000,000 yr3.7×10
-60.9
Mine 4.4×10⁻³
2,000,000 yr1.1×10
-52.5 3.8×10
-3
2,000,000 yr9.2×10
-62.2

20
TABLE 9 (Cont.)
630,000 t in 30-gal Drums 630,000 t in 50-gal Drums
Solubility(g/L) R
aFacility C/C0
Concentration(g/L)
ActivityConcentration
(pCi/L) C/C0
Concentration(g/L)
ActivityConcentration
(pCi/L)
24 5 Trench 4.3×10⁻⁴
310,000 yr1.0×10
-21,640 4.5×10
-4
315,000 yr1.1×10
-21,730
Vault 3.9×10⁻⁴
310,000 yr9.4×10
-31,500 3.5×10
-4
308,000 yr8.5×10
-31,350
Mine 3.3×10⁻⁴
65,000 yr7.9×10
-31,260 3.8×10
-4
75,000 yr9.2×10
-31,470
50 Trench 4.1×10⁻⁵
2,800,000 yr9.9×10
-4159 3.2×10
-5
2,700,000 yr7.8×10
-4124
Vault 3.9×10⁻⁵
2,900,000 yr9.4×10
-4150 3.5×10
-5
2,870,000 yr8.3×10
-4132
Mine 3.3×10⁻⁵
452,000 yr7.9×10
-4126 3.8×10
-5
452,000 yr9.2×10
-4147
aR = retardation factor.

21
4 DISCUSSION
As indicated in Table 8, all of the contaminant concentrations and activity concentrationsat the water table would be very low, even for a fairly mobile compound (retardation of 5). Ingeneral, the concentrations after 1,000 years at the water table would be about an order of magnitudegreater for disposal in a deep mine than for disposal in a trench or vault.
Out of all the options and potential contaminants considered in this study, the largestactivity concentration at the water table after 1,000 years would be derived from a failed mine thatreleased a fairly mobile and highly soluble uranium complex. This concentration would be about8.6 × 10-6 pCi/L for 500,000 t of UF4 disposed of in 30-gal drums. The smallest activityconcentrations at the water table after 1,000 years would, in general, be derived from a failed trench(1.2 × 10⁻⁹ pCi/L), if the contaminant reached the water table as schoepite.
Although all the activity concentrations at the water table after 1,000 years are predictedto be small, maximum activity concentrations could still be large, even after dilution (Table 9).Maximum activity concentrations of uranium would exceed 900 pCi/L for a failed disposal facilityif a highly soluble uranium complex formed and if this compound was fairly mobile in thegroundwater system. If the solubility of the uranium compound was small (2.4 × 10⁻³ g/L), theresulting uranium activity concentrations would be small, less than 2.5 pCi/L.

22
5 REFERENCES
Bear, J., 1972, Dynamics of Fluids in Porous Media, American Elsevier Publishing Company,New York, N.Y.
Cember, H., 1989, Introduction to Health Physics, Pergamon Press, New York, N.Y.
DOE, 1997, Programmatic Environmental Impact Statement for Alternative Strategies for the Long-Term Management and Use of Depleted Uranium Hexafluoride, Volumes 1 and 2, Office of NuclearEnergy, Science and Technology, Germantown, Md., Dec.
DOE and EPA, 1999, Understanding Variation in Partition Coefficient, Kd, Values, Volume II:Review of Geochemistry and Available Kd Values for Cadmium, Cesium, Chromium, Lead,Plutonium, Radon, Strontium, Thorium, Tritium (3H), and Uranium, U.S. Department of Energy,Office of Environmental Restoration, and U.S. Environmental Protection Agency, Office of SolidWaste Management and Emergency Response, Washington, D.C., Aug.
Folga, S., and P. Kier, 2001, Engineering Analysis for Disposal of Depleted Uranium Tetrafluoride(UF4), ANL/DIS/TM-104, Argonne National Laboratory, Argonne, Ill.
Freeze, R.A., and J.A. Cherry, 1979, Groundwater, Prentice-Hall, Inc., Englewood Cliffs, N.J.
Gmelin, L., 1983, Gmelin Handbook of Inorganic Chemistry, 8th Edition, Springer-Verlag,New York, N.Y.
Hildebrand, F.B., 1976, Advanced Calculus for Applications, Prentice-Hall, Inc., Englewood Cliffs,N.J.
Kozak, M.W., et al., Performance Assessment of the Proposed Disposal of Depleted Uranium asClass A Low-Level Waste, FIN A1764, Final Letter Report, prepared by Sandia NationalLaboratories, Albuquerque, N.M., for the Office of Nuclear Material Safety and Safeguards,U.S. Department of Energy, Dec.
Lallemand-Barres, A., and P. Peaudecerf, 1978, “Recherche des Relations entre a Valeur de laDispersivite Macroscopique d’un Milieu Aquifere, Ses Autres Caracteristiques et les Conditions deMesure,” Bulletin Bureau Geologique Minieres 4:277–284.
Langmuir, D., 1978, “Uranium Solution-Mineral Equilibria at Low Temperatures with Applicationsto Sedimentary Ore Deposits,” Geochim. Cosmochim. Acta 42:547–569.

23
Rice, R.C., et al., 1989, “Ionic Composition of Vadose Zone Water in an Arid Region,” GroundWater 27(6):813–822.
Tomasko, D., 1997a, unpublished information on water and soil impacts to support the depleted UF6
PEIS, Argonne National Laboratory, Argonne, Ill.
Tomasko, D., 1997b, An Analytical Model for Predicting Transport in a Coupled Vadose/PhreaticSystem, ANL/EAD/TM-68, Argonne National Laboratory, Argonne, Ill.

24