groundwater bank energy storage systems · 2018-02-12 · groundwater bank energy storage systems ....
TRANSCRIPT

Energy Research and Development Division
FINAL PROJECT REPORT
Groundwater Bank Energy Storage Systems A Feasibility Study for Willow Springs Water Bank
California Energy Commission Edmund G. Brown Jr., Governor
December 2017 | CEC-500-2017-042
PREPARED BY: Antelope Valley Water Storage, LLC
Primary Author(s):
Mark Beuhler
Naheed Iqbal
Zachary Ahinga
Contributor(s):
Lon W. House
Antelope Valley Water Storage, LLC
1672 W Avenue J Suite 207
Lancaster, CA 93534
Phone: 323-860-4824 | Fax: 661-945-4554
Contract Number: EPC-15-049
PREPARED FOR:
California Energy Commission
Yu Hou
Project Manager
Aleecia Gutierrez
Office Manager
ENERGY GENERATION RESEARCH OFFICE
Laurie ten Hope
Deputy Director
ENERGY RESEARCH AND DEVELOPMENT DIVISION
Drew Bohan
Executive Director
DISCLAIMER
This report was prepared as the result of work sponsored by the California Energy Commission. It does
not necessarily represent the views of the Energy Commission, its employees or the State of California.
The Energy Commission, the State of California, its employees, contractors and subcontractors make no
warranty, express or implied, and assume no legal liability for the information in this report; nor does
any party represent that the uses of this information will not infringe upon privately owned rights. This
report has not been approved or disapproved by the California Energy Commission nor has the California
Energy Commission passed upon the accuracy or adequacy of the information in this report.

i
ACKNOWLEDGEMENTS
The authors thank the following individuals and organizations for their support towards the
completion of this study:
Technical Advisory Committee members: Angelina Galiteva (California ISO Board of Governors),
Adam Hutchinson (Orange County Water District [OCWD]), Ted Johnson (Water Replenishment
District of Southern California [WRD]), Garry Maurath (California Energy Commission), and
Robert Wilkinson (University of California, Santa Barbara)
Yu Hou (California Energy Commission)
Tommy Ta (Antelope Valley Water Storage, LLC)
Will Boschman of the Semitropic-Rosamond Water Bank Authority for selected photographs
Subcontractor firm: HDR Engineering, Inc. (HDR)
The authors also thank the agencies that responded to the survey: Castaic Lake Water Agency
(CLWA); City of Bakersfield, Water Resources Department; Elsinore Valley Municipal Water
District; Foothill Municipal Water District; James Irrigation District; Mojave Water Agency;
Monterey Peninsula Water Management District; Orange County Water District; Root Creek
Water District; Rosedale-Rio Bravo Water Storage District; San Bernardino Valley Water
Conservation District; Three Valleys Municipal Water District; United Water Conservation
District; and Western Municipal Water District

ii
PREFACE
The California Energy Commission’s Energy Research and Development Division supports
energy research and development programs to spur innovation in energy efficiency, renewable
energy and advanced clean generation, energy-related environmental protection, energy
transmission and distribution and transportation.
In 2012, the Electric Program Investment Charge (EPIC) was established by the California Public
Utilities Commission to fund public investments in research to create and advance new energy
solutions, foster regional innovation, and bring ideas from the lab to the marketplace. The
California Energy Commission and the state’s three largest investor-owned utilities – Pacific Gas
and Electric Company, San Diego Gas & Electric Company and Southern California Edison
Company – were selected to administer the EPIC funds and advance novel technologies, tools,
and strategies that provide benefits to their electric ratepayers.
The Energy Commission is committed to ensuring public participation in its research and
development programs that promote greater reliability, lower costs, and increase safety for the
California electric ratepayer and include:
• Providing societal benefits.
• Reducing greenhouse gas emissions in the electricity sector at the lowest possible cost.
• Supporting California’s loading order to meet energy needs first with energy efficiency
and demand response, next with renewable energy (distributed generation and utility
scale), and finally with clean, conventional electricity supply.
• Supporting low-emission vehicles and transportation.
• Providing economic development.
• Using ratepayer funds efficiently.
Groundwater Bank Energy Storage Systems: A Feasibility Study for Willow Springs Water Bank is
the final report for the Electricity Pumped Storage Systems Using Underground Reservoirs: A
Feasibility Study for the Antelope Valley Water Storage System project (Agreement Number EPC-
15-049, Solicitation Number GFO-15-309) conducted by Antelope Valley Water Storage, LLC. The
information from this project contributes to the Energy Research and Development Division’s
EPIC Program.
For more information about the Energy Research and Development Division, please visit the
Energy Commission’s website at www.energy.ca.gov/research/ or contact the Energy
Commission at 916-327-1551.

iii
ABSTRACT
Increased renewable generation in California has resulted in an excess of electricity supply
during certain periods of the day. Energy storage systems make it possible to repurpose the
supply glut to meet grid demands during peak hours and help integrate renewable energy into
the electric grid. Pumped storage is a well-established type of energy storage that uses water to
store energy during the off-peak (low-demand) hours. The stored energy is released during peak
hours when there is a spike in electricity demand. Integrating pumped storage with
groundwater banking operations has the potential to increase the number and types of areas
where pumped storage can be implemented. This study addressed the knowledge gaps
associated with having onsite pumped storage at groundwater storage called banks. The study
evaluated two pumped storage systems: Peak Hour Pumped Storage, with all the components
aboveground, and aquifer pumped hydro (APH), which uses the aquifer as the lower reservoir.
The project team also assessed hydropower generation and demand response potential of
groundwater banking projects in addition to pumped storage. These configurations and the
corresponding economic values were analyzed for an existing groundwater banking project,
Willow Springs Water Bank, which served as a case study for this project. The research team
used the WSWB findings to evaluate the potential of implementing statewide peak hour pumped
storage and aquifer pumped hydroelectricity. The analysis shows the demand response during
a dry hydrologic year has the highest value. To enhance the economic viability of energy storage
systems and address the grid demands, a groundwater bank should be configured to provide
demand response during a dry year as well as hydropower generation, demand response, and
pumped storage benefits in other hydrologic year types.
Keywords: California Energy Commission, pumped storage, groundwater banks, energy storage
systems, demand response, hydropower generation, renewable energy
Please use the following citation for this report:
Beuhler, Mark, Naheed Iqbal, Zachary Ahinga, and Lon W. House. Antelope Valley Water Storage,
LLC. 2017. Groundwater Bank Energy Storage Systems: A Feasibility Study for Willow
Springs Water Bank. California Energy Commission. Publication Number: CEC-500-2017-
042.

iv
TABLE OF CONTENTS
Page
ACKNOWLEDGEMENTS ..................................................................................................................................... i
PREFACE .............................................................................................................................................................. ii
ABSTRACT ........................................................................................................................................................ iii
TABLE OF CONTENTS...................................................................................................................................... iv
LIST OF FIGURES ............................................................................................................................................ vii
LIST OF TABLES .............................................................................................................................................. vii
EXECUTIVE SUMMARY ..................................................................................................................................... 1
Introduction................................................................................................................................................ 1
Project Purpose .......................................................................................................................................... 1
Project Process ........................................................................................................................................... 2
Project Results ........................................................................................................................................... 3
Benefits to California ................................................................................................................................ 4
CHAPTER 1: Introduction ................................................................................................................................ 5
1.1 Background ........................................................................................................................................ 5
1.2 Objectives .......................................................................................................................................... 7
1.3 Energy Storage Systems at Groundwater Banks ........................................................................ 8
1.3.1 Willow Springs Water Bank ........................................................................................................ 9
CHAPTER 2: Aquifer Pumped Hydro at Willow Springs Water Bank .................................................. 11
2.1 Key Parameters for Power Generation ...................................................................................... 15
2.2 Round Trip-Efficiency and Head Loss Effects ......................................................................... 16
2.2.1 WSWB Site - Aquifer Pumped Hydro Round-Trip Efficiency ............................................ 16
2.2.2 Head Loss Due to Drawdown and Mounding ...................................................................... 20
2.2.3 Key Finding ................................................................................................................................. 22
2.3 Power Generation for a Single APH Turbine Setup ................................................................ 25
2.4 Cost Estimates ............................................................................................................................... 26
2.5 State Water Resources Control Board (SWRCB) Regulations ............................................... 29
2.5.1 Short Term Pilot Test ............................................................................................................... 29
2.5.2 Long Term Projects ................................................................................................................... 29
2.6 Demand Response Potential of the Well Field ........................................................................ 30

v
2.6.1 Automated Remote Control of the Well Field System ...................................................... 30
CHAPTER 3: Peak Hour Pumped Storage at Willow Springs Water Bank ........................................... 33
3.1 Operating Scenarios ...................................................................................................................... 34
3.2 Components and Factors for Peak Hour Pumped Storage ................................................... 35
3.2.1 Reservoir Site Analysis ............................................................................................................. 35
3.2.2 Selection of Generator Type ................................................................................................... 38
3.2.3 Total Energy Losses .................................................................................................................. 40
3.3 Calculation of Hydropower Generation.................................................................................... 40
3.4 Extended Duration Battery Potential ........................................................................................ 41
3.5 Demand Response Potential of the Pumping Plant ............................................................... 42
3.6 Cost Estimates ............................................................................................................................... 42
3.7 CEQA Considerations ................................................................................................................... 43
3.8 Summary of WSWB Pumped Storage Analysis ........................................................................ 44
CHAPTER 4: Statewide Applicability Analysis ......................................................................................... 47
4.1 Literature Review and Statewide Survey .................................................................................. 47
4.2 Analysis Approach for Peak Hour Pumped Storage .............................................................. 48
4.2.1 Statewide PHPS Potential at Groundwater Banking Projects ........................................... 49
4.3 Aquifer Pumped Hydro Potential ............................................................................................... 51
4.3.1 Aquifer Storage and Recovery (ASR) Projects ..................................................................... 52
4.3.2 Recycled Water for Direct Injection ...................................................................................... 52
4.4 Demand Response Potential of Groundwater Banks ............................................................. 55
4.4.1 Peak Energy Requirements at Groundwater Banks............................................................ 56
4.4.2 Demand Response Potential Associated with Well Pumps .............................................. 56
4.4.3 Demand Response Potential associated with Pump Station(s) ....................................... 58
4.5 Regulatory Considerations .......................................................................................................... 58
4.6 Template to Assess Pumped Storage Potential ...................................................................... 59
4.7 Summary of Statewide Analysis ................................................................................................. 60
CHAPTER 5: Economics Evaluation ............................................................................................................ 63
5.1 Participation in ISO Markets ....................................................................................................... 63
5.1.1 Day-Ahead market .................................................................................................................... 63
5.1.2 Real-time market ....................................................................................................................... 63
5.1.3 Ancillary service market .......................................................................................................... 64
vi
5.1.4 Load Participation ..................................................................................................................... 64
5.1.5 Other Markets/Services ........................................................................................................... 65
5.2 Economics Analysis Approach ................................................................................................... 68
5.3 Economic Feasibility at Willow Springs Water Bank .............................................................. 68
5.3.1 Operating Scenarios.................................................................................................................. 68
5.3.2 StorageVET™ Model .................................................................................................................. 70
5.3.3 Aquifer Pumped Hydro (APH) Economics ............................................................................ 70
5.3.4 Peak Hour Pumped Storage (PHPS) Economics ................................................................... 72
5.3.5 Dry Year (35% probability) – Demand Response ................................................................ 74
5.4 Economic Evaluation for Statewide Pumped Storage at Groundwater Banks .................. 78
5.4.1 Potential Markets and Services .............................................................................................. 78
5.4.2 Statewide Potential from Adding Pumped Storage to Groundwater Banks ................. 82
CHAPTER 6: Project Benefits ....................................................................................................................... 85
6.1 Addressing the Duck Curve Problem ........................................................................................ 85
6.1.1 Wet Hydrologic Year ................................................................................................................. 87
6.1.2 Neutral Hydrologic Year .......................................................................................................... 87
6.1.3 Dry Hydrologic Year ................................................................................................................. 88
6.2 Greenhouse Gas (GHG) Emissions Reduction ......................................................................... 89
CHAPTER 7: Results and Conclusions ....................................................................................................... 91
GLOSSARY ....................................................................................................................................................... 94
REFERENCES .................................................................................................................................................... 95
APPENDIX A: Sensitivity Analysis ..............................................................................................................A-1
APPENDIX B: Field Measurement of Well Startup & Shutdown Time Durations ............................. B-1
APPENDIX C: WSWB Upper and Lower Reservoir Site Maps ................................................................ C-1
APPENDIX D: Statewide Survey Results................................................................................................... D-1
APPENDIX E: Small Hydropower Potential for Groundwater Banking Agencies ............................. E-1
APPENDIX F: Well Pumps Demand Response Potential for Selected Groundwater Banking
Projects ........................................................................................................................................................... F-1
APPENDIX G: List of Required Permits and Registrations ................................................................... G-1
APPENDIX H: Willow Springs Water Bank Fact Sheet ........................................................................... H-1
APPENDIX I: Supplementary Documents for Pumped Storage Analysis at Willow Springs Water
Bank – Attachments II-V ............................................................................................................................... I-1

vii
LIST OF FIGURES
Page
Figure 1: Recharge Basins at a Typical Groundwater Banking Project .................................................. 6
Figure 2: Facility Layout for Pumped Storage at a Groundwater Bank .............................................. 10
Figure 3: A Unit of the APH Pumped Hydroelectric System ................................................................. 12
Figure 4: An APH Unit in Generating and Storing Modes ...................................................................... 13
Figure 5: Interaction of APH unit with the electrical grid ..................................................................... 14
Figure 6: APH Modules Within the Well Array ......................................................................................... 15
Figure 7: Pump Test Data for WSWB Well AV-2....................................................................................... 18
Figure 8: Pump Test Data for WSWB Well AV-5....................................................................................... 18
Figure 9: Pump Test Data for WSWB Well AV-3....................................................................................... 19
Figure 10: WSWB Hydropower Generation Operations .......................................................................... 34
Figure 11: Potential Upper and Lower Reservoir Sites ........................................................................... 36
Figure 12: Francis Turbine ........................................................................................................................... 38
Figure 13: Five-Jet Pelton Wheel Impulse Turbine (Elevation and Plan Views) ................................. 39
Figure 14: A Groundwater Well at Willow Springs Water Bank............................................................ 45
Figure 15: Monthly Groundwater Production (taf) by Hydrologic Region and Type of Use .......... 57
Figure 16: Operating Configurations for WSWB by Year Type ............................................................ 69
Figure 17: Renewable Energy Generation, April 27, 2017 ..................................................................... 85
Figure 18: California ISO “Duck Curve” .................................................................................................... 86
Figure 19: WSWB PHPS Hypothetical Operation During Wet Year ...................................................... 87
Figure 20: WSWB PHPS Hypothetical Operation During Neutral Year ................................................ 88
Figure 21: WSWB Hypothetical Operation During Dry Year ................................................................. 88
LIST OF TABLES
Page
Table 1: Summary of Pump Test Data for WSWB Wells AV-2, AV-3 and AV-5 ................................. 17
Table 2: Summary of Drawdown Efficiency ............................................................................................. 21
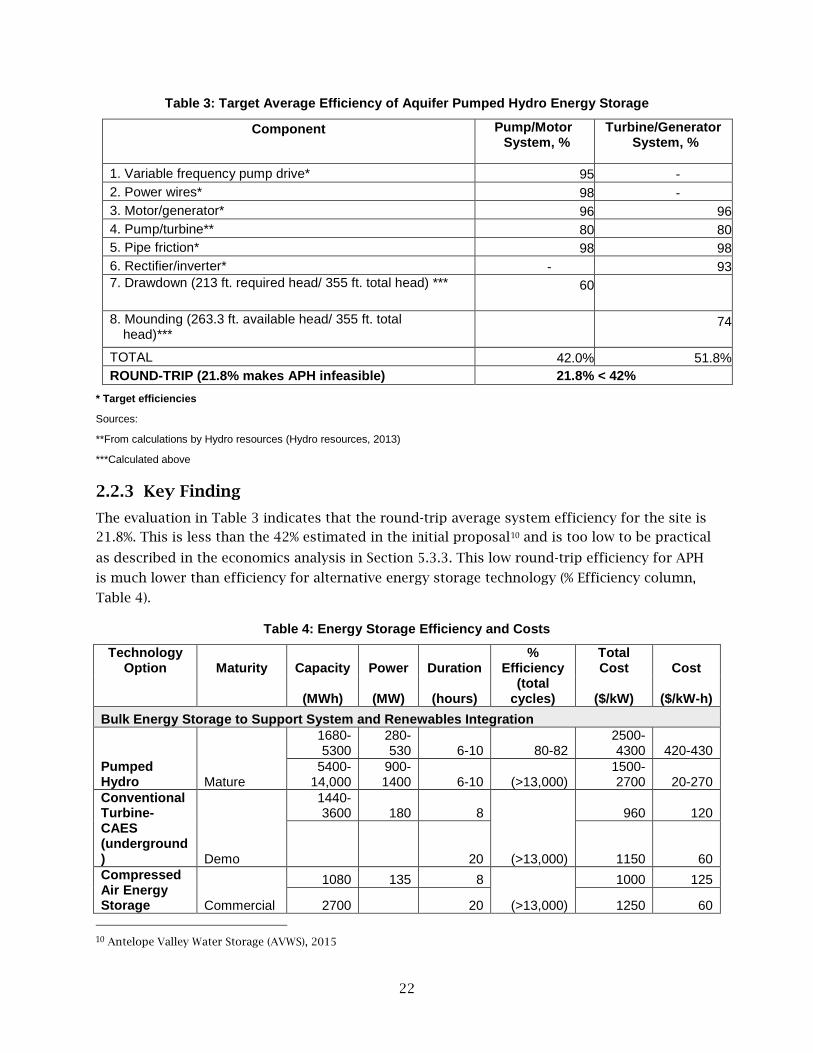
Table 3: Target Average Efficiency of Aquifer Pumped Hydro Energy Storage ............................... 22
Table 4: Energy Storage Efficiency and Costs .......................................................................................... 22
Table 5: Power Calculation for One “Pump As Turbine” Setup at WSWB .......................................... 24
viii
Table 6: Potential Power Generation for Well AV-5 at WSWB ............................................................... 25
Table 7: Capital Cost of Facilities for One Aquifer Pumped Hydro Unit ........................................... 27
Table 8: Costs to Generate Hydropower Using Existing Wells at WSWB ............................................ 28
Table 9: Cost to Install one XiO Field-Installed Well Control Unit ...................................................... 31
Table 10: Summary of Potential Land for Upper Reservoir .................................................................. 37
Table 11: Summary of Potential Land for Lower Reservoir .................................................................. 38
Table 12: Reservoir, Generator, and Pump Power Calculations........................................................... 41
Table 13: Summary of Upper and Lower Reservoir Sizing ................................................................... 41
Table 14: Capital Cost of Facilities for PHPS and Demand Response ................................................ 43
Table 15: Power Generation and Demand Response Potential at WSWB ........................................... 44
Table 16: Peak-Hour Pumped Storage (PHPS) potential at Groundwater Banking Projects ........... 51
Table 17: Projects Using Recycled Water for Groundwater Recharge via Injection ........................ 53
Table 18: Planned Projects Using Recycled Water for Groundwater Recharge via Injection ........ 54
Table 19: Demand Response Potential of Well Pumps at Groundwater Banking Projects ............ 58
Table 20: Storage Reliability Services and Nonreliability Services ...................................................... 65
Table 21: Potential Markets and Services for Groundwater Bank Pumped Storage Operation .... 66
Table 22: StorageVET™ Technology Parameters Used for WSWB APH Simulation ......................... 71
Table 23: Economics of APH Operation at WSWB ................................................................................... 71
Table 24: StorageVET™ Technology Parameters Used for WSWB PHPS Simulation ........................ 72
Table 25: WSWB PHPS Operation (Neutral Year – 33% Probability) ..................................................... 73
Table 26: WSWB Hydroelectric Generator Mode (Wet Year – 32% Probability) ................................. 73
Table 27: Cost -Effectiveness of PHPS and Hydropower Generation at WSWB ................................ 74
Table 28: Types of Demand Response ...................................................................................................... 75
Table 29: WSWB Operated as a Continuous Load (Dry Year – 35% Probability) ............................... 76
Table 30: Comparison of WSWB APH and PHPS Characteristics and Analysis ................................ 76
Table 31: Potential Markets for Groundwater Bank Energy Operations ............................................ 79
Table 32: Statewide Potential, Benefits, and Costs of Pumped Storage at Groundwater Banks ... 83
Table 33: Annual GHG Emissions Reduction from PHPS at Groundwater Banks ............................ 89

ix

1
EXECUTIVE SUMMARY
Introduction
California is experiencing a surge in renewable energy generation, resulting in challenges
operating the electricity grid. Solar generators compose the majority of renewable energy and
their output varies throughout the day. This varation causes a mismatch between energy supply
and demand, with a glut of supply in the afternoon hours (when solar generation peaks) and a
shortage of supply in the evening hours (when the renewable generation ceases for the day). To
address this supply and demand mismatch and move the excess energy supply from periods of
low demand to periods of high demand, the electric grid must have energy storage systems.
Pumped storage is an established energy storage technology used nationwide. It works by
pumping water from a lower reservoir to a higher one. Electricity is generated when the stored
water at the higher elevation returns to the lower reservoir through a turbine generator.
Project Purpose
This project evaluated the feasibility of using the conventional pumped storage concept in an
innovative way to provide cost-effective and reliable energy storage. California has numerous
groundwater banking facilities that safeguard against potential water shortages (such as the
ones occurring during the recent 2013—2015 drought). The banking facilities store water in the
natural underground reservoirs (aquifers) in wet years and pump it out in dry years via
groundwater wells. The project examines the possibility of using pumped storage at these
groundwater banks. Since the primary function of these banking facilities is water storage,
there is no precedent for evaluating them for pumped storage. These sites present an
opportunity to store energy for pumped storage systems because they have water supplies and
an existing infrastructure (including wells and pipelines) to cycle the water for energy storage.
Implementing pumped storage at these sites requires minimal additional facilities and has a
smaller environmental footprint than that of conventional pumped storage.
The project evaluates two pumped storage technologies: peak-hour pumped storage and
aquifer pumped hydro for their applicability of these technologies at groundwater banks.
Conceptually, peak-hour pumped storage operates like the conventional pumped storage
without building new dedicated facilities such as large surface reservoirs, modifying and
enhancing existing ground water banking facilities with hydroelectric generators and surface
storage reservoirs. Existing water is cycled between two surface reservoirs through a connecting
pipe to store and release energy. Aquifer pumped hydro uses the aquifer below a groundwater
bank as the lower reservoir, a small earthen reservoir as the upper reservoir and reversible
pump turbine groundwater wells instead of a pipeline to cycle water.
The Willow Springs Water Bank is a groundwater banking project located in Antelope Valley
(northern Los Angeles County), California on approximately 1,838 acres of agricultural land.
The upper surface reservoir is near the California Aqueduct, which is at higher elevation than
the lower surface reservoir at the water bank. However, peak-hour pumped storage is much
smaller in scale and can be used in areas that would normally be precluded from consideration

2
for conventional pumped storage. An aquifer pumped hydro unit uses the aquifer as a lower
reservoir in conjunction with a surface (upper) reservoir. A groundwater well cycles the water
between the two reservoirs. This is a novel form of pumped storage with numerous studies.
Project Process
The project team adopted a two-fold approach for this analysis. The peak-hour pumped storage
and aquifer pumped hydro potential was first determined for an existing groundwater banking
project, Willow Springs Water Bank (“the bank”). The Willow Springs Water Bank specific
analysis yielded criteria that the project team used to evaluate other sites and develop an
estimate of cumulative pumped storage capacity in megawatts (MW) available at statewide
groundwater banks.
Willow Springs Water Bank has a 5.2 MW capacity for peak-hour pumped storage and can
generate energy up to 12 hours daily depending on the size of the upper reservoir. During the
remaining hours, water is pumped to the upper reservoir to refill it. Statewide, the cumulative
peak-hour pumped storage potential is estimated to be 44 MW. Aquifer pumped hydro is
infeasible at Willow Springs Water Bank because of low round-trip efficiency. Preliminary
screening of other sites indicates the aquifer pumped hydro has limited statewide potential.
Economics Evaluation
Just as water storage infrastructure at groundwater banks can be used for energy storage, the
pumped storage facilities at groundwater banks can be used to provide energy benefits other
than energy storage. These benefits include hydropower generation (water passing through the
turbines to generate energy without first being pumped to an upper reservoir) and demand
response (changing load or demand based on grid requirements). Which of the energy benefits
occur at any time is determined by the hydrologic year type, which in turn determines the
operating mode for the groundwater banking facilities (including any installed pumped storage
facilities). The project team considered these additional benefits when evaluating the economic
feasibility of pumped storage at groundwater banks.
The operations of a typical groundwater banking project such as Willow Springs Water Bank
vary based on the hydrological year type. This study evaluates groundwater banking operations
in three hydrological year types: a wet year, a dry year, and a neutral or idle year. In contrast,
California Department of Water Resources (DWR) classifies a water year (October 1 – September
30) into five types: a wet year, an above-normal year, a below-normal year, a dry year and a
critical year. In this report, “wet” indicates a wet year as defined by DWR, “neutral” is used for
above- and below-normal year types, and “dry” represents the DWR defined dry and critical
hydrologic year types.
During a neutral or idle year type, the water bank is neither recharging nor extracting water.
During a wet year, the water bank is continuously recharging water. During a dry year, the
water bank continuously extracts water. For economic evaluation, an operating mode
configuration was assigned to each of these year types:

3
In a neutral year, the bank was assessed as a pumped storage facility that uses aquifer pumped
hydro or peak-hour pumped storage technology to generate when electricity prices are high,
and refill storage when prices are low. Because of the slow response time (the time required for
the aquifer to reestablish equilibrium as the operations are switched from pumping to
generating and vice versa) and low round-trip efficiency, aquifer pumped hydro at Willow
Springs Water Bank was found to be suited for only one electricity market; the day-ahead
energy market. The day-ahead market is an energy market matching electricity sellers and
buyers and closes the day before the day the energy will be used.
In a wet year, the project team assessed the bank as a generator that uses turbines (same
turbines as used for for peak-hour pumped storage in a neutral year) to generate 5.2 MW
constantly over the year. The aquifer pumped hydro units, which have reversible
pump/turbines cannot be used for generating year-round hydropower in a wet year. This is
because to generate hydropower, recharge water must be injected into the ground instead of
percolated. Injecting recharge water will incur additional compliance costs that make this type
of hydropower generation impractical.
In a dry year, the bank pumps the stored water and has pumping demand from groundwater
wells (17.2 MW) and the pump station (10.1 MW). In this year, the bank acts as a continuous
load and can be configured for demand response; that is, the wells and pump station can be
turned off during the on-peak (high electricity demand) periods.
The estimated statewide pumped storage and demand response potential was used in
conjunction with the operating configurations developed for the bank to evaluate the value of
pumped storage and associated benefits at other groundwater banks. This approach assumes
that Willow Springs Water Bank operations are representative of typical groundwater banking
projects. Therefore, all the groundwater banking projects in California (including Willow
Springs) have an estimated 44 MW of cumulative peak-hour pumped storage potential (in a
neutral year), 44 MW of cumulative hydropower generation potential (in a wet year), limited
cumulative APH potential (in a neutral year), and 220 MW of cumulative demand response
potential (in a dry year).
Project Results
Peak-hour pumped storage facilities, if configured appropriately, can be potentially
economically viable. It will be more challenging, however, for an aquifer pumped hydro setup to
be economical at typical groundwater banking projects. The net present value method was used
to evaluate costs and revenues for peak-hour pumped storage and aquifer pumped hydro. A
positive net present value indicates a project is financially viable. Projects with negative net
present value should generally be avoided. The results show that adding dry year demand
response to the wet and neutral year operations of a peak-hour pumped storage facility makes
it cost-effective. However, adding dry year demand response to APH is not enough to make the
technology cost-effective.
4
Benefits to California
Energy storage is one of the solutions being explored to address the imbalance in supply and
demand at various times of the day – the “duck curve” issue. Since renewables generate energy
mostly during the afternoon hours, there is overgeneration during the day. By evening as solar
generation peters out, the demand ramps up. This is reflected in a duck shaped profile (duck
curve) for the net electric demand with the belly of the duck representing the glut of energy
(low net demand) and the head representing the shortage (high net demand). This issue is
projected to worsen as more renewables come online. The analysis shows that the peak-hour
pumped storage facilities at groundwater banks can be economically viable if appropriately
configured and have the potential to address the duck curve problem by:
• Curtailing hydropower generation during the early afternoon (renewable overproduction
period) in a wet hydrologic year.
• Generating hydropower during the morning and evening ramp periods and increasing
demand (pumping load) to refill reservoirs during the early afternoon (renewable
overproduction period) in a neutral hydrologic year.
• Curtailing pumping load during the late afternoon ramping period and evening peak in a
dry hydrologic year.
Properly configured, peak-hour pumped storage facilities at groundwater banks will increase
the capability of the California electricity grid to integrate renewable energy and provide
reliable energy to ratepayers. Besides integrating renewable systems, pumped storage facilities
at groundwater banks also add to the California’s renewable generation capacity and provide
demand response benefits to assist the grid in the event of unplanned outages. Using small-
scale pumped storage also decreases the necessity for large, environmentally invasive new
reservoirs, reducing the risk of catastrophic floods after an earthquake. The statewide peak-
hour pumped storage potential of 44 MW is expected to address up to 1 percent of California’s
storage requirements and, on average, reduces annual greenhouse gas emissions by 44,000
metric tons of carbon dioxide equivalent (CO2e).
Statewide peak-hour pumped storage potential facilities of 44 MW with peak-hour pumped
storage facility used for pumped storage and hydropower generation and evaluated with dry
year demand response has an annual net benefit of $5.9 million, and the 220 MW of statewide
load used for demand response has an annual net benefit of $6.3 million.
The project team developed peak-hour pumped storage and APH templates that, together with
the California groundwater banking facilities database compiled specifically for this project,
can be used to identify potential sites for testing the pumped storage concepts in a next-step
pilot project. Particularly favorable sites include groundwater banks in the Tulare Basin and in
the Southern California coastal plain, where the pumped storage and the demand response
aspects can be exploited.

5
CHAPTER 1: Introduction
Groundwater banks are underground storage facilities used for banking or storing water. Stored
water can be recycled water, imported water from other areas (typically Northern California) or
local surface water. The underground saturated, permeable, water-bearing rock that transmits
groundwater is called an aquifer. Water is stored in an aquifer through artificial recharge in
years of water surplus and recovered during years when there is a water shortage. Groundwater
wells are typically used to recover water from an aquifer.
In addition to the primary function of water storage, groundwater banks provide an
opportunity to store energy. Harnessing the potential of water for energy storage is not new.
Conventional water storage or pumped storage is a well-established technology with multiple
projects in California. In contrast, pumped storage using a groundwater bank and the aquifer is
far from established. This Electric Program Investment Charge (EPIC) funded project assesses
the statewide pumped storage potential of groundwater banks and provides a framework to use
groundwater banks for cost-effective and efficient distributed energy storage. The study
investigates two different kinds of pumped storage. The first one called peak-hour pumped
storage (PHPS) is similar to the conventional pumped storage with the difference being that
instead of building new dedicated facilities including large surface reservoirs, existing
groundwater banking facilities can be modified and enhanced with hydroelectric generators and
surface storage reservoirs to cycle water with a much smaller environmental footprint. The
second one called aquifer pumped hydro (APH) uses the aquifer below a groundwater bank as
the lower reservoir, a small earthen reservoir as the upper reservoir and reversible pump
turbine groundwater wells (instead of a pipeline) to cycle the water.
1.1 Background The increased renewable generation in California has made integrating renewables into the grid
a top priority. Energy storage systems are necessary to smoothly integrate renewables such as
wind and solar and to overcome the “duck curve” problem. The duck curve problem is an
imbalance in supply and demand at various times of the day resulting from the nature of the
renewables (particularly solar). Since renewables resources generate energy mostly during the
afternoon hours, there is overgeneration during the day. By evening as solar generation peters
out, the demand ramps up. Consequently, the daily net electric demand (total demand for
electricity net the renewable generation) changes considerably throughout the day. This change
in demand is reflected in a duck-shaped profile (duck curve) for the net electric demand with
the belly of the duck representing the glut of energy (low net demand) and the head
representing the shortage (high net demand). For additional information on the duck curve see
Section 6.1.
Without adequate storage, the duck curve problem is projected to be exacerbated as more
renewable sources come online to meet California’s target of 50% renewable electricity by 2030

6
and the potential goal of 100% by 2045.1 The capability to provide peak electricity during the
early evening as solar generation ramps down becomes increasingly important. Consequently,
various storage technologies are being explored and developed to provide reliable and cost-
effective storage. Conventional pumped hydroelectric storage has been the dominant energy
storage technology in the United States and has been widely deployed all over the country and
globally to provide peak-hour energy and to increase grid reliability and flexibility. The
conventional form of pumped storage uses two reservoirs (usually a dam and an aqueduct)
situated at different elevations to cycle the water. Water is pumped to the higher elevation
reservoir during off-peak hours to store energy. During on-peak hours, water flows by gravity to
the lower reservoir generating energy in the process. This technology is limited by topography,
environmental concerns, high cost, and the large size requirements are necessary to make it
practical. Most of the best sites for surface reservoirs have already been taken limiting the
wider use of pumped storage.
Groundwater banks (Figure 1) offer an opportunity to expand the geographic scope of pumped
storage. As traditional pumped storage, pumped storage at groundwater banks has the
potential to store excess energy during nonpeak hours for release during the dusk (peak) hours
when the grid requires it the most. Using groundwater banks for pumped storage operations
will also have fewer environmental impacts including reduced risk of catastrophic flooding.
Unlike traditional pumped storage, using pumped storage in conjunction with a groundwater
bank remains largely unexplored. This study is the first of its kind to put forward a conceptual
framework to assess the potential of pumped storage at groundwater banks in California. It
identifies and analyzes current policy, regulatory, economic and technical parameters pertinent
to implementing pumped storage operations at existing and planned groundwater banks to
determine the value of the PHPS and APH energy storage system technologies. The value of
these technologies lies in their role as “transition” energy storage systems – they will start up
when the quick-response (seconds) but low-capacity energy storage (battery/flywheels) runs out
and before slow-response (minutes or hours) but high-capacity storage (large pumped
hydroelectric facilities) engages. Statewide application of pumped storage at groundwater banks
has the potential to enhance grid reliability with greater integration of solar and wind energy
and providing power during unplanned outages.
The study establishes the potential of pumped storage at an existing large groundwater bank in
the Antelope Valley (northern Los Angeles County), Willow Springs Water Bank (variously
referred to as “the bank” or WSWB in this report) and identifies criteria thresholds that must be
met for the successful deployment of the two energy storage systems (ESS) at other
groundwater banks. This information is used to provide estimates of statewide potential, taking
into consideration specific characteristics of other regions and other groundwater banking
projects. The statewide potential is evaluated in context of the state’s storage requirements
with description of major limitations and anticipated costs and benefits.
1 Senate Bill 100

7
Figure 1: Recharge Basins at a Typical Groundwater Banking Project
Figure 1 shows recharge activities via spreading at Semitropic Groundwater Storage Bank in California’s Central Valley. Although groundwater banks have traditionally been used only for water storage, they may have potential as energy storage systems as well.
Source: (Semitropic Water Storage District, 2017)
1.2 Objectives The study has three objectives:
• Feasibility analysis of PHPS and APH technologies at WSWB including development of
optimized facilities layout for the two energy storage systems (ESSs)
• Assessment of statewide potential of the pumped storage at groundwater banks including
identification of criteria and specific groundwater banking sites or regions where the
two technologies are likely to be successful
• Estimation of the value of energy storage and other grid benefits provided by the two
technologies.
The key features of the study include analyzing the impact of various storage capacities on the
duration of energy release; developing an optimized layout containing specifications for
reservoirs, generators, and locations along with the corresponding peak power generation
potential in MW; creating a template that can be used to determine the groundwater banking
areas where energy storage and peak power generation are practical, and providing initial
estimates of peak energy generation and associated grid support benefits resulting from
pumped storage at groundwater banks. Ultimately, this study should provide a preliminary
assessment of the statewide potential for pumped storage systems at groundwater banking
projects.

8
1.3 Energy Storage Systems at Groundwater Banks Groundwater banks have not traditionally been targeted to provide peak energy. There are more
than 90 groundwater banking projects across California.2 Many new groundwater banking
operations and recycled water programs are planned as a result of the Water Quality, Supply,
and Infrastructure Improvement Act of 2014 (Proposition 1) and Sustainable Groundwater
Management Act (SGMA). This study evaluates the potential of two as-yet-untested pumped
storage technologies at groundwater banks. The PHPS technology uses a combined pump-
generator pumping station in conjunction with an upstream surface reservoir and a
downstream surface reservoir. PHPS is best suited for groundwater banks that have elevational
differences within the groundwater bank and suitable surface area to construct additional
surface storage reservoirs. The elevation difference between the reservoirs provides the
pumping lift and the reservoirs are connected by a pipe. Energy is generated when the water
flows to the lower reservoir during peak hours when the electricity demand is high. During
nonpeak hours energy is stored by transporting water to the upper reservoir. Depending on the
size of the reservoirs and the pumping lift involved, a PHPS project can discharge energy over a
long duration or during the peak hours and allows rapid demand management. Although
relatively proven, PHPS is a novel concept in the context of being implemented at a
groundwater bank for daily peaking.
APH is an underground pumped hydroelectric energy storage method that uses aquifer as the
lower reservoir of a pumped hydro system. An APH unit consists of a reversible pump-turbine,
a well, and related equipment. The pump-turbine generates electricity from water flowing down
the well hole. It stores electricity at other times by pumping water up the well to a surface
reservoir using electric power. APH is best suited for groundwater banks that have aquifers
with high groundwater transmissivity, deep water levels, and surplus well capacity. APH can be
implemented as a modular array to capture electrical oversupply, store electrical energy and
provide distributed generation and demand response. Most of the studies of underground
pumped hydro concept date back to 1970s and 1980s3 and focus on using a large underground
cavern, either available from abandoned mines or excavated, as the lower reservoir. Energy
storage needs have caused a resurgence of interest in the underground pumped hydroelectric
energy storage method, and large-scale, utility-sized projects (1,000-3,000 MW) using
underground caverns have been evaluated in recent years.4 While none of these largescale
projects have been built, there are existing permits at the Federal Energy Regulatory
Commission for some of these projects.5 Using the aquifer, rather than an underground cavity,
2 Antelope Valley Water Storage (AVWS), 2016
3 (Allen, Doherty, & Kannberg, 1984; Blomquist C. , Frigo, Tam, & Clinch, 1979; Braat, van Lohuizen, & de Haan, 1985; Chang, Thompson, Allen, Ferreira, & Blomquist, 1980; Doherty, 1982; Farquhar, 1982; Frigo, Blomquist, & Degnan, 1979; Blomquist, Frigo, & Degnan, 1979; Frigo & Pistner, 1980; Ridgway, Dooley, & Hammond, 1979) (Rogers & Larson, 1974) (Rogers F. C., 1975) (Scott, 2007) (Willett & Warnock, 1983)
4 Fairley, 2015; Madlener, 2013; Uddin & Asce, 2003; Tam, Blomquist, & Kartsounes, 2007; Pickard, 2012.
5 For example, FERC Project No. 14612-000, New Summit Hydro LLC, is for 1,500 MW pumped hydro storage project in Ohio using an abandoned underground limestone mine as the lower reservoir.

9
as the lower reservoir has been explored by very few studies 6and these evaluations have been
preliminary.
This study uses data from an operating groundwater bank to study the APH in-depth and
provides valuable information about the efficiency, costs and value estimates for the APH form
of pumped storage. The study also assesses potential use of recycled water for APH to
eliminate half of the round trip and improve the overall efficiency of peak-hour power
generation.
1.3.1 Willow Springs Water Bank
The Willow Springs Water Bank (WSWB) is a groundwater banking project located in Antelope
Valley (northern Los Angeles County) on approximately 1,838 acres of agricultural land. The
bank has 500,000 acre-feet (AF) of approved storage capacity. Recent groundwater modeling
results indicate that the capacity of the bank can be increased to 1 million AF. Additional
details about WSWB are provided in the WSWB Fact Sheet (Appendix I -Attachment I).
At WSWB, the pumping lifts are 350’ to 450’ for the PHPS and APH energy storage systems. The
build out plan for the bank also includes a big pipe, a pump station-turbine, and potential sites
for large upstream and downstream reservoirs. Therefore, WSWB provides a good opportunity
for preliminary assessment of pumped storage potential at groundwater banks.
The study uses design information for the bank’s facilities, water quality and aquifer data, and
well drawdown results to provide conclusions about the economic and technical feasibility of
the two pumped storage technologies at WSWB. The optimized facility layout for PHPS
technology was developed as part of the study. This layout balances various parameters such as
size of the generating equipment, discharge duration and reservoir capacity to achieve a PHPS
configuration that integrates well with the WSWB operations and maximizes the benefits to the
grid cost-effectively. Existing wells at WSWB were used for field evaluation of the startup and
shutdown times.
The findings from the WSWB site-specific analysis were used to develop criteria to evaluate
pumped storage potential at other groundwater banks. Figure 2 shows the general conceptual
facility layout for implementing PHPS and APH systems at a groundwater bank.
6 (Martin, 2007; S.Y. & I.E., 2017; Budris, 2014)
10
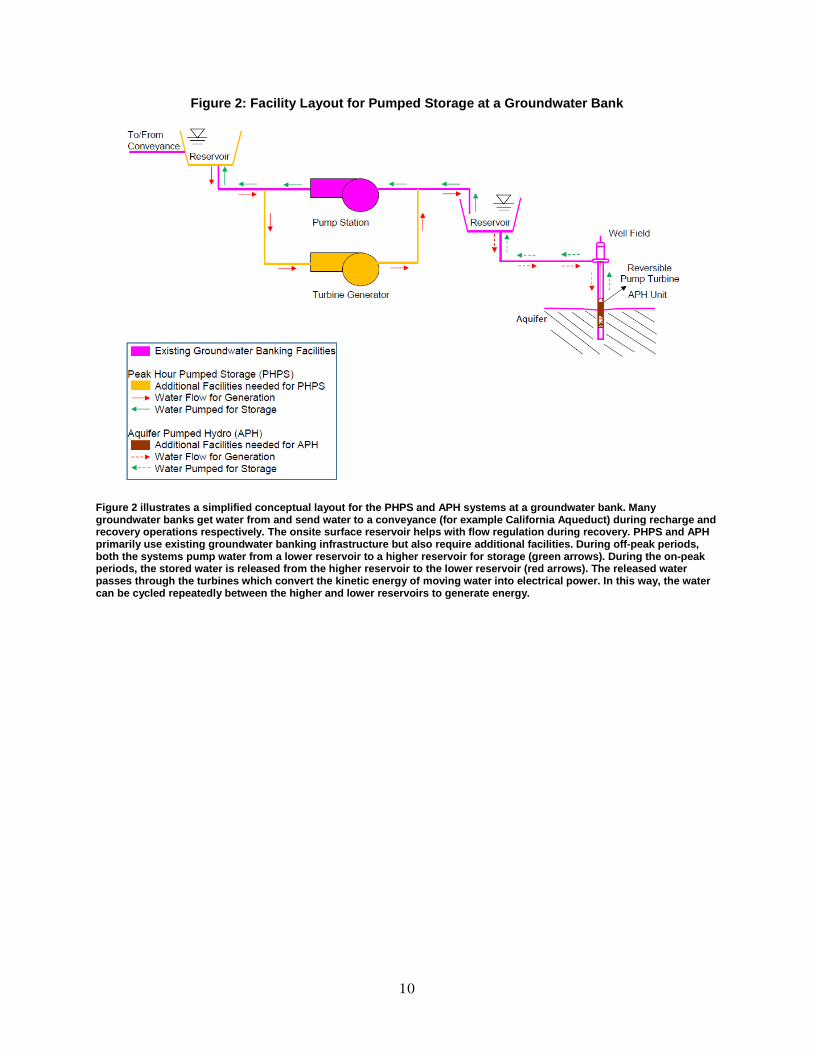
Figure 2: Facility Layout for Pumped Storage at a Groundwater Bank
Figure 2 illustrates a simplified conceptual layout for the PHPS and APH systems at a groundwater bank. Many groundwater banks get water from and send water to a conveyance (for example California Aqueduct) during recharge and recovery operations respectively. The onsite surface reservoir helps with flow regulation during recovery. PHPS and APH primarily use existing groundwater banking infrastructure but also require additional facilities. During off-peak periods, both the systems pump water from a lower reservoir to a higher reservoir for storage (green arrows). During the on-peak periods, the stored water is released from the higher reservoir to the lower reservoir (red arrows). The released water passes through the turbines which convert the kinetic energy of moving water into electrical power. In this way, the water can be cycled repeatedly between the higher and lower reservoirs to generate energy.

11
CHAPTER 2: Aquifer Pumped Hydro at Willow Springs Water Bank
This chapter describes the technical feasibility of aquifer pumped hydro (APH) at Willow
Springs Water Bank (WSWB). APH uses the existing groundwater aquifer as a lower reservoir and
a surface reservoir as the upper reservoir. The existing electric grid provides the energy source
and sink. The system operates on a cycle that has two stages – storage and generation. During
the storage stage water is pumped out of the groundwater aquifer into the upper reservoir, and
during the generation stage, water is injected back into the groundwater aquifer via the pump-
turbine generator and well shaft piping. APH must be installed so as not to interfere with the
primary operations of a groundwater bank and uses wells that are part of the groundwater
bank.
The study examined the potential of APH to produce hydropower during the five peak hours of
the day. An APH unit consists of an existing WSWB well, piping, and reservoir facilities. A
typical well at WSWB includes a 300 horsepower (HP) 480 Vac (Volts, alternating current) three-
wire electric pump motor, standard centrifugal vertical-turbine pump, motor control panels,
electrical panels, circuit breakers and transformer unit. The vertical-turbine pump is operated
in the forward direction using electric power to pump water and would be operated in the
reverse direction, “pump as turbine” to generate electric power.
Allowing the pump to operate in the reverse direction to generate electric power, requires
modifications to the system and may include:
1. Pump shaft modification to enable the shaft to turn in the reverse direction.
2. Addition of pressure control valve on pump shaft and electronic valve control unit.
3. Addition of a power electronics controller to excite the motor-generator and rectify the
output to enable motor to operate efficiently as a generator.
4. Addition of a grid-tie inverter/rectifier.
5. Addition of system control and monitoring for overall control and protection of all the
elements of the electrical system, with primary job to route power to and from the energy
storage system, local power sources and the loads.
6. Modification of electric system to interface with energy sources, user loads, and utility grid.
Providing detailed designs of these modifications is not part of this study and should be part of
a next-step pilot-program to confirm the appropriate component size/capacity and
effectiveness of the system.
Figures 3 through 6 depict the conceptual components of the APH system. A large array of
standardized modules enables precise ramp up and ramp down capability. For example, an

12
array of 100 equally sized modules can quickly go from 1% to 100% capacity by activating from
one module to 100 modules in the power generation mode based on the demands of the grid.
Similarly, 100 modules in the power storage mode can decrease demand rapidly and/or
incrementally from 1% to 100% within seconds by shutting off 1 module to 100 modules. The
modular pumped hydroelectric system can therefore provide both power generation and
demand response rapidly7 and in any increment desired and is more flexible than a
conventional large pumped hydroelectric project.
Figure 3: A Unit of the APH Pumped Hydroelectric System
Figure 3 shows an individual unit of the APH modular pumped hydroelectric system. It consists of a reversible pump/turbine unit at the bottom of a well shaft with a control valve 1, the well itself 2, the natural water table of the aquifer which serves as the lower reservoir 3, the electric variable frequency motor/generator for the module 4, the remote control and command of the valves and motor/generator of the module 5, the surface reservoir, combined inlet/outlet pipe and flow control valve which constitutes the upper reservoir 6, and the alternating current transformers that connect the module to the electric grid 7.
7 The term, “demand response” used in the context of APH is different from the demand response potential realized by shifting the groundwater recovery operations out of peak summer hours discussed elsewhere in this report. While APH pumped storage and associated demand response capability of a multimodular APH array can potentially occur in all hydrological year types, the latter is limited largely to dry years which is typically when groundwater is extracted for deliveries.
13
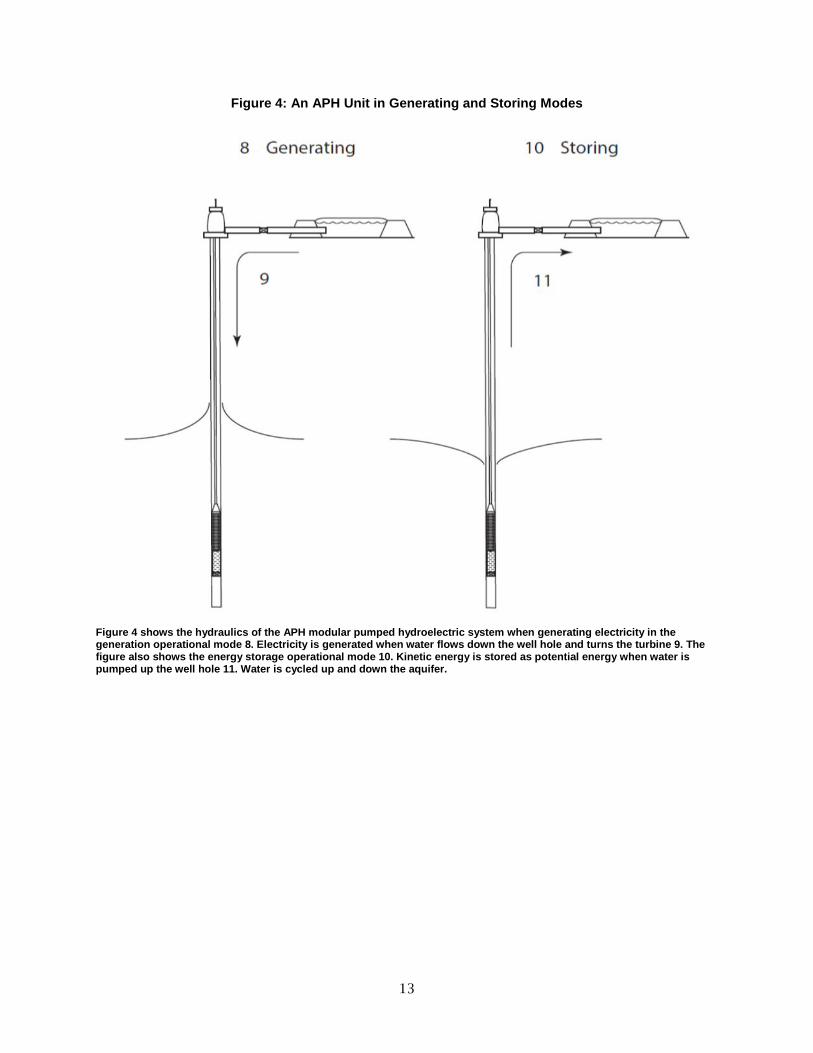
Figure 4: An APH Unit in Generating and Storing Modes
Figure 4 shows the hydraulics of the APH modular pumped hydroelectric system when generating electricity in the generation operational mode 8. Electricity is generated when water flows down the well hole and turns the turbine 9. The figure also shows the energy storage operational mode 10. Kinetic energy is stored as potential energy when water is pumped up the well hole 11. Water is cycled up and down the aquifer.

14
Figure 5: Interaction of APH Unit With the Electrical Grid
Figure 5 shows interaction of one module of the pumped hydroelectric system with the electric grid when the unit is generating electricity 12 and how electricity flows to the grid when it needs additional power 13. It also shows the unit shut off and on standby 14 when the grid is stable 15. Furthermore, it shows the module storing energy 16 when the grid has an oversupply of power 17. The three operational modes of the modular pumped hydroelectric system enable generation, standby, and storing of energy providing the flexibility needed to track the demand curve of the grid precisely and rapidly. The switch from generating electricity to storing energy nearly doubles the impact of each unit on the demand curve of the grid. For example, a 150 kW pump/turbine has a swing of about 300 kW when it is initially pumping water with a 150 kW motor, is turned off, and then restarts as a 150 kW generator.

15
Figure 6: APH Modules Within the Well Array
Figure 6 illustrates how all the modules within the well array will be coordinated and controlled remotely to optimize benefits to the grid. The array of wells (18) will cover a wide area of the grid’s distribution system. Individual modules 19 will be controlled by a remote signal (20) that could come from a radio/microwave transmitter, the Internet, or through a hard connection. The array of wells may be located in the electric distribution system of the grid or adjacent to major electric transmission lines. Command and control can be initiated locally or by an independent system operator (an entity that manages the electricity flow and operates the electric grid to maximize the benefits to the grid).
2.1 Key Parameters for Power Generation The physical parameters that affect the power generation are “pump-as-turbine” (generation)
efficiency, head-on turbine generator, pump flow rate, groundwater aquifer transmissivity, and
adequate land for a surface reservoir. For WSWB site, the values of these parameters are:
1. Depth to groundwater – The WSWB has a 350 ft. average depth to groundwater level which
provides the head available to drive the generation mode.
2. Pumping capacity – The pumping capacity or discharge rate of a groundwater well is
typically measured in Gallons Per Minute (GPM) or cubic feet per second (cfs). The pumping
capabilities of the WSWB wells are in the range of 1500 GPM to 2000 GPM, which are typical for
agricultural and municipal water supply programs.

16
3. Transmissivity – The transmissivity at the site ranges from 2,900 to 3,500 square feet per
day (sq. ft/day) which is considered low to medium rate of water flow through the soil matrix.
Transmissivity values in the range of 5,000 to 10,000 square feet per day allow water to move
faster which correlates to lesser drawdown and mounding head losses and higher generation
output. Most groundwater banking or Aquifer Recharge and Extraction (AR&E) projects in the
Western United States have transmissivity values of 5,000 to 10,000 sq. ft/day or greater.8
4. Surface reservoir – The facilities master plan for WSWB includes a reservoir that would be
used to regulate flows from the groundwater extraction well field to a high-lift pump station
used for pumping water back to the California Aqueduct. For APH analysis, it is assumed that
the well spacing will allow all wells to be served by this common reservoir. Therefore, the costs
for a surface reservoir and associated land costs have not been included in the total capital cost
of an APH unit at WSWB (Table 8).
Appendix A describes a sensitivity analysis that compares the effects of various input
parameters on the mounding head loss and power generation equations. The results show that
flow rate, transmissivity and well radius have the greatest effect on mounding losses.
2.2 Round Trip-Efficiency and Head Loss Effects The capability to generate electric power is greatly affected by the component and cumulative
efficiencies of the system. The “round-trip-efficiency” refers to the efficiency of the complete
operating cycle from storage (pumping) through generation (injection). As indicated in the
project proposal, the primary downside of APH is the low round-trip efficiency of around 40%-
45%. Therefore, a round-trip efficiency much lower than 40% will render an APH project non-
viable (Antelope Valley Water Storage (AVWS), 2015).
The head loss component significantly affects the round-trip efficiency. Head loss comes from
the energy necessary to pull water out of the aquifer and to push the water into the aquifer.
These losses are a cone of depression (drawdown) due to pumping and a mound that is created
when water is injected into the aquifer, and are determined by site-specific parameters that can
be used to assess system efficiency. Drawdown and mounding head loss can be measured from
ground water levels during a well pumping and injection testing program.
2.2.1 WSWB Site - Aquifer Pumped Hydro Round-Trip Efficiency
Actual well drawdown data obtained during well development was used to calculate head loss
due to drawdown. A theoretical equation was used to calculate the potential mounding.
Separate drawdown and mounding efficiencies were calculated and used to calculate the overall
round-trip efficiency of APH at the WSWB site.
8 Although the typical transmissivity values for aquifer recharge and extraction (AR&E) projects in the Western United States are in the range of 5,000 to 10,000 sq. ft./day or greater, they can vary widely depending on the saturated aquifer thickness, the concentration of wells and the layout of the project. If there is a lot of area to put wells and percolate water, it is possible to have lower transmissivity values and still have a viable project (Email communication with John Koreny, HDR Engineering, Inc. [HDR], October 3, 2016).

17
Table 1 provides well drawdown levels for three wells - AV-2, AV-3 and AV-5 - at the WSWB site.
The average of the well drawdown for the three wells after four hours of pumping was used to
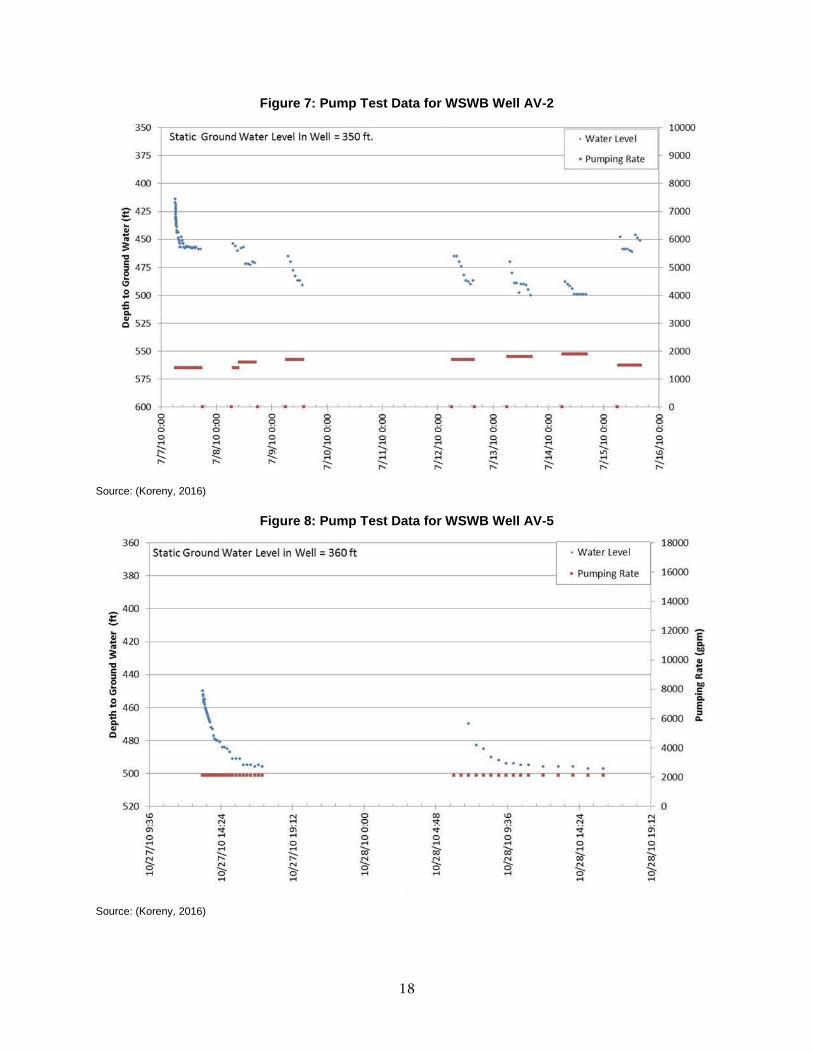
determine head loss due to drawdown. Figures 7- 9 indicate the relationship between pumping
time, flow rate, and drawdown.
Table 1: Summary of Pump Test Data for WSWB Wells AV-2, AV-3 and AV-5
Source: (Koreny, 2016)
Well ID, Pumping Rate During Aquifer Test
Ground Water Level Decrease During Pumping Test
Well Drawdown (ft.) After 1 Hour
of Pumping
Well Drawdown (ft.) After 2 Hours of Pumping
Well Drawdown (ft.) After 3 Hours of Pumping
Well Drawdown (ft.) After 4 Hours of Pumping
AV-2, 1400 gpm
115 120 125 133
AV-5, 2100 gpm
120 131 135 136
AV-3, 1300 gpm
101 124 140 158
18
Figure 7: Pump Test Data for WSWB Well AV-2
Source: (Koreny, 2016)
Figure 8: Pump Test Data for WSWB Well AV-5
Source: (Koreny, 2016)

19
Figure 9: Pump Test Data for WSWB Well AV-3
Source: (HDR Engineering, Inc., 2016)
As shown in Figure 9, the static water level (level of water in a well when it is not being pumped) corresponds to a relatively low depth to groundwater (higher water table). When the water is pumped, the water level in the well drops (well drawdown) and the water table in the vicinity of the well is lowered. This is manifested in the increased depth to groundwater. As pumping continues, the drawdown reaches a steady state as the pumped water is replaced by the groundwater flow from the surrounding area. The rate of drawdown (and consequently, the water level in the well and depth to groundwater) therefore eventually stabilizes.

20
2.2.2 Head Loss Due to Drawdown and Mounding
HDR Engineering evaluated the drawdown and approximate increase in groundwater levels
(mounding) that will occur if the WSWB extraction (or production) wells were operated as
injection wells. 9 According to this evaluation, “The groundwater level increase in the
production wells will be approximately the inverse of the ground water level decrease during
pumping. For example, if the groundwater level in the well decreases by 100 feet after pumping
at 1,000 GPM, the groundwater level in the well will rise by approximately 100 feet during
injection at 1,000 GPM. This is only a rough approximation and the initial increase in
groundwater level mounding may vary depending on well screen intervals, aquifer lithology in
the vadose zone and other factors.” Instead of assuming the mounding effects are the inverse
of drawdown effects this study uses the Cooper-Jacob approximation to the Theis equation to
calculate the head loss due to mounding (Table 2).
2.2.2.1 Drawdown Efficiency
Actual well development data are used to determine drawdown effects. The potential head loss
due to drawdown can then be calculated as an efficiency component as:
Assumptions:
Average depth to water level: 350 ft.
Reservoir Water Level: 5 ft.
Total System Static Head: 355 ft.
Drawdown (Average): 142 ft.
Total Pumping Head Required: 497 ft. (For pumping, excludes pipe friction losses)
Efficiency Calculation:
The pump will be required to lift the water an added 142 ft.; in other words, 40% (142/355)
more pump head in addition to the system static head of 355 ft. is required to lift water into
the reservoir for a total of 497 ft. of pumping head. Therefore, the pumping stage efficiency is
less than 100% and can be calculated as:
Efficiency during pumping stage:
System static head = 355 ft. equates to 100% efficiency
Pumping stage efficiency = (355 ft. – 142 ft. = 213 ft.) / 355 ft. = 0.60 = 60% (average)
The following table summarizes the average efficiency for the three wells and supports the
average calculation of 60%.
9 Koreny, 2016
21
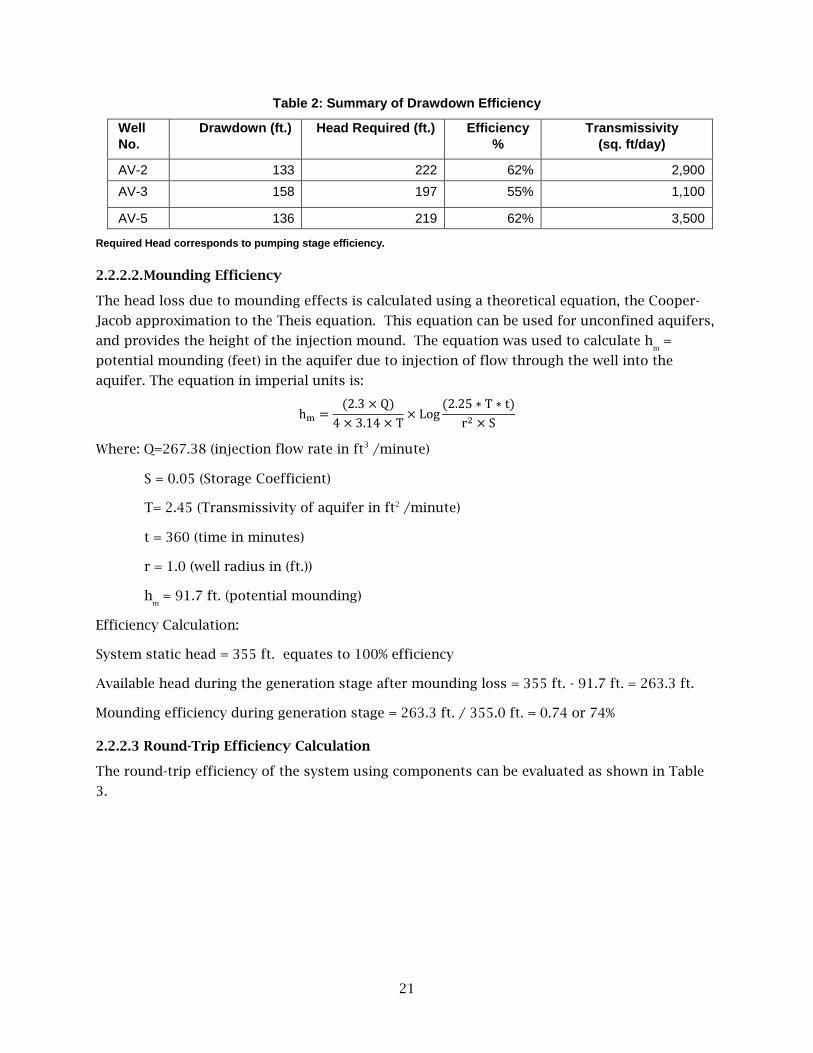
Table 2: Summary of Drawdown Efficiency
Well No.
Drawdown (ft.) Head Required (ft.) Efficiency%
Transmissivity (sq. ft/day)
AV-2 133 222 62% 2,900 AV-3 158 197 55% 1,100
AV-5 136 219 62% 3,500
Required Head corresponds to pumping stage efficiency.
2.2.2.2. Mounding Efficiency
The head loss due to mounding effects is calculated using a theoretical equation, the Cooper-
Jacob approximation to the Theis equation. This equation can be used for unconfined aquifers,
and provides the height of the injection mound. The equation was used to calculate hm =
potential mounding (feet) in the aquifer due to injection of flow through the well into the
aquifer. The equation in imperial units is:
hm =(2.3 × Q)
4 × 3.14 × T× Log
(2.25 ∗ T ∗ t)r2 × S
Where: Q=267.38 (injection flow rate in ft3 /minute)
S = 0.05 (Storage Coefficient)
T= 2.45 (Transmissivity of aquifer in ft2 /minute)
t = 360 (time in minutes)
r = 1.0 (well radius in (ft.))
hm = 91.7 ft. (potential mounding)
Efficiency Calculation:
System static head = 355 ft. equates to 100% efficiency
Available head during the generation stage after mounding loss = 355 ft. - 91.7 ft. = 263.3 ft.
Mounding efficiency during generation stage = 263.3 ft. / 355.0 ft. = 0.74 or 74%
2.2.2.3 Round-Trip Efficiency Calculation
The round-trip efficiency of the system using components can be evaluated as shown in Table
3.
22
Table 3: Target Average Efficiency of Aquifer Pumped Hydro Energy Storage
Component Pump/Motor System, %
Turbine/Generator System, %
1. Variable frequency pump drive* 95 - 2. Power wires* 98 - 3. Motor/generator* 96 96 4. Pump/turbine** 80 80 5. Pipe friction* 98 98 6. Rectifier/inverter* - 93 7. Drawdown (213 ft. required head/ 355 ft. total head) *** 60
8. Mounding (263.3 ft. available head/ 355 ft. total head)***
74
TOTAL 42.0% 51.8% ROUND-TRIP (21.8% makes APH infeasible) 21.8% < 42%
* Target efficiencies
Sources:
**From calculations by Hydro resources (Hydro resources, 2013)
***Calculated above
2.2.3 Key Finding
The evaluation in Table 3 indicates that the round-trip average system efficiency for the site is
21.8%. This is less than the 42% estimated in the initial proposal10 and is too low to be practical
as described in the economics analysis in Section 5.3.3. This low round-trip efficiency for APH
is much lower than efficiency for alternative energy storage technology (% Efficiency column,
Table 4).
Table 4: Energy Storage Efficiency and Costs
Technology Option Maturity Capacity Power Duration
% Efficiency
Total Cost Cost
(MWh) (MW) (hours)
(total cycles) ($/kW) ($/kW-h)
Bulk Energy Storage to Support System and Renewables Integration
Pumped Hydro Mature
1680-5300
280-530 6-10 80-82
2500-4300 420-430
5400-14,000
900-1400 6-10 (>13,000)
1500-2700 20-270
Conventional Turbine-CAES (underground) Demo
1440-3600 180 8
(>13,000)
960 120
20 1150 60
Compressed Air Energy Storage Commercial
1080 135 8
(>13,000)
1000 125
2700
20 1250 60 10 Antelope Valley Water Storage (AVWS), 2015

23
Technology Option Maturity Capacity Power Duration
% Efficiency
Total Cost Cost
(MWh) (MW) (hours)
(total cycles) ($/kW) ($/kW-h)
(CAES):underground Sodium-Sulfur Commercial 300 50 6 75 (4500)
3100-3300 520-550
Advanced Lead-Acid
Commercial 200 50 4 85-90
(2200) 1700-1900 425-475
Commercial 250 20-50 5 85-90
(4500) 4600-4900 920-980
Demo 400 100 4 85-90
(4500) 2700 675 Vanadium Redox Demo 250 50 5
65-75 (>10,000)
3100-3700 620-740
Zn/Br Redox Demo 250 50 5 60
(>10,000) 1450-1750 290-350
Fe/Cr Redox R&D 250 50 5 75
(>10,000) 1800-1900 360-380
Zn/air Redox R&D 250 50 5 75
(>10,000) 1440-1700 290-340
Energy Storage for ISO Fast Frequency Regulation and Renewables Integration
Flywheel Demo 5 20 0.25 85-87
(>100,000) 1950-2200
7800-8800
Li-ion Demo 0.25-25 1-100 0.25-1 87-92
(>100,000) 1085-1550
4340-6200
Advanced Lead-Acid Demo 0.25-50 1-100 0.25-1
75-90 (>100,000) 950-1590
2770-3800
Energy Storage for Utility T&D Grid Support Applications CAES (aboveground) Demo 250 50 5 (>10,000)
1850-2150 390-430
Advanced Lead-Acid Demo 3.2-48 1-12 3.2-4
75-90 (4500)
2000-4600
625-1150
Sodium-Sulfur Commercial 7.2 1 7.2 75 (4500)
3200-4000 445-555
Zn/Br Flow Demo 5-50 1-10 5 60-65
(>10,000) 1670-2015
340-1350
Vanadium Redox Demo 4-40 1-10 4
65-70 (>10,000)
3000-3310 750-830
Fe/Cr Flow R&D 4 1 4 75
(>10,000) 1200-1600 300-400
Zn/air R&D 5.4 1 5.4 75 (4500) 1750-1900 325-350
Li-ion Demo 4-24 1-10 2-4 90-94
(4500) 1800-4100
900-1700
Source: (Electric Power Research Institute (EPRI) and Energy and Environmental Economics, Inc. , 2010)
This finding is further demonstrated in Table 5, which determines the power required for
pumping versus the power generation potential for one “pump as turbine” setup at WSWB. A
single setup will require 278 kW to pump groundwater into the surface reservoir and will have
a power generation potential of 62 kW. Therefore, system efficiency is 22% as predicated in

24
Table 3. Even if on-peak electric rates for generation are 4.5 times the off-peak rates for
pumping, APH will not pay for itself. Given the low average system efficiency of 22% APH is not
economically feasible for the WSWB site.
Table 5: Power Calculation for One “Pump As Turbine” Setup at WSWB
Pumping Mode
Generating Mode
Components Pump/Motor System, %
Turbine/Generator System,
% 1. Variable Frequency Pump Drive* 95 - 2. Power wires* 98 - 3. Motor/generator* 96 96 4. Pump/turbine** 80 80 5. Pipe friction (calculated and shown below) 6. Rectifier/inverter* - 93 Well Data: well diameter = 2.0 ft. Flow Rate: Q= 2,000 GPM = 4.45 ft3/sec;
Power Requirement: Reservoir water elevation above ground surface (ft.) 5.0 5.0 Depth to groundwater from surface (ft.) 350.0 350.0 Gross Head (ft.) 355.0 355.0 Pipe Friction loss (ft.) 33.2 33.2 Drawdown due to pumping (ft.) (field test)
142.0 -
Head loss due to mounding (ft.) (calculated) - 91.7
Net Head (ft.) 530.2 230.2 Power required for Pump Mode (kW) 278 Power potential for Generation Mode (kW) 62
* Target efficiencies
Source:
**From calculations by Hydro resources (Hydro resources, 2013)
The study scope included execution of field testing at WSWB to assess the aquifer response to a
full cycle of well pumping and well injection. Because of the low round-trip efficiency discussed
above, the project team concluded that conducting this test at the WSWB will be premature and
the test should be postponed to a future pilot-study to determine commercial viability of the
APH technology. To that end, this section focuses on providing supporting documentation for
development of a template11 to evaluate APH potential at other groundwater banks including at
existing Aquifer Storage and Recovery (ASR) and recycled water projects and to identify
potential pilot sites for APH. ASR projects and recycled water projects that inject water into the
groundwater aquifer can use the injection process to generate peak hydropower without
pumping groundwater to a surface reservoir first. For these projects the energy cost for the
11 Template tool has been described in Section 4.6

25
injection cycle (or the generation stage of APH) is a part of existing operational costs. Also,
these projects already have most of the capital infrastructure needed to generate hydropower
using injection wells with the exception of the electrical/mechanical package needed to
generate power and integrate the system with the electric grid.
2.3 Power Generation for a Single APH Turbine Setup Power generation for an APH unit consists of one “pump as turbine” well setup, one reservoir
and connection piping.
The AV-5 groundwater well at WSWB was selected for this evaluation and the potential power
generation was calculated based on the input parameters given in Table 6.
Table 6: Potential Power Generation for Well AV-5 at WSWB
Well Data: Well Diameter (ft.) 2.0 Injection Flow (cfs) 4.45 Pump as Turbine Efficiency
0.80
Generator Efficiency 0.96 Rectifier/inverter Efficiency
0.93
Water Density (lb./ft.3) 62.35 Power Calculations:
Transmissivity (ft.2/day) 3,526.0 5,000.0 10,000.0 Gross Head (ft.) 355.0 355.0 355.0 Pipe Friction loss (ft.) 33.2 33.2 33.2 Mounding Head Loss (ft.) 91.7 70.2 37.3 Net Head (ft.) 230.2 251.7 284.6 Power Generation (kW) 62.0 67.0 76.0
The transmissivity at the AV-5 well site is 3,500 sq. ft/day. Based on a net head of 230.2 ft.
available to generate power, the power potential is 62.0 kW or 0.06 MW. In comparison, for
transmissivity values of 5,000 sq. ft/day and 10,000 sq. ft/day the power generation potential is
67.0 kW (or .07 MW), and 76.0 kW (or 0.08 MW) respectively. A 42 % increase in transmissivity
results in a power potential increase of 8%; and a 184% increase in transmissivity results in a 23
% increase in power generation potential.
To achieve 5 MW of power generation at the WSWB site 84 wells would be required (5.0 MW/
0.06 MW per well = 84 wells). The planned 62 wells at WSWB would have potential to produce
on the order of 3.7 MW. WSWB recharges water via spreading grounds instead of injection wells
so to implement APH, the water needs to be first pumped to a surface reservoir. However, even
if APH is used as an energy generation system (water does not need to be first pumped to a
surface reservoir) rather than as a storage system at the WSWB site, this level of power
generation would not justify the added capital expense required to deliver power to the SCE

26
grid. See Section 4.3.1 for description of project sites where power generation using wells can
be economically viable and offset operating costs.
2.4 Cost Estimates The incremental cost of installing one APH storage unit includes these items:
• Cost of two AF upper reservoir, including 0.5 acres of land
• One 300 HP, 480 Vac (Volts, alternating current), 2000 GPM well
• Electrical package to generate power with the well motor, and system controller and
electrical equipment to connect the generator to the SCE grid.
Table 7 summarizes the additional capital cost of $1.6 M needed to install one APH unit at a
groundwater bank. All other capital costs such as for pipelines are assumed to be part of the
original water bank or ASR project.
At WSWB, the additional capital cost necessary to install one APH unit is $0.30 M due to the
cost for the addition of the electrical and mechanical package as indicated in Table 8. Only the
electrical/mechanical package cost is included because the other components are assumed to
be part of the WSWB project. Assuming WSWB may be operated as an ASR project for
generating peak hydropower, the energy costs associated with pumping groundwater for
storage can be eliminated. Since any other annual operational and maintenance costs are
covered by the WSWB operating budget, no additional operating costs are included. For 62
wells, the incremental cost would be $18.6M to implement 3.7 MW of peak hour hydropower
generation or $5,100/kW.

27
Table 7: Capital Cost of Facilities for One Aquifer Pumped Hydro Unit
Aquifer Pumped Hydro
Component
Calculation Cost,
$ M*
1. Surface reservoir @ 2.0 AF storage & 0.5 acres of land for 5- peak hour generation period
The 2016 master plan for WSWB facilities (GEI Consultants, Inc., 2016) includes a cost estimate of $1.32 M for a 48 AF lined reservoir, excluding engineering and contingency. For a 2 AF reservoir the cost will be = (2/48) ($1.32 M) (1.24 for engineering & contingency.) = $0.07 M. Land cost for 0.5 acres is about $0.002 M @ $3,000/acre in Kern County.
$0.072 M
2. One 300 HP well with Variable Frequency Drive (VFD)
($860,000 per well+ $130,000 per VFD) (1.24) = $1.23 M $1.23 M
3. Electrical / Mechanical Package
Motor Generator Power Electronic Controller ----------------------- $ 6,000
Grid tie inverter/rectifier--------------------------------------------------- $92,000
System Controller ------------------------------------------------------------$80,000
Electric system modifications ---------------------------------------------$20,000
Well shaft modification and pressure control equipment --------- $40,000
Electric/Mechanical Package Total $238,000 = $0.24M x 1.24 = $0.30 M
$0.30 M**
4. Total Total additional cost due to one “Pump As Turbine” Aquifer Pumped Hydro storage unit
$1.6 M
Sources:
* Unit cost estimates based on 2016 GEI master plan update for WSWB (GEI Consultants, Inc., 2016) and adjusted to include 24% more for contingencies, design, and construction management.
** Item costs estimated by author(s) based on industry research.

28
Table 8: Costs to generate hydropower using existing wells at WSWB
Item Assumptions Comments
1. Well capacity 4.5 cfs each (8.9 AF/day, 2.9 mgd or 2000 gpm)
Existing irrigation wells
2. Well motor size
300 horsepower (hp) (225 kW) Typical municipal motor size
3. Depth to water Up to 350’ (depth to water)
4. Surface storage
Storage Vol. = (GPM x 5 hr. x 60 min. per hr. x 0.13368) = Storage Vol. (ft.3)
(Storage Vol. x 1.20) = Acres Required
(5 ft. x 43,560 ft.2)
For 2000 GPM, storage vol. = 80,208 ft.3 = 1.8 acre-ft. (use 2 acre-ft.)
Acres required = 0.44 acres (use 0.5 acres)
Lined, covered reservoir
5. Capital Cost to add one Aquifer Pumped Hydro Unit
From Table 6 = $0.30 M Electrical package
6. APH Capacity 0.06 MW/well x 62 wells = 3.7 MW
7. Capital cost ($0.30 M/well)(62) = $18.6 M
8. Unit capital cost
$18.6M/3.7 MW = $5,100/kW
9. Annual O&M Zero cost assumed operating cost is covered by water bank or ASR operations.
10. Total Cost (Capital and O&M)
$18.6 M /3.7 MW = $5,100/kW
These costs are feasibility study level. More precise cost estimates should be developed as part
of a next step pilot program.
29
2.5 State Water Resources Control Board (SWRCB) Regulations This study also looked at the field testing requirements for the APH technology. This
information guided the development of criteria for evaluating the potential of APH technology
at other groundwater banks in California.
All short term field testing and long term projects must comply with SWRCB and applicable
United States Environmental Protection Agency (U.S. EPA) requirements. Short term field testing
projects are for the purpose of conducting a pilot test of the technology for a specific site
where water is withdrawn from a groundwater producing well and retained at the surface for a
short period before being injected back into the groundwater aquifer. Long term projects
refer to projects that have been shown to have economic benefit and the project owner seeks to
install a permanent project.
The project team consulted Regional Water Quality Control Board (RWQCB) staff to determine
the potential regulatory requirements for both short term and long term projects.
2.5.1 Short Term Pilot Test
The regulatory requirements for short term pilot testing of APH technology are:
• RWQCB permit will be required for 1 to 2-day pumping into a lined pond and 18-20 hours
discharge back into a well.
• The permitting process will include formal consultation with RWQCB and submittal of a
formal permit application along with technical report and project documents.
• It is expected that no treatment will be required if it can be shown that water quality will
not be affected during period of discharge.
• For source groundwater that includes constituents such as Hexavalent Chromium (Cr(VI)) or
other constituents that may affect groundwater quality and may be an issue, RWQCB
will require time for additional review before determining how to proceed.
• CEQA categorical exemption may be required.
2.5.2 Long Term Projects
The regulatory requirements for long term pilot testing of APH technology are:
• RWQCB permit is required and the permitting process is anticipated to be more extensive
than the one described above for a pilot test.
• Covered ponds are required due to algae growth, solids and bacteria issues.
• Open ponds are allowed if water is treated (undergoes filtration and disinfection) before
injection (treatment requirements may vary on a case by case basis).
• Monitoring wells are required for groundwater monitoring program to track impacts.
• Appropriate CEQA documents would be required in all cases.

30
Compliance with these preliminary regulatory requirements will require additional time and
funding and should be considered in planning feasibility studies for APH12 projects.
2.6 Demand Response Potential of the Well Field WSWB has planned 62 production wells; each expected to have a 300 horsepower (0.225 MW)
motor. As previously determined Sections 2.2 and 2.3, using the WSWB 62 planned extraction
wells in an energy generation or pumped storage system to generate peak electric power is
impractical. However, the 62 wells represent a combined demand reduction potential of 14 MW.
If used in a demand response program the wells could potentially reduce the power demand on
the electric grid by 14 MW. This demand response potential is significant and can be realized by
shutting down the well pumps for five hours a day during weekdays in the summer months13.
This would result in a 4% reduction in groundwater pumping which can be made up with a
small number of additional wells. Sixty-two wells are required at buildout and two more wells are required to enable demand response (4% of 62 wells ≈ 2 wells) at a cost of $1.07 M/well
(Table 14). The surface reservoir (which is part of WSWB facilities master plan) will buffer any
impact on WSWB operations and will enable a constant flow to the WSWB pump station.
Operating the well field in a demand response program will require a specified response time
for wells to be turned-on and turned-off following an order from the California Independent
System Operator (California ISO) or an investor-owned electric utility operator. Therefore, a
field test was conducted to determine the startup and shutdown durations for manual
operation of the well field at the WSWBsite. Confirming the time required for each cycle will
support decision making on whether to implement an automated cloud-based supervisory
control and data acquisition system to monitor and control the well field equipment.
2.6.1 Automated Remote Control of the Well Field System
A key factor to implement demand response at WSWB is being able to shut off 62 wells and
turn them on again rapidly. The results of the field test provided on page 2 of Appendix B show
that the time required to start up each well and drive to the next well is on average 5.1 minutes;
or a total start-up period of 5.3 hours with one operator. The time required to shutdown each
well and drive to the next well is similarly on average five minutes; or a total shutdown period
of 5.2 hours with one operator. It would take more than five hours for one operator to start-up
or shutdown all 62 wells. This is not practical for operation of a large well field let alone for a
5-hour window for demand response.
Remote activation is necessary. The legacy systems in use to remotely monitor and control well
field equipment are referred to as supervisory control and data acquisition (SCADA) systems
and include a computer server and control center located at the agency’s operations
12 Aquifer Storage and Recovery (ASR) projects are regulated separately by the State Water Resources Control Board Water Quality Order 2012-0010 – General Water Discharge Requirements for Aquifer Storage & Recovery Projects that Inject Drinking Water into Groundwater.
13 For the duration of the on-peak period, assumption of 5 hours has been used. This is based on the recently released proposed on-peak periods for the IOUs including Southern California Edison (SCE). The new on-peak period for SCE is proposed to be 4 pm – 9 pm on summer weekdays (Association of California Water Agencies (ACWA), 2017).

31
headquarters. These systems collect data from the onsite well. The well is equipped with a
Program Logic Control data logger that sends data to the SCADA control center and the data is
stored in the control center server. With this type of system, the process of shutting down a
well is immediate and an entire well field can be programmed to start-up or shut-down on a
given schedule or at a moment’s notice.
A cloud-based Supervisory Control and Data Acquisition system such as the XiO cloud-based
Field Installed Well Control Unit replaces the typical Program Logic Control based data logger
and is widely used throughout the water supply industry to monitor and control wells. Using a
cloud-based SCADA system eliminates the need for an agency based computer server.
The Field Installed Unit sends all monitoring data by internet connection via an onsite modem
to the cloud. The cloud data is sent to a highly secure commercial data manager contracted
with XiO. Any authorized agency employee can access the cloud data and turn on and shut off
the well pumps from a desktop computer, laptop or smart phone. This eliminates the need and
cost for onsite server hardware and software, programming the program logic control to
communicate with the server, and costly employee training to operate the system.
The team obtained a budgetary quote from XiO to install one XiO Field Installed Well Control
Unit at a single well. The cost per well ranges from $7,700 for a controller without water level
sensor to $9,700 for a controller with water level sensor and $74 per month for cloud access
and internet access (Table 9).
Table 9: Cost to Install one XiO Field Installed Well Control Unit
Controller & Options without Sensor
Unit Price Monthly Fee
Field Control Unit without water level sensor
$4,600 $39/controller (cloud services)
System Pressure monitoring $700 n/a Remote VFD $545 n/a PtP- Link IP radio with Yagi Antenna $1,100 n/a Cloud-Link Cellular Modem Package $750 $35/modem (internet access) Totals $7,700 $74/month Controller & Options with Sensor Unit Price Monthly Fee
Field Control Unit with water level sensor
$6,642 $39/controller (cloud services)
System Pressure monitoring $700 n/a Remote VFD $545 n/a PtP- Link IP radio with Yagi Antenna $1,100 n/a Cloud-Link Cellular Modem Package $750 $35/modem (internet access) Totals $9,700 $74/month
Sources: (XiO, Inc., 2017)
The process of turning all 62 wells off and then on should be straightforward if the well field
design incorporates an automated remote on/off switch. All wells require a slow start capability
to comply with current Southern California Edison (SCE) requirements.

32

33
CHAPTER 3: Peak Hour Pumped Storage at Willow Springs Water Bank
Willow Springs Water Bank (WSWB) plans to use Peak Hour Pumped Storage (PHPS) to produce
hydropower during the peak hours of the day. PHPS will use pipe, pump, and reservoir facilities
that are part of the water bank. Dual use of these facilities for hydropower as well as water
storage reduces capital costs.
Power generation via PHPS can potentially occur independent of whether the water bank is
recharging, idle, or extracting water. It is expected that WSWB will recharge water during wet
years. Wet years occur about 1 in every three years (“wet” years as defined by California
Department of Water Resources (DWR) have occurred 32% of the time based on historical
record). Generating peak power every year is more valuable that generating it once every three
years. Water used to generate electricity will be replaced during the non-peak hours.
Key Assumptions for PHPS analysis are summarized:
• Evening Ramp Up – Electric peak hour rates will apply during summer weekdays from about
4:00 p.m. to 9:00 p.m. for SCE and SDG&E. This is the evening ramp up of demand when
solar arrays stop generating power but the evening demand is still high. While peak
rates for the future are not known, it can be assumed that they will be high enough to
discourage pumping during the evening ramp up (California Public Utilities Commission
(CPUC), 2015).
• Summer Peaks – Peak hour rates occur during the 3 summer months, 5 days a week, and for
only about 5 hours per day. This is 4% of the time. If additional power can be generated
during peak hours, a significant grid benefit can be realized. Similarly, pumping from
wells to the surface could be eliminated during peak hours as well to reduce peak
demand.
• WSWB Intermittent Recharge – WSWB will recharge water intermittently (about once every
three years on average). If hydropower generation is limited to only the recharge years, a
significant opportunity is lost.
• WSWB Buildout – WSWB will be built out in phases. The first phase has a recharge capacity
of 385 cubic feet per second (cfs) and an extraction capacity of 140 cfs. The second
phase has a recharge capacity of 385 cfs and an extraction capacity of 310 cfs.
• Flow to and from California Aqueduct – Prior studies for WSWB assumed that water flow
from or to the California Aqueduct could vary during a 24-hour day. Since DWR will not
allow daily flow changes into the California Aqueduct, an upper reservoir is needed to
enable shutdown of booster pumping during the five peak summer hours.

34
3.1 Operating Scenarios Pumped storage implementation must not interfere with normal operations of the water bank.
Consequently, three operating scenarios were assessed for PHPS analysis: a recharge (wet) year,
a neutral or idle year, and an extraction (dry) year.14 These scenarios are shown graphically in
Figure 10 and described in the following text.
Figure 10: WSWB Hydropower Generation Operations
14 Based on Sacramento River data since 1906, California Department of Water Resources (DWR) classifies a water year (Oct 1 – Sep 30) as a wet year, an above normal year, a below normal year, a dry year or a critical year (DWR, 2017). In this report, “wet” indicates a wet year as defined by DWR, “neutral” is used for above normal and below normal year types, and “dry” represents the DWR defined dry and critical hydrologic year types.
35
• Recharge Year (wet): A recharge year involves up to 385 cubic feet per second (cfs) of
recharge. It will occur during wet or normal year conditions. That enables a total
recharge of 280,000 acre-feet per year. 250 cfs will be used to generate electricity 24
hours a day and 135 cfs will bypass the turbine. The estimated occurrence rate is one
year in three based on historical record (32%).
• Idle Year: An idle year does not have any predetermined recharge or extraction activity. 250
cfs of water will be used to generate electricity for the five hours daily from the upper
reservoir. The water will be replaced over the other 19 hours. It will be pumped at a flow
rate of 66 cfs to minimize pipe friction losses. 103 acre-feet of storage volume is needed
to provide five hours of power generation. The estimated occurrence rate is one year in
three based on the historical record (33%).
• Extraction Year (dry): Extractions of water from the water bank will occur in a dry year. 250
cfs will be pumped back to the California Aqueduct and 60 cfs will be delivered to the
Antelope Valley-East Kern Water Agency potable system for exchange or to the
Aqueduct. The total extraction requirement is 310 cfs. During the peak hours, electricity
will be generated by sending 250 cfs from the upper reservoir down to the generator.
103 acre-feet of storage volume is needed to provide five hours of generation. The 4%
extraction reduction will be made up by slightly increased extractions in the non-
summer months. The estimated occurrence rate is one in three years based on historical
record (35%).
3.2 Components and Factors for Peak Hour Pumped Storage As described in the WSWB Fact Sheet (Attachment I), the onsite facilities at WSWB include an
84” diameter recharge pipe, percolation ponds, a pump station, and 62 wells. When fully built
out, WSWB will have most of the elements needed for a pumped storage project: topography
that enables a large change in elevation, a big conveyance pipe, a pump station/turbine, and
potential sites for large upstream and downstream reservoirs. Along with operational
considerations described in the preceding section, factors such as friction losses associated
with cycling water, turbine type and costs, and availability of potential reservoir sites also affect
the ability to add pumped storage to an existing groundwater storage project.
3.2.1 Reservoir Site Analysis
A pumped storage project needs both an upper and a lower reservoir. This enables hydropower
operations regardless of whether the water bank is recharging, extracting, or is idle. Water is
pumped to the upper reservoir during the off-peak period. It is drained down to the lower
reservoir during the on-peak period. Power is generated when water flows through the turbine
generator and into the lower reservoir. This can occur 365 days a year.
Originally, it was assumed that DWR may allow the California Aqueduct to serve as the upper
reservoir by enabling daily flow variation. Subsequent discussions with DWR staff indicated
that the department is adamantly opposed to this (Craig Trombly, personal communication,
August 5, 2016). Consequently, potential sites for the upper reservoir were identified near the
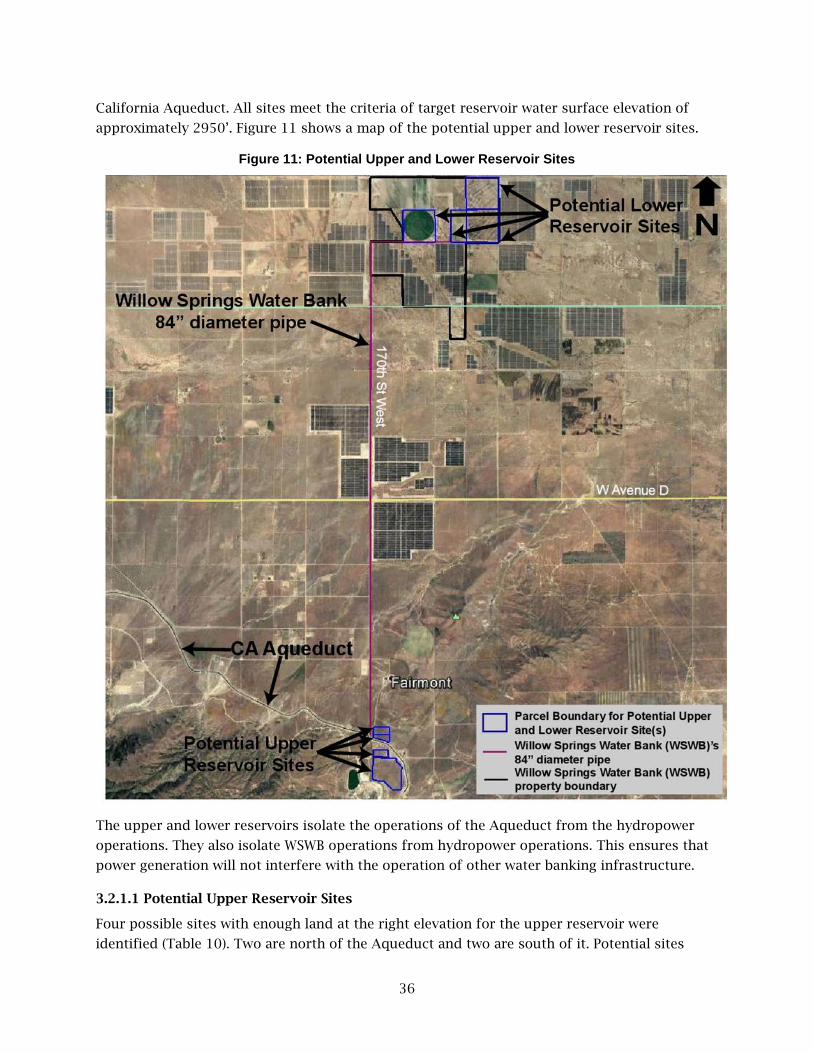
36
California Aqueduct. All sites meet the criteria of target reservoir water surface elevation of
approximately 2950’. Figure 11 shows a map of the potential upper and lower reservoir sites.
Figure 11: Potential Upper and Lower Reservoir Sites
The upper and lower reservoirs isolate the operations of the Aqueduct from the hydropower
operations. They also isolate WSWB operations from hydropower operations. This ensures that
power generation will not interfere with the operation of other water banking infrastructure.
3.2.1.1 Potential Upper Reservoir Sites
Four possible sites with enough land at the right elevation for the upper reservoir were
identified (Table 10). Two are north of the Aqueduct and two are south of it. Potential sites

37
were identified based on whether the land is vacant, whether it is at the right elevation, whether
14 acres or more of land is available, and proximity of the site to the WSWB turnout structure.
Available parcels range from 13 acres to 114 acres as shown in Appendix C. Phasing can be
accomplished by using more than one site or one of the larger parcels.
The two reservoir sites north of the Aqueduct are at elevations lower than the 2955 feet water
surface in the Aqueduct. These sites are five feet to 25 feet lower than the Aqueduct’s water
surface. To make these sites viable, a 250 cfs, 378 HP low lift pump station (10 feet to 30 feet
lift) and piping to CA Aqueduct will be needed to pump the water back into the Aqueduct. Most
years, WSWB will be idle or recharging water. Pumping is only necessary during dry years.
Table 10: Summary of Potential Land for Upper Reservoir
Location Assessor Identification Number (AIN)
Elevation Size, Acres
Value/acre based on
taxes
Land Use
North of Aqueduct 3236-020-003 2930’ 17 $2,813/ac. Vacant North of Aqueduct 3236-020-004 2950’ 13 $3,028/ac. Vacant South of Aqueduct 3236-021-009 3000’ 114 $1,044/ac. Vacant South of Aqueduct 3236-020-008 3000’ 15 $3,333/ac. Vacant
Sources: APN, Land Use, Value and Size (Los Angeles County Office of the Assessor, n.d.) Elevation (Google Earth)
The two reservoir sites south of the Aqueduct are at elevations higher than the 2955 feet water
surface in the Aqueduct. They are 45 feet higher than the Aqueduct’s water surface. An upper
reservoir located at any of these two sites will require a lift of 50 feet to receive water from the
Aqueduct. Appendix C-5 through Appendix C-5 show Google Earth images of all of these four
sites.
One upper reservoir site that has been considered is the Los Angeles Department of Water and
Power’s (LADWP’s) abandoned Fairmont Reservoir #1. This site is at an elevation of 3033 feet
and provides the highest lift differential of the reservoir sites considered. It is also vacant.
WSWB has not yet approached LADWP about using this location due to the availability of other
alternative sites.
3.2.1.2 Potential Lower Reservoir Sites
Four lower reservoir sites were also considered (Appendix C-6). All of these sites are on land
owned by WSWB. This eliminates the need to purchase new right-of-way for these sites. Table
11 describes the four lower reservoir sites of interest, along with the corresponding elevation
differences.
The lower reservoir is an integral part of the facilities required to build out WSWB. This is
because the control of 62 wells is too difficult operationally unless the reservoir provides a
fixed water surface level. The fixed hydraulic grade line also makes variable speed drives
unnecessary. Finally, it serves as the well for the pump station. It does double-duty as storage
volume to enable both pumped storage and demand response by the wells.

38
Table 11: Summary of Potential Land for Lower Reservoir
Location Assessor Parcel
Number (APN)
Elevation Size, Acres
Cost ($) Land Use Owner
Gaskell & 160th 261-196-24 2640’ 25 0 Vacant WSWB
Willow and 150th 359-041-11 2630’ 25 0 Vacant WSWB
Gaskell & 150th NW 359-041-12 2620’ 25 0 Vacant WSWB
Gaskell & 155th NW 359-041-13 2630’ 25 0 Vacant WSWB
Sources: APN, Land Use, and Size (Kern County California, n.d.) Elevation (Google Earth)
3.2.2 Selection of Generator Type
With pumped storage, it is possible to generate electricity by running the pump in reverse as a
turbine generator. This is possible with reaction pumps like Francis or Kaplan turbines (Figure
12). Running the pump in reverse is the simplest and least expensive way to generate electricity.
Using a reaction turbine, however, may create hydraulic control problems. For example, valves
and controls are necessary to make sure the pump never becomes a “runaway turbine”.
Hydraulic surge is also more difficult to deal with, especially if the pipe and pump system is
being shut off regularly. Also, dual purpose pump/turbines are generally not available in a size
smaller than 50 MW. Units available in the 5 MW size limit the options to a separate pump and
turbine system.
Figure 12: Francis Turbine
Source: (Eternoo Machinery Co., Ltd, n.d.)
An impulse turbine like a Pelton Wheel (Figure 13) is more expensive to install than running an
existing pump in reverse. However, an impulse turbine is more cost effective overall than a
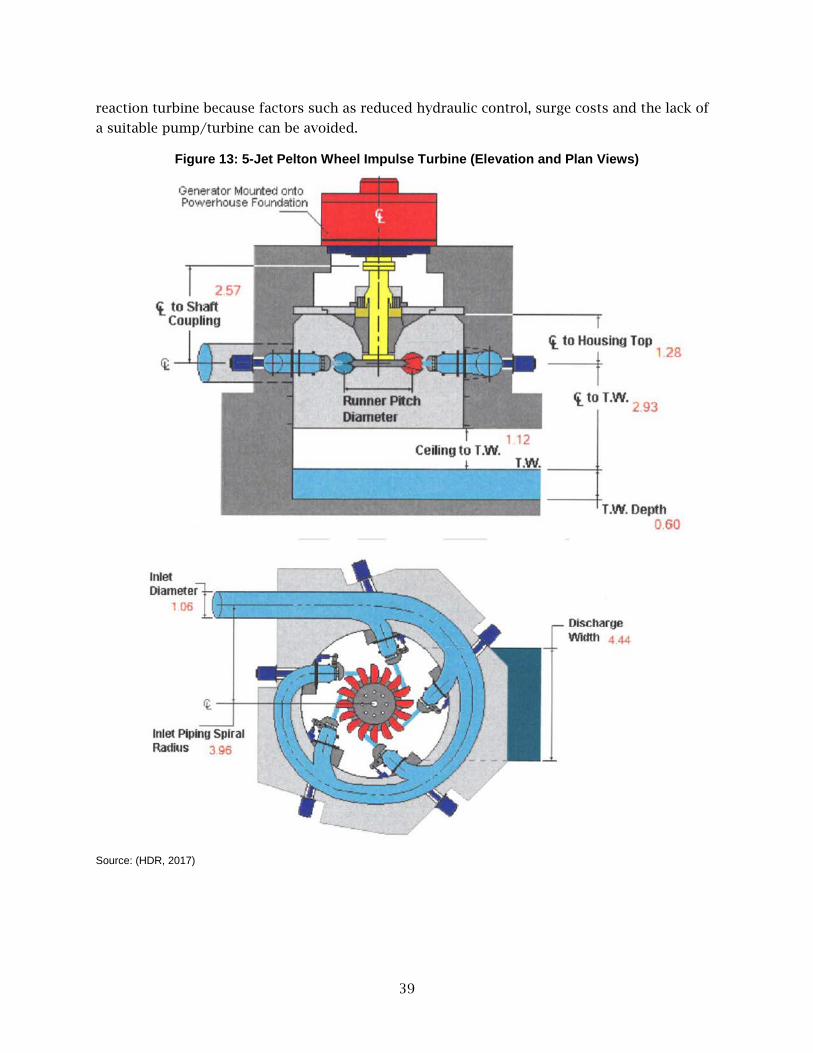
39
reaction turbine because factors such as reduced hydraulic control, surge costs and the lack of
a suitable pump/turbine can be avoided.
Figure 13: 5-Jet Pelton Wheel Impulse Turbine (Elevation and Plan Views)
Source: (HDR, 2017)

40
3.2.3 Total Energy Losses
Pipe friction and pump-turbine energy efficiency losses must be added to the static head to
calculate the total dynamic head. The total dynamic head determines the power required for the
pump station. It also determines the amount of energy that can be generated from a turbine.
Table 12 lists the pipe friction and pump and turbine efficiency loss assumptions used for this
project.
3.2.3.1 Static Lift
The static “lift” is the elevation difference between the upper reservoir and the lower reservoir.
This elevation difference determines the amount of head or lift available to generate energy.
The larger the lift, the better. The upper reservoir sites considered are located near the
California Aqueduct at W Avenue H and 170th St. W. They range from elevations of 2930 feet to
3000 feet. The lower reservoir sites range in elevation from 2620 feet to 2640 feet. This creates
a range of potential lifts from 290 feet to 380 feet. A 330 foot static lift is used for power and
hydraulic calculations in this report. This is based on the most likely ultimate sites for the
upper and lower reservoirs.
3.2.3.2 Pipe Friction
The largest energy efficiency losses come from pipe friction. These losses are 16’, 47’, and 71’
for an 84” dimeter pipe that is 9.25 miles long and has water flowing at 140 cfs, 250 cfs, and
310 cfs, respectively. These friction loss rates are based on HDR’s hydraulic calculations for
WSWB site (HDR, 2017)
3.2.3.3 Pump and Motor Efficiency
Pump and motor efficiency affects energy losses. A pump efficiency of 87% and a motor
efficiency of 96% is used for this study. Similarly, a turbine efficiency of 91% and a generator
efficiency of 96% is used for this study. These values are based on the pumped storage
operation characteristics provided in HDR report15 and were developed from standard industry
assumptions. The turbine type assumed is a multi-jet Pelton Wheel impulse turbine because a
Francis type reaction turbine is not available in the 5 MW size range.
3.3 Calculation of Hydropower Generation Table 12 summarizes the potential hydropower generation at WSWB. The potential is split into
two phases to match the planned phased buildout of WSWB. Static lift is 330 feet for both
phases. Phase 1 flow is 140 cubic feet per second (cfs). Phase 2 flow is 250 cfs. The size of both
the upper and the lower reservoir for Phase 1 is 58 AF, requiring 14 acres of land. The size of
the upper and the lower reservoir for Phase 2 is 103 AF, requiring 25 acres of land. This results
in a capacity of 3.2 MW for the Phase 1 generator and 5.2 MW for Phase 2 generator.
The size of the pump-turbine is determined by power (horsepower [hp]) necessary for the pump
station. The detailed hydropower estimates are shown in the HDR report (HDR, 2017).
15 HDR, 2017

41
Table 12: Reservoir, Generator and Pump Power Calculations
Phase Flow, cfs
Generator/Turbine or Pump/Motor
Efficiency
Static lift
Pipe Friction
Loss
Total Dynamic
Head
Turbine or Pump Power
Phase 1 Generator
140 96% & 91% 330’ 16’ 314’
3.2 MW
Phase 1 Pump
140 87% & 96% 330’ 16’ 346’
4.9 MW (6,600 hp)
Phase 2 Generator
250 96% & 91% 330’ 47’ 283’
5.2 MW
Phase 2 Pump
310 87% & 96% 330’ 71’ 401’
10.2 MW (13,700 hp)
3.4 Extended Duration Battery Potential Pumped storage at WSWB has the potential to function much like an extended duration battery.
Instead of a five-hour discharge period, if the upper and lower reservoirs are made larger, the
power generation can be extended to up to 12 hours daily if this benefits the grid. Pumped
storage could also be used to provide power during an emergency or during a potential early
morning ramp up.
The upper reservoir volume is sized to match the volume of the lower reservoir. This enables
one complete pumped storage cycle during a 24-hour period.
The potential for extending the duration of power generation is demonstrated in Table 13. For a
five-hour energy generation duration, the upper reservoir requires 25 acres of land when the
WSWB is fully built out. The lower reservoir also requires about 25 acres of land. This
calculation assumes 5 feet maximum berm height plus 1 foot of freeboard to avoid being
considered a dam (a dam is greater than 6 feet berm height). A lined and covered earthen
bermed reservoir is assumed. It is also assumed that the total area required for each of the
reservoirs includes 20% more land than the wetted area to account for berms and access roads.
Table 13: Summary of Upper and Lower Reservoir Sizing
Reservoir Elevation Water Depth
Volume Surface Area
5-Hour Size*
8-Hour Size*
12-Hour Size*
24-Hour Size*
Upper, Phase 1
2950’ 5’ 58 AF 12 acres 14 acres 22 acres
33 acres 66 acres
Upper, Phase 2
2950’ 5’ 103 AF 21 acres 25 acres 40 acres
60 acres 120 acres
Lower, Phase 1
2620’ 5’ 58 AF 12 acres 14 acres 22 acres
33 acres -
Lower, Phase 2
2620’ 5’ 103 AF 21 acres 25 acres 40 acres
60 acres -
*Includes 20% more land for non-wetted area.
The 12-hour duration reservoir requires 60 acres. Longer durations like 24-hour generation are
possible, but it would be a one-time discharge because 12 hours is required to refill the upper

42
reservoir daily. Phasing of the water bank requires that a second reservoir be built that is
roughly the same volume as the first reservoir to handle 250 cfs flows.
Longer durations of power generation for up to 12 hours may help fill the gap between
batteries and large hydropower resources. It could also be used to help address a potential
second daily spike in demand in the early morning. The ability to generate electricity for up to
12 hours could be used as necessary to add more power to the grid. The only requirement is
that the upper and lower reservoirs are built large enough to allow extended power generation.
3.5 Demand Response Potential of the Pumping Plant Demand response is the ability to reduce using electricity when the grid has a shortage. This is
possible at WSWB in an extraction year. Similar to the demand response potential of the well
field described in Section 2.6, pumps at the pumping plant also have the potential to provide
demand response. Like the well pumps, the pumping plant pumps could be shut off for five
hours a day during years that water is being pumped back to the California Aqueduct.
Extraction is expected to occur one in three years during dry conditions. The upper reservoir
will maintain a constant flow to the Aqueduct with a small, low-lift pump (10 feet) at the
reservoir site.
The demand response potential of the pumping plant corresponds to the size of the pumps, or
10.2 MW and can be achieved by shutting down the pumping plant to the Aqueduct for five
hours a day during weekdays in the summer months. The 4% reduction in summer water
delivery to the Aqueduct can be made up during deliveries at other times of the year because
DWR allows 9% peaking for its facilities.
3.6 Cost Estimates The incremental capital cost of installing Peak Hour Pumped Storage (PHPS) and demand
response includes the following items:
• Cost of a 103-AF upper reservoir, including 25 acres of land
• Cost of a 250-cfs, 378 hp low lift pump station and piping to CA Aqueduct
• Cost of two new 3.4-MW impulse turbine
• The cost of 4% additional well capacity to enable demand response (2 wells)
All other costs for pump stations, pipelines, lower reservoir, and wells are part of the original
water bank and do not increase project costs. Table 14 summarizes the cost of the additional
capital cost necessary to install PHPS and incorporate demand response at WSWB. The total cost
estimate is $10 million to implement 5.2 MW of Peak Hour Pumped Storage and 24.2 MW of
demand response.
These costs are feasibility study level. More precise cost and schedule estimates will be made
during preliminary and detailed design, including whether the project should be built out in
two phases or built out completely in one step only.
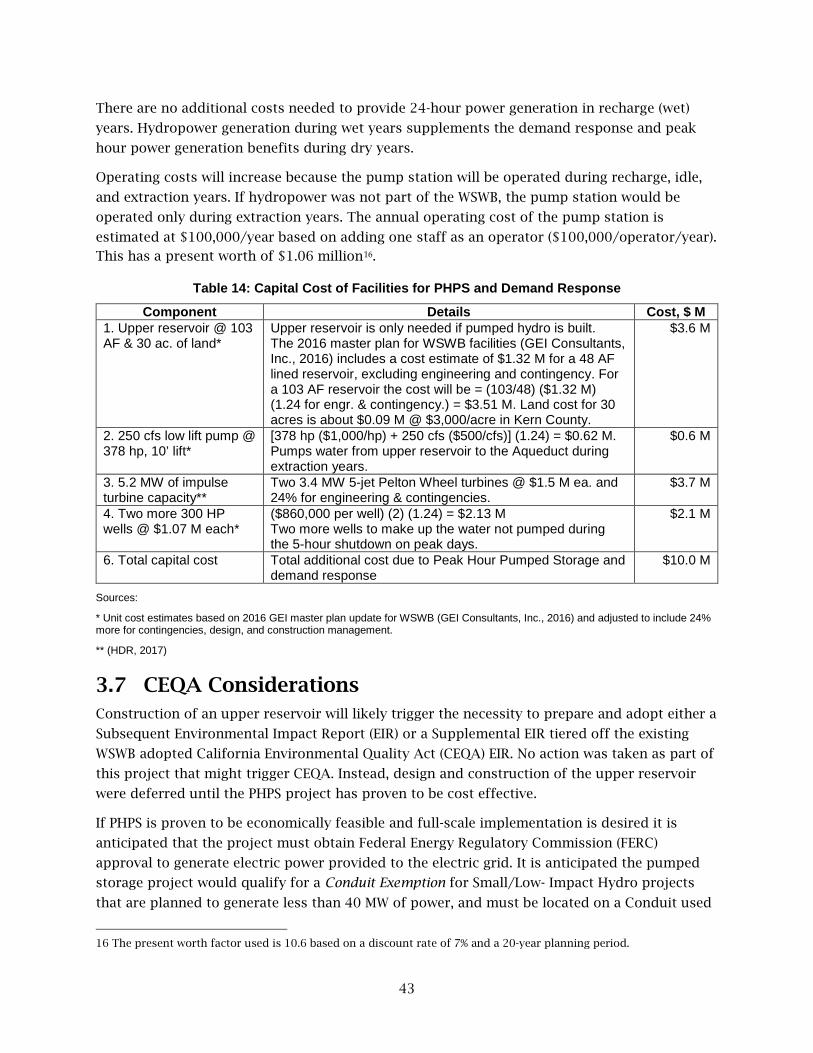
43
There are no additional costs needed to provide 24-hour power generation in recharge (wet)
years. Hydropower generation during wet years supplements the demand response and peak
hour power generation benefits during dry years.
Operating costs will increase because the pump station will be operated during recharge, idle,
and extraction years. If hydropower was not part of the WSWB, the pump station would be
operated only during extraction years. The annual operating cost of the pump station is
estimated at $100,000/year based on adding one staff as an operator ($100,000/operator/year).
This has a present worth of $1.06 million16.
Table 14: Capital Cost of Facilities for PHPS and Demand Response
Component Details Cost, $ M 1. Upper reservoir @ 103 AF & 30 ac. of land*
Upper reservoir is only needed if pumped hydro is built. The 2016 master plan for WSWB facilities (GEI Consultants, Inc., 2016) includes a cost estimate of $1.32 M for a 48 AF lined reservoir, excluding engineering and contingency. For a 103 AF reservoir the cost will be = (103/48) ($1.32 M) (1.24 for engr. & contingency.) = $3.51 M. Land cost for 30 acres is about $0.09 M @ $3,000/acre in Kern County.
$3.6 M
2. 250 cfs low lift pump @ 378 hp, 10’ lift*
[378 hp ($1,000/hp) + 250 cfs ($500/cfs)] (1.24) = $0.62 M. Pumps water from upper reservoir to the Aqueduct during extraction years.
$0.6 M
3. 5.2 MW of impulse turbine capacity**
Two 3.4 MW 5-jet Pelton Wheel turbines @ $1.5 M ea. and 24% for engineering & contingencies.
$3.7 M
4. Two more 300 HP wells @ $1.07 M each*
($860,000 per well) (2) (1.24) = $2.13 M Two more wells to make up the water not pumped during the 5-hour shutdown on peak days.
$2.1 M
6. Total capital cost Total additional cost due to Peak Hour Pumped Storage and demand response
$10.0 M
Sources:
* Unit cost estimates based on 2016 GEI master plan update for WSWB (GEI Consultants, Inc., 2016) and adjusted to include 24% more for contingencies, design, and construction management.
** (HDR, 2017)
3.7 CEQA Considerations Construction of an upper reservoir will likely trigger the necessity to prepare and adopt either a
Subsequent Environmental Impact Report (EIR) or a Supplemental EIR tiered off the existing
WSWB adopted California Environmental Quality Act (CEQA) EIR. No action was taken as part of
this project that might trigger CEQA. Instead, design and construction of the upper reservoir
were deferred until the PHPS project has proven to be cost effective.
If PHPS is proven to be economically feasible and full-scale implementation is desired it is
anticipated that the project must obtain Federal Energy Regulatory Commission (FERC)
approval to generate electric power provided to the electric grid. It is anticipated the pumped
storage project would qualify for a Conduit Exemption for Small/Low- Impact Hydro projects
that are planned to generate less than 40 MW of power, and must be located on a Conduit used
16 The present worth factor used is 10.6 based on a discount rate of 7% and a 20-year planning period.
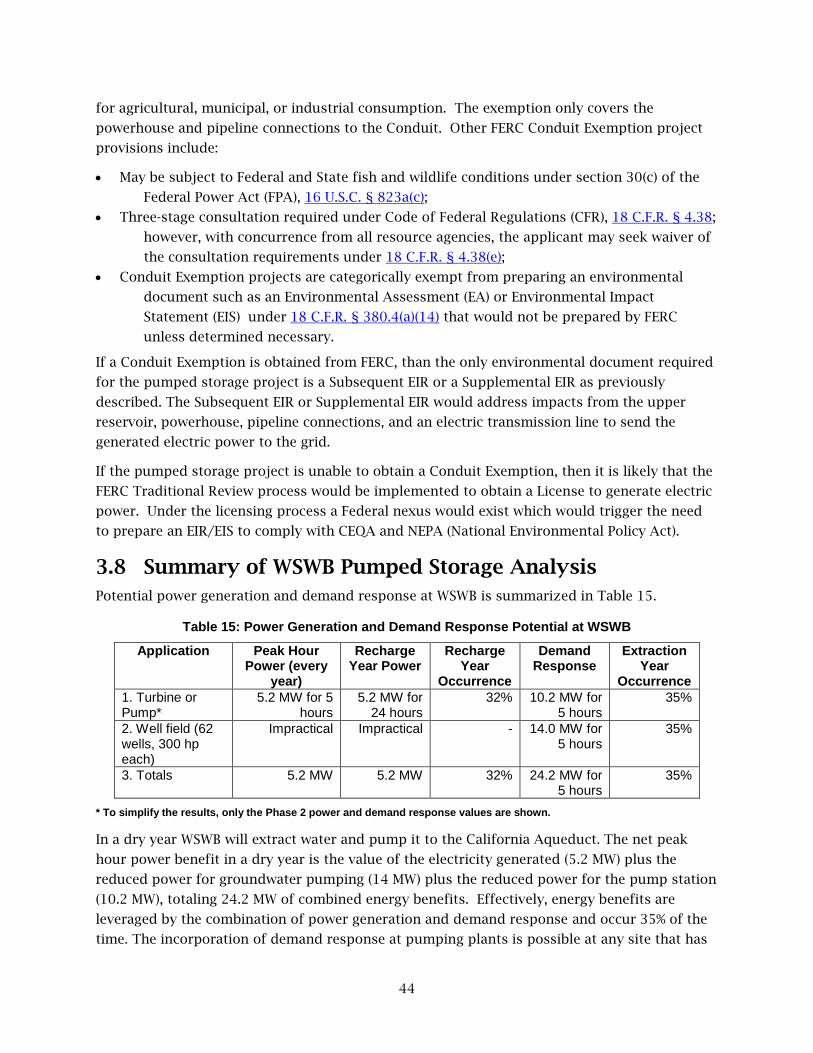
44
for agricultural, municipal, or industrial consumption. The exemption only covers the
powerhouse and pipeline connections to the Conduit. Other FERC Conduit Exemption project
provisions include:
• May be subject to Federal and State fish and wildlife conditions under section 30(c) of the
Federal Power Act (FPA), 16 U.S.C. § 823a(c);
• Three-stage consultation required under Code of Federal Regulations (CFR), 18 C.F.R. § 4.38;
however, with concurrence from all resource agencies, the applicant may seek waiver of
the consultation requirements under 18 C.F.R. § 4.38(e);
• Conduit Exemption projects are categorically exempt from preparing an environmental
document such as an Environmental Assessment (EA) or Environmental Impact
Statement (EIS) under 18 C.F.R. § 380.4(a)(14) that would not be prepared by FERC
unless determined necessary.
If a Conduit Exemption is obtained from FERC, than the only environmental document required
for the pumped storage project is a Subsequent EIR or a Supplemental EIR as previously
described. The Subsequent EIR or Supplemental EIR would address impacts from the upper
reservoir, powerhouse, pipeline connections, and an electric transmission line to send the
generated electric power to the grid.
If the pumped storage project is unable to obtain a Conduit Exemption, then it is likely that the
FERC Traditional Review process would be implemented to obtain a License to generate electric
power. Under the licensing process a Federal nexus would exist which would trigger the need
to prepare an EIR/EIS to comply with CEQA and NEPA (National Environmental Policy Act).
3.8 Summary of WSWB Pumped Storage Analysis Potential power generation and demand response at WSWB is summarized in Table 15.
Table 15: Power Generation and Demand Response Potential at WSWB
Application Peak Hour Power (every
year)
Recharge Year Power
Recharge Year
Occurrence
Demand Response
Extraction Year
Occurrence 1. Turbine or Pump*
5.2 MW for 5 hours
5.2 MW for 24 hours
32% 10.2 MW for 5 hours
35%
2. Well field (62 wells, 300 hp each)
Impractical Impractical - 14.0 MW for 5 hours
35%
3. Totals 5.2 MW 5.2 MW 32% 24.2 MW for 5 hours
35%
* To simplify the results, only the Phase 2 power and demand response values are shown.
In a dry year WSWB will extract water and pump it to the California Aqueduct. The net peak
hour power benefit in a dry year is the value of the electricity generated (5.2 MW) plus the
reduced power for groundwater pumping (14 MW) plus the reduced power for the pump station
(10.2 MW), totaling 24.2 MW of combined energy benefits. Effectively, energy benefits are
leveraged by the combination of power generation and demand response and occur 35% of the
time. The incorporation of demand response at pumping plants is possible at any site that has

45
room for upper and lower reservoirs and incorporates a lift to get water into or out of the bank.
Demand response using well pumps is possible at any site that has room for a small reservoir
and wells with remote on/off switches (Figure 14).
In years when the bank is idle, the net peak hour benefit is the value of the 5.2 MW of electricity
generated. This will occur 33% of the time.
In wet years, WSWB will recharge water into the bank’s percolation ponds. Recharge flow is a
constant 250 cfs. This will generate electricity 24 hours a day for the entire year. The benefit is
the value of the 5.2 MW of electricity generated constantly over the year. This occurs 32% of the
time.
The hydrologic cycle is random. Consequently, the combined benefits of power generation and
demand response are unpredictable. The years in which these benefits occur are not correlated
to other load-inducing factors such as hot summer temperatures.
To implement PHPS technology at WSWB, turbine type must be further evaluated to verify that a
reaction pump cannot be run in reverse as a generator in the 5 MW size range and a separate
impulse turbine is required. This will involve preliminary design with cost ramifications about
$3.7 million. This does not include the cost of additional hydraulic and surge control that may
be required. The best sites and optimum sizes for the upper and lower reservoirs will also need
to be determined. Additionally, the right-of-way will need to be acquired for the upper reservoir
and the facilities plan updated to set aside land at WSWB for the lower reservoir.
Figure 14: A Groundwater Well at Willow Springs Water Bank
Figure 14 shows one of the smaller groundwater wells (with a 200 hp motor) at Willow Springs Water Bank (WSWB). Most groundwater banking projects have recovery wells that can potentially be automated for demand response.
Photo Credit: Tommy Ta, Antelope Valley Water Storage, LLC (AVWS)

46
Results of the WSWP specific evaluation were incorporated into the Peak Hour Pumped Storage
(PHPS) and Aquifer Pumped Hydro (APH) templates. The templates allow the calculation of
pumped storage, hydropower generation, and demand response potential of the well field and
pump station(s) for other groundwater banking projects. The permitting requirements for both
the pumped storage technologies have been briefly discussed in the context of implementing
pumped storage at WSWB. As discussed in Chapter 4, a next-step pilot project may be required
to consider permitting in more detail.

47
CHAPTER 4: Statewide Applicability Analysis
This chapter describes the technical feasibility of implementing the Peak Hour Pumped Storage
(PHPS) and Aquifer Pumped Hydro (APH) technologies at groundwater banks in California.
In determining the potential of any storage system, ease of use and scalability plays an
important part. Therefore, the feasibility criteria previously identified were used to evaluate
statewide potential of the pumped storage at groundwater banks. The two energy storage
systems are not mutually exclusive and a single groundwater banking facility can potentially
deploy both. To determine the statewide potential, the study takes into account various kinds
of groundwater banking operations including recycled water projects. Recycled water projects
that use injection wells require only have the generating cycle of APH and therefore may have
considerable potential for generating peak energy. This is because in most instances, recycled
water needs to be recharged daily. Recycled water also has most of its particles removed so
there is lower risk of well screens getting clogged.
Groundwater banking projects around the state also have capability to provide demand
response during extraction years. Estimates of the statewide demand response potential and its
value were also developed as part of this project.
An important component of the statewide analysis is development of a template that makes it
possible to evaluate pumped storage potential for any groundwater banking project including
those that are currently being planned to recharge the overdrafted groundwater basins in
California.
4.1 Literature Review and Statewide Survey Given the number of groundwater banking agencies and complexity and diversity of their
individual conveyance systems and operational metrics, a statewide survey was developed to
obtain key information to determine pumped storage system feasibility at various groundwater
banking sites. Information from the survey responses was supplemented by literature research
with the goal of identifying promising sites for pumped storage and formulating follow up
questions to the surveyed agencies that pass the preliminary screening. The literature review
focused on researching the urban water management plans and other reports and analyzing
this information in conjunction with the survey responses. The results from both of these data
collection activities are summarized in Appendix D-1 through Appendix D-7.
Statewide survey outreach started in December 2016. All of the agencies on the List of
California Groundwater Banking Projects17 were contacted at least twice. The received survey
responses were incorporated into the statewide master database compiled for this study. The
17 Antelope Valley Water Storage (AVWS), 2016

48
response rate was found to be inadequate to provide a statewide picture of the pumped storage
potential at groundwater banks particularly with regards to Peak Hour Pumped Storage (PHPS).
4.2 Analysis Approach for Peak Hour Pumped Storage To determine potential of PHPS technology, information on flow rate and elevation difference
between source conveyance and recharge basin(s) is necessary. Previous studies have
acknowledged the difficulty of obtaining comprehensive data about specific water system
facilities and operational flows since this information is generally not available in public
domain for security reasons.18
Therefore, an alternative approach to PHPS statewide analysis was adopted. Since hydropower
generation and PHPS both require similar criteria (namely sufficient head and flow) for
successful implementation, statewide estimates for small hydropower potential can be used to
give a preliminary estimate of Peak Hour Pumped Storage (PHPS) potential at groundwater
banking projects.
An existing study, Statewide Small Hydropower Resource Assessment 19 estimates the statewide
potential for small hydropower in manmade conduits (pipelines, aqueducts, irrigation ditches,
and canals) by using annual water entitlements to extrapolate the computed small hydropower
generation potential for the surveyed population to the population of water agencies that were
not surveyed. The study recognizes the potential of in-conduit hydropower to be used in
conjunction with pumped storage facilities for generating power during peak periods.
The developable hydropower potential in man-made conduits is estimated to be 140 MW- 170
MW which is 50-60% of the statewide undeveloped small hydropower nameplate potential (278
MW)20. The statewide in-conduit small hydropower coincident peak capacity occurs during July
and August and is estimated to be 230 MW (Navigant Consulting, June 2006; Kane, 2005).
Annual water entitlements and available county level coincident peak hydropower capacity data
was used to interpolate small hydropower potential for the groundwater banking agencies. For
example, if groundwater banking water agencies located in a particular county have total water
entitlements that constitute 39% of the total county water entitlements, the cumulative
hydropower production potential for these districts was estimated to be 39% of the countywide
hydropower potential (kW) of all (groundwater banking and non-groundwater banking) districts
(Appendix E shows these calculations.) In the reference statewide small hydropower study, the
small hydropower generation potential was extrapolated using estimation factors that were
developed based on size, primary water system function (irrigation vs. municipal) and
geographic region (north, central and south) of the surveyed and non-surveyed agencies.
Because of unavailability of the entire reference study database, the interpolation method
described above takes into account only the annual water entitlements and geographic region. It
is acknowledged that annual water entitlements are insufficient to compute hydropower or 18 Navigant Consulting, June 2006
19 Navigant Consulting, June 2006
20 Navigant Consulting, June 2006; Kane, 2005

49
pumped storage potential in absence of other information, particularly head losses. However, it
can be assumed that the available static head21 to generate power does not differ significantly
for the water districts located in the same county. This assumption is borne out by the findings
of the reference study which indicate that the different regions of the state have distinct
advantages or drawbacks regarding available head and operational flows (Navigant Consulting,
June 2006). Additionally, analysis of countywide annual water entitlements data from Statewide
Small Hydropower Resource Assessment (Navigant Consulting, June 2006) in conjunction with
countywide small hydropower potential data from California Small Hydropower and Ocean
Wave Energy Resources (Kane, 2005) shows that for a particular region, counties with higher
annual water entitlements generally have higher small hydropower generation potential than
those with lower annual water entitlements . Therefore, it can be assumed that the annual
water entitlements are largely responsible for the difference in hydropower potential between
the water districts situated in the same county.22 This estimated countywide small hydropower
potential for groundwater banking agencies was rolled up to give the potential for each
hydrologic region (Table 16).
4.2.1 Statewide PHPS Potential at Groundwater Banking Projects
The cumulative PHPS potential of groundwater banking agencies will be lower than the
cumulative small hydropower potential (Table 16) because PHPS differs from small hydropower
in several key ways which constrain the statewide PHPS potential:
1. A minimum head of nine feet and a minimum flow rate of 120 cfs is required to install a
small hydropower facility in an existing manmade conduit (Navigant Consulting, June 2006).
Although the small hydropower criteria flow rate of 120 cfs is a reasonable minimum threshold
for PHPS, the elevation difference between the upper reservoir and lower reservoir would need
to be much greater than nine feet for PHPS to be economically feasible at a site. Additionally,
pipe length has a significant impact on pipe friction and pipe friction losses can be kept to a
minimum for a given flow rate at sites where the length of pipe between upper reservoir and
generator can be minimized. The uncertainty in the computed statewide PHPS potential is
therefore largely due to information gaps regarding elevation data and length of conveyances.
2. The reference study (Navigant Consulting, June 2006) assumes a “run of the river (canal in
most cases)” hydropower development with no more than part day storage. PHPS will need
closed conduits (pipelines) to cycle the water. A previous study23 (California Department of
Water Resources, April 1981) indicates that most of the pipelines with small hydroelectric
generation potential are clustered in the southern portion of the state and that in this region,
majority of the man-made conduits that have hydropower potential are pipelines. In contrast, in
21 Elevation difference between the upper and lower reservoir.
22 This does not imply that higher flow rates or volumes will consistently result in higher hydropower potential. As described in the WSWB PHPS analysis (HDR, 2017) conducted for this project, the friction loss rate in a given pumped storage operation increases rapidly after the flow rate exceeds a certain point.
23 The map, “Potential Small Hydroelectric Sites at Existing Hydraulic Facilities” in “Bulletin 211 Small Hydroelectric Potential at Existing Hydraulic Structures in California” shows dam, canal, and pipeline facilities that have small hydroelectric potential.

50
northern and central regions, majority of conveyance systems with hydropower potential are
canals. Besides the large operational flows, the density of pipelines in Southern California is
another reason to focus on this region for potential PHPS opportunities or demonstration
projects. This also implies that particularly in northern and central regions of the state, PHPS is
lower than the small hydropower generation potential (Table 16). This is why the statewide
PHPS was assumed to be 50% (44 MW) of the total small hydropower generation potential of
about 88 MW.
3. The reference study identified 128 renewable portfolio standard (RPS) eligible small
hydropower sites for the water purveyors that were surveyed. Given that the in-conduit
hydropower potential on large regional conveyance systems has largely already been developed,
67% of these potential sites had capacity less than 1 MW (Navigant Consulting, June 2006).
Economic evaluation (discussed in Chapter 5) indicates that PHPS facilities with characteristics
similar to that of WSWB and with generating capacity of 5 MW will find it difficult to be
economically viable if operated as a pumped storage system during neutral years and as an
energy generator during wet years. Addition of dry year demand response can potentially make
these systems economically feasible and will also result in greater economic and grid benefits.
4. The research and survey results indicate that the pump back operations of many
groundwater banking agencies do not involve pumping to the source conveyance. Even if they
did, using a large regional conveyance systems for PHPS is unlikely to be allowed24 which
necessitates construction of an upper reservoir even for groundwater banking agencies situated
close to a large conveyance. Many groundwater banking districts (particularly the irrigation
districts) may already have a lower reservoir but would likely need to construct an upper
reservoir to implement PHPS. Sites that are located in highly urban and dense areas with few or
no options available for reservoir siting will not be able to develop PHPS.
5. The undeveloped small hydropower potential is greatest in southern region followed by
northern and central regions (Navigant Consulting, June 2006). The distribution of regional
PHPS potential is expected to be similar. Groundwater storage capacity is not a good indicator
of the PHPS potential. Central California has significant groundwater storage capacity but low
small hydropower and pumped storage potential because of insufficient head and flow. The
water systems in Northern California have higher head and flow but relatively few groundwater
banking agencies and closed conduits with small hydroelectric potential. Therefore, PHPS
potential appears to be largely limited to Southern California which region has several large
groundwater banks (Appendix E) and higher density of pipelines. However, this potential is
curtailed because of the predominantly urban nature of the region which may make land
acquisition for an upper reservoir difficult.
Assuming generation for five hours 365 days a year, implementing PHPS at groundwater banks
across the California can potentially provide 80,300,000 kWh (80 gigawatt-hours) of energy
annually. The value of this generation at different locations may be different depending on the
24 California Department of Water Resources is opposed to the use of California Aqueduct as the upper reservoir. (Personal communication with Craig Trombly, California Department of Water Resources, August 5, 2016)

51
extent to which a PHPS facility contributes to improving grid operations at a particular location.
This value analysis is beyond the scope of this study and for benefits evaluation, a single
annual value of pumped storage was calculated and used.
Table 16: Peak Hour Pumped Storage (PHPS) Potential at Groundwater Banking Projects
Geographic Region Hydrologic Region
Annual Water Entitlements
(AWE) for Groundwater
Banking Agencies
Estimated Small Hydropower
Potential (kW) for Groundwater
Banking Agencies
Estimated Statewide
Pumped Storage Potential (kW) for
Groundwater Banking
Agencies a
N Sacramento River
422,000
3,102
44,000
S South Lahontan b
466,800
12,050
N,C San Francisco Bay
512,500
4,952
S Colorado River
546,200
1,926
C,N San Joaquin River
609,000
4,686
S South Coast
2,129,590
30,173
N,C,S Tulare Lake
4,608,994
30,653
Total
9,295,084
87,542 a Estimated statewide pumped storage potential is assumed to be half of the statewide small hydropower potential for groundwater banking agencies due to the constraints discussed in the section, "Statewide PHPS Potential at Groundwater Banking Projects.” b Includes water entitlement and Peak Hour Pumped Storage (PHPS) potential for Antelope Valley Water Storage (AVWS)'s groundwater banking project, Willow Springs Water Bank (WSWB).
4.3 Aquifer Pumped Hydro Potential Relative to PHPS, literature review for APH was more successful, yielding detailed information
for several groundwater banking facilities and used to screen agencies for APH feasibility.
Transmissivity was one of the key criteria used in the screening. The sensitivity analysis results
discussed in Appendix A-2 indicate that transmissivity is one of the primary factors in
determining the round trip losses. Aquifers with high transmissivity allow the injected water to
move away faster from the site of injection which decreases the head losses associated with
mounding. In the absence of high transmissivity, the round trip losses may significantly reduce
the statewide potential for APH as described in the Willow Springs Water Bank (WSWB) APH
assessment in Chapter 2.

52
4.3.1 Aquifer Storage and Recovery (ASR) Projects
Aquifer Storage and Recovery (ASR) projects are a type of groundwater banking projects that
use injection wells to store water in the aquifer when water is available and later recover the
water from the same well. ASR projects are typically sited in areas where the underlying aquifer
has high transmissivity. Most ASR projects in Western US typically have transmissivity in the
range of 5,000 to 10,000 sq. ft/day or greater (Antelope Valley Water Storage (AVWS) LLC,
2016). Additionally, for these projects, the head losses are halved because groundwater is not
required to be first pumped to a surface reservoir. Given the above, the well field at these
projects can potentially be used to generate hydropower during recharge activities. However,
further evaluation using statewide template and results from economic analysis indicates that
the capital costs associated with retrofitting injection wells for hydropower production may be
cost prohibitive for most agencies. Whether or not energy generation is viable at a particular
ASR project will depend on the project’s location and how well the generating capacity at that
specific location compares to the costs for installing the generator and electrical package. The
Pendleton project in eastern Oregon is an example of a groundwater banking (ASR) project that
uses microturbine generators in its ASR injection wells to generate hydropower and offset its
operating costs (Profita, 2011) (Pendleton). The project’s prototype can generate 47% of the
pumping power required to deliver water to the site (Profita, 2011). This is double the efficiency
(22%) of the APH project at WSWB.
4.3.2 Recycled Water for Direct Injection
Recycled water projects that inject treated water into the ground as part of their routine
operations obviate the need to pump the groundwater to a surface reservoir prior to its
injection. These projects (as Aquifer Storage and Recovery (ASR) projects discussed above) have
higher potential to generate peak energy cost-effectively than comparable Aquifer Pumped
Hydro (APH) projects. As with APH projects however, the injection process can cause clogging
and other complications if the water is not pretreated using appropriate methods. This study
looked at which tertiary treatment methods (membranes, gravity filters or cloth filters) result in
a low enough turbidity to make recycled water suitable for direct injection.
The Division of Drinking Water (DDW) has treatment requirements for producing recycled water
for groundwater recharge. For both surface spreading and subsurface injection projects, the
recycled water must meet the disinfected tertiary recycled water treatment requirements of
Title 22 of California’s Water Recycling Criteria. The requirements for projects recharging water
via direct injection are stricter than those for surface spreading projects and preclude using
cloth filters or gravity filters. Microfiltration with reverse osmosis and disinfection is required
before recycled water can be injected (Environmental Science Associates , 2005; RMC Water and
Environment, 2007; RMC Water and Environment, 2016). The turbidity of the filtered
wastewater that has been passed through a microfiltration, ultrafiltration, nanofiltration, or
reverse osmosis membrane does not exceed 0.2 Nephelometric Turbidity Units (NTU) more than
5 % of the time within a 24-hour period and 0.5 NTU at any time (RMC Water and Environment,
2016; State Water Resources Control Board Division of Drinking Water, 2014).
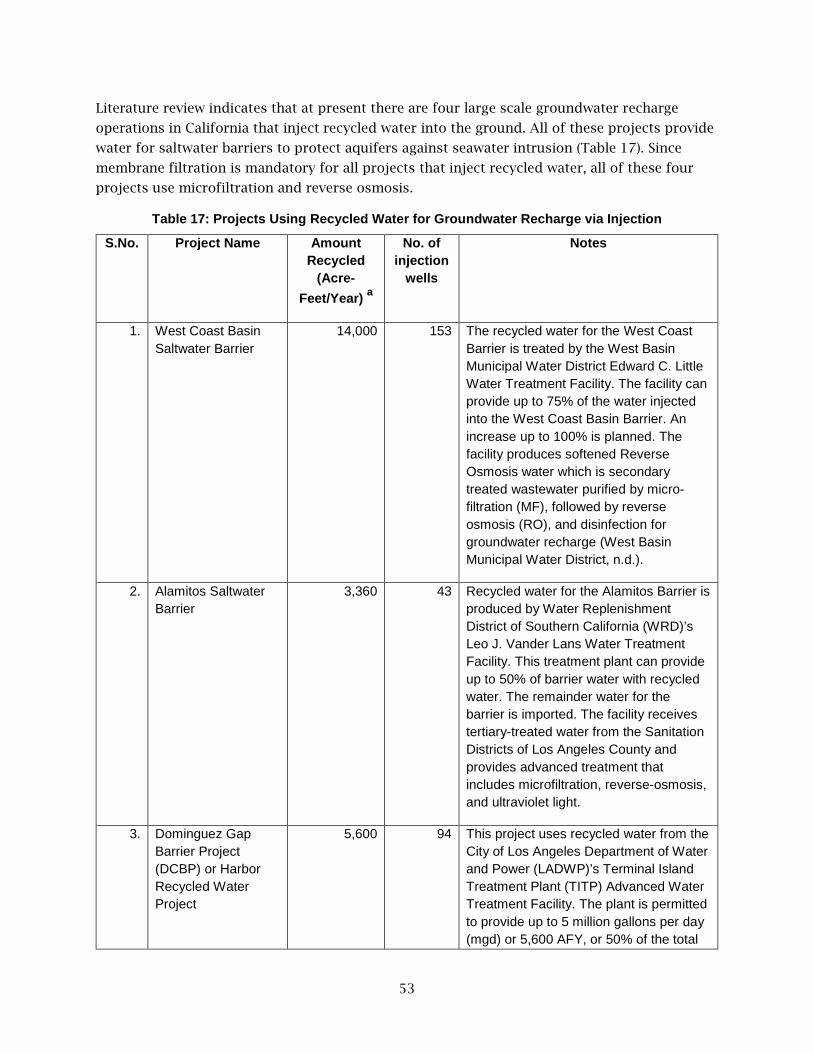
53
Literature review indicates that at present there are four large scale groundwater recharge
operations in California that inject recycled water into the ground. All of these projects provide
water for saltwater barriers to protect aquifers against seawater intrusion (Table 17). Since
membrane filtration is mandatory for all projects that inject recycled water, all of these four
projects use microfiltration and reverse osmosis.
Table 17: Projects Using Recycled Water for Groundwater Recharge via Injection
S.No. Project Name Amount Recycled
(Acre-Feet/Year) a
No. of injection
wells
Notes
1. West Coast Basin Saltwater Barrier
14,000
153 The recycled water for the West Coast Barrier is treated by the West Basin Municipal Water District Edward C. Little Water Treatment Facility. The facility can provide up to 75% of the water injected into the West Coast Basin Barrier. An increase up to 100% is planned. The facility produces softened Reverse Osmosis water which is secondary treated wastewater purified by micro-filtration (MF), followed by reverse osmosis (RO), and disinfection for groundwater recharge (West Basin Municipal Water District, n.d.).
2. Alamitos Saltwater Barrier
3,360 43 Recycled water for the Alamitos Barrier is produced by Water Replenishment District of Southern California (WRD)’s Leo J. Vander Lans Water Treatment Facility. This treatment plant can provide up to 50% of barrier water with recycled water. The remainder water for the barrier is imported. The facility receives tertiary-treated water from the Sanitation Districts of Los Angeles County and provides advanced treatment that includes microfiltration, reverse-osmosis, and ultraviolet light.
3. Dominguez Gap Barrier Project (DCBP) or Harbor Recycled Water Project
5,600 94 This project uses recycled water from the City of Los Angeles Department of Water and Power (LADWP)’s Terminal Island Treatment Plant (TITP) Advanced Water Treatment Facility. The plant is permitted to provide up to 5 million gallons per day (mgd) or 5,600 AFY, or 50% of the total

54
S.No. Project Name Amount Recycled
(Acre-Feet/Year) a
No. of injection
wells
Notes
barrier supply, whichever is less. The water is treated with microfiltration, reverse osmosis, and chlorination before being injected.
4. Orange County Groundwater Replenishment System (GWRS); Spreading/Injection
72,000 36 Approximately 30 MGD of the GWRS facility treated water is used for injection into the Talbert Barrier. Unlike other barrier projects in Southern California, 100 percent GWRS water is able to be used for injection into the seawater intrusion barrier without blending with other sources. Water at the GWRS facility is treated using microfiltration, reverse osmosis (RO) and ultraviolet (UV) disinfection with hydrogen peroxide.
a The water may need to be blended with other sources prior to recharge. The recycled amount estimates may change depending on how much water is needed for barrier projects in future.
Sources:
Amount Recycled: (Sanitation Districts of Los Angeles County, 2011)
Number of injection wells (For projects 1,2,3): (Johnson, 2007)
Number of injection wells (For project 4): (Orange County Water District, n.d.)
Recycled water treatment and facility details (For projects 1,2,3) unless otherwise indicated: (Water Replenishment District of Southern California, 2011)
Recycled water treatment and facility details (For project 4): (Groundwater Replenishment System (GWRS))
A few planning stage projects are also assessing the feasibility of using recycled water for
groundwater recharge via injection (Table 18).
Table 18: Planned Projects Using Recycled Water for Groundwater Recharge via Injection
S.No. Project/Agency Name
Amount Recycled
(Acre-Feet/Year)
No. of injection
wells
Notes and Sources
1. Camp Pendleton 435-870 12 The project will provide protection against salt water intrusion in the Lower Ysidora Sub-basin. Pilot testing was completed in 2012. (RMC Water and Environment, 2012 (Revised 2013)).
2. City of San 4000-7000 3-5 wells The potential groundwater recharge

55
S.No. Project/Agency Name
Amount Recycled
(Acre-Feet/Year)
No. of injection
wells
Notes and Sources
Buenaventura capable of sustained injection rates of between 2,500 to 4,340 gpm
reuse project (GRRP) in Mound Groundwater Basin will be used to store and reuse highly treated recycled water for Indirect Potable Reuse (IPR). The advanced treatment will involve desalination through a membrane process, advanced oxidation, and ultraviolet light (Hopkins Groundwater Consultants, Inc., 2013).
3. City of Oxnard’s Groundwater Recovery Enhancement and Treatment Program (GREAT Program). Program’s partners are United Water Conservation District (UWCD) and the Fox Canyon Groundwater Management Agency (FCGMA).
Ultimate plant capacity is 25 mgd
Design and permitting of pilot injection wells system is underway.
The Advanced Water Purification Facility (AWPF) and recycled water membrane treatment facility will provide high-quality water for groundwater injection and use as a seawater intrusion barrier (in the south Oxnard Plain) as well as for other uses including industrial processes and irrigation (Watersheds Coalition of Ventura County, 2006).
Because of the higher treatment costs associated with direct well injection of recycled water,
majority of the planned groundwater recharge reuse projects are expected to use surface
spreading rather than injection wells for groundwater recharge of recycled water (Sanitation
Districts of Los Angeles County, 2011). Therefore, statewide hydropower generation potential
from injecting recycled water for groundwater recharge is concentrated in a few regions of
Southern California and as with ASR and APH projects, this potential is constrained by
hydrogeological, site specific and operational parameters.25
4.4 Demand Response Potential of Groundwater Banks Reducing groundwater usage provides a substantial opportunity to reduce water-related energy
consumption of IOU energy (GEI Consultants/Navigant Consulting, Inc., 2010). Likewise,
“demand response”, that is, the ability to shift groundwater pumping from peak hours to non-
25 One of these parameters is head loss or pressure loss. There used to be power generating stations at Water Replenishment District of Southern California (WRD) saltwater barrier facilities when the pressure of imported water (which is used for blending with recycled water) was sufficiently high. Energy generation has been discontinued however because of current low flows and reduced pressures (Ted Johnson (Chief Hydrogeologist, WRD), personal communication (EPC 15-049 Technical Advisory Committee Meeting), November 17, 2016).

56
peak hours can reduce peak energy requirements and contribute towards overcoming the
barriers to renewable penetration. Water storage can be used to shave off more than one-third
of the peak load associated with groundwater use (California Energy Commission, 2005).
Having an onsite surface reservoir allows the water agencies or irrigation districts to pump
groundwater during off-peak hours and store it for use during on-peak hours. It is common for
many irrigation districts in California to have regulating reservoirs with volumes typically
ranging from 50,000 cubic meters (~ 40 AF) to 320,000 cubic meters (~260 AF) (Irrigation
Training and Research Center (ITRC)). Peak load curtailment and generation projects at several
water agencies including groundwater banking agencies such as North Kern Water Storage
District (NKWSD) and Berrenda Mesa Water Storage District have been funded with successful
results (Irrigation Training and Research Center (ITRC), 2005). Additionally, groundwater banks
that involve a significant pumping lift to deliver the extracted groundwater offer a unique
opportunity to combine demand response capabilities of pumping plants and well pumps at a
single site.
4.4.1 Peak Energy Requirements at Groundwater Banks
While pumped storage and associated peak hour generation benefits can potentially occur in all
hydrological year types, demand response benefits at groundwater banking projects will occur
largely in dry years since that is when most groundwater banking projects recover banked
water for delivery to partners or customers. The electric demand to pump the stored water
from a groundwater bank for delivery to participating agencies can be significant and add
considerably to the daily and seasonal peak summer loads. Therefore, groundwater banking
projects with demand response capability can decrease peak energy requirements which
opportunity has been recognized in earlier studies (Irrigation Training and Research Center
(ITRC), 2003). The facilities used to provide energy storage and peak energy generation at
groundwater banks can also be used for demand response. As with pumped storage, in most
cases only minor modifications to existing operations will be needed to enable shifting the
pumping demand out of the peak hours.
4.4.2 Demand Response Potential Associated with Well Pumps
This study focuses on the demand response potential of relatively large groundwater banking
agencies that are likely to have clusters of high production wells. Though demand response can
be implemented at smaller agencies, data gaps and the scope of this study necessitate that
evaluation be restricted to large groundwater banking operations where closely located high
pumping capacity wells make the water storage and demand response practical and cost-
effective. This approach gives a preliminary estimate of statewide demand response potential
which in conjunction with the pumped storage and peak energy generation assessment
provides useful insights about the potential of groundwater banks to meet grid needs.
Since there is no statewide database providing information about well density or well pump
power consumption at various groundwater banks, groundwater banking agencies that are
likely to have clusters of wells were identified using the recovery volumes from the master
database (Antelope Valley Water Storage (AVWS), 2016) submitted with this report. The selected

57
groundwater banking projects have annual recovery volumes in thousands of acre-feet at a
minimum. The results from the literature review conducted for the Aquifer Pumped Hydro
(APH) and the statewide survey responses for the two pumped storage technologies were also
used to provide information on the number of wells and pumping capacity for selected
groundwater banking agencies. This information was compared to the pumping capacity
estimates derived from the recovery volumes to ensure that the assumptions do not result in an
overestimation of the demand response potential.
Figure 15 shows the monthly groundwater production profiles for selected hydrologic regions
where majority of large groundwater banking projects are situated. These regions include
Tulare Lake, San Joaquin River, and Sacramento River hydrologic regions which together
comprise what is commonly referred to as the Central Valley region of California. On average,
approximately 76% of the total groundwater pumped statewide every year is used to meet
agricultural demands (State of California Natural Resoures Agency, Department of Water
Resources , April 2015). Unlike urban groundwater use, agricultural groundwater use varies
considerably during the year (Figure 15). Seasonal demand response potential is therefore also
higher for agricultural sector. Central Valley has several large irrigation districts, many of
which have onsite groundwater banking operations as shown in Appendix F). Consequently, this
region has the highest groundwater pumping use (State of California Natural Resoures Agency,
Department of Water Resources , April 2015) and demand response potential as well as the
highest groundwater storage capacity (Table 19).
Figure 15: Monthly Groundwater Production (taf) by Hydrologic Region and Type of Use
taf= thousand acre-feet

58
Statewide, only 2% of the groundwater extracted on an average annual basis is used for managed wetlands (State of California Natural Resoures Agency, Department of Water Resources , April 2015). For the purposes of this analysis, it is assumed that no groundwater is pumped for managed wetlands use and all the extracted groundwater is used to meet Ag or Urban demands.
Agricultural water demand is projected to decrease in the South Coast hydrologic region (California Department of Water Resources, 2013). For this analysis, percentage of groundwater used for agriculture is assumed to be negligible (~0 AF) for the South Coast hydrologic region.
Sources:
Average Annual Groundwater Supply by Hydrologic Region and Type of Use (State of California Natural Resoures Agency, Department of Water Resources , April 2015)
Monthly Profiles for Groundwater Production (%) by Hydrologic Region and Type of Use (GEI Consultants/Navigant Consulting, Inc., 2010)
Table 19: Demand Response Potential of Well Pumps at Groundwater Banking Projects
Hydrologic Region Total Storage Capacity (MAF) of listed projects
Demand Response Potential (MW) of listed projects
Central Coast Hydrologic Region 5.9 99 South Coast Hydrologic Region
Colorado River Hydrologic Region South Lahontan Hydrologic Region San Joaquin River Hydrologic Region
0.3 2
Sacramento River Hydrologic Region
2.36 2
Tulare Lake Hydrologic Region 11.48 115 San Francisco Bay Hydrologic Region
0.23 2
Total ~20 ~220 MAF=Million Acre-Feet
Sources: The storage capacity is from the master list of groundwater banking projects which was also one of the study deliverables (Antelope Valley Water Storage (AVWS), 2016). Demand Response Potential estimates are provided in Appendix F.
4.4.3 Demand Response Potential associated with Pump Station(s)
Any groundwater bank that has area for siting upper and lower reservoirs and relies on
pumping plants to get water into or out of the bank can potentially provide demand response
benefits by shifting peak summer demand to off-peak hours in an extraction year. Assuming
the statewide PHPS potential is 44 MW (Table 16), groundwater banks across the State can free
up more than 44 MW in cumulative peak capacity (The PHPS assessment for Willow Springs
Water Bank (WSWB) indicates that for a given PHPS lift, the power demand to pump water to the
upper reservoir is likely higher than the power produced during the generation cycle). A
project’s operational pumping capacity is the key indicator of its demand response capability.
4.5 Regulatory Considerations Current and future regulatory criteria will also impact the technical and economic feasibility of
pumped storage. As discussed in Chapter 2 the low round-trip efficiency makes APH
deployment on a large scale unlikely. The success of APH is likely only at groundwater banking
sites that currently operate as ASR projects and are therefore located in areas of relatively high
59
transmissivity. Assuming that the APH deployment is restricted to sites with active ASR
operations, permitting requirements would be minimal since an existing ASR project will
typically have approved injection and extraction operations that have been evaluated for
compliance with water quality and other regulatory criteria. For these sites, permitting would
generally only be needed to equip the existing wells with turbines to generate power and to
obtain approval for utility interconnection. Permitting requirements will be more extensive for
sites that do not have active ASR activities. At the very minimum, these projects will have to
meet Regional Water Quality Control Board (RWQCB) requirements to pump, store, and inject
groundwater.
For PHPS, both upper and lower reservoirs must be covered and lined to keep out tumbleweeds
and dust. Floating covers could be used for the purpose. For full-scale implementation of a
PHPS project, a Federal Energy Regulatory Commission (FERC) approval or “Conduit Exemption”
and an environmental document such as Supplemental Environmental Impact Report (EIR) or
Subsequent EIR is necessary at a minimum. An Environmental Impact Statement (EIS) may also
be required if a FERC Traditional Review process to obtain a license has to be implemented.
Appendix G lists additional permits and registrations, some or all of which may be needed to
test and deploy pumped storage at a groundwater banking project. Compliance with regulatory
criteria will ensure that any negative environmental impacts that may result from
implementation of pumped storage at groundwater banks are avoided or suitably mitigated.
4.6 Template to Assess Pumped Storage Potential The template provides a decision-making tool to assess current and future groundwater
banking operations for energy storage and demand response potential. The template walks the
user through a series of preliminary questions and calculations to determine a site’s technical
and economic viability for pumped storage implementation. The template incorporates criteria
pertaining to a site’s physical and operational parameters, preliminary regulatory requirements
and economics (including threshold generation capacity (MW), and value of on-peak energy
generation and any other grid benefits) to provide a conceptual estimate of a site’s feasibility
for APH or PHPS. The template and its accompanying documentation submitted with this
report describe the criteria in detail.
The template also includes an assessment of a project’s potential to participate in a demand
response program. Demand response benefits have traditionally come from turning off the
pumps at the pumping plant and groundwater well pumps during the peak hours but
increasingly are looking at increasing demand during renewable overgeneration hours. The
demand response program will be most effective in places where high capacity wells are located
close together so as to require a single reservoir for storing the water pumped during off-peak
hours. For evaluation of demand response potential, appropriate criteria including number of
additional wells that may be needed have been incorporated in the template.
While the template can be used by any groundwater banking project, it is recommended that
only projects that meet certain criteria should do an in-depth evaluation of the pumped storage
potential for their specific site using the template tool(s). The in-built preliminary criteria in the

60
template will assist a project owner in determining whether a more detailed pumped storage
evaluation is warranted for a specific project site. Evaluation is done using an analysis process
similar to the one for WSWB described in this report.
The developed template may be used to identify candidate sites for pilot testing of APH and
PHPS. Along with the technical criteria, the template also includes regulatory costs for pilot
stage projects. These costs will impact the economics of future pilot stage projects and have
also been considered in this analysis.
4.7 Summary of Statewide Analysis At the outset of the study, it was presumed that the available underground storage capacity in
the State is a good indicator of the undeveloped statewide pumped storage potential at
groundwater banks (Antelope Valley Water Storage (AVWS), 2015). California’s total
groundwater banking capacity is estimated to be 22 MAF (Lund, Munevar, Taghavi, Hall, &
Saracino, 2014) and WSWB capacity is 2.3% (1/44th) to 4.5% (1/22nd) of this total26. The
statewide pumped storage potential extrapolated as a function of the storage capacity using the
initial pumped storage estimates (6 MW to 13 MW) for WSWB resulted in an order-of-magnitude
estimate of 70 MW to 140 MW of statewide storage benefits (assuming either energy storage
system is applicable at 50% of groundwater banks). This indicated that either pumped storage
concept has the potential to meet 1% to 2% of the State’s storage needs (assuming California
requires 6,000 MW of storage to meet the 50% renewable penetration goal by 203027 )
A key goal of the statewide analysis was to determine more precise estimates for the statewide
pumped storage potential at groundwater banks. The following key findings (discussed in
detail in the previous sections of this report) indicate that the estimated statewide pumped
storage potential (44 MW) at groundwater banks is at the low end of the initial estimates:
1. APH at the WSWB site is not feasible because of the high round-trip losses. The statewide
pumped storage potential of the well fields at groundwater banks can be considerably impacted
if a large number of groundwater banks have physical site parameters similar to that of WSWB.
Due to the variability in the site specific parameters and their effect on APH performance, the
study provides only qualitative estimates for the statewide technical and economic potential
associated with APH facilities. Although for a particular groundwater banking site, APH
potential may be higher or lower than at WSWB, template evaluation results indicate that across
the state, pumped storage and hydropower generation using the well field will likely be limited
26 Although the 2006 EIR for WSWB approved the total bank volume of 500,000 AF, later groundwater modeling results indicate that the bank can store up to 1 million AF of water with put and take capacities of 250,000 AFY. Using 1 million AF estimate for WSWB’s groundwater banking capacity provides conservative estimates for statewide pumped storage potential.
27 California is likely to require between 3,000 MW to 4,000 MW of fast acting energy storage by 2020 to integrate the projected increase in renewable energy. The California 2030 Low Carbon Grid study projects need of 2550 MW to be built between 2020 and 2030 to enable 50% reductions in grid GHG emissions below 2012 levels by 2030 (57% renewable penetration by 2030). The baseline case in this study assumes 33% renewable penetration (No change from 2020 levels of renewable penetration). Therefore, by 2030, California is likely to require roughly 6000 MW of storage to meet renewable integration goals. (California Energy Commission, 2015) (National Renewable Energy Laboratory (NREL), 2014).

61
to sites that currently use dual injection/extraction wells (ASR projects) and have high
transmissivities.
2. The statewide power generation potential at groundwater banks that use recycled water for
groundwater recharge is low since the injection method for recharge requires advanced water
treatment. Therefore, majority of the groundwater recharge reuse projects use surface
spreading instead of subsurface injection as the choice method of recharge. Therefore, these
projects typically do not have a well field that has power generation potential. These recycled
water projects also have negligible potential for PHPS since elevation differences from
treatment facilities to the recharge basins are unlikely to be significant.
3. Demand response potential of groundwater banking projects is significant and can reduce
peak hour demand associated with well pumps by 220 MW during dry years. Additional peak
demand reduction may result if groundwater banking projects (like WSWB) have a substantial
lift to the delivery conveyance. These estimates assume that most of the large groundwater
banking projects have the operational flexibility to shift the pumping demand and vary water
delivery amounts. Costs associated with additional surface storage capacity and wells are
included in the costs and benefits analysis of statewide demand response potential at
groundwater banks. PHPS and APH templates can be used to determine the total demand
response potential at a particular groundwater banking project.
Information gaps relating to the statewide peak power demand data for well pumps, typical
well densities at groundwater banking projects, elevation differences, and pipeline length must
be addressed to obtain more precise estimates of pumped storage and demand response
capabilities of groundwater banks.

62

63
CHAPTER 5: Economics Evaluation
As part of this project, Water & Energy Consulting (WEC) was retained to evaluate the value of
pumped storage at groundwater banks. Energy storage is recognized as being critical to
California’s energy future to accommodate intermittent renewable generation (California ISO,
2014)). Energy storage can provide two types of services: long duration services, for example
charging during periods of renewable overgeneration and generating during other periods, and
short duration services, such as ancillary services (Mathias, Doughty, & Kelly, 2016). This
project assesses both these attributes. The economics evaluation was submitted in two
technical memorandums (House L. W., 2017 a; House L. W., 2017 b) to the California Energy
Commission. This chapter contains excerpts from these memorandums and lays out the
characteristics of pertinent markets/services, and the economics of pumped storage at Willow
Springs Water Bank (WSWB) and at California groundwater banks.
5.1 Participation in ISO Markets The California Independent System Operator (California ISO) provides markets for various
services and access to the transmission grid. California ISO currently runs three primary
wholesale energy markets: day-ahead, real-time, and ancillary services (California ISO, n.d.).
5.1.1 Day-Ahead market
The day-ahead market is made up of three market processes that run sequentially. First, the ISO
runs a market power mitigation test. Bids that fail the test are revised to predetermined limits.
Then the integrated forward market establishes the generation needed to meet forecast
demand. And last, the residual unit commitment process designates additional power plants
that will be needed for the next day and must be ready to generate electricity. Market prices set
are based on bids. The day-ahead market opens for bids and schedules seven days before and
closes the day prior to the trade date. Results are published at 1 p.m.
5.1.2 Real-time market
The real-time market is a spot market in which load serving entities can buy power to meet the
last few increments of demand not covered in their day ahead schedules. It is also the market
that secures energy reserves, held ready and available for ISO use if required, and the energy
necessary to regulate transmission line stability. The market opens at 1 p.m. before the trading
day and closes 75 minutes before the start of the trading hour. The results are published about
45 minutes prior to the start of the trading hour. The Real-time market system dispatches
power plants every 15 and five minutes, although under certain grid conditions the California
ISO can dispatch for a single one-minute interval.

64
5.1.3 Ancillary service market
Ancillary services are energy products used to help maintain grid stability and reliability. These
services are functions performed by electrical generating, transmission, system-control, and
distribution system equipment and people to support the basic services of generating capacity,
energy supply, and power delivery. The Federal Energy Regulatory Commission (FERC 1995)
defined ancillary services as “those services necessary to support the transmission of electric
power from seller to purchaser given the obligations of control areas and transmitting utilities
within those control areas to maintain reliable operations of the interconnected transmission
system.” There are four types of ancillary services products currently procured: regulation up,
regulation down, spinning reserve and non-spinning reserve. Regulation energy is used to
control system frequency, which must be maintained very narrowly around 60 hertz, and varies
as generators change their energy output. Resources providing regulation are certified by the
ISO and must respond to automatic control signals to increase or decrease their operating
levels depending on the need. Spinning reserve is standby capacity from generation units
already connected or synchronized to the grid and that can deliver their energy in 10 minutes
when dispatched. Non-spinning reserve is capacity that can be synchronized to the grid and
ramped to a specified load within 10 minutes.
Generators participating in the ISO markets are limited to one megawatt or more. Their ability
to participate in the various markets is limited by their configuration (various ancillary service
markets have response/performance requirements) and their operation (many of the ancillary
services markets require direct ISO control of the generator).
5.1.4 Load Participation
Load can also participate in California ISO markets. California ISO rules allow load and
aggregation of loads capable of reducing their electric demand to participate as price
responsive demand in the ancillary services market and as curtailable demand in real-time
markets. Load can participate in some ISO markets via a proxy demand resource (PDR) or via a
reliability demand response resource (RDRR). PDR and RDRR only allow for load curtailment,
not load consumption or the export of energy to the grid.
PDR is a participation model for load curtail introduced in 2010 to increase demand response
participation in the ISO’s wholesale energy and ancillary services markets. PDR helps in
facilitating the participation of existing retail demand response into these markets: day-ahead,
real-time, spinning and nonspinning reserves like a generator resource, but it cannot ever inject
energy into the grid. PDR can only be dispatched in one direction – to reduce load.
RDRR increases demand response participation in the ISO markets by facilitating the
integration of existing emergency-triggered retail demand response programs and newly
configured demand response resources that have reliability triggers and desire to be dispatched
only under certain system conditions. RDRR may participate in the Day-Ahead and Real-time
markets like a generator resource, however may not submit Energy Self-Schedules, may not Self-
Provide Ancillary services, and may not submit Residual Unit Commitment (RUC) Availability or
Ancillary service bids.
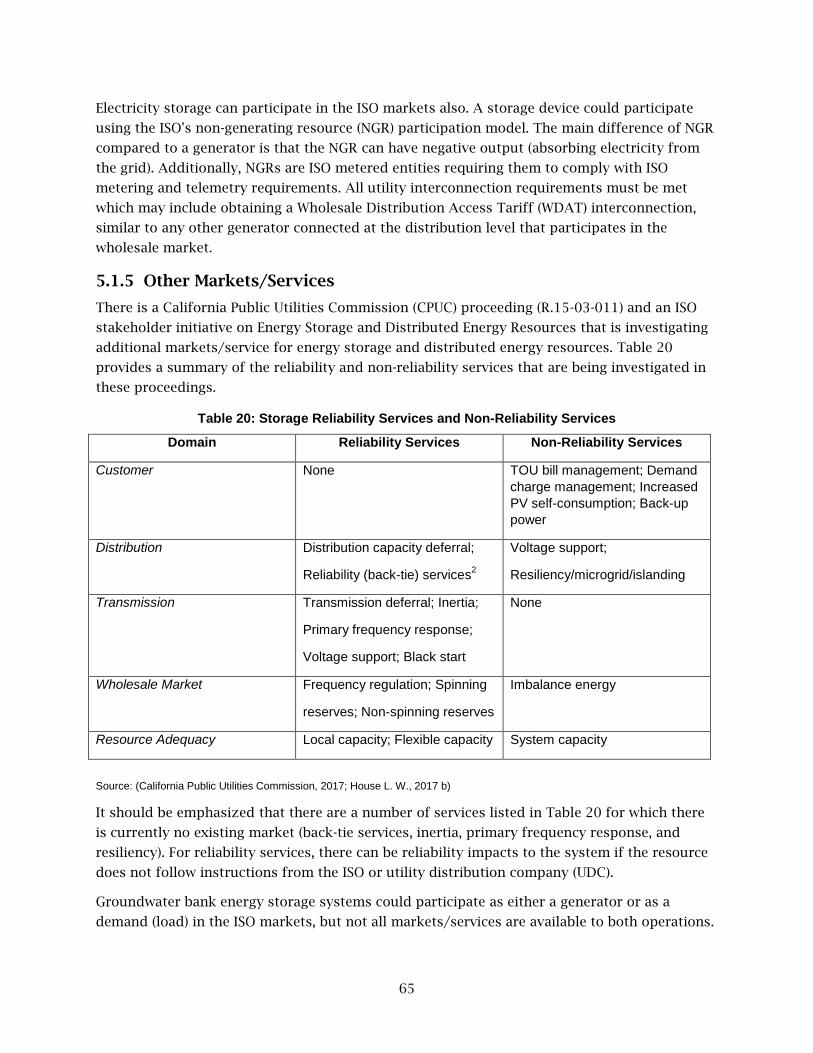
65
Electricity storage can participate in the ISO markets also. A storage device could participate
using the ISO's non-generating resource (NGR) participation model. The main difference of NGR
compared to a generator is that the NGR can have negative output (absorbing electricity from
the grid). Additionally, NGRs are ISO metered entities requiring them to comply with ISO
metering and telemetry requirements. All utility interconnection requirements must be met
which may include obtaining a Wholesale Distribution Access Tariff (WDAT) interconnection,
similar to any other generator connected at the distribution level that participates in the
wholesale market.
5.1.5 Other Markets/Services
There is a California Public Utilities Commission (CPUC) proceeding (R.15-03-011) and an ISO
stakeholder initiative on Energy Storage and Distributed Energy Resources that is investigating
additional markets/service for energy storage and distributed energy resources. Table 20
provides a summary of the reliability and non-reliability services that are being investigated in
these proceedings.
Table 20: Storage Reliability Services and Non-Reliability Services
Domain Reliability Services Non-Reliability Services
Customer None TOU bill management; Demand charge management; Increased PV self-consumption; Back-up power
Distribution Distribution capacity deferral;
Reliability (back-tie) services2
Voltage support;
Resiliency/microgrid/islanding
Transmission Transmission deferral; Inertia;
Primary frequency response;
Voltage support; Black start
None
Wholesale Market Frequency regulation; Spinning
reserves; Non-spinning reserves
Imbalance energy
Resource Adequacy Local capacity; Flexible capacity System capacity
Source: (California Public Utilities Commission, 2017; House L. W., 2017 b)
It should be emphasized that there are a number of services listed in Table 20 for which there
is currently no existing market (back-tie services, inertia, primary frequency response, and
resiliency). For reliability services, there can be reliability impacts to the system if the resource
does not follow instructions from the ISO or utility distribution company (UDC).
Groundwater bank energy storage systems could participate as either a generator or as a
demand (load) in the ISO markets, but not all markets/services are available to both operations.
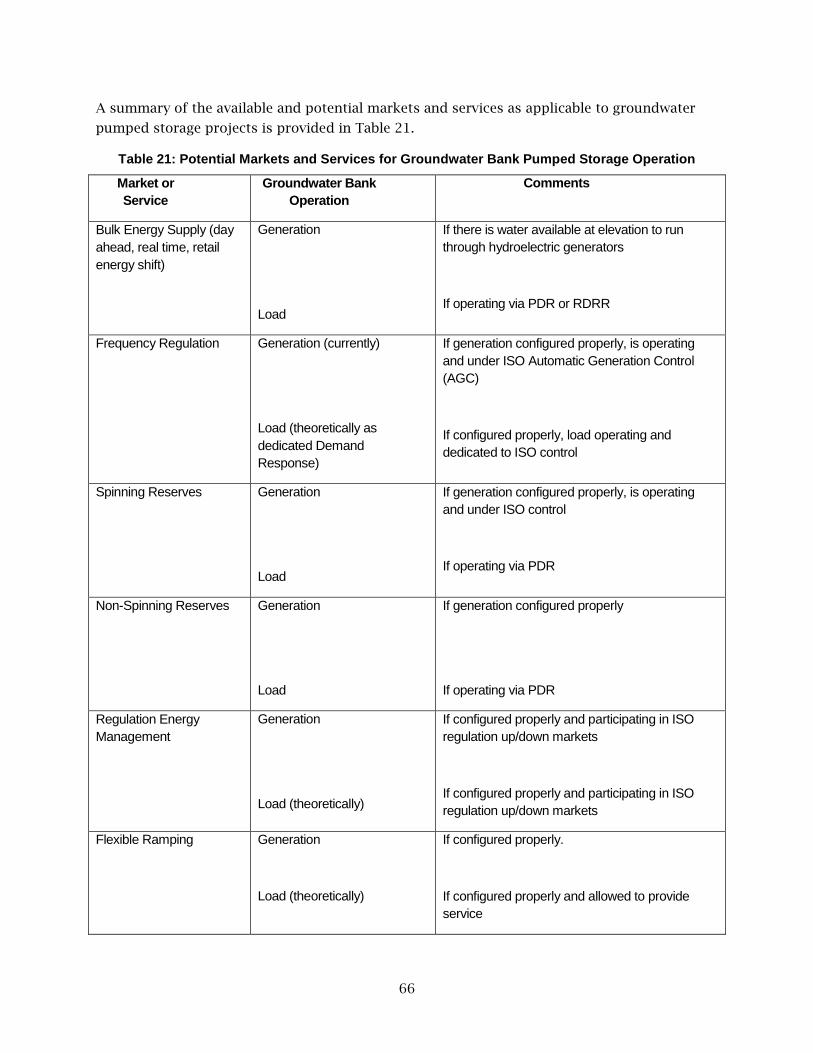
66
A summary of the available and potential markets and services as applicable to groundwater
pumped storage projects is provided in Table 21.
Table 21: Potential Markets and Services for Groundwater Bank Pumped Storage Operation
Market or Service
Groundwater Bank Operation
Comments
Bulk Energy Supply (day ahead, real time, retail energy shift)
Generation
Load
If there is water available at elevation to run through hydroelectric generators
If operating via PDR or RDRR
Frequency Regulation Generation (currently)
Load (theoretically as dedicated Demand Response)
If generation configured properly, is operating and under ISO Automatic Generation Control (AGC)
If configured properly, load operating and dedicated to ISO control
Spinning Reserves Generation
Load
If generation configured properly, is operating and under ISO control
If operating via PDR
Non-Spinning Reserves Generation
Load
If generation configured properly
If operating via PDR
Regulation Energy Management
Generation
Load (theoretically)
If configured properly and participating in ISO regulation up/down markets
If configured properly and participating in ISO regulation up/down markets
Flexible Ramping Generation
Load (theoretically)
If configured properly.
If configured properly and allowed to provide service

67
Market or Service
Groundwater Bank Operation
Comments
Investment Deferral Generation
Load
Generators or reduction in load that is capable of reliably and consistently reducing net loading on desired distribution infrastructure.
Reactive Power/Voltage Support
Generation
Load
If configured properly and operated under ISO control
Not applicable.
Resource Adequacy Generation
Load
If configured and operated properly and participates in ISO markets
Demand Response Generation
Load
Not applicable
Depends upon ability to curtail/shift load
Black Start Generation
Load
Only if there is water available at elevation to run through hydroelectric generators and configured for black start.
Not applicable.
Source: (House L. W., 2017 b)
A key point to remember is all these markets/services have specific performance requirements
which may not be compatible with groundwater banking operations. The primary purpose of
groundwater storage banks is to store water and the operation of a pumped storage project
cannot interfere with that water storage priority. A pumped storage addition must be carefully
configured to provide some of these services without compromising the water bank operation.
Water bank operator may be reluctant to turn operation of their facility over to the ISO to
participate in some ancillary markets.
For example, resource adequacy (RA) capacity is classified as system, local, or flexible. The rules
for system and local RA define the qualifying capacity (QC) of a storage resource to be the
maximum discharge rate the resource can sustain for four hours28. If a storage resource is
counted toward a load serving entity’s resource adequacy obligation, then it must participate in
the wholesale market and be subject to a must-offer obligation. A must-offer obligation
28 A storage resource that can store 4 MWh of energy would typically be able to sustain a 1 MW discharge rate for 4 hours and would therefore qualify to provide 1 MW of system or local RA capacity.
68
requires the resource to participate in the market during specific time periods and with specific
rules, it is a requirement to bid or schedule the capacity into the ISO’s Day-Ahead and Real-time
markets in accordance with specific ISO tariff provisions, and to be able to perform to fulfill its
ISO schedule or dispatch instructions. A groundwater pumped storage facility would have to
maintain sufficient water in elevated storage for four hours of operation at all times to qualify
for Resource Adequacy.
5.2 Economics Analysis Approach The economic feasibility of pumped storage at WSWB was determined and used as a baseline to
extrapolate the value of pumped storage to the groundwater banking sites around the state
where pumped storage appears to be technically feasible. The potential benefits and their
corresponding economic values have also been incorporated into the two pumped storage
templates which can be used to evaluate the economics of pumped storage at a particular
groundwater banking site.
5.3 Economic Feasibility at Willow Springs Water Bank Pumped storage can potentially occur in all hydrological year types. However, for simplicity of
economics analysis, it is assumed that to be compatible with groundwater banking operations,
pumped storage will occur only in the idle (or neutral) year type i.e., when no recharge or
extraction activities are taking place. In a wet year, the bank will be recharging the water year-
round and will operate in the hydropower generation mode. In a dry year it will be extracting or
pumping the water year-round and has the potential to provide demand response.
Additionally, while the technical analysis is based on the planning documents for WSWB (GEI
Consultants, Inc., 2016) which indicate an average pumping demand of 225 kW/well (300
hp/well), for economics analysis, 278 kW/well (about 375 hp/well) has been used which is a
conservative estimate and includes 20% for hydrogeologic uncertainty related to drawdown.
5.3.1 Operating Scenarios
Pumped storage will supplement the hydropower generation and demand response potential of
WSWB and will use the bank’s facilities even in the absence of recharge and recovery activities.
The benefits to the grid were assessed based on the operating scenarios which will determine
whether the bank operates as a hydroelectric generator, a pumped storage facility or as a load.
• Recharge Year (wet): A recharge year involves up to 385 cubic feet per second (cfs) of
recharge. That enables a total recharge of 280,000 acre-feet per year to the water bank.
250 cfs will be used to generate electricity 24 hours a day and 135 cfs will bypass the
turbine. The estimated occurrence rate is one year in three based on historical record
(32%).
• Idle (Neutral) Year: An idle year does not have any predetermined recharge or extraction
activity. For PHPS, 250 cfs of water will be used to generate electricity for the five hours
daily from the upper reservoir. The water will be replaced over the other 19 hours. For
APH operation, each APH unit will use a flow rate of 4.5 cfs to generate energy for five

69
hours daily from the surface reservoir. The water will be replaced over the other hours.
The estimated occurrence rate is one year in three based on the historical record (33%).
• Extraction Year (dry): Withdrawals of water from the water bank will occur in a dry year. 250
cfs will be pumped back to the California Aqueduct and 60 cfs will be delivered to the
Antelope Valley-East Kern Water Agency potable system for exchange or to the
Aqueduct. The total extraction requirement is 310 cfs. The estimated occurrence rate is
one year in three based on historical record (35%).
These operating scenarios are illustrated in Figure 16 which shows WSWB being operated to
provide hydropower generation (in wet year), pumped storage (in idle year), and demand
response (five hours daily curtailment on summer weekdays in dry year).
Figure 16: Operating Configurations for WSWB by Year Type
In a neutral year, the Peak Hour Pumped Storage (PHPS) and Aquifer Pumped Hydro (APH) facilities can be operated to provide energy storage benefits. While the PHPS facilities can also be used in a wet year for hydropower generation, APH facilities have only been evaluated for neutral year operation because using the well field for year-round generation in a wet year was found to be economically infeasible.

70
5.3.2 StorageVET™ Model
Water & Energy Consulting (WEC) used the Storage Value Estimation Tool (StorageVET™) to
evaluate the value of the two pumped storage technologies at WSWB (House L. W., 2017 a).
StorageVET™ is publicly available via the EPRI website (http://www.storagevet.com/) and allows
consistent estimation of benefits and costs of various energy storage projects. Since the
pumped storage function in this tool is not ready yet, the PHPS and APH technologies were
modeled as a battery using the specific parameters described in the following sections. The
pumped storage dispatch was simulated based upon charge ratio after ensuring that there was
enough of a cost spread between on and off peak prices (off peak price/charge ratio < on peak
costs). StorageVET™ does not allow a non-tax paying entity to own the storage (it allows only
utility or an independent power producer (IPP) ownership) and won't produce results without
depreciation, investment tax credit, and other parameters that do not apply to WSWB.
Consequently, all the financial results produced by the model were ignored and only
operational results were used.
5.3.3 Aquifer Pumped Hydro (APH) Economics
Aquifer Pumped Hydro at WSWB will require the addition of reversible pump turbines to
existing recovery wells. Assuming the other components (such as surface reservoir) are part of
the WSWB project, the only additional capital cost will result from the addition of the electrical
and mechanical Package ($0.30 million/well).
Neutral year operation of APH was assessed as an energy storage project in StorageVet (Table
22), using 2015 SCE DLAP (Default Load Aggregation Point) prices. (DLAP reflects the costs SCE
avoids in procuring power during the time period.) The operation was evaluated in the Bulk
Energy Market (Day-Ahead Energy Market) generating when electricity prices were high, and
pumping water from the ground when prices were low. It was not evaluated in either the
Flexible Ramping or the Demand Response markets because participation in both these markets
necessitates that the surface reservoir be full. As discussed in Chapter 2, the round-trip
efficiency of APH at WSWB is so low (22%) that it was impractical to keep the surface reservoir
full. This operational characteristic prevents the project from providing these additional
services.

71
Table 22: StorageVET™ Technology Parameters Used for WSWB APH Simulation
Parameter Value
Pumping Capacity [kW] a 17,236 kW
Generating Capacity [kW] 3,700 kW
Energy Storage Capacity [kWh] 18,500 kWh (3.7 MW*5 hours)
Upper Limit, Operational State of Charge [%] 100
Lower Limit, Operational State of Charge [%] 0
Pumping (Charge) Efficiency [%] 0.416
Generating (Discharge) Efficiency [%] 0.518
Max Discharge Ramp [kW / min] 1,000
Annual O&M b 0
Capital Cost c $18.6 M
a Assuming power required for pump mode is 278 kW/well (Table 5).
b Assuming operating cost is covered by existing water bank operations.
c For 62 wells, the capital cost would be $18.6M to implement 3.7 MW of hydropower generation ($5,100/KW) (Table 8).
Source: (House L. W., 2017 a)
Even in the day-ahead energy market the project has limited potential for participation with the
result that the APH operation virtually never runs – the round-trip efficiency is so low there is
rarely enough of a daily price spread to economically pump and generate. Therefore, the net
present value is a large negative number (Table 23).
Table 23: Economics of APH Operation at WSWB
Value
Benefit MARKET: Day Ahead Energy $4,044 per year
Cost Debt Service -$1,599,072 per year
O&M 0
Net Present Value (20 year, 6% discount rate) -$18,294,846
StorageVet Simulation for APH at WSWB using 2015 SCE DLAP prices
Source: (House L. W., 2017 a)
During wet years the water bank is doing recharge around the clock. However, the well field
cannot operate as a constant year-round generator during a wet year. Some of the recharge
water (State Water Project (SWP) water) could potentially be injected into the ground; however,

72
because the recharge would be by injection instead of percolation using spreading grounds, the
project would require meeting additional the Regional Water Quality Control Board (RWQCB)
water quality criteria. This requirement would increase the capital cost of the project and make
it infeasible.
5.3.4 Peak Hour Pumped Storage (PHPS) Economics
PHPS at WSWB will require the addition of an upper reservoir and two 3.4 MW five-jet Pelton
Wheel turbines.
5.3.4.1 Neutral Year (33% probability) – Pumped Storage Mode
Neutral year operation of PHPS was assessed as a pumped storage project in StorageVet (Table
24) generating when electricity prices were high, and recharging water into the ground when
prices were low (5.2 MW generation, 10.1 MW demand for pump station use).
Table 24: StorageVET™ Technology Parameters Used for WSWB PHPS Simulation
Parameter Value
Pumping Capacity [kW] 10,124 kW
Generating Capacity [kW] 5,223 kW
Energy Storage Capacity [kWh] 26,000 kWh (5.2 MW*5 hours)
Upper Limit, Operational State of Charge [%] 100
Lower Limit, Operational State of Charge [%] 0
Pumping (Charge) Efficiency [%] 0.834
Generating (Discharge) Efficiency [%] 0.874
Max Discharge Ramp [kW / min] 1,000
Annual O&M $100,000
Capital Cost $7.9 M
Source: (House L. W., 2017 a)
The operation was evaluated using 2015 SCE DLAP (default load aggregation point) prices and
in the day ahead energy market. Since PHPS can provide generation during the morning and
evening ramp periods, and increased demand (load) during the afternoon periods to refill
storage reservoirs, it was evaluated for flexible ramping and demand response markets along
with day ahead market (Table 25)29.
29 Unlike APH, PHPS can be assessed in Flexible Ramping and Demand Response markets because the slow response time is not an issue with PHPS. Because the APH set-up uses the same pump/generator, when the mode is switched from pumping to generation (or vice versa), the pump has to stop, the water column in that well has to stabilize and then reverse direction, and the generator has to start (or vice versa). This has to happen with 62 different wells to get the full benefit. For PHPS, the pump stops and the generator can start instantly (or vice versa) since they are different

73
Table 25: WSWB PHPS Operation (Neutral Year – 33% Probability)
Market Annual Value
Day Ahead Market (Energy) $94,852
Flexible Ramping $384,637
Demand Response $384,637
Total $791,079
StorageVet Simulation for PHPS neutral year at WSWB using 2015 SCE DLAP prices. Numbers are not rounded to reflect model results.
Source: (House L. W., 2017 a)
5.3.4.2 Wet Year (32% probability) – Hydropower Generation Mode
During wet years, the water bank is storing water and will recharge water into the bank’s
percolation ponds for storage at a constant flow of 250 cfs. Therefore, the bank can use PHPS
facilities (the two 3.4 MW Pelton Wheel turbines) to operate as a year-round hydroelectric
generator during a wet year. For this scenario, the project was evaluated as a 5.2 MW
hydroelectric generator operating 24 hours a day. 2015 SCE DLAP hourly prices were used in
the evaluation. Table 26 shows the annual benefit of WSWB operating as a hydroelectric
generator during wet years. There is additional flexibility possible with this technology. The
bank could use the upper reservoir component of PHPS to curtail generation for five hours per
day during the afternoon period when there is a surplus of renewable generation.
Table 26: WSWB Hydroelectric Generator Mode (Wet Year – 32% Probability)
Market Annual Value a
Day Ahead Energy $1,386,330
a 5.2 MW operating 24/7, priced at 2015 SCE DLAP prices, assuming no curtailment or load following.
Source: (House L. W., 2017 a)
5.3.4.3 Aggregate Summary for PHPS and Hydropower Generation at WSWB
PHPS at WSWB was evaluated for neutral year (Table 25). In the pumped storage configuration,
depending on the time of day, the bank will serve as a load or a generator. PHPS facilities can
also be used to generate electricity year-round during a wet year (Table 26) and, in this
scenario, the bank will function as a hydropower generator. Table 27 provides a probability
weighted summary of the cost effectiveness of integrating PHPS and hydropower generation to
the existing WSWB configuration. The cost of the necessary enhancements to the existing WSWB
Units and using different water columns and there are a few pumps and just a couple of generators. Additionally, the flow of water in the aquifer has to stop, stabilize, and then reverse when the operation is switched from pumping to generating or vice versa. The low transmissivity of the aquifer results in a longer aquifer response i.e. the aquifer takes longer to move from drawdown during pumping back to equilibrium, and from mounding during injection back to equilibrium. Also, in PHPS, surface storage is used for both upper and lower reservoirs and the reservoir (pond) can instantly switch from rising to dropping (or vice versa) since the water is "pushing" against air rather than interstitial spaces in the aquifer.

74
to develop a PHPS project is estimated at $7.9 million. The NPV (net present value) of the
probability weighted operation of this facility is a negative $0.99 million for a 20-year
investment horizon30.
Table 27: Cost effectiveness of PHPS and Hydropower Generation at WSWB
Year Type Probability Operated As Annual Value
Wet 32% Generator $1,386,330
Neutral 33% Pumped Storage a $791,079
Probability Weighted Annual Benefit $704,682
Annual O&M -$100,000
Annual Debt Service ($7.9M at 6% for 20 years) -$691,243
Annual Net Benefit -$86,561
NPV of PHPS and Hydropower Generation -$992,853
a Cost-Effectiveness evaluation based on standard protocol (DNV-GL Energy and Sustainability, 2013).
Source: (House L. W., 2017 a)
5.3.5 Dry Year (35% probability) – Demand Response
Demand response (DR) is the ability to reduce or vary electricity use when required. This is
possible at WSWB in an extraction or dry year and will reduce load during the late afternoon
ramping period and evening peak. In a dry year WSWB will extract water and pump it to the
California Aqueduct. This year was evaluated for demand response (curtailing electricity use in
response to system needs). The electricity demand is continuous from groundwater pumping
(17.2 MW) plus power for the pump station (10.1 MW). Therefore, the project was evaluated as a
27.3 MW continuous year-round load operating 24 hours a day, with the ability to be curtailed
up to 5 hours per day for up to 320 hours per year.
Pumps at the pumping plant could be shut off for five hours a day during years that water is
being pumped back to the California Aqueduct. The demand response potential of the pumping
plant corresponds to the size of the pumps, or 10.1 MW. It can be realized by shutting down the
pumping to the Aqueduct for five hours a day. In addition, the 62 extraction wells (17.2 MW)
could be curtailed for those five hours also. To provide for this level of demand response two
additional extraction wells would need to be added to make up for the 320 hours annual
pumping curtailment.31
30 Assuming no escalation in annual benefits, a 20-year horizon, and a 6% discount rate.
31 Additional curtailment would require the addition of additional extraction wells.
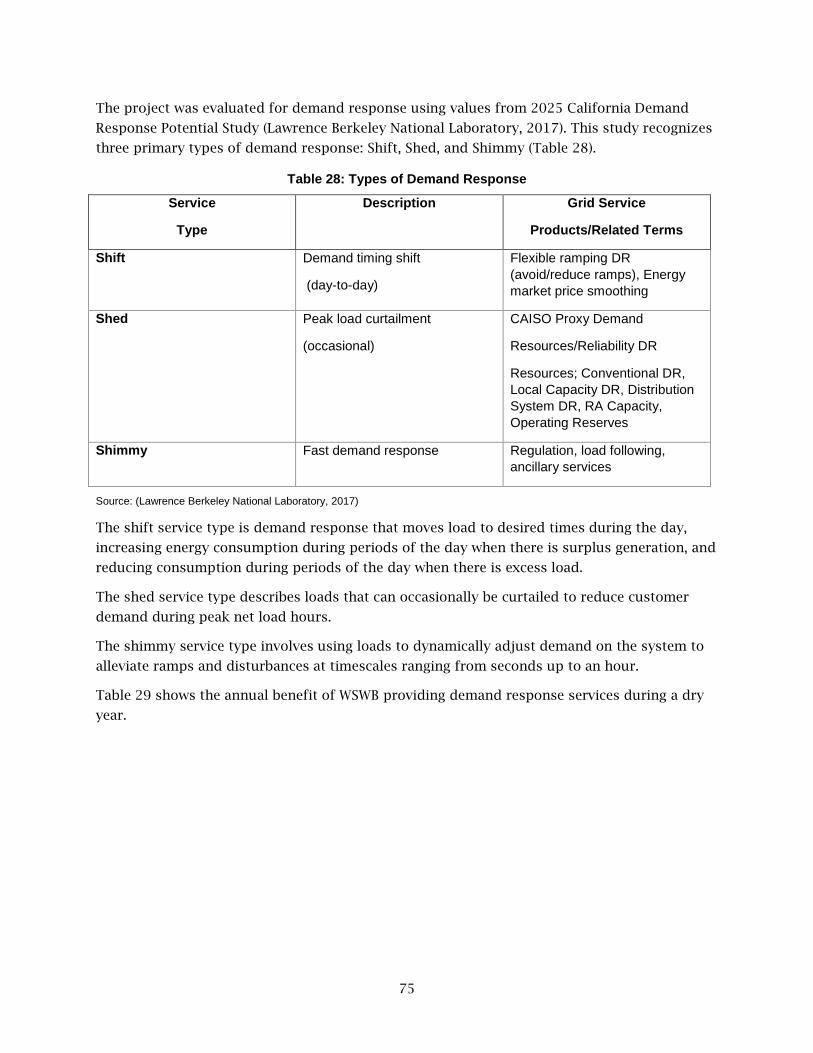
75
The project was evaluated for demand response using values from 2025 California Demand
Response Potential Study (Lawrence Berkeley National Laboratory, 2017). This study recognizes
three primary types of demand response: Shift, Shed, and Shimmy (Table 28).
Table 28: Types of Demand Response
Service
Type
Description Grid Service
Products/Related Terms
Shift Demand timing shift
(day-to-day)
Flexible ramping DR (avoid/reduce ramps), Energy market price smoothing
Shed Peak load curtailment
(occasional)
CAISO Proxy Demand
Resources/Reliability DR
Resources; Conventional DR, Local Capacity DR, Distribution System DR, RA Capacity, Operating Reserves
Shimmy Fast demand response Regulation, load following, ancillary services
Source: (Lawrence Berkeley National Laboratory, 2017)
The shift service type is demand response that moves load to desired times during the day,
increasing energy consumption during periods of the day when there is surplus generation, and
reducing consumption during periods of the day when there is excess load.
The shed service type describes loads that can occasionally be curtailed to reduce customer
demand during peak net load hours.
The shimmy service type involves using loads to dynamically adjust demand on the system to
alleviate ramps and disturbances at timescales ranging from seconds up to an hour.
Table 29 shows the annual benefit of WSWB providing demand response services during a dry
year.

76
Table 29: WSWB Operated as a Continuous Load (Dry Year – 35% Probability)
Demand Response
Service
Market Value (low)
Market Value (high)
Unit WSWB Annual Value
(low)
WSWB Annual Value
(high)
Shed $4 $4 $/kW-year $109,200 $109,200
Shift $20 $52 $/MWh $174,720 $454,272
Shimmy – load following
$35 $45 $/kW-year $955,500 $1,228,500
Shimmy – regulation
$57 $98 $/kW-year $1,556,100 $2,675,400
Total $2,795,520 $4,467,372
WSWB dry year demand response simulation assumes availability of up to 5 hours of daily curtailment; 27.3 MW curtailable up to 320 hours per year.
Source: (House L. W., 2017 a)
5.3.5.1 Adding Dry Year Demand Response to APH and PHPS
To complete operations analysis for all three year types, dry year demand response was added
to APH and PHPS (Table 30). Adding dry year demand response to neutral year PHPS and wet
year hydropower generation modes increases their NPV to almost $8 million, but is still not
enough to make APH cost effective. A summary of the operational modes for APH and PHPS
facilities and their corresponding services is provided in Table 30.
Table 30: Comparison of WSWB APH and PHPS Characteristics and Analysis
WSWB Aquifer Pumped Hydro (APH)
WSWB Peak Hour Pumped Storage (PHPS)
Demand Response
Components needed Reversible pump-turbines, surface storage reservoir, aquifer is lower reservoir
Hydroelectric generator, upper and lower surface reservoirs
2 additional groundwater wells for 320 hours curtailment
Pumping Capacity 17.2 MW 10.1 MW 27.3 MW
Generating Capacity 3.7 MW 5.2 MW
Energy Storage
(5 hours of generation)
18.5 MWH 26.0 MWH Curtailable up to 320 hours per year
Pumping Efficiency 41.5% 83.4%
Generating Efficiency 51.7% 87.4%
Round Trip Efficiency 21.6% 72.9%

77
WSWB Aquifer Pumped Hydro (APH)
WSWB Peak Hour Pumped Storage (PHPS)
Demand Response
Capital Cost $18.6M $7.9M $2.1M
Net Present Value (@6%, 20 years)
-$18.2M (generator operating in neutral
years)
-$0.9M (generator operating during wet and neutral year)
$9.1M (dry year)
Capital Cost with Dry Year Demand Response
$20.3M $10M
Net Present Value (@6%, 20 years) with dry year demand response
-$9.1M $8.1M
Markets/Services:
Day Ahead Hourly Market Yes Yes
Flexible Ramping No, response time too slow, operational parameters preclude this.
Yes
Demand Response Yes Yes
Real Time Energy Time Shift
No No
Retail Energy Time Shift No, lack of load on site No, lack of load on site
Frequency Regulation No, not configured for, wish to maintain local control of operations
No, not configured for, wish to maintain local control of operations
Spinning Reserve No, not configured for, wish to maintain local control of operations
No, not configured for, wish to maintain local control of operations
Non-Spinning Reserve No, not configured for, wish to maintain local control of operations
No, not configured for, wish to maintain local control of operations
Regulation Energy Management (REM)
No, not configured for, wish to maintain local control of operations
No, not configured for, wish to maintain local control of operations
Investment Deferral No. Area of WSWB is an unconstrained SCE area
No. Area of WSWB is an unconstrained SCE area
Reactive Power/Voltage Support
No, not configured for, wish to maintain local control of operations
No, not configured for, wish to maintain local control of operations
Resource Adequacy No, expected No, expected operations

78
WSWB Aquifer Pumped Hydro (APH)
WSWB Peak Hour Pumped Storage (PHPS)
Demand Response
Capacity (RA) operations preclude preclude
Black Start No, not configured for No, not configured for
Source: (Water & Energy Consulting, 2017a)
There are a multitude of ancillary services that could be possible using the PHPS and APH
facilities – if they were configured properly and if the water bank was willing to turn over
operational control of the facilities to the Independent System Operation (Frequency
Regulation, Spinning Reserve, Non-Spinning Reserve, Regulation Energy Management [REM],
Reactive Power/Voltage Support, and Black Start require the generation facilities to be under
ISO control). WSWB’s primary purpose is as a water storage facility and the bank is therefore
reluctant to invest in the additional facilities necessary to perform these services or turn over
operation of the water bank to the ISO to participate in many of these markets. Therefore, the
ancillary services options for WSWB were limited.
5.4 Economic Evaluation for Statewide Pumped Storage at Groundwater Banks Pumped storage additions to existing groundwater banking facilities have the potential to
provide electrical grid benefits from 1) generation of electricity during period of high system
demand; 2) increase in pumping demand (load) during renewable overgeneration periods to
reduce the risk of overgeneration; 3) reduction of load during high system ramping
requirements and system demand; and 4) delivery of a plethora of ancillary services, depending
upon the configuration of the groundwater bank and its ability to cede operational control to
the ISO. Assuming that WSWB operations are typical of most groundwater banking projects, the
operating configurations and their associated costs and values identified for WSWB can be used
to evaluate economic feasibility of pumped storage, hydropower generation, and demand
response benefits at groundwater banks in California.
5.4.1 Potential Markets and Services
As discussed in the preceding sections, a groundwater bank’s facilities (including additional
pumped storage facilities) can be configured to operate in different modes to participate in
markets applicable to pumped storage, hydropower generation and demand response. A
summary of the characteristics of these markets/services is provided in Table 31.
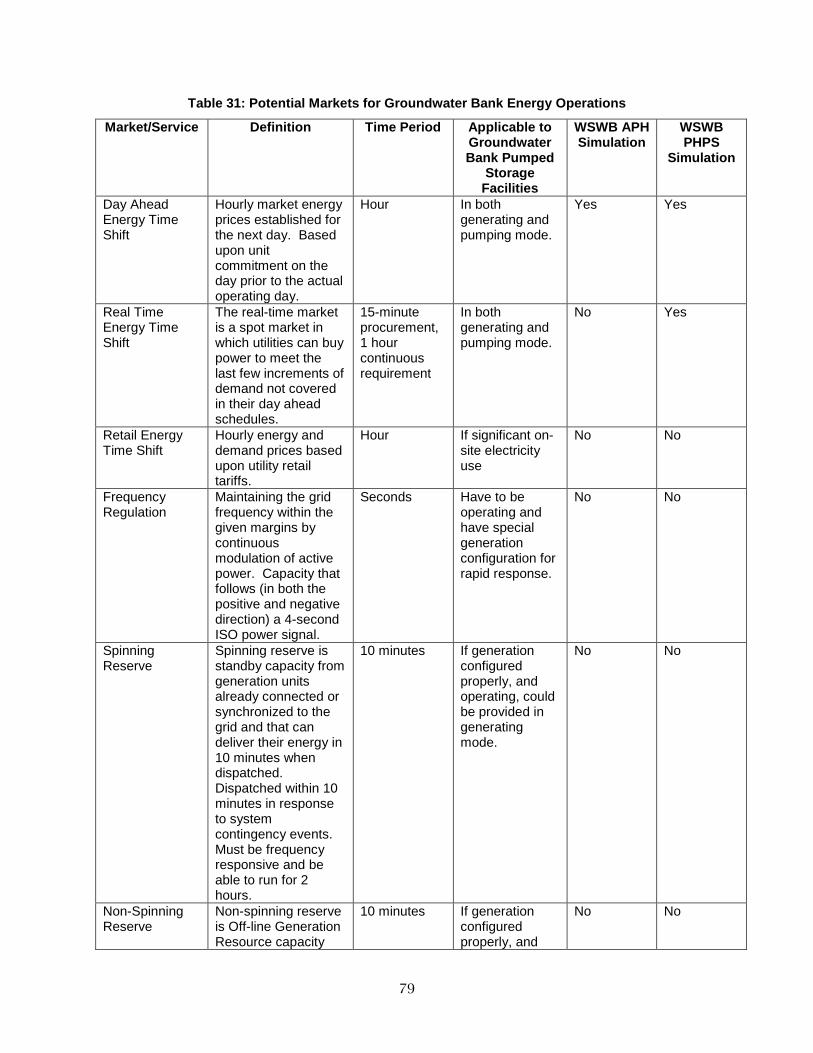
79
Table 31: Potential Markets for Groundwater Bank Energy Operations
Market/Service Definition Time Period Applicable to Groundwater Bank Pumped
Storage Facilities
WSWB APH Simulation
WSWB PHPS
Simulation
Day Ahead Energy Time Shift
Hourly market energy prices established for the next day. Based upon unit commitment on the day prior to the actual operating day.
Hour In both generating and pumping mode.
Yes Yes
Real Time Energy Time Shift
The real-time market is a spot market in which utilities can buy power to meet the last few increments of demand not covered in their day ahead schedules.
15-minute procurement, 1 hour continuous requirement
In both generating and pumping mode.
No Yes
Retail Energy Time Shift
Hourly energy and demand prices based upon utility retail tariffs.
Hour If significant on-site electricity use
No No
Frequency Regulation
Maintaining the grid frequency within the given margins by continuous modulation of active power. Capacity that follows (in both the positive and negative direction) a 4-second ISO power signal.
Seconds Have to be operating and have special generation configuration for rapid response.
No No
Spinning Reserve
Spinning reserve is standby capacity from generation units already connected or synchronized to the grid and that can deliver their energy in 10 minutes when dispatched. Dispatched within 10 minutes in response to system contingency events. Must be frequency responsive and be able to run for 2 hours.
10 minutes If generation configured properly, and operating, could be provided in generating mode.
No No
Non-Spinning Reserve
Non-spinning reserve is Off-line Generation Resource capacity
10 minutes If generation configured properly, and
No No

80
Market/Service Definition Time Period Applicable to Groundwater Bank Pumped
Storage Facilities
WSWB APH Simulation
WSWB PHPS
Simulation
that can be synchronized to the grid and ramped to a specified load within 10 minutes and run for at least 2 hours.
operating, could be provided in generating mode
Regulation Energy Management (REM)
Regulation energy is used to control system frequency, which must be maintained very narrowly around 60 hertz. Composed of regulation up (increased generation) and regulation down (decreased generation). Capacity that follows (in both the positive and negative direction) a 4-second ISO power signal. It requires 1 -hour of continuous response. Capacity is limited by the resource's 5-minute ramp.
5-10 minute, must be available for 60 minutes
Have to be operating and include equipment necessary to follow regulation signal.
No No
Flexible Ramping
The ability to change generation (ramp) in response to system needs. Requires participation in market with bids and 3-hour continuance response capability.
5 minutes Depends upon pump and generator characteristics
No, response time too slow
Yes
Investment Deferral
The ability to defer additional investment in distribution system, substations, or transmission lines. Resource capable of reliably and consistently reducing net loading on desired infrastructure.
Year Depends upon location of groundwater bank
No. Area of WSWB is an unconstrained SCE area
No. Area of WSWB is an unconstrained SCE area
Reactive Power/Voltage Support
The injection or absorption of reactive power to maintain transmission system
Seconds If generation configured properly
No No

81
Market/Service Definition Time Period Applicable to Groundwater Bank Pumped
Storage Facilities
WSWB APH Simulation
WSWB PHPS
Simulation
voltages within required ranges. Resource capable of dynamically correcting excursions outside voltage limits as well as supporting conservation voltage reduction strategies in coordination with utility voltage/reactive power control systems.
Resource Adequacy Capacity (RA)
Assurance that there is adequate physical capacity in existence to serve likely peak load and the ability of the ISO to call on it to perform when needed for system reliability. Must provide net qualifying capacity (NQC) for 4 hours over 3 consecutive days up to a total of 24 hours per month. The resource must bid into the ISO day-ahead and real-time markets.
Hour For flexible capacity, and be 2 hours charging and 2 hours discharging.
No No
Demand Response
Demand response is a change in the power consumption of an electric utility customer in response to utility system needs (typically a reduction in customer demand)
Hour In both generating and pumping mode.
Yes, if additional extraction wells added.
Yes, if additional extraction wells added.
Black Start Generation able to start itself without support from the grid and with sufficient real and reactive capability and control to be useful in system restoration.
Minutes If water stored at elevation, and generation configured appropriately.
No No
Source: (House L. W., 2017 b)

82
5.4.2 Statewide Potential from Adding Pumped Storage to Groundwater Banks
Technical feasibility analysis detailed in Chapter 4 indicates that the statewide PHPS potential is
44 MW and statewide demand response potential associated with existing well pumps at
groundwater banks is 220 MW.
Groundwater storage projects can have a variety of configurations, depending upon sources of
water, the configuration of the underground storage basin, method of getting water
underground (either passive via recharge basins that let the water percolate into the ground or,
less frequently, active injection of water into the ground). While all groundwater banks may not
have enough topographical variation to support hydroelectric generation, they all have one
thing in common, an electricity demand when they are extracting the water from underground
for delivery to customers. And, depending upon their delivery requirements, they may have the
ability to vary that pumping load to accommodate electrical system demands.
Table 32 provides an estimate of the statewide potential for pumped storage, hydropower
generation using PHPS facilities, and demand response at groundwater banks. The annual net
benefit, and the expected capital cost was extrapolated from WSWB specific analysis.
Demand response (DR) is a very cost effective investment with an annual statewide benefit of
$6.3 M. Aquifer Pumped Hydro (APH) never pays for itself, due to high capital cost, low round
trip efficiencies, and limited operating flexibilities. PHPS is cost effective, if operated with dry
year demand response. Assuming statewide PHPS projects have similar characteristics as the
WSWB PHPS facility, the 44 MW PHPS statewide potential (providing pumped storage in neutral
years and hydropower generation in wet years) would have an annual net benefit of $5.9 million
if evaluated with onsite dry year demand response (House L. W., 2017 b).
Therefore groundwater banks can make a valuable contribution to demand response and
energy storage, but have unique operating characteristics that the current DR and energy
storage programs do not either recognize or allow.
• Current DR programs only allow shedding of load. They do not recognize or pay for shift –
flexible ramping, or shimmy – load following or regulation. Current storage programs
focus on shifting load and generation. DR programs need to be adjusted to recognize
and pay for shift – flexible ramping and shimmy – load following and regulation. CPUC
proceeding A1701012 (demand response) and R.15.03.011 (energy storage) and ISO
shareholder initiative, energy storage and distributed energy resources phase 2, are the
regulatory proceedings that are addressing changes in the demand response programs
and energy storage programs.
• Participation in both the programs requires consistent operation year after year.
Operational configuration of groundwater banks varies based upon the hydrologic year
type. The water banks typically base their operating mode on the April DWR snow
survey. Current DR and energy storage programs therefore need to be modified to allow
annual changes in operational characteristics.

83
Table 32: Statewide Potential, Benefits, and Costs of Pumped Storage at Groundwater Banks
Type MW potential
Annual Net Benefit
Facilities Needed
Capital Cost NPV per kW1
Peak Hour Pumped Storage (PHPS) Facilities – generation, pumped storage
44 MW $-44K2 Upper and lower surface storage reservoirs, connecting piping, hydroelectric generators and controls, utility interconnection
$66.8M ($1,518/kW)3
-$190/kW
Aquifer Pumped Hydro (APH) Facilities –pumped storage
Impractical -$431/kW Surface storage reservoir, reversible pump turbines and controls, connecting piping, utility interconnection
($5,000/kW)4 -$4,945/kW
Flexible Load (Demand Response)
220 MW $6.3M ($28.64/kW)5
Surface storage reservoirs, existing and additional extraction wells
$18M ($82/kW)6
$332/kW
1Assuming a 20-year life and a 6% interest rate. Based upon generating capacity for pumped storage and hydropower generation, and curtailed capacity for demand response. 2The probability weighted annual net benefit for WSWB PHPS facility generation was -$17/kW. 3The capital cost of WSWB PHPS facilities was $1,518/kW 4The capital cost of WSWB APH was $5,000/kW. 5The annual net benefit for demand response for WSWB was $29/kW. 6The capital cost of adding a 5 hours’ surface storage reservoir (to provide 320 hours/year curtailment) and additional extraction wells was $82/kW (cost for extra wells was $78.1/KW and cost for reservoir was $3.9/kW for a total of $82/kW).
Source: (House L. W., 2017 b)
It must be noted that APH economic analysis is constrained by only general qualitative
conclusions could be drawn about statewide APH potential. Additionally, while WSWB
operations are typical of a groundwater banking project, variability in site specific parameters
such as transmissivity can substantially affect the generation potential, round-trip efficiency,
and hence economic feasibility of a particular APH facility. Therefore, this analysis only
provides a preliminary, conceptual estimate of the economic feasibility of statewide APH
potential and is likely an underestimate. A more advanced estimate would require pilot testing
and addressing of information gaps. Using WSWB analysis as the basis for drawing conclusions

84
about statewide potential provides insights about the comparative performance of each
technology in various hydrological year types and about the parameters that affect their
implementation. The key takeaway is that groundwater banking projects, in general, are likely
to find a PHPS facility coupled with demand response more economically viable than an APH
one with or without demand response.

85
CHAPTER 6: Project Benefits
Pumped storage at groundwater banks will provide benefits to the electrical grid. Facilities used
for pumped storage can also be used for hydropower generation and demand response. This
section discusses the benefits associated with each of these operating configurations.
6.1 Addressing the Duck Curve Problem The pumped storage facilities at groundwater banks could assist in addressing “duck curve”
operation issues in all hydrologic year types. California is experiencing an abundance of
renewable generation, and this is causing system operating issues. As illustrated in Figure 17,
there is significant solar generation occurring during the afternoon hours.
Figure 17: Renewable Energy Generation, April 27, 2017
California ISO data for April 27, 2017
Source: (House L. W., 2017 b)

86
This overabundance of solar generation during afternoon hours has resulting in the operating
phenomenon known as the “duck curve”, so named by California ISO staff due to its
resemblance to the bird profile (Figure 18).
The ISO “duck curve” is the net generation load – generation requirements after renewable
generation has been subtracted out. Figure 18 illustrates the operational issues facing
California: specifically, an overabundance of renewable generation during the afternoon hours,
a very steep ramping requirement during the late afternoon, and a peak generation requirement
during the evening. The “duck curve” is forecasted to only worsen as California installs more
renewable generation.
Figure 18: California ISO “Duck Curve”
Source: (California ISO; National Renewable Energy Laboratory; First Solar)
A number of methods have been proposed for coping with an increasing “duck curve”,
including:
• Exploiting regional diversity in generation resources and demand
• Installing more dispatchable generation
• Adding more energy storage
• Increased demand management:
ο Time-of-use pricing (TOU) and real-time pricing
ο Increased demand response
ο Smart grid technology

87
Onsite pumped storage facilities at WSWB illustrate how these facilities can be employed in
various configurations and hydrologic years to mitigate the duck curve problem. WSWB is an
example of a typical groundwater banking operation and the benefits can be duplicated at other
groundwater banks that have pumped storage potential.
6.1.1 Wet Hydrologic Year
During a wet hydrologic year, the WSWB can operate as a hydroelectric generator. As illustrated
in Figure 19, the Bank’s operations can be configured to curtail generation for five hours per
day, ideally during the afternoon renewable generation overproduction period. This would
assist with the “belly” of the “duck curve”, the period of renewable energy overgeneration.
Figure 19: WSWB PHPS Hypothetical Operation During Wet Year
Figure 19 shows WSWB PHPS facility operating as generator
Source: (House L. W., 2017 b)
6.1.2 Neutral Hydrologic Year
During a neutral hydrologic year, the WSWB can operate as a pumped storage facility. Figure 20
shows the PHPS operation, from the StorageVet simulation based upon Day Ahead market
prices. PHPS provides generation during the morning and evening ramp periods, and increased
demand (load) during the afternoon renewable overproduction periods to refill storage
reservoirs.
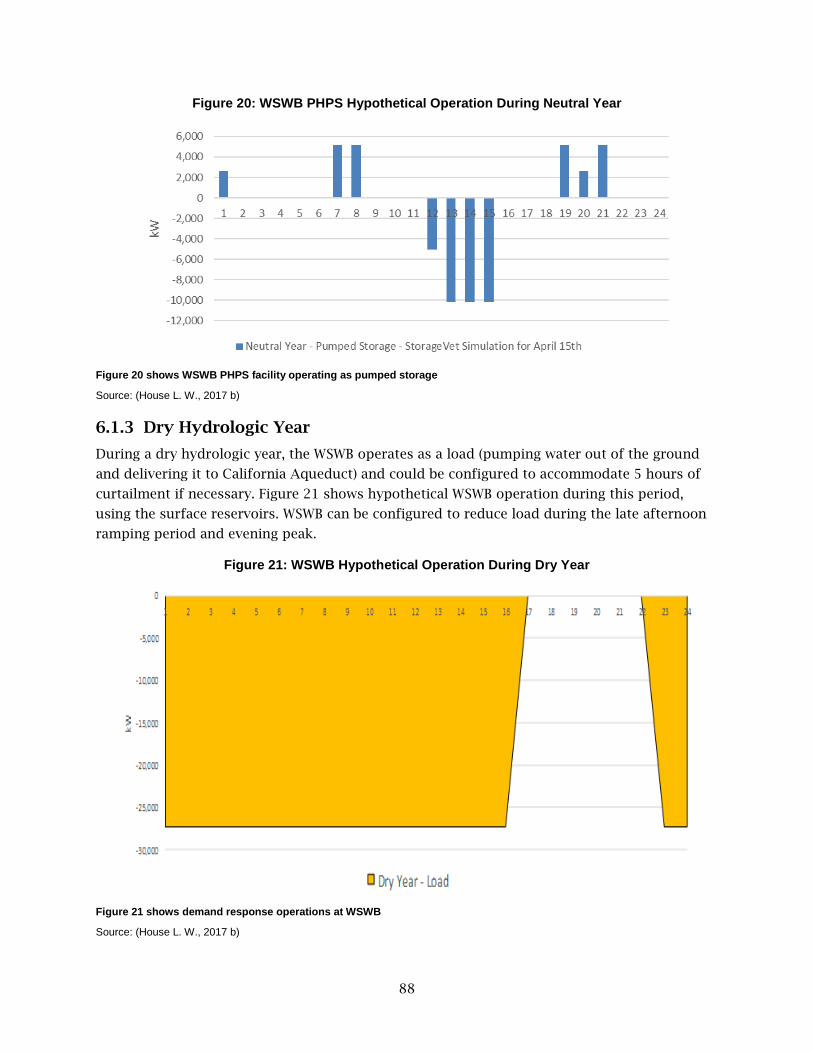
88
Figure 20: WSWB PHPS Hypothetical Operation During Neutral Year
Figure 20 shows WSWB PHPS facility operating as pumped storage
Source: (House L. W., 2017 b)
6.1.3 Dry Hydrologic Year
During a dry hydrologic year, the WSWB operates as a load (pumping water out of the ground
and delivering it to California Aqueduct) and could be configured to accommodate 5 hours of
curtailment if necessary. Figure 21 shows hypothetical WSWB operation during this period,
using the surface reservoirs. WSWB can be configured to reduce load during the late afternoon
ramping period and evening peak.
Figure 21: WSWB Hypothetical Operation During Dry Year
Figure 21 shows demand response operations at WSWB
Source: (House L. W., 2017 b)

89
6.2 Greenhouse Gas (GHG) Emissions Reduction Peak Hour Pumped Storage (PHPS) facilities will benefit the environment because they can
potentially be used regardless of the hydrological year type and can reduce the demand for
fossil fuel based power plants, resulting in greenhouse gas emissions reduction (Table 33).
Table 33: Annual GHG Emissions Reduction from PHPS at Groundwater Banks
Statewide PHPS
potential at groundwater Banks (MW)
kWh generated by natural gas based
peaker plants
Heat Rate (therm/kWh)
for natural gas fired peaker
plants
kWh generated by pumped storage at
groundwater banks*
Therm reduced
Metric tons of CO2e GHG
reductions**
44 3310*10^6 0.1027 80,300,000 8,250,000 44,000
For Table 33 only Peak Hour Pumped Storage (PHPS) potential was considered since Aquifer Pumped Hydro (APH) is impractical for large scale deployment.
* Assuming statewide implementation of PHPS for 5 hours daily over 365 days.
**To provide a conservative estimate of GHG Emissions reduction, the analysis has been restricted to an idle or neutral year when no recharge activities are taking place. The annual GHG reductions will be more in a wet or recharge year since pumped storage can be supplemented or replaced with hydropower generation that can potentially occur up to 24 hours a day year-round in a wet year. The GHG reductions may be less in a dry or extraction year depending on how much capacity is available to implement pumped storage.
Sources:
KWh generated by Peaker Plants (Table 2 page 3 (Nyberg, 2014))
therm/kWh converted from Heat Rate (Btu/kWh) (Table 2 page 3 (Nyberg, 2014))
Emissions Factor (CO2e) for Gas: 0.0053 metric tons/therm (Table 3 (California Energy Commission, 2015 a))

90

91
CHAPTER 7: Results and Conclusions
Energy storage shifts the renewable energy from the belly (excess) to the head (shortage) of the
‘duck curve’, supplying the electric grid when the generation requirements ramp up and peak.
Pumped storage at groundwater banks has the potential to provide 44 MW of storage capacity
in California. Assuming the state requires 6,000 MW of storage to meet the 50% renewable
penetration goal by 2030, implementing pumped storage at groundwater banking projects can
meet up to 1% of California’s storage requirements and provide additional benefits as demand
response and year-round hydropower generation.
The analysis shows that based on the hydrological year type, a typical groundwater banking
operation can use pumped storage facilities to provide hydropower generation and demand
response services besides pumped storage. Additionally, a pumped storage operating
configuration permits participation in multiple markets. Therefore, the bank operating in the
PHPS mode in a neutral year can participate in flexible ramping and demand response markets
as well as in the day ahead market. It is of interest to note that the traditional way for
evaluating pumped storage – using day-ahead energy market prices and generating when prices
are high and extracting water when prices are low, is the least valuable of the services
evaluated. In a dry year, the bank can participate in the demand response market to provide
various types of demand response. This demand response potential has the greatest value and
configuring the operations to provide demand response in a dry year also enhances the
economic feasibility of pumped storage and hydropower generation operations in neutral and
wet years respectively. Demand response will be online in one in three years and incorporating
PHPS at a groundwater banking project can provide revenue during the remaining two of three
the years when demand response is offline.
Table 34 summarizes the operational configurations for WSWB that use existing water banking
facilities in conjunction with additional facilities installed for PHPS and APH to provide pumped
storage, demand response and hydropower generation.

92
Table 34: WSWB PHPS and APH Operating Scenarios
Hydrologic Year Type
Probability of Occurrence
WSWB Operation
Type
Electricity Demand Potential
Electricity Generation Potential
Evaluated As
APH
Wet 32% Recharge 0 0
Neutral 33% Idle 17.2 MW 3.7 MW for 5 hours daily
Pumped Storage
Dry 35% Extraction 17.2 MW groundwater
pumping + 10.1 MW pump station use
0 Demand Response
PHPS
Wet 32% Recharge 0 5.2 MW 24 hours daily
Generator
Neutral 33% Idle 10.1 MW pump station use
5.2 MW for 5 hours daily
Pumped Storage
Dry 35% Extraction 17.2 MW groundwater
pumping + 10.1 MW pump station use
0 Demand Response (demand reduction)
Source: (House L. W., 2017 a)
The economic analyses show that adding dry year demand response to a PHPS facility’s wet and
neutral year operations makes it cost effective. However, adding dry year demand response to
APH is not enough to make APH cost effective (Table 35).
The technical, operational and economic analyses show the Aquifer Pumped Hydro (APH)
technology can have significant round-trip losses that will make it economically non-viable for
groundwater banking regions that have transmissivities at the low end of the typical range.
ASR projects overlying highly transmissive soils, using injection wells to recharge water may
have the potential to generate energy during recharge activities. The decision on installing a
generator in an injection well is not clear-cut and will have to be determined on a case by case
basis since the associated capital costs can be prohibitive. For the agencies that are not already
injecting treated recycled water, the increased costs to treat the water before it can be injected
and other regulatory costs are likely to make it economically infeasible to pursue well field
generation in a wet year. Therefore, an APH facility setup can have significant efficiency
constraints that will generally make the technology less viable than PHPS though individual site

93
Table 35: Comparison of WSWB APH and PHPS Operational Analysis
Aquifer Pumped Hydro (APH)
Peak Hour Pumped Storage (PHPS)
Demand Response
Components needed
Reversible pump-turbines, surface storage reservoir, aquifer lower
reservoir
Hydroelectric generator, upper and lower surface
reservoirs
Additional groundwater wells for 320 hours
curtailment
Capital Cost $18.6M $7.9M $2.1M Net Present Value (NPV)
-$18.2M (generator operating in neutral
years)
-$0.9M (generator operating during wet and
neutral years)
$9.1M (dry years)
Capital Cost with Dry Year Demand Response
$20.3M $10M -
Net Present Value (NPV) with Dry Year Demand response
-$9.1M
$8.1M -
Source: (House L. W., 2017 a)
characteristics will determine which (if any) technology is more feasible at a particular
groundwater banking site. The APH and PHPS templates developed as part of this study can be
used by existing and planned groundwater banking operations to determine the potential of
either or both pumped storage systems at a particular site. More studies are necessary to
address the knowledge gaps related to statewide pumped storage potential at groundwater
banks and to move the technology towards implementation. An important next step in this
process is a pilot or field test. The evaluation templates and the groundwater banks database
created for this project provide a good starting point to identify candidate sites for in-depth
evaluation and testing of either or both of the systems.

94
GLOSSARY
Term Definition
ASR (Aquifer Storage
and Recovery) project
A type of groundwater banking project that uses injection wells
to inject water underground for storage when water is available
and later recovers the water from the same well.
cloud data
Cloud data refers to data accessed, managed and transmitted
through the cloud. The cloud refers to a network of servers that
enable a user to access a range of storage and applications
services remotely via the Internet.
CO2e (carbon dioxide
equivalent)
Carbon dioxide equivalent is the standard unit to measure and
compare the emissions from various greenhouse gases based
upon their global warming potential. The global warming
potential of each different greenhouse gas is expressed in terms
of the amount of carbon dioxide that would cause the same
amount of global warming.
demand response
Demand response is the change in electricity consumption in
response to the electric grid needs, electric rates and/or
incentives.
EPIC (Electric Program
Investment Charge)
The Electric Program Investment Charge, created by the
California Public Utilities Commission in December 2011,
supports investments in clean energy technologies that benefit
electricity ratepayers of Pacific Gas and Electric Company,
Southern California Edison Company, and San Diego Gas &
Electric Company.
hydrologic year type
Three hydrologic year types are used in this study: “wet” is the
California Department of Water Resources (DWR) definition of a
wet year; “neutral” is above normal and below normal year types,
and “dry” is the DWR defined dry and critical hydrologic year
types based on Sacramento River data since 1906 (DWR, 2017).
Supervisory Control
and Data Acquisition
(SCADA)
A system often used in water, energy, and other industries for
controlling equipment operations and gathering real time data
remotely.
T (Transmissivity) Transmissivity is the rate of horizontal flow of groundwater
through an aquifer (underground water-bearing rock or soil).
Water bank or
Groundwater bank
An underground storage facility used for banking or storing
water. Stored water can be recycled, imported or surface water.

95
REFERENCES
Allen, R., Doherty, T., & Kannberg, L. (1984). Underground Pumped Hydroelectric Storage.
Antelope Valley Water Storage (AVWS). (2015, December). Attachment 4-Project Narrative Form.
Proposal "Groundwater Bank Energy Storage Systems - A Feasibility Study" for California
Energy Commission GFO-15-309: Reduce the Environmental and Public Health Impacts of
Electrical Generation.
Antelope Valley Water Storage (AVWS). (2016, October 12). Memorandum "List of CA
Groundwater Banking Projects".
Antelope Valley Water Storage (AVWS) LLC. (2016). Memorandum- Aquifer Pumped
Hydro:Impact of Draw-Down/Mounding Losses on System Efficiency.
Association of California Water Agencies (ACWA). (2017, April 21). Surplus Solar Energy Brings
Pricing Changes to Water Agencies. ACWA News, 45(4). Retrieved August 3, 2017, from
https://issuu.com/acwa/docs/an_vol45_no3_apr_17
Blomquist, C. A., Frigo, A. A., & Degnan, J. R. (1979). Evaluation of Advanced Hydraulic
Turbomachinery for Underground Pumped Hydroelectric Storage. Part 2. Two-Stage
Regulated Pump /Turbines for Operating Heads of 1000 to 1500M.
Blomquist, C., Frigo, A., Tam, S., & Clinch, J. (1979). Underground Pumped Hydroelectric Storage
(UPHS). Program Report.
Braat, K., van Lohuizen, H., & de Haan, J. (1985). Underground Pumped Hydro-Storage Project for
the Netherlands.
Budris, A. (2014, June). How to Reduce Municipal Electric Bills by Using Existing Water Towers
and Aquifer Well Pumps to Store Energy for Peak Demand Periods, in Pump Tips &
Techniques Column. WATERWORLD.
Burt, C., Howes, D., & Wilson, G. (2003). California Agricultural Water Electrical Energy
Requirements. Retrieved April 7, 2017, from http://agwaterstewards.org/wp-
content/uploads/2016/08/EnergyReqs.PDF
California Department of Water Resources. (2013). California Water Plan Update South Coast
Hydrologic Region. Retrieved April 21, 2017, from
http://www.water.ca.gov/waterplan/docs/cwpu2013/Final/Vol2_SouthCoastRR.pdf
California Department of Water Resources. (April 1981). Bulletin 211 Small Hydroelectric
Potential at Existing Hydraulic Structures in California. Retrieved from
http://www.water.ca.gov/waterdatalibrary/docs/historic/Bulletins/Bulletin_211/Bulletin
_211__1981.pdf
California Energy Commission. (2005). California's Water-Energy Relationship Final Staff Report.
Retrieved April 21, 2017, from http://www.energy.ca.gov/2005publications/CEC-700-
2005-011/CEC-700-2005-011-SF.PDF

96
California Energy Commission. (2015 a, October). Attachment 12 References for Energy End-
Use, Electricity Demand and GHG Emissions Reference and Calculations. GFO-15-309
Reduce the Environmental and Public Health Impacts of Electrical Generation.
California Energy Commission. (2015). Public Interest Energy Research 2014 Annual Report.
Retrieved April 21, 2017, from http://www.energy.ca.gov/2015publications/CEC-500-
2015-009/CEC-500-2015-009-CMF.pdf
California ISO. (2014). Advancing and Maximizing the Value of Energy Storage Technology – A
California Roadmap.
California ISO. (n.d.). Market processes and products. Retrieved from California ISO:
https://www.caiso.com/market/Pages/MarketProcesses.aspx
California ISO; National Renewable Energy Laboratory; First Solar. (n.d.). Using Renewables to
Operate a Low-Carbon Grid: Demonstration of Advanced Reliability Services from a
Utility-Scale Solar PV Plant. Retrieved from
http://www.caiso.com/Documents/UsingRenewablesToOperateLow-CarbonGrid.pdf
California Public Utilities Commission (CPUC). (2015). Beyond 33% Renewables: Grid Integration
Policy for a Low-Carbon Future. A CPUC Staff White Paper.
California Public Utilities Commission. (2017). R.15-03-011, Joint Workshop Report and
Framework Multiple-Use Applications for Energy Storage CPUC Rulemaking 15-03-011
and CAISO ESDER 2 Stakeholder Initiative.
Chang, G., Thompson, P., Allen, R., Ferreira, A., & Blomquist, C. (1980). Pumped-Storage
Hydroelectric Plants with Underground Lower Reservoirs.
DNV-GL Energy and Sustainability. (2013). Energy Storage Cost‐Effectiveness Methodology and
Results, Final Project Report. California Energy Commission, Energy Research and
Development Division.
Doherty, T. (1982). Report on Technical Feasibility of Underground Pumped Hydroelectric
Storage in a Marble Quarry Site in the Northeast United States.
DWR. (2017, March 21). WSIHIST: Chronological Reconstructed Sacramento and San Joaquin
Valley Water Year Hydrologic Classification Indices. Retrieved July 9, 2017, from
Department of Water Resources. California Data Exchange Center:
http://cdec.water.ca.gov/cgi-progs/iodir/WSIHIST
Electric Power Research Institute (EPRI) and Energy and Environmental Economics, Inc. . (2010).
Electricity Energy Storage Technology Options- A White Paper Primer on Applications,
Costs, and Benefits. Technical Update. Retrieved May 25, 2017, from
http://large.stanford.edu/courses/2012/ph240/doshay1/docs/EPRI.pdf
Environmental Science Associates . (2005). Appendix E. Analysis of Developing and
Implementing a Groundwater Recharge Reuse Project In The Antelope Valley. Retrieved

97
April 17, 2017, from
http://www.lacsd.org/civicax/filebank/blobdload.aspx?blobid=2171
Eternoo Machinery Co., Ltd. (n.d.). Products. Retrieved June 13, 2017, from Eternoo Machinery
Co., Ltd: http://www.eternoohydro.com/turbines/francis-turbines.html
Fairley, P. (2015, March 18). A Pumped Hydro Energy-Storage Renaissance. IEEE Spectrum.
Retrieved from http://spectrum.ieee.org/energy/policy/a-pumped-hydro-energystorage-
renaissance
Farquhar, O. (1982). Geotechnical Basis for Underground Energy Storage in Hard Rock. Final
Report.
Frigo, A. A., & Pistner, C. (1980). Evaluation of Advanced Turbomachinery for Underground
Pumped Hydroelectric Storage. Part 3. Multistage Unregulated Pump /Turbines for
Operating Heads of 1000 to 1500M.
Frigo, A. A., Blomquist, C. A., & Degnan, J. R. (1979). Evaluation of Advanced Hydraulic
Turbomachinery for Underground Pumped Hydroelectric Storage. Part 1. Single-Stage
Regulated Pump Turbines for Operating Heads of 500 to 1000M.
GEI Consultants, Inc. (2016). Willow Springs Water Bank (WSWB) Facilities Master Plan.
Memorandum.
GEI Consultants/Navigant Consulting, Inc. (2010). Embedded Energy in Water Studies Study 1:
Statewide and Regional Water-Energy Relationship. Retrieved April 21, 2017, from
https://www.waterenergyinnovations.com/publication/view/cpuc-embedded-energy-in-
water-studies-1-statewide-and-regional-water-energy-relationship/
Groundwater Replenishment System (GWRS). (n.d.). Retrieved April 21, 2017, from
https://www.ocwd.com/media/4267/gwrs-technical-brochure-r.pdf
HDR. (2017). Antelope Valley Water Storage Project Pumped Storage Study.
Hopkins Groundwater Consultants, Inc. (2013). Recycled Water Master Plan Groundwater
Replenishment and Reuse Project Ventura, California. Preliminary Hydrogeological Study.
Retrieved April 21, 2017, from https://www.unitedwater.org/images/stories/Resource-
Conservation/GW-Management/Groundwater-Hearing/Exhibits/U326%20-
%202013%20Hopkins%20GW%20Replentishment%20and%20Reuse%20Mound%20Basin.pd
f
House, L. W. (2017 a). EPC 15-049 Tech Memo No.1 : Economic Potential of Peak Hour Pumped
Storage and Aquifer Pumped Hydro Technologies at Willow Springs Water Bank.
Memorandum, Water & Energy Consulting.
House, L. W. (2017 b). EPC 15-049 Tech Memo No.2: Statewide Benefits of Pumped Storage at
Groundwater Banks. Memorandum, Water & Energy Consulting.
Hydro resources. (2013, December 3). Willow Springs Water Bank- Feasibility check at different
flow rates for pumping and injection.

98
Irrigation Training and Research Center (ITRC). (2003). California Agricultural Water Electrical
Energy Requirements Final Report. Retrieved April 21, 2017, from
http://agwaterstewards.org/wp-content/uploads/2016/08/EnergyReqs.PDF
Irrigation Training and Research Center (ITRC). (2005). CEC Agricultural Peak Load Reduction
Program-Water Agencies-Final Report. Retrieved April 21, 2017, from
http://www.itrc.org/reports/pdf/cecaplrp.pdf
Irrigation Training and Research Center (ITRC). (n.d.). Irrigation System Regulating (Buffer)
Reservoirs. Retrieved April 21, 2017, from
http://www.itrc.org/papers/pdf/regulating.pdf
Johnson, T. (2007). Battling Seawater Intrusion in the Central and West Coast Basins. Retrieved
April 21, 2017, from
http://www.wrd.org/sites/pr/files/TB13_Fall07_Seawater_Barriers.pdf
Kane, M. (2005, April). California Small Hydropower and Ocean Wave Energy Resources.
Retrieved April 25, 2017, from http://www.energy.ca.gov/2005publications/CEC-500-
2005-074/CEC-500-2005-074.PDF
Kern County California. (n.d.). Home. Retrieved June 13, 2017, from Kern County Assessor
Recorder: http://assessor.co.kern.ca.us/prop_search.php
Koreny, J. (2016). AV-2, AV-3 and AV-5 Pumping Test Data Summary Willow Springs Water Bank,
Kern County, CA. Memorandum, HDR.
Lawrence Berkeley National Laboratory. (2017). 2025 California Demand Response Potential
Study, Final Report on Phase 2 Results.
Los Angeles County Office of the Assessor. (n.d.). Property Assessment Information System.
Retrieved June 13, 2017, from Assessor Los Angeles County:
http://maps.assessor.lacounty.gov/GVH_2_2/Index.html?configBase=http://maps.assess
or.lacounty.gov/Geocortex/Essentials/REST/sites/PAIS/viewers/PAIS_hv/virtualdirector
y/Resources/Config/Default
Lund, J., Munevar, A., Taghavi, A., Hall, M., & Saracino, A. (2014, November). Integrating Storage
in California's Changing Water System. Retrieved April 21, 2017, from
https://watershed.ucdavis.edu/files/biblio/Storage_White_Paper_20Nov2014.pdf
Madlener, R. a. (2013). An Exploratory Economic Analysis of Underground Pumped-Storage
Hydro Power Plants in Abandoned Coal Mines.
Martin, G. a. (2007). Aquifer Underground Pumped Hydroelectric Energy Storage for Agriculture.
University of Colorado at Boulder. Retrieved from
www.colorado.edu/engineering/energystorage
Mathias, J., Doughty, C., & Kelly, L. (2016). Bulk Energy Storage in California. California Energy
Commission.

99
National Renewable Energy Laboratory (NREL). (2014). The California 2030 Low-Carbon Grid
Study (LCGS) Phase I Results Summary. Retrieved April 21, 2017, from
http://lowcarbongrid2030.org/wp-content/uploads/2014/08/LCGS-Phase-I-Results-
Summary-Slides.pdf; http://lowcarbongrid2030.org/
Navigant Consulting, I. (June 2006). Statewide Small Hydropower Resource Assessment.
Retrieved May 23, 2017, from http://www.energy.ca.gov/2006publications/CEC-500-
2006-065/CEC-500-2006-065.PDF
Nyberg, M. (2014, September). Thermal Efficiency of Gas‐Fired Generation in California: 2014
Update. Staff Paper. Retrieved June 20, 2017, from
http://www.energy.ca.gov/2014publications/CEC-200-2014-005/CEC-200-2014-005.pdf
Orange County Water District. (n.d.). Groundwater & location maps. Retrieved April 21, 2017,
from Orange County Water District: https://www.ocwd.com/what-we-do/groundwater-
management/groundwater-location-maps/
Pendleton. (n.d.). Retrieved August 10, 2017, from Public Works Projects:
http://www.pendleton.or.us/public-works/projects
Pickard, W. (2012). The History, Present State, and Future Prospects of Underground Pumped
Hydro for Massive Energy Storage. Proceedings of the IEEE, 100(2).
Profita, C. (2011, Dec 29). In Pendleton: Newfound well power. Retrieved August 10, 2017, from
Oregon Public Broadcasting (OPB): http://www.opb.org/news/blog/ecotrope/in-
pendleton-newfound-well-power/
Ridgway, S. L., Dooley, J. L., & Hammond, R. P. (1979). Underground Storage of Off-Peak Power.
RMC Water and Environment. (2007). City of Lancaster Groundwater Recharge Feasibility Study.
Retrieved April 17, 2017, from
http://www.ladpw.org/wwd/avirwmp/docs/Lancaster%20Report.pdf
RMC Water and Environment. (2012 (Revised 2013)). North San Diego County Regional Recycled
Water Project. Regional Recycled Water Facilities Plan. Retrieved April 21, 2017, from
http://nsdwrc.org/pdfs/Regional Recycled Water Facilities Plan.pdf
RMC Water and Environment. (2016). Carpinteria Valley Recycled Water Facilities Plan Final
Report. Retrieved April 17, 2017, from
http://www.carpinteria.ca.us/PDFs/pw_Recycled%20Water%20Facilities%20FINAL%20REP
ORT2016.pdf
Rogers, F. C. (1975). Existing Hydroelectric Generation Enhanced by Underground Energy
Storage.
Rogers, F. C., & Larson, W. E. (1974). Underground Energy Storage (Hydroelectric Plant).
S.Y., K., & I.E., D. (2017). Underground Pumped Hydroelectric Energy Storage in South Africa
using Aquifers and Existing Infrastructure. In: Schulz D. (eds) NEIS Conference 2016.
Wiesbaden: Springer Vieweg.

100
Sanitation Districts of Los Angeles County. (2011). Groundwater Recharge of Recycled Water.
Retrieved April 18, 2017, from
http://www.lacsd.org/civicax/filebank/blobdload.aspx?blobid=6779
Scott, F. M. (2007). Hydropower from Underground Pumped Storage. Am. Chem. Soc., Div. Fuel
Chem., 19(4). Retrieved from http://dx.doi.org/10.1080/00908317508945949
Semitropic Water Storage District. (2017, May 17).
State of California Natural Resoures Agency, Department of Water Resources . (April 2015).
California's Groundwater Update 2013. A Compilation of Enhanced Content for
California Water Plan Update 2013. Retrieved March 31, 2017, from
http://www.water.ca.gov/waterplan/docs/groundwater/update2013/content/statewide/
GWU2013_Ch_2_Statewide_Final.pdf
State Water Resources Control Board Division of Drinking Water. (2014). Alternative Treatment
Technology Report for Recycled Water. Retrieved April 17, 2017, from
http://www.waterboards.ca.gov/drinking_water/certlic/drinkingwater/documents/dwdo
cuments/Alternative%20Treatment%20Technology%20Report%20for%20RW%2009_2014.
Tam, S., Blomquist, C. A., & Kartsounes, G. (2007, April 27). Underground Pumped Hydro
Storage – An Overview. Argonne National Laboratory. Retrieved from
http://dx.doi.org/10.1080/00908317908908068
Uddin, N., & Asce, M. (2003). Preliminary Design of an Underground Reservoir for Pumped
Storage, Geotechnical and Geological Engineering. 21, 331.
doi:doi:10.1023/B:GEGE.0000006058.79137.e2
Water Replenishment District of Southern California. (2011). Engineering Survey and Report.
Retrieved April 21, 2017, from
http://www.water.ca.gov/urbanwatermanagement/2010uwmps/Long%20Beach%20Water
%20Department/Attach_E.pdf
Watersheds Coalition of Ventura County. (2006). Integrated Regional Water Management Plan .
Retrieved April 21, 2017, from
https://www.ventura.org/wcvc/IRWMP/docs/Section_5_Water_Management_Strategies_
Used_To_Meet_Plan_Objectives.pdfhttps://www.ventura.org/wcvc/IRWMP/docs/Section_
5_Water_Management_Strategies_Used_To_Meet_Plan_Objectives.pdf
West Basin Municipal Water District. (n.d.). Recycled Water > Edward C. Little Water Recycling
Facility. Retrieved April 21, 2017, from West Basin Municipal Water District:
http://old.westbasin.org/water-reliability-2020/recycled-water/water-recycling-
facility.html
Willett, D. C., & Warnock, J. G. (1983). Evolution ofa Technological Opportunity: Underground
Pumped Hydro Storage.
XiO, Inc. (2017, May 1). XiO pricing for Willow Springs Water Bank project.

1

A-1
APPENDIX A: Sensitivity Analysis
This document provides an analysis of the parameters that affect the calculation of mounding
losses, which have a direct impact on the potential power generation and provides conclusions
on which parameters have the greater impact on mounding losses relative to others.
Equations Used
Power generation potential is calculated utilizing the following procedure:
Step 1 – A theoretical equation will be used to calculate hm = potential mounding (feet) in the
aquifer due to injection of flow through the well into the aquifer. The equation1 in imperial
units is:
hm = ( 2.3 * Q ) x Log (2.25 * T * t)
(4 * 3.14 * T) ( r2 * S )
The equation is the Cooper-Jacob approximation to the Theis equation. The equation provides
the height of injection mound by correlating the drawdown, or head to the negative drawdown
(height of the injection mound).
Q= injection flow rate (ft3 /minute); S = Storage Coefficient; T= Transmissivity of aquifer (ft2
/minute); t = time (minutes); r = well radius (ft.). If hm is known from actual field data, then it
can be used in Step 2 instead of the theoretical value calculated in Step 1.
Step 2 - The hm
= potential mounding (feet) calculated in Step 1 will be used to calculate the
available Ht =
Head to Turbine for power generation using the equation: H
t= H (depth to water
datum) – hm.
Then, P = potential power generation is calculated from the equation below in
imperial units:
P = Q * Ht * E * 0.746 P = kW (kilowatts); H
t = Head on turbine (feet)
3960 Q = Injection flow rate (gallons per minute)
E = turbine efficiency
1 horsepower (hp) = 746 watts = 0.746 kW = 3,960 gpm-ft.
To evaluate the effect of each input parameter in the potential mounding head loss equation =
hm, refer to the attached excel spread sheet. Each of the parameters is varied and the effect on
mounding head loss is evaluated.
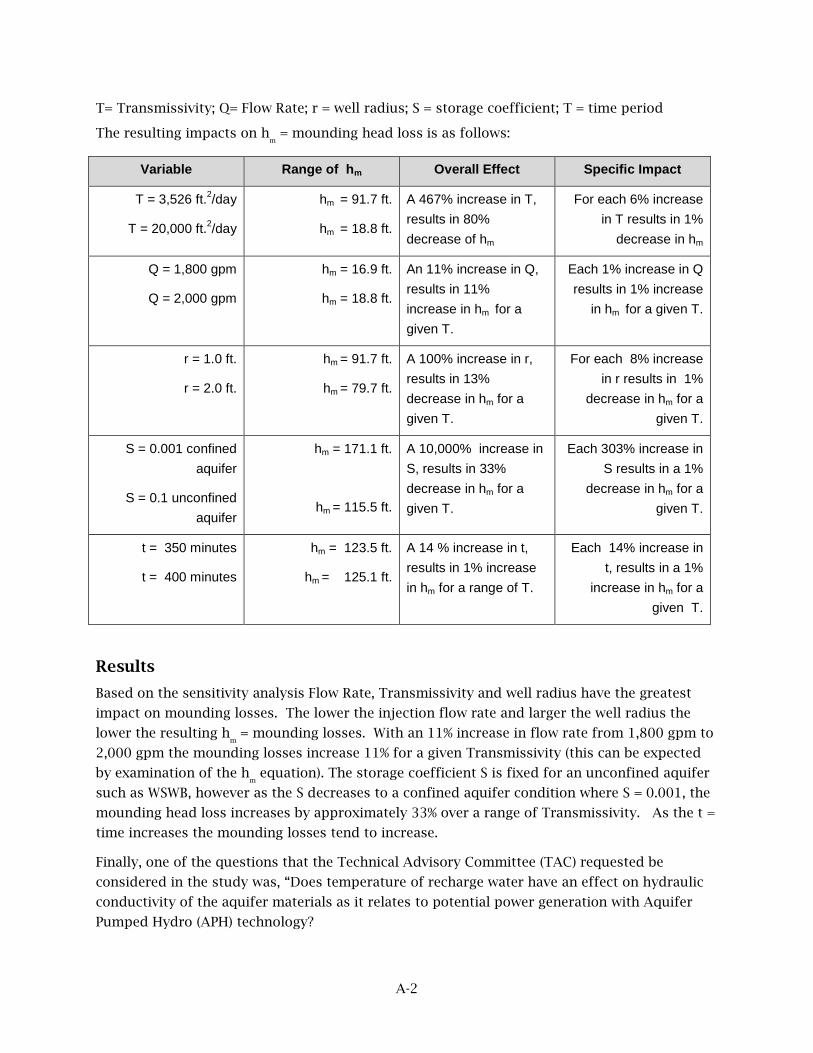
A-2
T= Transmissivity; Q= Flow Rate; r = well radius; S = storage coefficient; T = time period
The resulting impacts on hm = mounding head loss is as follows:
Variable Range of hm Overall Effect Specific Impact
T = 3,526 ft.2/day
T = 20,000 ft.2/day
hm = 91.7 ft.
hm = 18.8 ft.
A 467% increase in T, results in 80% decrease of hm
For each 6% increase in T results in 1%
decrease in hm
Q = 1,800 gpm
Q = 2,000 gpm
hm = 16.9 ft.
hm = 18.8 ft.
An 11% increase in Q, results in 11% increase in hm for a given T.
Each 1% increase in Q results in 1% increase
in hm for a given T.
r = 1.0 ft.
r = 2.0 ft.
hm = 91.7 ft.
hm = 79.7 ft.
A 100% increase in r, results in 13% decrease in hm for a given T.
For each 8% increase in r results in 1%
decrease in hm for a given T.
S = 0.001 confined aquifer
S = 0.1 unconfined aquifer
hm = 171.1 ft.
hm = 115.5 ft.
A 10,000% increase in S, results in 33% decrease in hm for a given T.
Each 303% increase in S results in a 1%
decrease in hm for a given T.
t = 350 minutes
t = 400 minutes
hm = 123.5 ft.
hm = 125.1 ft.
A 14 % increase in t, results in 1% increase in hm for a range of T.
Each 14% increase in t, results in a 1%
increase in hm for a given T.
Results
Based on the sensitivity analysis Flow Rate, Transmissivity and well radius have the greatest
impact on mounding losses. The lower the injection flow rate and larger the well radius the
lower the resulting hm = mounding losses. With an 11% increase in flow rate from 1,800 gpm to
2,000 gpm the mounding losses increase 11% for a given Transmissivity (this can be expected
by examination of the hm equation). The storage coefficient S is fixed for an unconfined aquifer
such as WSWB, however as the S decreases to a confined aquifer condition where S = 0.001, the
mounding head loss increases by approximately 33% over a range of Transmissivity. As the t =
time increases the mounding losses tend to increase.
Finally, one of the questions that the Technical Advisory Committee (TAC) requested be
considered in the study was, “Does temperature of recharge water have an effect on hydraulic
conductivity of the aquifer materials as it relates to potential power generation with Aquifer
Pumped Hydro (APH) technology?

A-3
UC Berkeley and David Keith Todd Consulting Engineers, Inc. [1] provide the following
definitions:
Given that T= transmissivity = K*t where K= hydraulic conductivity and t= aquifer thickness.
The hydraulic conductivity of a soil is its ability to transmit in a unit of time a unit volume of
groundwater at the prevailing kinematic viscosity of the water through a unit section of area.
Intrinsic permeability is the ability of a soil to transmit a fluid; and is defined by the following
equation:
k = intrinsic permeability = K * u * 1/ (unit weight of water x gravity); where u is the dynamic
viscosity of water. As can be seen in the figure below, dynamic viscosity decreases with
increasing temperature.
If surface water for recharge is colder than 50 to 60 degrees F, the water will warm to the
temperature of groundwater as it percolates into the aquifer. Within the upper 1,000 feet of
soils the groundwater temperature ranges from 50 to 60 degrees F, therefore, very cold
recharge water will have negligible effect on mounding losses
Source: [2]
Reference:
[1] UC Berkeley and David Keith Todd Consulting Engineers, Inc. Groundwater Hydrology,
Second Edition. John Wiley & Sons Publisher.
[2] The Engineering Toolbox. (2017, June 23). Retrieved June 23, 2017, from
http://www.engineeringtoolbox.com/water-dynamic-kinematic-viscosity-d_596.html

B-1
APPENDIX B: Field Measurement of Well Startup & Shutdown Time Durations
Test Protocol
1. Field Ops. Staff (FOP = Steve Tapia) stands at Well K-160.
2. FOP walks to, and enters truck, drives to Well G-160, and stops truck.
3. FOP exists truck, performs start-up on G-160, and signals when flow meter indicates
full flow rate.
4. FOP preforms shut-down of G-160, and signals when well and flow stops.
5. FOP walks to, and enters truck, drives back to Well K-160, and stops truck.
Assumption: 15 MPH Speed Limit (per Berkshire Hathaway Energy’s (BHE's) protocol)
Field Data
Activity Description Duration Seconds (range)
Comments
TRAVEL: Well to well
Field Ops. Staff (FOP) standing at Well K-160 walks to, and enters truck, drives to Well G-160, and stops truck.
118 to 160
Average = 140
Depends on driving speed, distance between wells, and distance truck is parked from a well. (K-160 & G-160 are ½ mile apart.)
BHE’s protocol sets a Speed Limit of 15 MPH.
TURN ON WELL:
FOP exits truck, walks to well head, performs start-up on G-160, and signals when flow meter indicates full flow rate.
18 to 37
Average = 28
Depends on multiple factors:
• Distance truck is parked relative to well
• Whether well is equipment with “Soft Start” motor control or has the old instant start panels, and also ramping settings of Soft Start Panel.
• H.P. of the Well Motor.
• Depth of water and size of column pipe.
• Flow rates across pump curves.

B-2
Activity Description Duration Seconds (range)
Comments
TURN OFF WELL:
FOP exits truck, walks to well head, turns off well at panel, and signals when motor has come to full stop.
16 to 28
Average = 22
Similar variables to above.
TRAVEL: Well to well
Field Ops. Staff (FOP) standing at Well G-160 walks to, and enters truck, drives to Well K-160, and stops truck.
118 to 160
Average = 140
Depends on driving speed, distance between wells, and distance truck is parked from a well. (K-160 & G-160 are ½ mile apart.)
BHE’s protocol sets a Speed Limit of 15 MPH.
Results:
Start-up duration: 140 [travel] + 28 [turn on well] + 140 [travel] = 308 sec. = 5.13 minutes/well
Shut-down duration: 140 [travel] + 22 [turn well off] + 140 [travel] = 302 sec. = 5.03
minutes/well
It would take one operator over 5 hours to start or stop all 62 wells if they are not equipped
with remote start and stop capability.
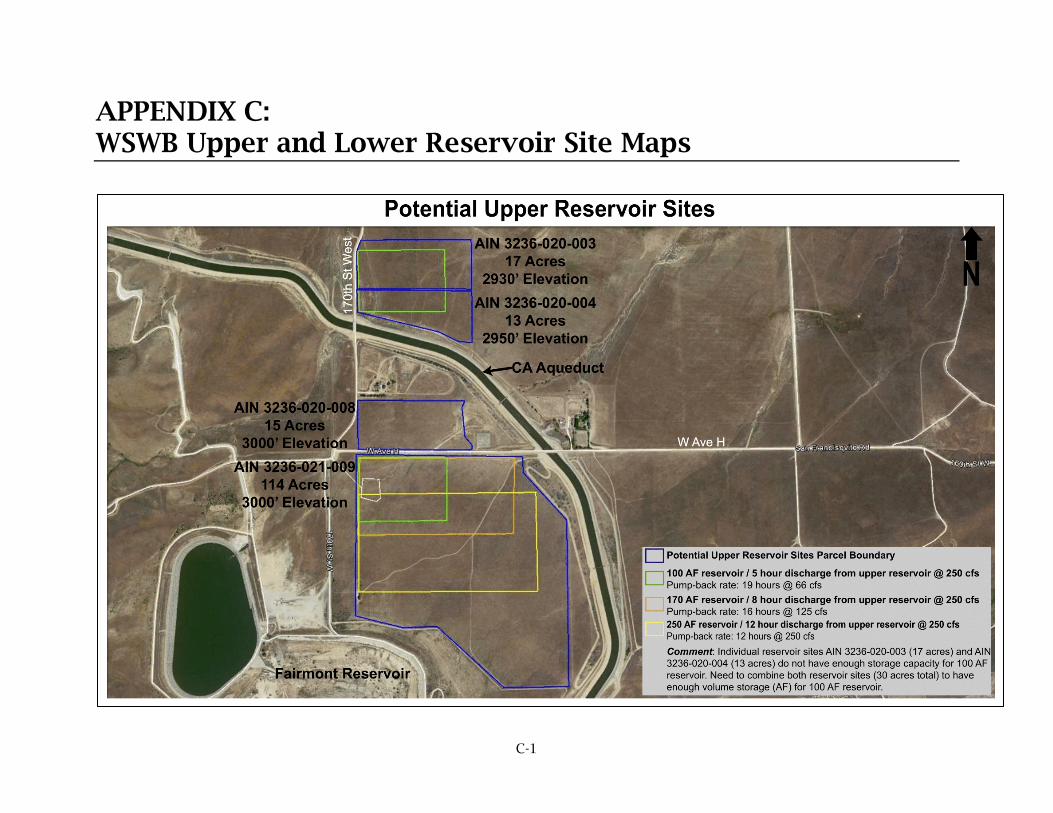
C-1
APPENDIX C: WSWB Upper and Lower Reservoir Site Maps
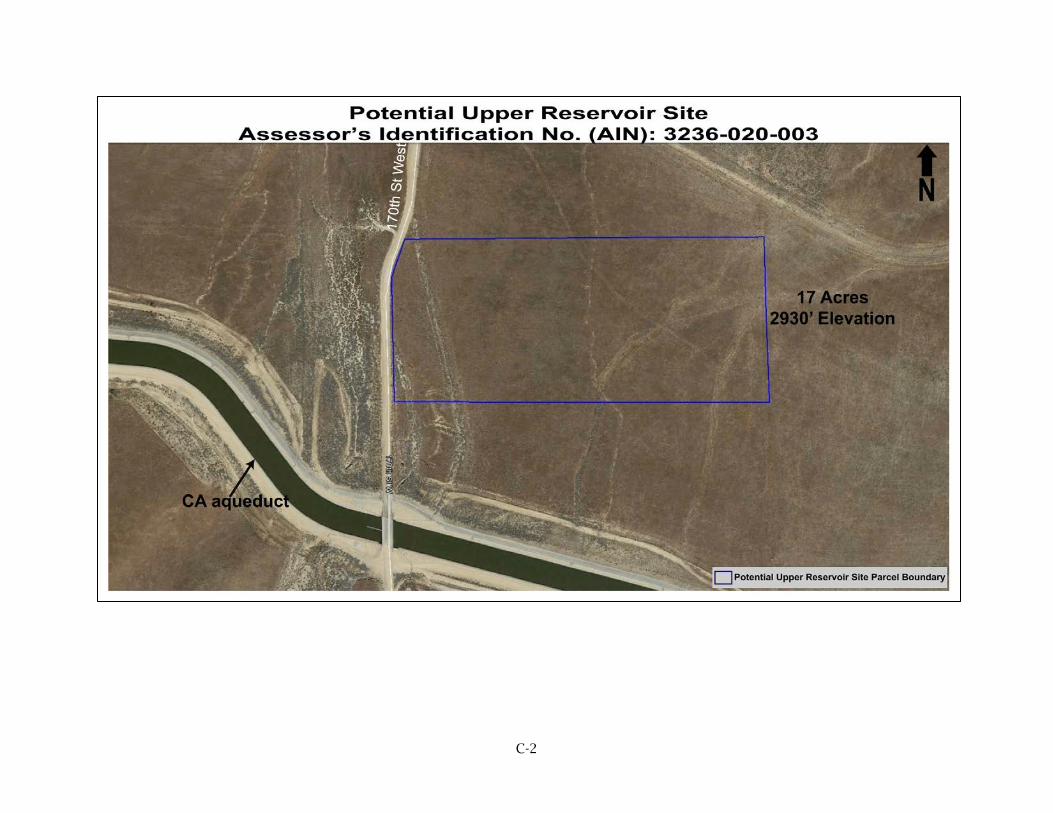
C-2

C-3

C-4

C-5

C-6

D-1
APPENDIX D: Statewide Survey Results
Statewide Survey Responses
Lead Agency Proceed or Not with Pumped Storage (Yes/No)
Reason
Central Coast Hydrologic Region
Monterey Peninsula Water Management District (MPWMD) - ASR
Yes Proceed for Peak Hour Pumped Storage (PHPS) and Aquifer Pumped Hydro (APH) studies. They are currently operating an ASR project and survey indicates pipeline system does pump recovered water back to source conveyance in Carmel Valley.
Monterey Regional Water Pollution Control Agency
No They do not have any service wells nor do they operate any groundwater bank.
Pajaro Valley Water Management Agency
No They do not have any ASR project nor injection wells. There is no indication if pump water goes back to source conveyance.
Goleta Water District Yes Proceed for Aquifer Pumped Hydro (APH) study only. They do have an ASR project as well as injection wells
Santa Barbara, City of, Water Resources Division
Yes They may have potential for Peak Hour Pumped Storage (PHPS) technology. There is significant elevation difference between source conveyance and recharge facility for energy generation.
Colorado River Hydrologic Region

D-2
Lead Agency Proceed or Not with Pumped Storage (Yes/No)
Reason
Coachella Valley Water District (CVWD)
No They do not have an ASR project or any injection wells. No indication if water gets pumped back to source conveyance
Sacramento River Hydrologic Region
Sacramento Groundwater Authority (SGA)
No They do not have an ASR project or any injection wells. They do not manage their own water directly, but they do oversee their Joint Powers Authority (JPA)
Sacramento Regional County Sanitation District (Regional San) The Nature Conservancy
No They do not have an ASR project or any injection wells. They also do not manage any ground water banks.
Sacramento Suburban Water District Yes They may have potential for Aquifer Pumped Hydro (APH) technology. They do not have an ASR project, but they do have 88 active wells and most wells have 200 ft. of ground water depth or more.
Regional Water Authority No They do not manage any water banks. Instead, they oversee the operations of other water agencies.
Yuba County Water Agency No They do not have an ASR project or any injection wells. They also do not have an existing pipeline system. They do have a canal system that is used for in-lieu recharge only.
City of Tracy - ASR Yes Proceed for Aquifer Pumped Hydro (APH) study and maybe for Peak Hour Pumped Storage (PHPS). They have nine extraction wells with one well also used for injections. They have a pilot ASR project. They do have

D-3
Lead Agency Proceed or Not with Pumped Storage (Yes/No)
Reason
an existing pipeline system, not sure however if water is pumped back to the source
City of Roseville - ASR No Their water agency currently only uses surface water, with no water pumping from wells. They do have ASR wells, but only turn on ASR wells once a month for testing purposes.
San Francisco Bay Hydrologic Region
Zone 7 Water Agency - ASR No They replied via Email that they do not operate any ground water bank
Santa Clara Valley Water District (SCVWD) - ASR
No They do not manager their own water supply. They recommend contacting Semitropic or Kern County water agencies for information. They do not have any ASR or injection wells.
San Joaquin County No They do not manage any ground water banks currently
San Joaquin River Hydrologic Region
Stockton East Water District (SEWD) No They may have potential for Aquifer Pumped Hydro (APH) technology. Their ground water project site does not have any elevation difference or existing pipeline system. Instead, the water is transferred through the use of canals
Northeastern San Joaquin County Groundwater Banking Authority
No Their Joint Powers Authority (JPA) consists of 11 members. They oversee other water agencies and do not manage any ground

D-4
Lead Agency Proceed or Not with Pumped Storage (Yes/No)
Reason
water banks directly.
Root Creek Water District Yes They may have potential for Aquifer Pumped Hydro (APH) technology. They do not have ASR or injection wells, but they do have 15 wells with at least 350 ft. depth to ground water level.
South Coast Hydrologic Region
Camp Pendleton - ASR No Their injection wells are used to pump water for salt water barrier. Their project site is not a ground water banking site
Compton Water Department Yes Proceed for Aquifer Pumped Hydro (APH) only. They currently have active ASR project.
Foothill Municipal Water District Yes Proceed for Aquifer Pumped Hydro (APH) only. They have three injection wells in service at their project site.
La Verne, City of; Three Valleys Municipal Water District
City of Lakewood No All the water that flows through their service area are traveling in one direction and they do not have any injection wells
Orange County Water District Yes Proceed for Aquifer Pumped Hydro (APH) only. They have 200 large wells in their service area, and they have injection wells for basin replenishment.
Los Angeles County Department of No They do not have any ASR projects or use any

D-5
Lead Agency Proceed or Not with Pumped Storage (Yes/No)
Reason
Public Works - ASR aquifers for storage
Los Angeles Department of Water and Power - ASR
No They do not have any current ASR projects or use any aquifers for storage
Main San Gabriel Basin Watermaster No They do not have any ground water banks. They oversee the operations of other water agencies.
Cucamonga Valley Water District No They do not have any injection wells. The water flows through their service area in one direction only.
Eastern Municipal Water District - ASR No They do not have any injection wells. The water flows through their service area in one direction only.
Raymond Basin Management Board - ASR
No They are a Watermaster that oversee other water agencies, they do no manage any ground water projects. Their water operating system does not have elevation difference or put/take amounts.
San Bernardino Valley Water Conservation District
No They do not have an existing pipeline system, ASR project, or extraction wells
Three Valleys Municipal Water District No They already have a hydroelectric facility. They do not have any injection wells
Helix Water District [El Monte Valley] No They do not have an ASR project or any injection wells. They also do not manage any ground water facilities
Sweetwater Authority No They do not have any ASR project or manage any ground water banks. They have a

D-6
Lead Agency Proceed or Not with Pumped Storage (Yes/No)
Reason
desalination plant that utilizes reverse osmosis to purify water for customer use
United Water Conservation District - ASR
No Their project site has low elevation difference, and no existing pipeline system. They do not have any injection wells or ASR projects
Western Municipal Water District No They do not have any injection wells, nor do they have an existing pipeline system in operation.
Castaic Lake Water Agency No Taken from survey response: Castaic Lake Water Agency (CLWA) does not operate any ground water banking programs.
South Lahontan Hydrologic Region
Mojave Water Agency Yes They do not have any injection wells. They may have potential for Peak Hour Pumped Storage (PHPS) because they have an existing pipeline system that is in use.
Tulare Lake Hydrologic Region
Kern Water Bank Authority No The elevation difference at their project site is not enough for Peak Hour Pumped Storage (PHPS) technology. They do not have any injection wells.

D-7
Lead Agency Proceed or Not with Pumped Storage (Yes/No)
Reason
City of Bakersfield 2800 Acre Water Bank
Yes They do not have an ASR project, but they have 53 wells with deep enough 340 ft. depth to groundwater level
James Irrigation District No Prior research found their project site to have low elevation difference, and no existing pipeline; Background study also found injection wells inefficient
Rosedale-Rio Bravo WSD
Wheeler Ridge Maricopa Water Storage District
No They do not have any pumped storage or aquifer storage facilities
Shafter Wasco Irrigation District No They are just getting started on building out their ground water bank facility and wells. They are not in operation yet.
Southern San Joaquin Municipal Utilities District
No They are trying to outsource their water. They do not operate any ground water banks currently
Kaweah Delta Water Conservation District
No They do not have any pump storage in operation
Pixley Irrigation District/Lower Tule River Irrigation District
No They only have surface water storage for agriculture, but no pipeline system available
North Coast Hydrologic Region
Butte County No They do not manage or own any water banks

E-1
APPENDIX E: Small Hydropower Potential for Groundwater Banking Agencies
Geographic Region
Hydrologic Region
County Total Annual Water
Entitlements (AWE) for
County (AFY)
Water Purveyors having
Groundwater Banking Projects a
Annual Water Entitlements
(AWE) for Water
Purveyor (AFY)b
Countywide Small
Hydropower Potential
(kW)c
Estimated Small
Hydropower Potential (kW) for Water
Purveyors N San
Francisco Bay
Alameda
260,000
Alameda County Water District
(ACWD)
42,000
3,200 3,200
East Bay Municipal Utilities District
(EBMUD)
150,000
Alameda County FC & WCD, Zone 7
68,000
3 260,000 C Tulare Lake Fresno
2,446,395
City of Fresno 60,000
6,426 2,503
Consolidated Irrigation District
(CID)
240,000
Fresno Irrigation District (FID)
550,000
James Irrigation District
59,220
Tranquillity Water District/Tranquillity Irrigation District
43,857

E-2
Geographic Region
Hydrologic Region
County Total Annual Water
Entitlements (AWE) for
County (AFY)
Water Purveyors having
Groundwater Banking Projects a
Annual Water Entitlements
(AWE) for Water
Purveyor (AFY)b
Countywide Small
Hydropower Potential
(kW)c
Estimated Small
Hydropower Potential (kW) for Water
Purveyors
5
953,077 S South
Lahontan Kern
2,461,275
Antelope Valley Water Storage
250000d 19,177 21,860
Tulare Lake Arvin-Edison Water Storage District
(AEWSD)
351,675
Berrenda Mesa Water District
(BMWD)
140,000
Buena Vista Water Storage District
(BVWSD)
185,000
Cawelo Water District
75,000
Kern Delta Water District
220,000
Kern Tulare Water District
40,000
North Kern Water Storage District
222,000
Rosedale-Rio Bravo WSD (RRBWSD)
70,000
Semitropic Water Storage District
500,000
Shafter-Wasco Irrigation District
(SWID)
89,600
Tehachapi-Cummings County
Water District (TCCWD)
25,000

E-3
Geographic Region
Hydrologic Region
County Total Annual Water
Entitlements (AWE) for
County (AFY)
Water Purveyors having
Groundwater Banking Projects a
Annual Water Entitlements
(AWE) for Water
Purveyor (AFY)b
Countywide Small
Hydropower Potential
(kW)c
Estimated Small
Hydropower Potential (kW) for Water
Purveyors Wheeler Ridge Maricopa Water Storage District
(WRMWSD)
220,000
13
2,138,275 C Tulare Lake
Kings
582,508
Kings County Water District Apex Ranch
Conjunctive Use (KCWD)
256,938
4,054 1,788
1
256,938 S South
Lahontan Los Angeles
3,807,645
Antelope Valley-East Kern Water Agency (AVEK)
141,000
56,932 20,525
South Coast Los Angeles Department of
Water and Power (LADWP)
795,454
City of Long Beach Water Department
46,475
San Gabriel Valley Municipal Water
Districte
28,800
Three Valleys Municipal Water
District (TVMWD)
51,000
West Basin Municipal Water
District (WBMWD)
160,000

E-4
Geographic Region
Hydrologic Region
County Total Annual Water
Entitlements (AWE) for
County (AFY)
Water Purveyors having
Groundwater Banking Projects a
Annual Water Entitlements
(AWE) for Water
Purveyor (AFY)b
Countywide Small
Hydropower Potential
(kW)c
Estimated Small
Hydropower Potential (kW) for Water
Purveyors Water
Replenishment District of Southern California (WRD) (previously called Central and West
Basin Water Replenishment
District)
150,000
7
1,372,729 C San Joaquin
River
Madera
884,000
Chowchilla Water District
239,000
6,793 4,103
Madera Irrigation District (MID)
295,000
2
534,000 S South Coast
Orange County
318,500
Orange County Water District
(OCWD)
225,000
1,189 840
1
225,000 N Sacramento
River
Placer
231,200
City of Roseville Water District
32,000
778 108
1
32,000 S Colorado
River Riverside
1,123,216
Coachella Valley Water District
(CVWD)
508,100
3,961 2,480
Desert Water Agencyf
38,100
South Coast Eastern Municipal

E-5
Geographic Region
Hydrologic Region
County Total Annual Water
Entitlements (AWE) for
County (AFY)
Water Purveyors having
Groundwater Banking Projects a
Annual Water Entitlements
(AWE) for Water
Purveyor (AFY)b
Countywide Small
Hydropower Potential
(kW)c
Estimated Small
Hydropower Potential (kW) for Water
Purveyors Water District
(EMWD) 77,016
Rancho California Water District
(RCWD)
30,000
Western Municipal Water District
(WMWD)
50,000
5
703,216 S South Coast San
Bernardino
283,417
lnland Empire Utilities Agency
(previously known as Chino Basin Municipal Water
District)
25,000
17,728 12,723
San Bernardino Valley Municipal
Water District (SBVMWD)
102,600
South Lahontan
Mojave Water Agency (MWA)
75,800
3
203,400 N Sacramento
River
Sacramento
196,000
City of Sacramento, Utilities
Departmentg
90,000
1,506 692
1
90,000
S South Coast
San Diego
City of San Diego Public Utilities Department
235,245
4,874 2,254

E-6
Geographic Region
Hydrologic Region
County Total Annual Water
Entitlements (AWE) for
County (AFY)
Water Purveyors having
Groundwater Banking Projects a
Annual Water Entitlements
(AWE) for Water
Purveyor (AFY)b
Countywide Small
Hydropower Potential
(kW)c
Estimated Small
Hydropower Potential (kW) for Water
Purveyors Helix Water District
35,500 Sweetwater
Authority
22,500
634,245 3
293,245 N San Joaquin
River San Joaquin
952,713
Stockton East Water District
(SEWD)
75,000
7,406 1,726
Tulare Lake
Southern San Joaquin Municipal
Utilities District (SSJMUD)
147,000
2
222,000 C San
Francisco Bay
Santa Clara
296,541
Santa Clara Valley Water District
(SCVWD)
252,500
2,058 1,752
1
252,500 C Tulare Lake Tulare
Delano-Earlimart Irrigation District
(DEID)
183,300
12,258 8,559
Kaweah Delta Water Conservation District (KDWCD)
440,000
Lower Tule River Irrigation District
(LTRID)
330,302
Pixley Irrigation District
31,102
Porterville Irrigation Districts
46,000

E-7
Geographic Region
Hydrologic Region
County Total Annual Water
Entitlements (AWE) for
County (AFY)
Water Purveyors having
Groundwater Banking Projects a
Annual Water Entitlements
(AWE) for Water
Purveyor (AFY)b
Countywide Small
Hydropower Potential
(kW)c
Estimated Small
Hydropower Potential (kW) for Water
Purveyors
1,595,072
Saucelito Irrigation District
54,000
Terra Bella Irrigation District
29,000
7
1,113,704
S South Coast
Ventura
115,000
Calleguas Municipal Water District
95,000
154 127
1
95,000 N Sacramento
River
Yuba County
321,000
Yuba County Water Agency (YCWA)
300,000
2,464 2,303
1
300,000 Notes a The listed water purveyors have groundwater banking projects as identified in the master database, "CA Groundwater Banking Projects" compiled for this study. Where more than one water purveyor is listed for a water entitlement, at least one of the agencies has groundwater banking operations. It is assumed that the reference study (Statewide Small Hydropower Resource Assessment, Navigant Consulting, Inc.) includes all the groundwater banking agencies/districts which have PHPS potential. b Peak Hour Pumped Storage (PHPS) can happen every year regardless of hydrology and as long as there is available water for 'cycling' an agency should be able to implement PHPS regardless of source of water. An agency can potentially use water entitlements besides banked water if needed. The water entitlements database was assembled from multiple sources which include information on water rights, State Water Project (SWP) deliveries, Central Valley Project (CVP) deliveries and well data (Navigant Consulting, June 2006). c Small hydropower capacity is defined as 30 MW or less and the minimum size unit to be considered in the source study was 100kW. Very small water purveyors with annual water entitlements less than 20,000 AFY were not included in the small hydropower (kW) computation since they did not have sufficient amount of water to meet the source study's (Navigant Consulting, June 2006) minimum threshold of 100 kilowatts generation potential. The remaining Large, Medium or Small agencies total 164 in number. The source study used estimation factors to calculate kW potential for medium and small purveyors that were not surveyed; the large ones were evaluated through site survey or interview only and their potential was not used to develop estimation factors (Navigant Consulting, June 2006). d Antelope Valley Water Storage (AVWS) was not one of the entities included in the reference database. The peak hour generation potential (via Peak Hour Pumped Storage) and hydropower generation potential for AVWS (5.2 MW) was calculated as part of this project and has been added to the interpolated small hydropower potential (kW) for groundwater banking agencies in Kern County.

E-8
e Main San Gabriel Basin Watermaster is included in the master database, "CA Groundwater Banking Projects." The Watermaster administers adjudicated water rights and manages and protects groundwater resources within the Main San Gabriel Groundwater Basin. San Gabriel Valley Municipal Water District is one of the three agencies delivering supplemental SWP water to the basin for recharge. f Desert Water Agency and Coachella Valley Water District partner to recharge groundwater (Master Database, CA Groundwater Banking Projects) g City of Sacramento is a member agency of Sacramento Groundwater Authority. The Authority is included in the master database, "List of CA Groundwater Banking Projects." The City has participated in water transfer efforts previously and may do so in future (City of Sacramento Department of Utilities. 2010 Urban Water Management Plan. October 2011. Prepared by Carollo Engineers, Inc.)
Sources:
Small hydropower potential (kW) by County (California RPS-Eligible Small Hydropower Potential (2004 Draft Report), Navigant Consulting, Inc.; California Small Hydropower and Ocean Wave Energy Resources (Staff Paper) (Kane, 2005)
Information about water entitlements for County/Region (Navigant Consulting, June 2006)
Groundwater banking agencies (including those with ASR projects). (Master Database, CA Groundwater Banking Projects. Groundwater Bank Energy Storage Systems: A Feasibility Study for Willow Springs Water Bank. 2017. Prepared by Antelope Valley Water Storage (AVWS), LLC

F-1
APPENDIX F: Well Pumps Demand Response Potential for Selected Groundwater Banking Projects
Hydrologic Region
Lead agency for Groundwater
Banking Project
Groundwater Basin/Subbasin
Name
Recovery (AFY)
Energy Intensity
(kWh/AF)32
Annual kWh Estimated Pumping Capacity
(kW)33
Notes from literature research/survey
CC Monterey Peninsula Water Management District
Carmel Valley, Seaside
3000 388 1,164,000 199 Phase 1 ASR includes two ASR wells with combined injection capacity 3,000 gpm and recovery capacity 3,500 gpm. Phase 2 ASR project includes two ASR wells with maximum annual diversion limit of 2,900 acre-feet/year, combined injection rate of 3,600 gpm, and annual yield of 1,000 acre-feet.
SC Elsinore Valley Municipal Water District; Western Municipal Water District
Elsinore Valley, Riverside-Arlington and Temescal
4000 541 2,164,000 370
SC Foothill Municipal Water District
- 3000 541 1,623,000 277
32 Energy Intensity is for the year 2000, a "normal" water year from Table G-1 in Embedded Energy in Water Studies Study 1: Statewide and Regional Water-Energy Relationship (GEI Consultants/Navigant Consulting, Inc., 2010)
33 To calculate annual kW demand, around-the-clock operations for 244 days (~ 8 months) are assumed regardless of whether a project is in-lieu or has direct artificial recharge. It is assumed that the recovery operations use only electric motors and no diesel engines.

F-2
Hydrologic Region
Lead agency for Groundwater
Banking Project
Groundwater Basin/Subbasin
Name
Recovery (AFY)
Energy Intensity
(kWh/AF)32
Annual kWh Estimated Pumping Capacity
(kW)33
Notes from literature research/survey
SC Inland Empire Utilities Agency
- 140,000 541 75,740,000 12934
SC Inland Empire Utilities Agency; Three Valleys MWD; Chino Basin Watermaster
Chino, Cucamonga
33000 541 17,853,000 3049
SC La Verne, City of; Three Valleys Municipal Water District
- 1000 541 541,000 92
SC Long Beach Water Department
Central 4300 541 2,326,300 397
SC Long Beach Water Department and City of Lakewood
Central 1200 541 649,200 111
SC Main San Gabriel Basin Watermaster
San Gabriel Valley
60000 541 32,460,000 5543
SC Orange County Water District
Coastal Plain of Orange County
22000 541 11,902,000 2032
SC San Bernardino Valley Municipal Water District (Valley District)
Rialto-Colton, Bunker Hill, Yucaipa
29500 541 15,959,500 2725
SC San Diego, City of, Public Utilities Department
San Pasqual Valley, San Diego River Valley
5800 541 3,137,800 536
SC Three Valleys Municipal Water District
- 5,000 541 2,705,000 462 There are two groundwater production wells.
SC Water West Coast, 245000 541 132,545,000 22634
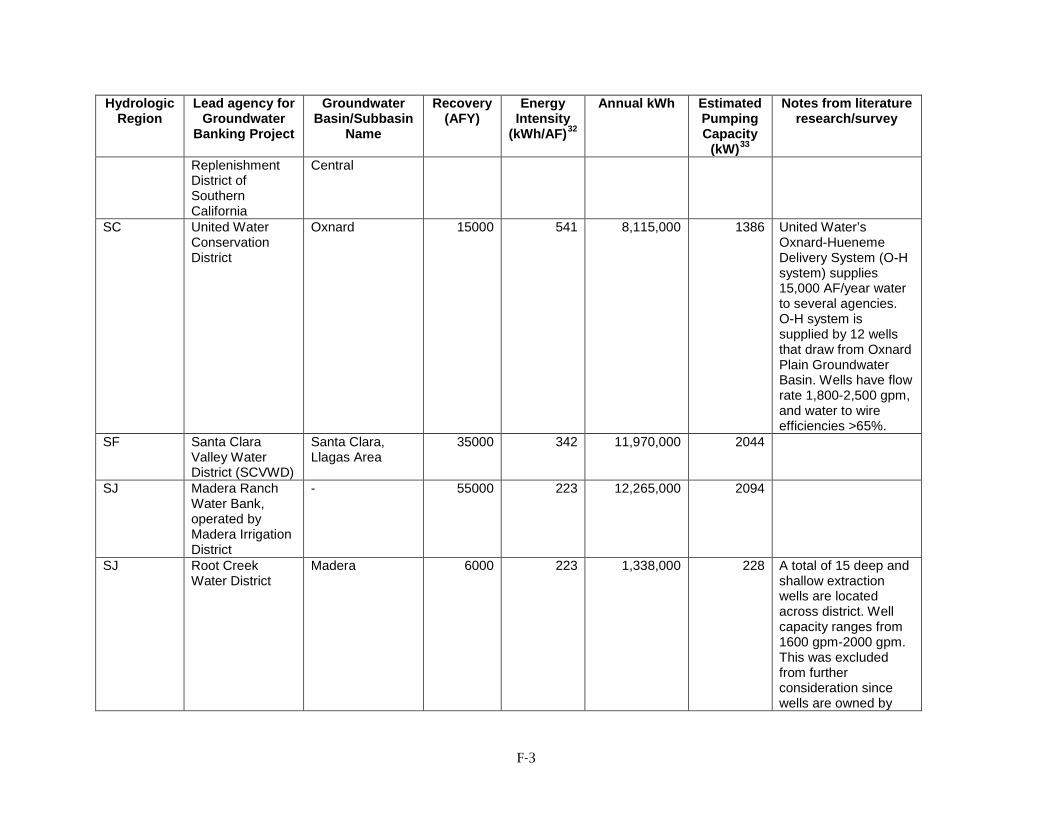
F-3
Hydrologic Region
Lead agency for Groundwater
Banking Project
Groundwater Basin/Subbasin
Name
Recovery (AFY)
Energy Intensity
(kWh/AF)32
Annual kWh Estimated Pumping Capacity
(kW)33
Notes from literature research/survey
Replenishment District of Southern California
Central
SC United Water Conservation District
Oxnard 15000 541 8,115,000 1386 United Water’s Oxnard-Hueneme Delivery System (O-H system) supplies 15,000 AF/year water to several agencies. O-H system is supplied by 12 wells that draw from Oxnard Plain Groundwater Basin. Wells have flow rate 1,800-2,500 gpm, and water to wire efficiencies >65%.
SF Santa Clara Valley Water District (SCVWD)
Santa Clara, Llagas Area
35000 342 11,970,000 2044
SJ Madera Ranch Water Bank, operated by Madera Irrigation District
- 55000 223 12,265,000 2094
SJ Root Creek Water District
Madera 6000 223 1,338,000 228 A total of 15 deep and shallow extraction wells are located across district. Well capacity ranges from 1600 gpm-2000 gpm. This was excluded from further consideration since wells are owned by

F-4
Hydrologic Region
Lead agency for Groundwater
Banking Project
Groundwater Basin/Subbasin
Name
Recovery (AFY)
Energy Intensity
(kWh/AF)32
Annual kWh Estimated Pumping Capacity
(kW)33
Notes from literature research/survey
private land owners which would make demand response program difficult to implement.
SL Willow Springs Water Bank
Antelope Valley 225000 342 76,950,000 13140 The demand response potential at Willow Springs Water Bank is estimated to be 14.0 MW (Details are provided in Chapter 2 of this study). 62 production wells are planned for WSWB. Each production well is expected to have a 300-horsepower motor, or 0.225 MW.
SL AVEK Godde Bank operated by Antelope Valley-East Kern Water Agency
Antelope Valley 40000 342 13,680,000 2336
SL Planned Enterprise Bank operated by Antelope Valley-East Kern Water Agency
Antelope Valley 83300 342 28,488,600 4865
SL Mojave Water Agency
Cronise Valley, Lower Mojave River Valley, Middle Mojave River Valley, Upper Mojave River Valley, El
50000 342 17,100,000 2920

F-5
Hydrologic Region
Lead agency for Groundwater
Banking Project
Groundwater Basin/Subbasin
Name
Recovery (AFY)
Energy Intensity
(kWh/AF)32
Annual kWh Estimated Pumping Capacity
(kW)33
Notes from literature research/survey
Mirage Valley, Kane Wash Area, Lucerne Valley, Langford Well Lake, Fremont Valley, Goldstone Valley, Superior Valley, Searles Valley, Salt Wells Valley, Grass Valley, Warren Valley, Deadman Lake, Bessemer Valley, Ames Valley, Means Valley, Upper Johnson Valley, Iron Ridge Area, Lost Horse Valley
SL Palmdale Regional Groundwater Recharge and Recovery Project
- 24250 342 8,293,500 1416
SR Sacramento Suburban Water District
- 4500 184 828,000 141 The District provides water to its customers from 88 active groundwater wells. The groundwater basin underlying the District is located in a portion of the North American subbasin: 47 wells with capacity of 180-3500 gpm and 50-250 hp motor, 37

F-6
Hydrologic Region
Lead agency for Groundwater
Banking Project
Groundwater Basin/Subbasin
Name
Recovery (AFY)
Energy Intensity
(kWh/AF)32
Annual kWh Estimated Pumping Capacity
(kW)33
Notes from literature research/survey
wells (with capacity of 600-2950 gpm and 75-300 hp motor and 3 wells with capacity of 400-650 gpm and 75 hp motor.
SR Yuba County Water Agency
- 30000 184 5,520,000 943
SR Sacramento Regional County Sanitation District (Regional San)/The Nature Conservancy
- 30000 184 5,520,000 943
TL Buena Vista Water Storage District
Kern County 40000 369 14,760,000 2520
TL Semitropic Water Storage District
Kern County 365000 369 134,685,000 22999
TL Arvin-Edison Water Storage District
Kern County 170235 369 62,816,715 10727
TL Kern Water Bank Authority
Kern County 240000 369 88,560,000 15123 Kern Water Bank has no injection wells. Recharge is via approximately 7,000 acres of recharge ponds or in-lieu. There are 85 recovery wells which on average are about 750-feet deep and produce as much as 5,000 gallons-per-minute of water. Wells

F-7
Hydrologic Region
Lead agency for Groundwater
Banking Project
Groundwater Basin/Subbasin
Name
Recovery (AFY)
Energy Intensity
(kWh/AF)32
Annual kWh Estimated Pumping Capacity
(kW)33
Notes from literature research/survey
are spaced 1/3 of a mile or more apart.
TL Fresno Irrigation District (Waldron Pond)
- 9000 369 3,321,000 567
TL North Kern Water Storage District
Kern County 250000 369 92,250,000 15753 The District successfully curtail 9 MW of peak load using regulating reservoirs, telemetry equipment and timers on over 60 groundwater wells (Burt, Howes, & Wilson, 2003)
TL City of Bakersfield 2800 Acre Water Bank
- 89000 369 32,841,000 5608 The City pumps groundwater from Kern County groundwater basin with 53 active wells. These wells have a combined capacity of about 89,000 AF/year. From survey response, active wells have a flow capacity of 3200 gpm, 250 hp motor, and 40-65% efficiency. (For the calculations of demand response potential, the earlier recovery estimate of 46000 AFY from Pacific Institute Report was replaced by

F-8
Hydrologic Region
Lead agency for Groundwater
Banking Project
Groundwater Basin/Subbasin
Name
Recovery (AFY)
Energy Intensity
(kWh/AF)32
Annual kWh Estimated Pumping Capacity
(kW)33
Notes from literature research/survey
89000 AFY).
TL Consolidated Irrigation District
- 8000 369 2,952,000 504
TL Kings County WD Apex Conjunctive Use
- 4000 369 1,476,000 252
TL James ID Lateral K
- 2000 369 738,000 126
TL Kern County Water Agency
- 98000 369 36,162,000 6175
TL Rosedale-Rio Bravo WSD
- 62500 369 23,062,500 3938
TL Cawelo Water District
Kern County 5500 369 2,029,500 347
TL Kern Delta Water District
- 94000 369 34,686,000 5923
TL Pixley Irrigation District
Tule 30000 369 11,070,000 1890
TL Wheeler Ridge Maricopa Water Storage District
- 50000 369 18,450,000 3151
TL Buena Vista Water Storage District and West Kern Water District
- 45000 369 16,605,000 2836
TL Kern Co Water Agency Pioneer Recharge and Recovery Project
- 98000 369 36,162,000 6175
TL James Irrigation District
Kings 4000 369 1,476,000 252 Groundwater supply is pumped from 63 extraction wells, 28

F-9
Hydrologic Region
Lead agency for Groundwater
Banking Project
Groundwater Basin/Subbasin
Name
Recovery (AFY)
Energy Intensity
(kWh/AF)32
Annual kWh Estimated Pumping Capacity
(kW)33
Notes from literature research/survey
wells are within district boundaries, and 35 wells are in easement area of City of San Joaquin. The 63 wells have flow capacity of 2400 gpm, pumping capacity of 210 cfs, and 75% efficiency. It is not clear how many of these extraction wells are used for recovery from groundwater banking project.
TL Berrenda Mesa Water District
- 50000 369 18,450,000 3151
TL Kaweah Delta Water Conservation District
Kaweah 35000 369 12,915,000 2205
TL West Kern Water District
Kern County 20000 369 7,380,000 1260
CR Cadiz, Inc. - 50000 369 18,450,000 3151 CR Coachella Valley
Water District Indio, Mission Creek, Desert Hot Springs
300000 369 110,700,000 18904 More than 100 wells across district boundaries pump groundwater.
Total 1,272,835,615 217,354
CC=Central Coast, SC=South Coast, SF=San Francisco Bay, SJ=San Joaquin River, SL=South Lahontan, SR=Sacramento River, TL=Tulare
Lake, CR=Colorado River

G-1
APPENDIX G: List of Required Permits and Registrations
Note- not all of these may be applicable to all groundwater banking sites used for energy
storage.
Agency Permit / Registration
Criteria Comments
FERC – Federal Energy Regulatory Commission
Hydro exemption or license
Will need either a conduit exemption, a 10-MW exemption, or a license, depending upon characteristics of hydro generator
Consult FERC small hydro website: https://www.ferc.gov/industries/hydropower/gen-info/licensing/small-low-impact.asp
Qualifying Facility 80 MW or less using renewable generation
Form 556
EIA - Energy Information Administration
Generator Registration
1 MW or larger EIA Form 860
CAISO – California Independent System Operator
FNM – Full Network Model
1 MW or larger GRDT – Generation Resource Data Template
Interconnection If connected to transmission system
FERC wholesale interconnection application http://www.caiso.com/planning/Pages/GeneratorInterconnection/InterconnectionRequest/Default.aspx
NRI – New Resource Integration
1 MW or larger (occasionally 500 KW or larger)
http://www.caiso.com/Documents/NewResourceImplementationGuide.doc
CEC – California Energy Commission
Small Hydro Certification
Required for RPS (Renewable Portfolio Standard)
CEC RPS-1
Generating Unit ID 1 MW or larger CEC-1304 WREGIS – Western Renewable Energy Generation Information System
QRE (Qualified Reporting Entity) Generating Unit ID
Credit for RECs (Renewable Energy Certificates)
SWRCB – State Water
Nonconsumptive Water Use Right

G-2
Agency Permit / Registration
Criteria Comments
Resources Control Board 401 permit Water Quality
Certification
Electric Utility Interconnection If connected to Distribution System
PPA (Power Purchase Agreement)
If selling output to utility
Environmental Documents
CEQA (California Environmental Quality Act)
EIR (Environmental Impact Report)
USACE (U S Army Corps of Engineers) 404 permit
Discharge permit
CDFW (California Department Fish and Wildlife) 1602 permit
Streambed alteration permit
Source: (House L. W., 2017 b)

H-1
APPENDIX H: Willow Springs Water Bank Fact Sheet

H-2

H-3
I-1
APPENDIX I: Supplementary Documents for Pumped Storage Analysis at Willow Springs Water Bank – Attachments II-V
Appendix I is a separate document. Publication number CEC-500-2017-041-AP-I.