ground-water resources of dupage county, illinois - illinois state
TRANSCRIPT
STATE WATER SURVEY STATE GEOLOGICAL SURVEY
GROUND-WATER RESOURCES
OF DUPAGE COUNTY, ILLINOIS
Arthur J. Zeizel William C. Walton Robert T. Sasman Thomas A. Prickett
STATE OF ILLINOIS DEPARTMENT OF REGISTRATION AND EDUCATION
R A T I V E G R O U N D - W A T E R R E P O R T 2 llinois 1962
GROUND-WATER RESOURCES OF DUPAGE COUNTY, ILLINOIS
ARTHUR J. ZEIZEL, WILLIAM C. WALTON, ROBERT T. SASMAN, and THOMAS A. PRICKETT
STATE WATER SURVEY STATE GEOLOGICAL SURVEY
C O O P E R A T I V E G R O U N D - W A T E R R E P O R T 2
U R B A N A , I L L I N O I S 1962
S T A T E O F I L L I N O I S OTTO KERNER, Governor
DEPARTMENT OP REGISTRATION AND EDUCATION WILLIAM SYLVESTER W H I T E , Director
BOARD OF NATURAL RESOURCES AND CONSERVATION WILLIAM SYLVESTER W H I T E , Chairman
ROGER ADAMS, Ph.D., D.Se., LL.D., Chemistry
ROBERT H. ANDERSON, B.S., Engineering
WALTER H. NEWHOUSE, Ph.D., Geology
CHARLES E. OLMSTED, Ph.D., Botany
THOMAS PARK, Ph.D., Biology
DEAN WILLIAM L. EVERETT, E.E., Ph.D., University of Illinois
PRESIDENT DELYTE W. MORRIS, Ph.D., Southern Illinois University
STATE WATER SURVEY STATE GEOLOGICAL SURVEY WILLIAM C. ACKERMANN, Chief J O H N C. PRYE, Chief
Printed by Authority of the State of Illinois—IRS, Ch. 127, Par . 58.29
C O N T E N T S PAGE
Abstract 7 Introduction 7
Purpose and scope 7 Previous reports 8 Well numbering system 8 Acknowledgments 8
Geography 8 Location and general features 8 Topography and drainage 9 Climate 9 Population 12 Economy 12
Geology 13 General relations 13 Bedrock stratigraphy 13
Precambrian 13 Cambrian 16 Ordovician 18 Silurian . . 19
Alexandrian Series 19 Niagaran Series 19
Bedrock structure 20 History of the bedrock , 20 Bedrock topography 21 Unconsolidated deposits 21
Glacial drift 21 Topography 22 Composition 22
Recent deposits 24 Thickness 24 History 24
Relationship of geology to ground water 26 Glacial drift aquifers 26
Distribution 30 Silurian dolomite aquifer 30
Water-bearing properties 36 Niagaran aquifer 37
Basal unit 37 Alexandrian aquifer 39 Statistical analysis of geologic controls 39
Confining beds of the Maquoketa Formation 42 Cambrian-Ordovician aquifer 42 Confining beds of the Eau Claire Formation 45 Mt. Simon aquifer 45
Pumpage 47 Discharge from wells in glacial drift aquifers 48 Discharge from wells in Silurian dolomite aquifer 48
Public supplies 48 Industrial supplies 48 Domestic supplies 49 Distribution and density of pumpage 49 Future pumpage 50
Leakage through Maquoketa Formation 51 Discharge from wells in Cambrian-Ordovician and Mt. Simon aquifers 52
Hydrology of aquifers 52 Silurian dolomite aquifer 52
Hydraulic properties 52 Pumping tests 53 Specific capacity data 56
[ 3 ]
Piezometric surface 60 Water levels 62 Recharge 64 Probable yields of wells 66 Potential yield 67 Practical sustained yields of existing pumping centers 68
Glacial drift aquifers 69 Specific capacity data 70 Water levels 70 Recharge 70
Stream flow analysis 70 Potential yield 72
Cambrian-Ordovician and Mt. Simon aquifers 73 Hydraulic properties 73
Specific capacity data 73 Yields of individual bedrock units 74
Piezometric surface 75 Water levels 75 Practical sustained yield 76
Water quality 77 Glacial drift aquifers 78 Silurian dolomite aquifer 79 Cambrian-Ordovician and Mt. Simon aquifers 80
Well construction, development, and rehabilitation 81 Construction features of wells and pumps 81 Acid treatment of wells in dolomite 83 Shooting wells in sandstone to increase yields 85
Summary 85 Selected references 88 Appendix A Selected well reeords 90 Appendix B Reference wells and test borings 93 Appendix C Specific capacity data for wells in Silurian dolomite aquifer 97 Appendix D Water-level data for wells in the Silurian dolomite aquifer 99
I L L U S T R A T I O N S FIGURE PAGE
1 Location of DuPage County 9 2 Principal geographic features of DuPage County 10 3 Location of selected wells and test borings 11 4 Growth of population in DuPage County 12 5 Stratigraphic section, geohydrologie units, water-yielding properties of
the rocks, and character of ground water 14 6 Cross section of the bedrock with piezometric profiles added 16 7 Areal geology of the bedrock surface 17 8 Surficial geology 23 9 Thickness of unconsolidated deposits 25
10 Permeability of soils and nature of soil substrata 27 11 Distribution of surficial glacial drift aquifers 28 12 Cross sections of glacial deposits 29 13 Thickness of basal sand and gravel deposits, based on moving averages 31 14 Total thickness of sand and gravel deposits in glacial drift,
based on moving averages 32 15 Distribution of glacial drift aquifers 33 16 Thickness of Silurian dolomite aquifer 34 17 Aerial and ground views of joint-controlled solution cavities
in the Silurian dolomite aquifer 35 18 Number (A) and cumulative percentage (B) of wells versus depth
of penetration into Silurian dolomite aquifer 36 19 Thickness of Niagaran aquifer 38 20 Top elevation (A) and thickness (B) of the basal beds
of the Niagaran Series 39
[ 4 ]
FIGURE PAGE
21 Top elevation (A) and thickness (B) of the Alexandrian aquifer 40 22 Top elevation (A) and thickness (B) of the Maquoketa Formation 42 23 Lithologic character and thickness of the upper (A) , middle ( B ) , and
lower (0 ) units of the Maquoketa Formation . 43 24 Top elevation (A) and thickness (B) of the Glenwood-St. Peter Sandstone 44 25 Top elevation (A) and thickness (B) of the Ironton-Galesville Sandstone 45 26 Elevation of the top of the Mt. Simon aquifer 46 27 Pumpage from wells, 1890-1960 47 28 Pumpage from wells in Silurian dolomite aquifer, 1890–1960 48 29 Location of Silurian dolomite aquifer pumping centers 49 30 Pumpage from wells in Silurian dolomite aquifer in pumping
centers 1-4, 1890-1960 50 31 Pumpage from wells in Silurian dolomite aquifer in
pumping centers 5 and 6, 1890-1960 50 32 Pumpage from wells in Silurian dolomite aquifer in pumping
centers 7 and 8, 1890-1960 51 33 Pumpage from wells in Silurian dolomite aquifer in pumping
centers 9-12, 1890–1960 51 34 Pumpage from Canibrian-Ordovician and Mt. Simon aquifers, 1890-1960 52 35 Location of wells used in pumping test 1 54 36 Generalized graphic logs of wells used in pumping test 1 54 37 Water levels and pumpage during pumping test 1 54 38 Time-drawdown graph for well 16.6e, pumping test 1 55 39 Location of wells used in pumping test 2 55 40 Generalized graphic logs of wells used in pumping test 2 55 41 Pumping conditions during pumping test 2 55 42 Time-recovery graphs for wells 9.2e, 4.4b, and 10.5f, pumping test 2 56 43 Theoretical relation between specific capacity and the
coefficient of transmissibility 56 44 Step-drawdown test data and construction features of wells
40N10E-3.4e and 39N11E-7.1h 57 45 Step-drawdown test data and construction features of wells
39N10E-16.6e and 39N9E-13.6c 57 46 Step-drawdown test data and construction features of wells
40NllE-8.6b and 38N11E-8.7e 58 47 Step-drawdown test data and construction features of wells
38N9E-13.2h, 38N10E-18.3dl, and 38N10E-18.3d2 58 48 Well-loss constant versus specific capacity, pumping levels are above
the top of the Silurian dolomite aquifer 59 49 Well-loss constant versus specific capacity, pumping levels are below
the top of the Silurian dolomite aquifer 59 50 Specific capacity frequency graphs for dolomite wells 59 51 . Specific capacity frequency graphs for the units penetrated by wells 60 52 Piezometric surface of Silurian dolomite aquifer, August 1960 61 53 Areas influenced by withdrawals from wells in the Silurian dolomite aquifer 62 54 Water levels in well 39N11E-24.2g, 1959-1960 62 55 Water levels in wells in the Silurian dolomite aquifer, 1958-1959 62 56 Hydrographs of water levels in wells in the Silurian dolomite aquifer
in the West Chicago area, 1945-1960 63 57 Hydrograph of water levels in a well in the Silurian dolomite aquifer in the
Wheaton-Glen Ellyn-Lombard pumping center, 1945-1960 63 58 Hydrographs of water levels in wells in the Silurian dolomite aquifer in the
Downers Grove area (A) and Hinsdale area (B) , 1942-1960 63 59 Hydrographs of water levels in wells in the Silurian dolomite
aquifer in the Argonne area, 1948-1960 63 60 Location of selected observation wells in the Silurian dolomite aquifer 64 61 Selected areas influenced by withdrawals from wells in the
Silurian dolomite aquifer 64 62 Cross sections of the Silurian dolomite aquifer in the (A) West Chicago
area, (B) Wheaton-Glen Ellyn-Lombard area, (C) Downers Grove-Hinsdale area, and (D) Argonne area 65
[ 5 ]
FIGURE PAGE
63 Estimated recharge rates for the Silurian dolomite aquifer 66 64 Estimated specific capacities of wells in the Silurian dolomite aquifer 67 65 Estimated yields of wells in the Silurian dolomite aquifer 67 66 Relationship of glacial drift aquifers to dolomite aquifers 69 67 Water levels in wells in the glacial drift aquifers, 1958-1959 70 68 Water levels in well 38N9E-22.3f, 1959-1960 ' 71 69 Special study drainage basins in the Chicago region 71 70 Stream flow at Western Springs gaging station, Salt Creek
drainage basin, 1955 71 71 Estimated recharge rates for the glacial drift aquifers 73 72 Elevation of piezometric surface of Cambrian-Ordovician aquifer,
. October 1960 75 73 Decline of artesian pressure in Cambrian-Ordovician aquifer, 1864-1960 76 74 Water levels in deep sandstone wells at Villa Park, Elmhurst,
and Bensenville, 1945-1960 76 75 Hardness of water from the Silurian dolomite aquifer 79 76 Sulfate content of water from the Silurian dolomite aquifer 80 77 Hardness of water from Cambrian-Ordovician aquifer 80 78 Sulfate content of water from the Cambrian-Ordovician aquifer 81 79 Construction features of selected wells in Silurian dolomite aquifer (A)
and Cambrian-Ordovician and. Mt. Simon aquifers (B) 82 Plate 1 Topography of bedrock surface in DuPage County, Illinois In pocket
TABLES TABLE PAGE
1 Monthly and annual climatic data 12 2 Population of DuPage County by township 13 3 Trend of joint systems 20 4 Rate of penetration of water into soils by permeability class . 29 5 Occurrence and thickness of basal sand and gravel 30 6. Well categories, geologic controls, and specific capacity forms 41 7 Distribution of pumpage from wells in 1960, subdivided by source and use . . 47 8 Distribution of pumpage from wells in the Silurian dolomite aquifer
in 1960, subdivided by use 49 9 Geographic distribution and density of pumpage from wells
in Silurian dolomite aquifer in 1960 50 10 Water levels in wells in the Silurian dolomite aquifer for
the period 1907-1939 and for 1960 63 11 Rates of reeharge to the Silurian dolomite aquifer . . . . 65 12 Data on response of the Silurian dolomite aquifer to heavy pumping 68 13 Estimated practical sustained yields of pumping centers 69 14 Specific capacity data for wells in the glacial drift aquifers 70 15 Estimated annual ground-water and surface runoff from DuPage River
and Salt Creek drainage basins 71 16 Annual ground-water runoff adjusted for sewage from DuPage River
and Salt Creek drainage basins 72 17 Coefficients of transmissibility of the Cambrian-Ordovician aquifer 73 18 Specific capacity data for wells in the Cambrian-Ordovician
and Mt. Simon aquifers 74 19 Water levels in deep sandstone wells in 1960 .....................................75 20 Chemical analyses of water from wells in the glacial drift aquifers 77 21 Chemical analyses of water from wells in the Silurian dolomite aquifer 77 22 Chemical analyses of water from deep sandstone wells 79 23 Construction features of selected wells in the Silurian dolomite aquifer 82 24 Construction features of selected wells in the Cambrian-Ordovician
and. Mt. Simon , aquifers . . . . . . . . . . . . . . . . . . . . . . . . . . . . . . . . . . . . . . . . . 8325 Description of pumps in selected wells in the Silurian dolomite aquifer 83 26 Description of pumps in selected wells in the Cambrian-
Ordovician and Mt. Simon aquifers 84 27 Results of acid treatment of wells in the Silurian dolomite aquifer 84
[ 6 ]
GROUND-WATER RESOURCES OF DUPAGE COUNTY, ILLINOIS
ARTHUR J. ZEIZEL, WILLIAM C. WALTON, ROBERT T. SASMAN, and THOMAS A. PRICKETT
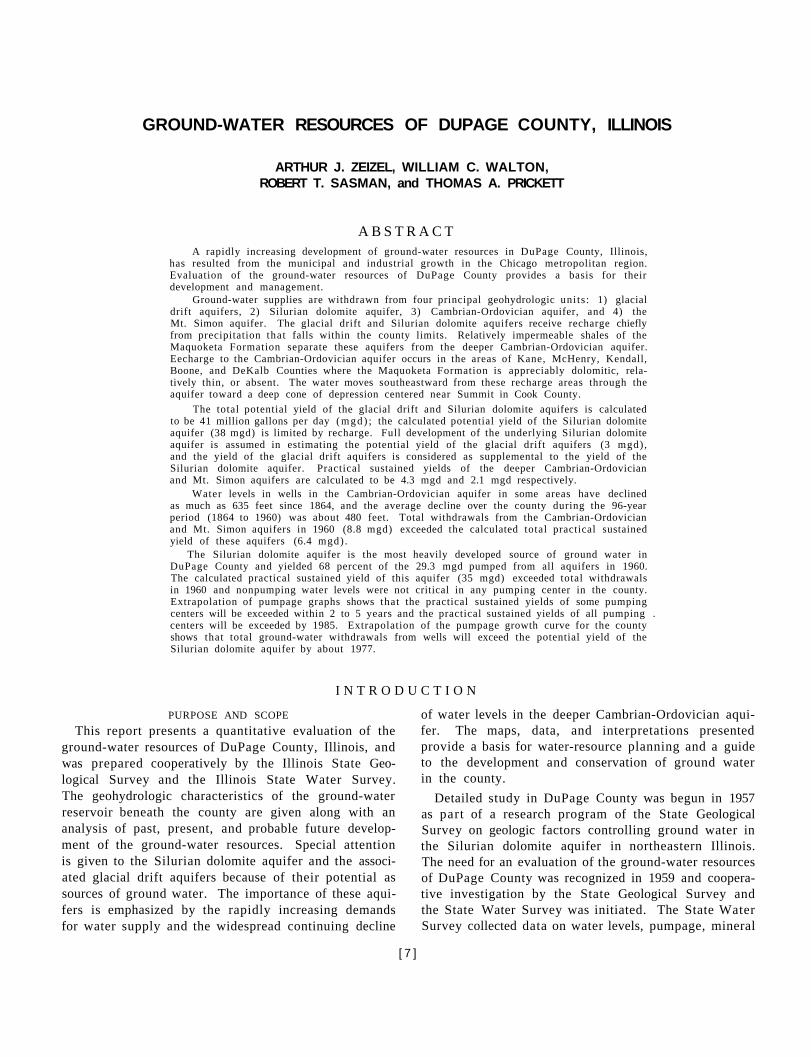
A B S T R A C T A rapidly increasing development of ground-water resources in DuPage County, Illinois,
has resulted from the municipal and industrial growth in the Chicago metropolitan region. Evaluation of the ground-water resources of DuPage County provides a basis for their development and management.
Ground-water supplies are withdrawn from four principal geohydrologic units : 1) glacial drift aquifers, 2) Silurian dolomite aquifer, 3) Cambrian-Ordovician aquifer, and 4) the Mt. Simon aquifer. The glacial drift and Silurian dolomite aquifers receive recharge chiefly from precipitation that falls within the county limits. Relatively impermeable shales of the Maquoketa Formation separate these aquifers from the deeper Cambrian-Ordovician aquifer. Eecharge to the Cambrian-Ordovician aquifer occurs in the areas of Kane, McHenry, Kendall, Boone, and DeKalb Counties where the Maquoketa Formation is appreciably dolomitic, relatively thin, or absent. The water moves southeastward from these recharge areas through the aquifer toward a deep cone of depression centered near Summit in Cook County.
The total potential yield of the glacial drift and Silurian dolomite aquifers is calculated to be 41 million gallons per day ( m g d ) ; the calculated potential yield of the Silurian dolomite aquifer (38 mgd) is limited by recharge. Full development of the underlying Silurian dolomite aquifer is assumed in estimating the potential yield of the glacial drift aquifers (3 mgd), and the yield of the glacial drift aquifers is considered as supplemental to the yield of the Silurian dolomite aquifer. Practical sustained yields of the deeper Cambrian-Ordovician and Mt. Simon aquifers are calculated to be 4.3 mgd and 2.1 mgd respectively.
Water levels in wells in the Cambrian-Ordovician aquifer in some areas have declined as much as 635 feet since 1864, and the average decline over the county during the 96-year period (1864 to 1960) was about 480 feet. Total withdrawals from the Cambrian-Ordovician and Mt. Simon aquifers in 1960 (8.8 mgd) exceeded the calculated total practical sustained yield of these aquifers (6.4 mgd) .
The Silurian dolomite aquifer is the most heavily developed source of ground water in DuPage County and yielded 68 percent of the 29.3 mgd pumped from all aquifers in 1960. The calculated practical sustained yield of this aquifer (35 mgd) exceeded total withdrawals in 1960 and nonpumping water levels were not critical in any pumping center in the county. Extrapolation of pumpage graphs shows that the practical sustained yields of some pumping centers will be exceeded within 2 to 5 years and the practical sustained yields of all pumping . centers will be exceeded by 1985. Extrapolation of the pumpage growth curve for the county shows that total ground-water withdrawals from wells will exceed the potential yield of the Silurian dolomite aquifer by about 1977.
I N T R O D U C T I O N
PURPOSE AND SCOPE This report presents a quantitative evaluation of the
ground-water resources of DuPage County, Illinois, and was prepared cooperatively by the Illinois State Geological Survey and the Illinois State Water Survey. The geohydrologic characteristics of the ground-water reservoir beneath the county are given along with an analysis of past, present, and probable future development of the ground-water resources. Special attention is given to the Silurian dolomite aquifer and the associated glacial drift aquifers because of their potential as sources of ground water. The importance of these aquifers is emphasized by the rapidly increasing demands for water supply and the widespread continuing decline
of water levels in the deeper Cambrian-Ordovician aquifer. The maps, data, and interpretations presented provide a basis for water-resource planning and a guide to the development and conservation of ground water in the county.
Detailed study in DuPage County was begun in 1957 as part of a research program of the State Geological Survey on geologic factors controlling ground water in the Silurian dolomite aquifer in northeastern Illinois. The need for an evaluation of the ground-water resources of DuPage County was recognized in 1959 and cooperative investigation by the State Geological Survey and the State Water Survey was initiated. The State Water Survey collected data on water levels, pumpage, mineral
[ 7 ]
8 DUPAGE COUNTY GROUND-WATER RESOURCES
quality of water, and well tests. Well logs, drilling samples, geophysical logs, and other geologic information were provided by the State Geological Survey.
PREVIOUS REPORTS General information on the ground-water resources
of DuPage County is included in reports on: The Artesian Waters in Northeastern Illinois (Anderson, 1919), The Groundwater Possibilities in Northeastern Illinois (Bergstrom et al., 1955), and Preliminary Report on Ground-Water Resources of the Chicago Region, Illinois (Suter et al., 1959). Other published and unpublished reports which contain information on the water resources and the geology of the county are listed in the Selected References at the end of this report.
WELL NUMBERING SYSTEM
The well numbering system used in this report is based on the location of the well and on the system of rectangular surveys of the U. S. Government for identification.
The well number has five parts: county abbreviation, township, range, section, and coordinates (number and letter) that give location within the section. Sections are divided into one-eighth mile squares with each square containing 10 acres. A normal section of one square mile contains eight rows of eighth-mile squares: an odd-size section has more or fewer rows. Squares are numbered from east to west and lettered from south to north starting at the southeast corner as illustrated:
DuPage County T39N, R9E, sec. 30
The well number of the well shown is DUP 39N9E-30.6f. When more than one well is in a 10-acre square they are identified by arabic numbers after the lower case letter in the well number.
ACKNOWLEDGMENTS The basic geologic and hydrologic data upon which
this report depends were provided through the cooperation of many county, municipal, and industrial officials,
engineers, water-well contractors, and well owners. Special thanks are due Orville L. Meyer, former Chief Engineer of the DuPage County Health Department, for the many valuable logs of water wells made available during the investigation.
The U. S. Geological Survey supplied logs, hydro-graphs of wells, and pumping test data from Argonne National Laboratory and arranged for the loan of the deep-well current meter used in the geophysical investigation. The Illinois Division of Waterways installed and furnished data from stream gages.
The geological and geophysical studies incorporated in this report were conducted by the State Geological Survey. Discussion of the units below the Maquoketa Formation has been modified for DuPage County from Cooperative Ground-Water Report 1 (Suter et al., 1959). The hydrologic and water chemistry studies were made by the State Water Survey.
Arthur J. Zeizel, of the State Geological Survey, was responsible for the processing and analysis of the geologic and geophysical data and assisted in geohydrologic interpretations. The authors of the State Water Survey participated in the following manner: William C. Walton supervised computation and analysis of the hydro-logic and chemical data and assisted in geohydrologic interpretations; Robert T. Sasman collected, processed, and analyzed water level and pumpage data; Thomas A. Prickett processed and aided in the analysis of basic hydrologic data, made most of the hydrologic computations, and assisted in geohydrologic interpretations.
Many present and former members of both agencies have assisted in the preparation of the report and in the collection and processing of data. Among these are George B. Maxe'y, James E. Hackett, Robert E. Bergstrom, Grover H. Emrich, Francis Wobber, Lowell A. Reed, and Richard Cannon of the staff of the Geological Survey and Harmon F. Smith, Jacob S. Randall, Richard J. Schicht, George E. Reitz, William H. Baker, Sandor Csallany, Robert R. Russell, and W J Wood of the Engineering staff of the State Water Survey.
The chemical analyses of water from wells were made by the Chemistry Section of the Water Survey. Sections on climate and statistical analysis of geologic controls were prepared, in large part, by Stanley A. Changnon and James C. Neill, respectively, both of the Water Survey.
G E O G R A P H Y LOCATION AND GENERAL FEATURES
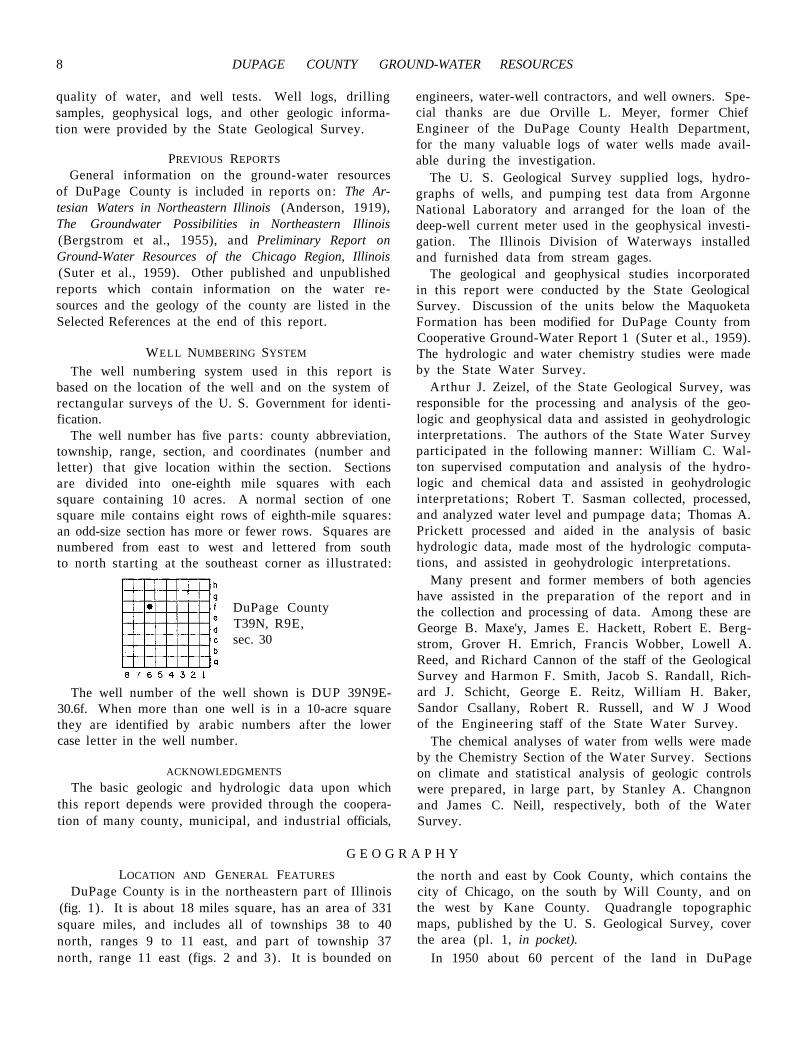
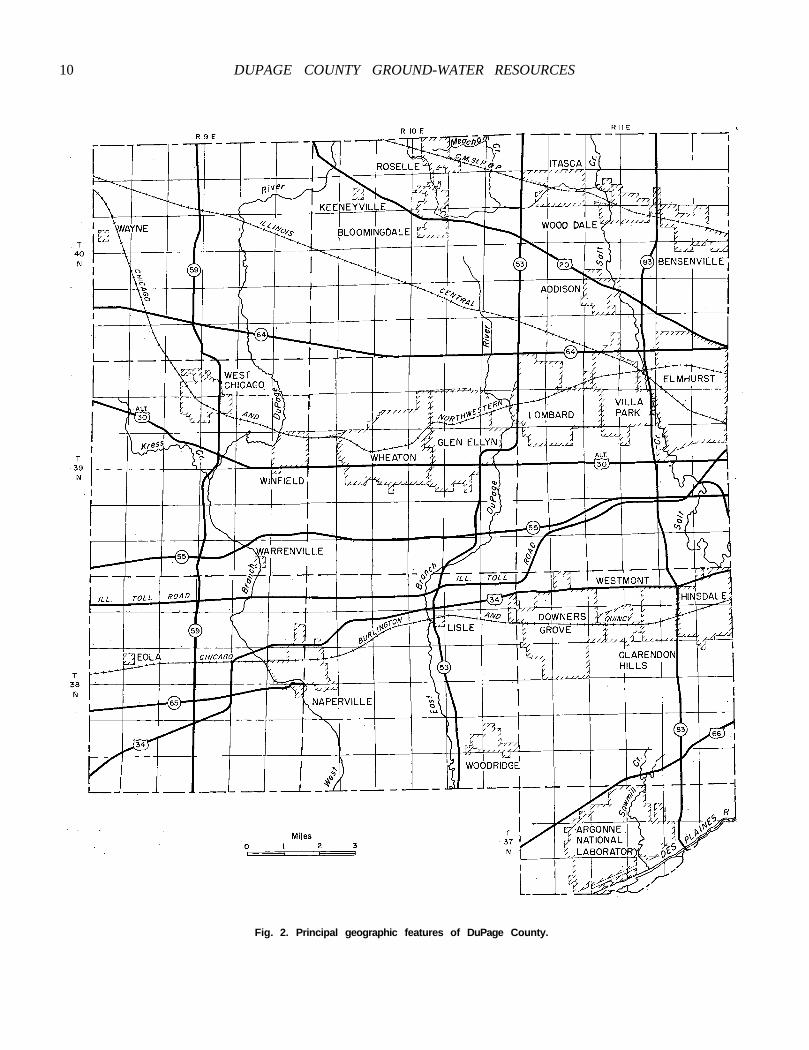
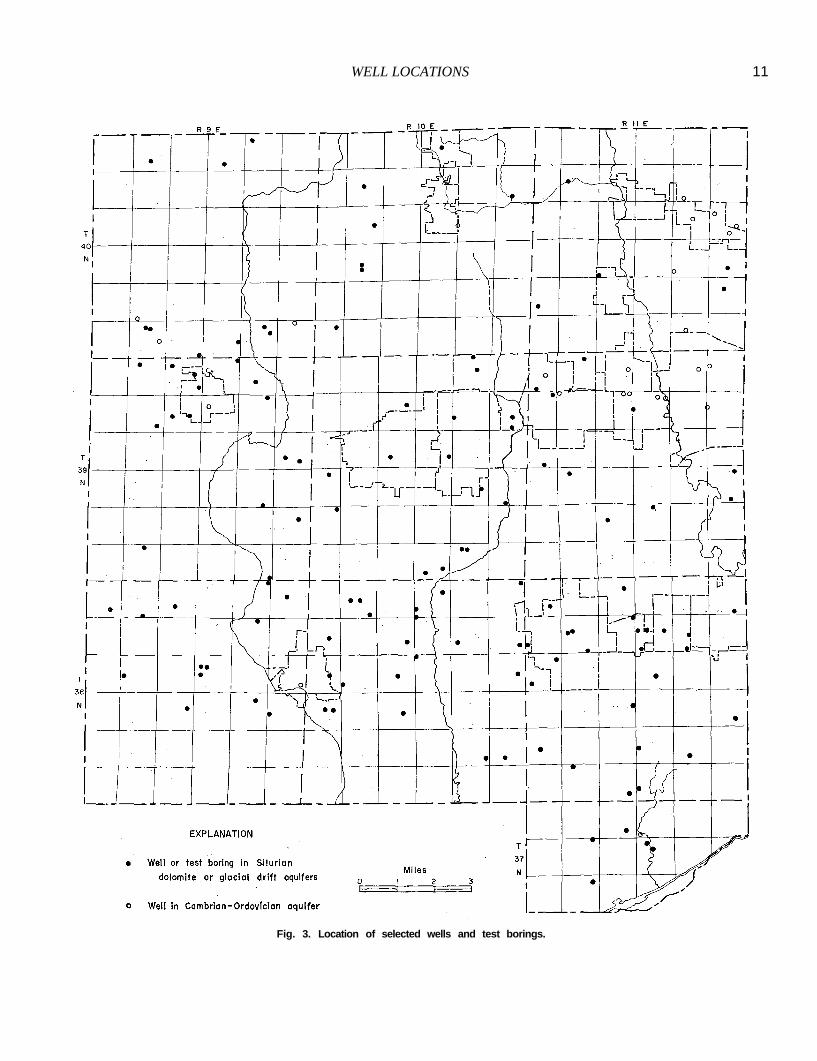
DuPage County is in the northeastern part of Illinois (fig. 1). It is about 18 miles square, has an area of 331 square miles, and includes all of townships 38 to 40 north, ranges 9 to 11 east, and part of township 37 north, range 11 east (figs. 2 and 3). It is bounded on
the north and east by Cook County, which contains the city of Chicago, on the south by Will County, and on the west by Kane County. Quadrangle topographic maps, published by the U. S. Geological Survey, cover the area (pl. 1, in pocket).
In 1950 about 60 percent of the land in DuPage
CLIMATE 9
Fig. 1. Location of DuPage County.
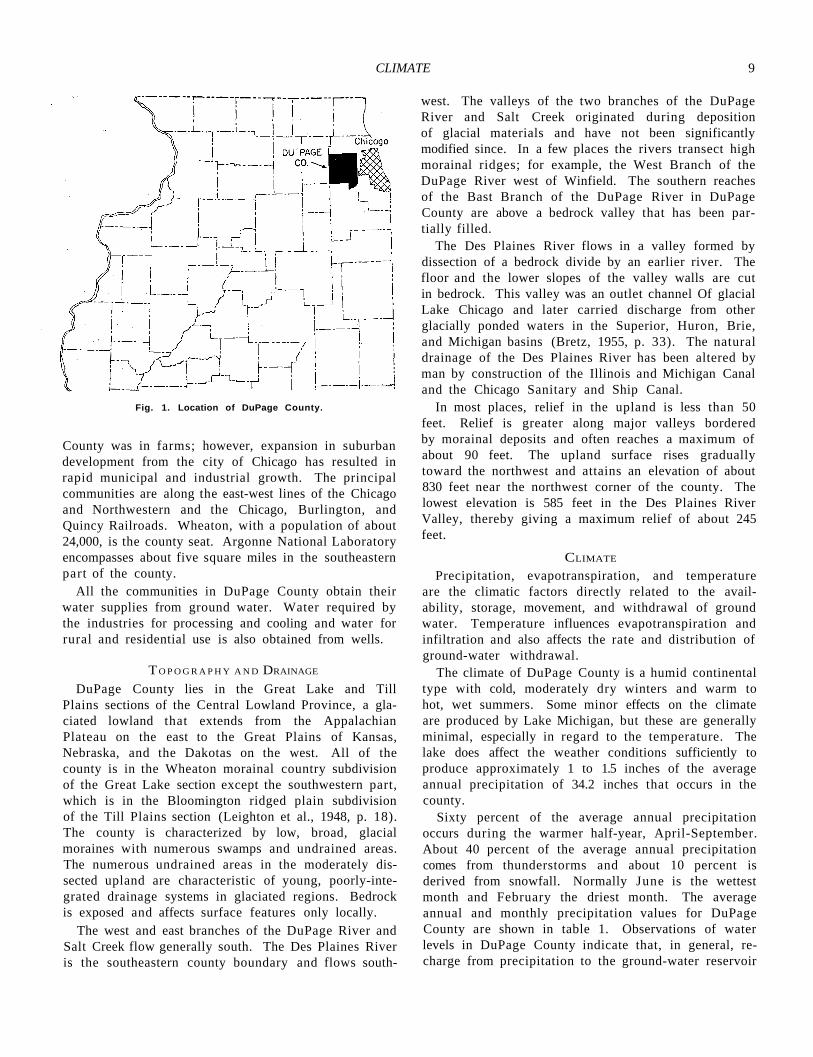
County was in farms; however, expansion in suburban development from the city of Chicago has resulted in rapid municipal and industrial growth. The principal communities are along the east-west lines of the Chicago and Northwestern and the Chicago, Burlington, and Quincy Railroads. Wheaton, with a population of about 24,000, is the county seat. Argonne National Laboratory encompasses about five square miles in the southeastern part of the county.
All the communities in DuPage County obtain their water supplies from ground water. Water required by the industries for processing and cooling and water for rural and residential use is also obtained from wells.
T O P O G R A P H Y A N D DRAINAGE
DuPage County lies in the Great Lake and Till Plains sections of the Central Lowland Province, a glaciated lowland that extends from the Appalachian Plateau on the east to the Great Plains of Kansas, Nebraska, and the Dakotas on the west. All of the county is in the Wheaton morainal country subdivision of the Great Lake section except the southwestern part, which is in the Bloomington ridged plain subdivision of the Till Plains section (Leighton et al., 1948, p. 18). The county is characterized by low, broad, glacial moraines with numerous swamps and undrained areas. The numerous undrained areas in the moderately dissected upland are characteristic of young, poorly-integrated drainage systems in glaciated regions. Bedrock is exposed and affects surface features only locally.
The west and east branches of the DuPage River and Salt Creek flow generally south. The Des Plaines River is the southeastern county boundary and flows south
west. The valleys of the two branches of the DuPage River and Salt Creek originated during deposition of glacial materials and have not been significantly modified since. In a few places the rivers transect high morainal ridges; for example, the West Branch of the DuPage River west of Winfield. The southern reaches of the Bast Branch of the DuPage River in DuPage County are above a bedrock valley that has been partially filled.
The Des Plaines River flows in a valley formed by dissection of a bedrock divide by an earlier river. The floor and the lower slopes of the valley walls are cut in bedrock. This valley was an outlet channel Of glacial Lake Chicago and later carried discharge from other glacially ponded waters in the Superior, Huron, Brie, and Michigan basins (Bretz, 1955, p. 33). The natural drainage of the Des Plaines River has been altered by man by construction of the Illinois and Michigan Canal and the Chicago Sanitary and Ship Canal.
In most places, relief in the upland is less than 50 feet. Relief is greater along major valleys bordered by morainal deposits and often reaches a maximum of about 90 feet. The upland surface rises gradually toward the northwest and attains an elevation of about 830 feet near the northwest corner of the county. The lowest elevation is 585 feet in the Des Plaines River Valley, thereby giving a maximum relief of about 245 feet.
CLIMATE
Precipitation, evapotranspiration, and temperature are the climatic factors directly related to the availability, storage, movement, and withdrawal of ground water. Temperature influences evapotranspiration and infiltration and also affects the rate and distribution of ground-water withdrawal.
The climate of DuPage County is a humid continental type with cold, moderately dry winters and warm to hot, wet summers. Some minor effects on the climate are produced by Lake Michigan, but these are generally minimal, especially in regard to the temperature. The lake does affect the weather conditions sufficiently to produce approximately 1 to 1.5 inches of the average annual precipitation of 34.2 inches that occurs in the county.
Sixty percent of the average annual precipitation occurs during the warmer half-year, April-September. About 40 percent of the average annual precipitation comes from thunderstorms and about 10 percent is derived from snowfall. Normally June is the wettest month and February the driest month. The average annual and monthly precipitation values for DuPage County are shown in table 1. Observations of water levels in DuPage County indicate that, in general, re-charge from precipitation to the ground-water reservoir
10 DUPAGE COUNTY GROUND-WATER RESOURCES
Fig. 2. Principal geographic features of DuPage County.
WELL LOCATIONS 11
Fig. 3. Location of selected wells and test borings.
12 DUPAGE COUNTY GROUND-WATER RESOURCES
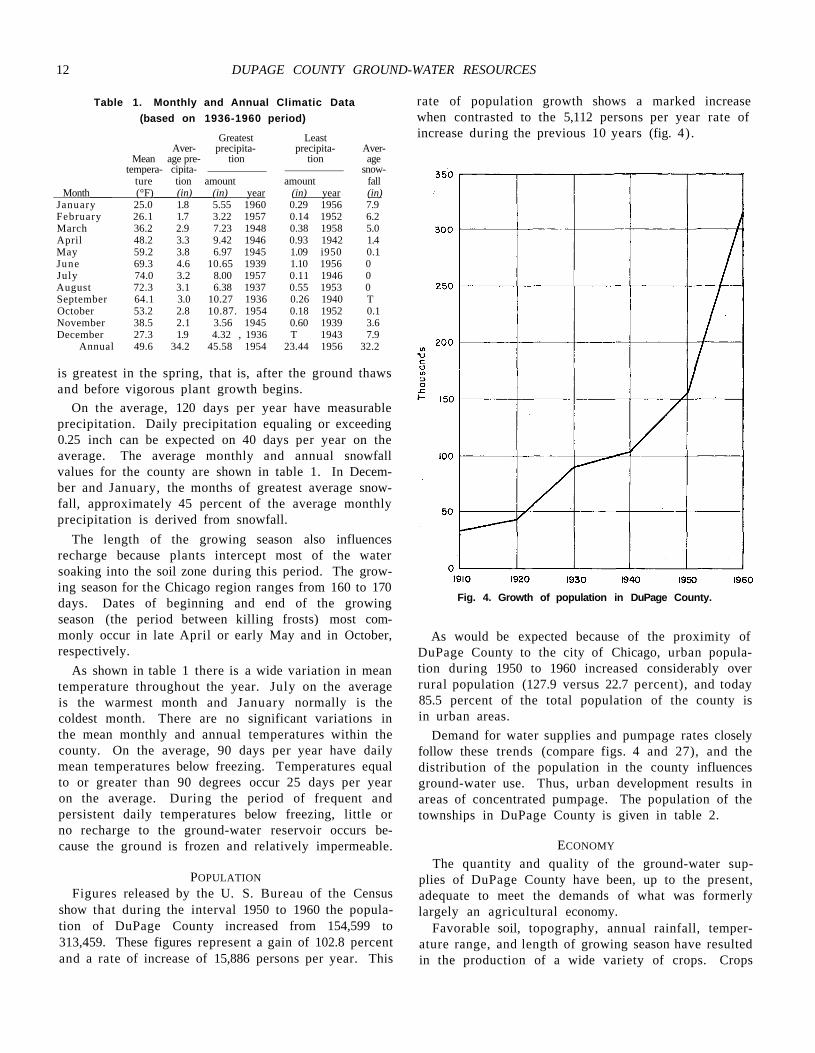
Table 1. Monthly and Annual Climatic Data (based on 1936-1960 period)
Greatest Least Aver- precipita- precipita- Aver-
Mean age pre- tion tion age tempera- cipita- snow-
ture tion amount amount fall Month (°F) (in) (in) year (in) year (in)
January 25.0 1.8 5.55 1960 0.29 1956 7.9 February 26.1 1.7 3.22 1957 0.14 1952 6.2 March 36.2 2.9 7.23 1948 0.38 1958 5.0 April 48.2 3.3 9.42 1946 0.93 1942 1.4 May 59.2 3.8 6.97 1945 1.09 i950 0.1 June 69.3 4.6 10.65 1939 1.10 1956 0 July 74.0 3.2 8.00 1957 0.11 1946 0 August 72.3 3.1 6.38 1937 0.55 1953 0 September 64.1 3.0 10.27 1936 0.26 1940 T October 53.2 2.8 10.87. 1954 0.18 1952 0.1 November 38.5 2.1 3.56 1945 0.60 1939 3.6 December 27.3 1.9 4.32 , 1936 T 1943 7.9
Annual 49.6 34.2 45.58 1954 23.44 1956 32.2
is greatest in the spring, that is, after the ground thaws and before vigorous plant growth begins.
On the average, 120 days per year have measurable precipitation. Daily precipitation equaling or exceeding 0.25 inch can be expected on 40 days per year on the average. The average monthly and annual snowfall values for the county are shown in table 1. In December and January, the months of greatest average snow-fall, approximately 45 percent of the average monthly precipitation is derived from snowfall.
The length of the growing season also influences recharge because plants intercept most of the water soaking into the soil zone during this period. The growing season for the Chicago region ranges from 160 to 170 days. Dates of beginning and end of the growing season (the period between killing frosts) most commonly occur in late April or early May and in October, respectively.
As shown in table 1 there is a wide variation in mean temperature throughout the year. July on the average is the warmest month and January normally is the coldest month. There are no significant variations in the mean monthly and annual temperatures within the county. On the average, 90 days per year have daily mean temperatures below freezing. Temperatures equal to or greater than 90 degrees occur 25 days per year on the average. During the period of frequent and persistent daily temperatures below freezing, little or no recharge to the ground-water reservoir occurs because the ground is frozen and relatively impermeable.
POPULATION Figures released by the U. S. Bureau of the Census
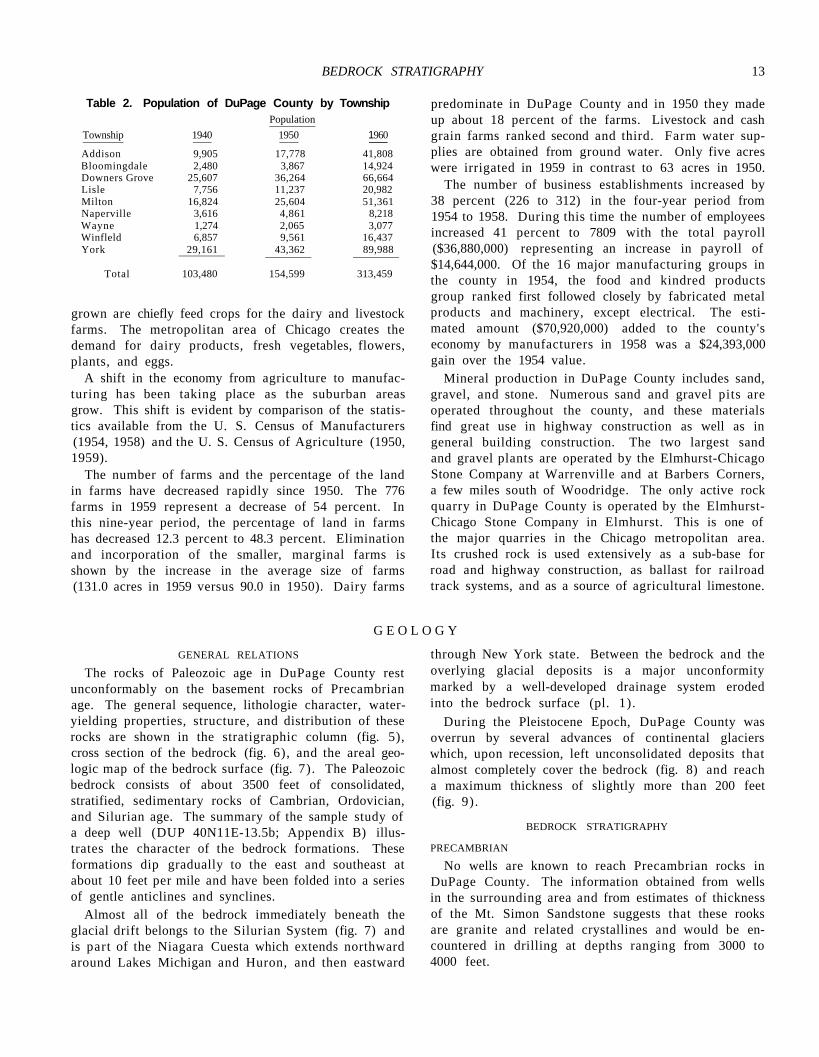
show that during the interval 1950 to 1960 the population of DuPage County increased from 154,599 to 313,459. These figures represent a gain of 102.8 percent and a rate of increase of 15,886 persons per year. This
rate of population growth shows a marked increase when contrasted to the 5,112 persons per year rate of increase during the previous 10 years (fig. 4).
Fig. 4. Growth of population in DuPage County.
As would be expected because of the proximity of DuPage County to the city of Chicago, urban population during 1950 to 1960 increased considerably over rural population (127.9 versus 22.7 percent), and today 85.5 percent of the total population of the county is in urban areas.
Demand for water supplies and pumpage rates closely follow these trends (compare figs. 4 and 27), and the distribution of the population in the county influences ground-water use. Thus, urban development results in areas of concentrated pumpage. The population of the townships in DuPage County is given in table 2.
ECONOMY
The quantity and quality of the ground-water supplies of DuPage County have been, up to the present, adequate to meet the demands of what was formerly largely an agricultural economy.
Favorable soil, topography, annual rainfall, temperature range, and length of growing season have resulted in the production of a wide variety of crops. Crops
BEDROCK STRATIGRAPHY 13
Table 2. Population of DuPage County by Township Population
Township 1940 1950 1960
Addison 9,905 17,778 41,808 Bloomingdale 2,480 3,867 14,924 Downers Grove 25,607 36,264 66,664 Lisle 7,756 11,237 20,982 Milton 16,824 25,604 51,361 Naperville 3,616 4,861 8,218 Wayne 1,274 2,065 3,077 Winfleld 6,857 9,561 16,437 York 29,161 43,362 89,988
Total 103,480 154,599 313,459
grown are chiefly feed crops for the dairy and livestock farms. The metropolitan area of Chicago creates the demand for dairy products, fresh vegetables, flowers, plants, and eggs.
A shift in the economy from agriculture to manufacturing has been taking place as the suburban areas grow. This shift is evident by comparison of the statistics available from the U. S. Census of Manufacturers (1954, 1958) and the U. S. Census of Agriculture (1950, 1959).
The number of farms and the percentage of the land in farms have decreased rapidly since 1950. The 776 farms in 1959 represent a decrease of 54 percent. In this nine-year period, the percentage of land in farms has decreased 12.3 percent to 48.3 percent. Elimination and incorporation of the smaller, marginal farms is shown by the increase in the average size of farms (131.0 acres in 1959 versus 90.0 in 1950). Dairy farms
predominate in DuPage County and in 1950 they made up about 18 percent of the farms. Livestock and cash grain farms ranked second and third. Farm water supplies are obtained from ground water. Only five acres were irrigated in 1959 in contrast to 63 acres in 1950.
The number of business establishments increased by 38 percent (226 to 312) in the four-year period from 1954 to 1958. During this time the number of employees increased 41 percent to 7809 with the total payroll ($36,880,000) representing an increase in payroll of $14,644,000. Of the 16 major manufacturing groups in the county in 1954, the food and kindred products group ranked first followed closely by fabricated metal products and machinery, except electrical. The estimated amount ($70,920,000) added to the county's economy by manufacturers in 1958 was a $24,393,000 gain over the 1954 value.
Mineral production in DuPage County includes sand, gravel, and stone. Numerous sand and gravel pits are operated throughout the county, and these materials find great use in highway construction as well as in general building construction. The two largest sand and gravel plants are operated by the Elmhurst-Chicago Stone Company at Warrenville and at Barbers Corners, a few miles south of Woodridge. The only active rock quarry in DuPage County is operated by the Elmhurst-Chicago Stone Company in Elmhurst. This is one of the major quarries in the Chicago metropolitan area. Its crushed rock is used extensively as a sub-base for road and highway construction, as ballast for railroad track systems, and as a source of agricultural limestone.
G E O L O G Y
GENERAL RELATIONS
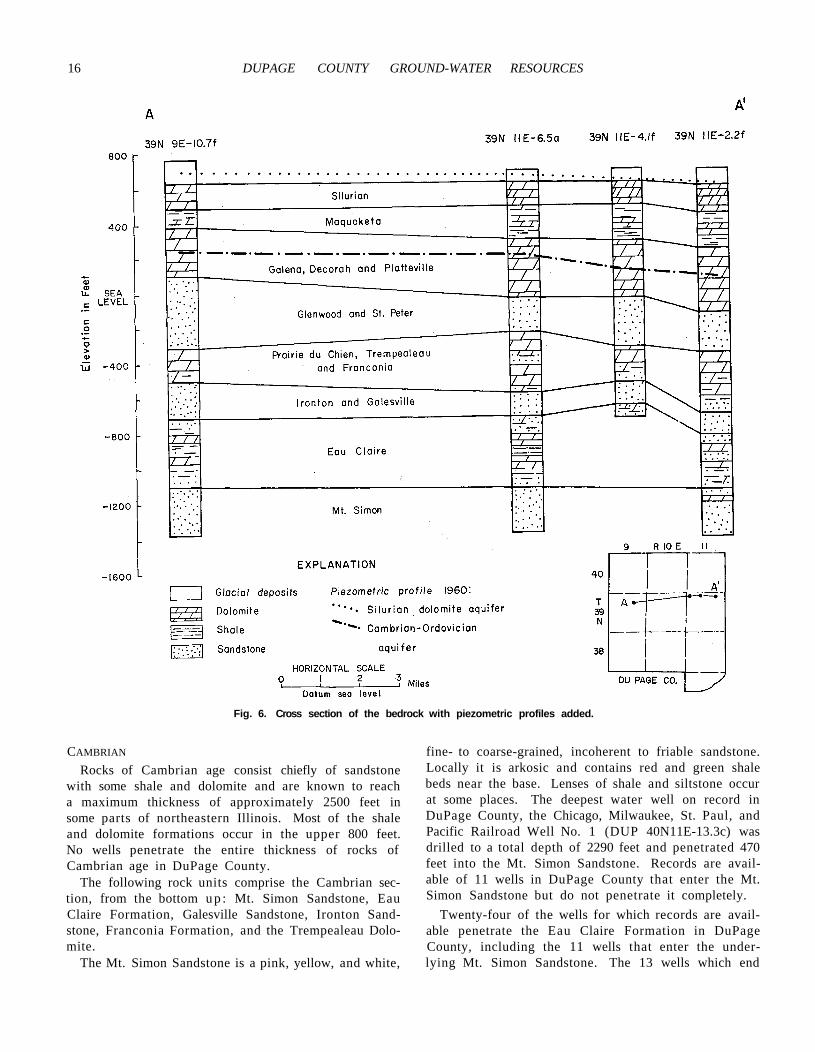
The rocks of Paleozoic age in DuPage County rest unconformably on the basement rocks of Precambrian age. The general sequence, lithologie character, water-yielding properties, structure, and distribution of these rocks are shown in the stratigraphic column (fig. 5), cross section of the bedrock (fig. 6), and the areal geologic map of the bedrock surface (fig. 7). The Paleozoic bedrock consists of about 3500 feet of consolidated, stratified, sedimentary rocks of Cambrian, Ordovician, and Silurian age. The summary of the sample study of a deep well (DUP 40N11E-13.5b; Appendix B) illustrates the character of the bedrock formations. These formations dip gradually to the east and southeast at about 10 feet per mile and have been folded into a series of gentle anticlines and synclines.
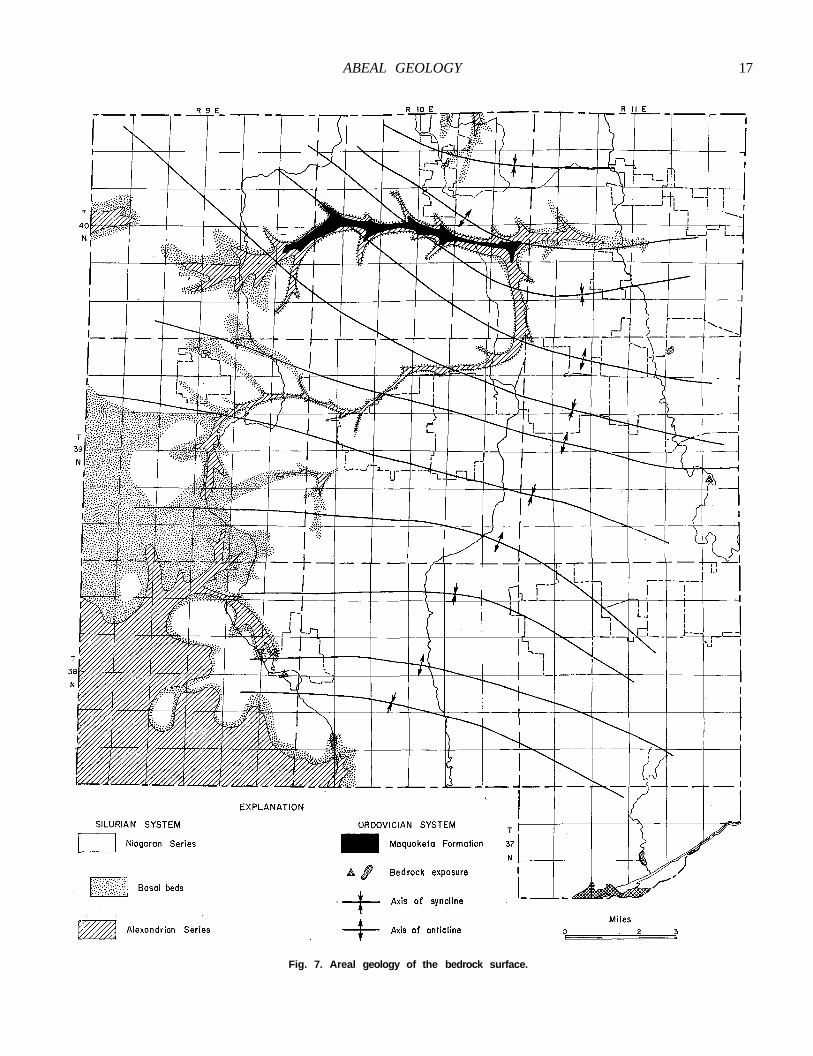
Almost all of the bedrock immediately beneath the glacial drift belongs to the Silurian System (fig. 7) and is part of the Niagara Cuesta which extends northward around Lakes Michigan and Huron, and then eastward
through New York state. Between the bedrock and the overlying glacial deposits is a major unconformity marked by a well-developed drainage system eroded into the bedrock surface (pl. 1).
During the Pleistocene Epoch, DuPage County was overrun by several advances of continental glaciers which, upon recession, left unconsolidated deposits that almost completely cover the bedrock (fig. 8) and reach a maximum thickness of slightly more than 200 feet (fig. 9).
BEDROCK STRATIGRAPHY
PRECAMBRIAN
No wells are known to reach Precambrian rocks in DuPage County. The information obtained from wells in the surrounding area and from estimates of thickness of the Mt. Simon Sandstone suggests that these rooks are granite and related crystallines and would be encountered in drilling at depths ranging from 3000 to 4000 feet.
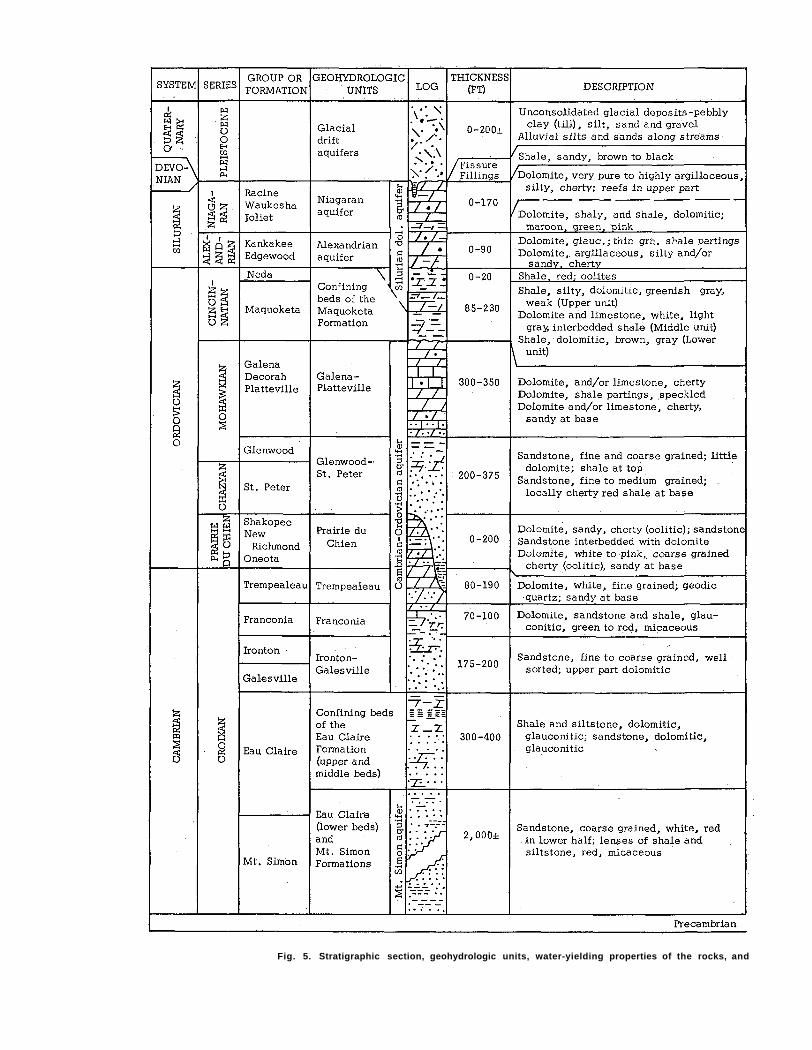
Fig. 5. Stratigraphic section, geohydrologic units, water-yielding properties of the rocks, and
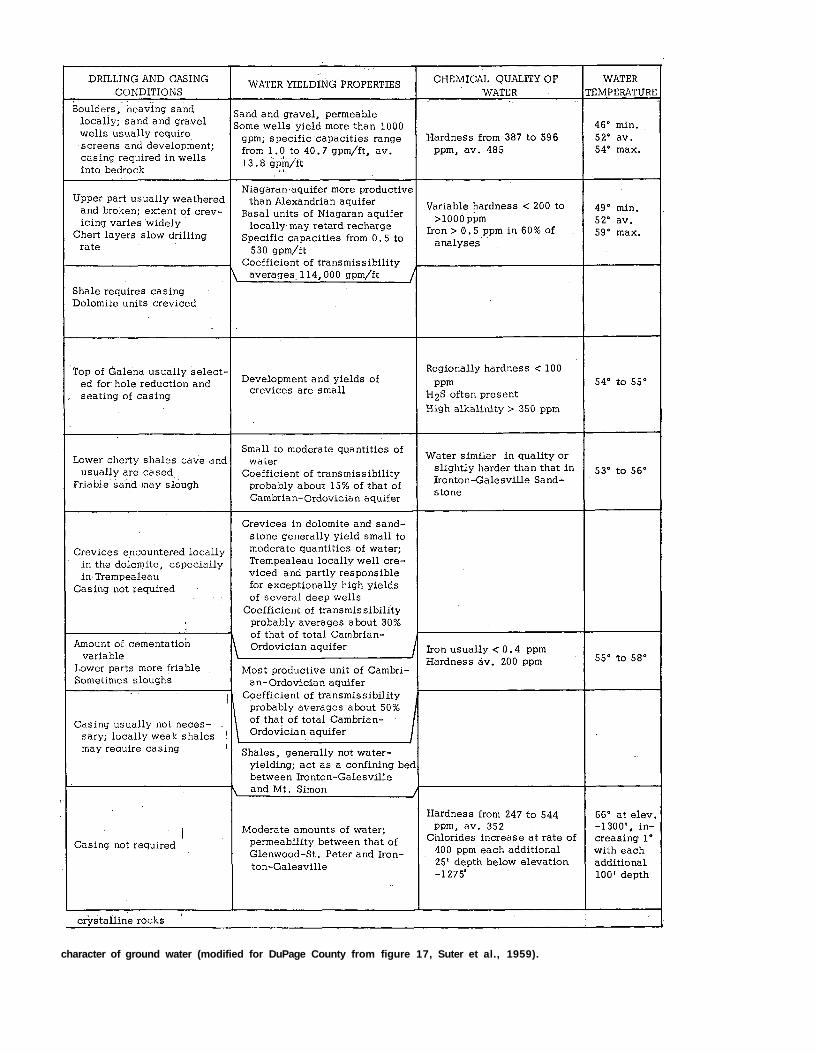
character of ground water (modified for DuPage County from figure 17, Suter et al., 1959).
16 DUPAGE COUNTY GROUND-WATER RESOURCES
Fig. 6. Cross section of the bedrock with piezometric profiles added.
CAMBRIAN
Rocks of Cambrian age consist chiefly of sandstone with some shale and dolomite and are known to reach a maximum thickness of approximately 2500 feet in some parts of northeastern Illinois. Most of the shale and dolomite formations occur in the upper 800 feet. No wells penetrate the entire thickness of rocks of Cambrian age in DuPage County.
The following rock units comprise the Cambrian section, from the bottom u p : Mt. Simon Sandstone, Eau Claire Formation, Galesville Sandstone, Ironton Sandstone, Franconia Formation, and the Trempealeau Dolomite.
The Mt. Simon Sandstone is a pink, yellow, and white,
fine- to coarse-grained, incoherent to friable sandstone. Locally it is arkosic and contains red and green shale beds near the base. Lenses of shale and siltstone occur at some places. The deepest water well on record in DuPage County, the Chicago, Milwaukee, St. Paul, and Pacific Railroad Well No. 1 (DUP 40N11E-13.3c) was drilled to a total depth of 2290 feet and penetrated 470 feet into the Mt. Simon Sandstone. Records are available of 11 wells in DuPage County that enter the Mt. Simon Sandstone but do not penetrate it completely.
Twenty-four of the wells for which records are available penetrate the Eau Claire Formation in DuPage County, including the 11 wells that enter the underlying Mt. Simon Sandstone. The 13 wells which end
ABEAL GEOLOGY 17
Fig. 7. Areal geology of the bedrock surface.
18 DUPAGE COUNTY GROUND-WATER RESOURCES
in the Eau Claire Formation penetrate from 4 to 54 feet. The lower sandstone of the Eau Claire Formation is incoherent, dolomitic, and contains glauconite. The middle and upper parts of the Eau Claire Formation consist chiefly of green to gray shale, dolomitic sandstone, and sandy brown dolomite. The thickness of the middle and upper parts of the formation (Suter et al., 1959, p. 19) determined from the well records, ranges from about 245 to 420 feet. Elevation of the top of the Eau Claire Formation ranges from about 550 feet below sea level along the northwestern part of the county to about 900 feet below sea level along the southeastern border. The top of the Eau Claire Formation is reached in drilling at depths of 1350 to 1500 feet.
The Galesville Sandstone consists of white to light gray, fine- to medium-grained, well sorted, incoherent sandstone that overlies the Eau Claire Formation. Strata of the Ironton Sandstone that occur immediately above the Galesville Sandstone are similar in lithology and are made up of fine- to very coarse-grained, variegated, commonly dolomitic sandstone interbedded with dolomite beds. A thin, dolomitic, coarsely glauconitic medium- to coarse-grained sandstone unit locally is present in the upper part of the Ironton Sandstone. The Ironton and Galesville Sandstones are not differentiated in most of the records of studies of drill samples from wells, and the interval is designated the Ironton-Gales-ville Sandstone. The combined thickness of the Ironton and Galesville Sandstones beneath DuPage County ranges from about 175 to 200 feet. The depth to the top of these sandstones ranges from about 1150 in the northwestern part of the county to about 1300 feet in the southeastern part.
The Franconia Formation is made up chiefly of interbedded sandstone, shale, and dolomite which contain an abundance of glauconite. A characteristic greenish tint often is given to sandstone and shale by the glauconite particles. The sandstone beds are pink, buff, and greenish gray, fine-grained, dolomitic, and compact. The shales are red and green, sandy, silty, and weak (cave and slake easily). Commonly the sandstone grades to sandy dolomite. Thickness of the Franconia Formation is 70 to 100 feet.
The Trempealeau Dolomite is buff to gray, very finely crystalline, and dense. Commonly the dolomite is sandy and glauconitic at or near the base of the formation. Thickness of the Trempealeau Dolomite beneath DuPage County is 80 to 190 feet. The erosional unconformity which separates the Cambrian and Ordovician rocks occurs at the top of the Trempealeau Dolomite.
ORDOVICIAN
Rocks of Ordovician age in DuPage County consist of, from the bottom up, the Prairie du Chien Series, the
St. Peter . Sandstone, the Glenwood Formation, the Platteville, Decorah, and Galena Formations, the Ma-quoketa Formation, and the Neda Formation. The Prairie du Chien Series is made up of three formations: the Oneota Dolomite, the New Richmond Sandstone, and the Shakopee Dolomite. This series consists almost completely of white to light gray to pink, fine to coarsely crystalline, cherty (oolitic) dolomite with lenses of sandstone. Beneath DuPage County, these rocks thin northward from about 200 feet to a featheredge.
The St. Peter Sandstone is a white to light gray and buff, fine- to coarse-grained, locally silty and argillaceous, friable sandstone. A large percentage of the quartz grains is well rounded and frosted. A basal zone that has rapid changes in lithology and thickness occurs where the St. Peter Sandstone is exceptionally thick. This basal section may consist of fine- to coarse-grained, pink to reddish brown sandstone with varying amounts of shale, chert, and dolomite fragments. The shale is commonly red or green, sandy, and weak.
Thickness maps of the St. Peter and overlying Glenwood Sandstones suggest that in places the sandstones were deposited in channels. In these areas, thicknesses of greater than 400 feet can be found. The Glenwood Formation has been recognized in many of the wells in DuPage County and is a fine- and coarse-grained sandstone which contains lenses of dolomite and shale. The dolomite is light gray, buff, and green and is argillaceous, silty, or sandy. The shale lenses are green and sandy, and range from plastic to tough. Thickness of the Glenwood Formation ranges from 3 to 80 feet and averages 31 feet. The top of the Glenwood is reached in drilling at depths of about 700 to 750 feet.
The Platteville, Decorah, and Galena Formations are similar in lithology and are made up of dolomite and limestone beds. The Platteville Dolomite is commonly argillaceous, cherty in the upper half, buff to gray, very fine to finely crystalline, and mottled. Near the contact with the underlying Glenwood Sandstone the dolomite of the Platteville Formation is sandy. The Decorah Formation overlies the Platteville Dolomite and is a fine to medium crystalline, speckled (red and black) dolomite with thin gray to red shale partings. The Galena Dolomite is a fine to medium crystalline, buff to brown dolomite, cherty in the lower half, and includes scattered thin shale beds. The combined thickness of these dolomites is very uniform and ranges from about 300 to 350 feet.
The Maquoketa Formation is made up chiefly of an olive gray to brown, weak, silty, dolomitic shale which contains beds of light gray to brown dolomite. In northeastern Illinois, three units have been recognized in the Maquoketa Formation (Suter et al., 1959, p. 33). From bottom to top the units are:
NIAGARAN SERIES 19
Lower Unit—Shale, silty, brown to very dark gray-brown, weak to brittle. Depauperate zone sometimes occurs which contains small phosphatic fossils. Thickness is about 50 to 100 feet.
Middle Unit—Dolomite, some shale and limestone, light gray to light brownish gray, a few pink and green grains, fine to coarsely crystalline, fossil fragments common. Thickness ranges from less than 50 feet in eastern DuPage County to 50 to 100 feet in the western part.
Upper Unit—Shale, dolomitic, silty, olive gray, greenish gray, weak. Some dolomite, silty, light gray to dark green, contains black speckled chert. Some fossil fragments (chiefly Bryozoa). Generally 50 to 100 feet thick.
The character of the Maquoketa Formation is shown in the sample study log of the deep well DUP 40N11E-13.5b (Appendix B).
The base of the Maquoketa Formation is well marked by a change from shale to the buff-colored dolomite of the Galena Formation. Delineation of the upper erosional surface is sometimes difficult where the upper strata of the Maquoketa contain dolomite and are overlain by lithologically similar strata in the lower part of the Bdgewood Formation. The upper surface is easily distinguished where the Kankakee or Edgewood Dolomites overlie the shales of the Maquoketa Formation or where the Neda Formation occurs. Much of the lower part of the rocks of Silurian age consists of white to light brown, cherty, and glauconitic dolomite which contrasts markedly with the darker color, black speckling, and the presence of black-speckled chert in the dolomite of the Maquoketa Formation.
The Neda Formation consists of a shale which is dolomitic, silty, hematitic, red (sometimes a green, yellow, and purple mixture), and contains goethite oolites. Silty, argillaceous, pink and green dolomite is often present. The pre-Silurian erosion has resulted in very patchy occurrence of the Neda Formation in DuPage County, and where this formation occurs the entire Maquoketa section is present. Only 10 of the 74 wells studied penetrated the Neda Formation. Commonly, where the Neda Formation occurs, the overlying Edge-wood Formation of the Alexandrian Series is thin. Locally, Kankakee Dolomite lies directly upon the Neda Formation. The boundary between rocks of Ordovician and Silurian age is easily determined where the colorful shale of the Neda Formation is overlain by the dolomite of the Alexandrian Series. The thickness of the Neda Formation, where present, ranges from 5 to 15 feet.
SILURIAN
Rocks of Silurian age in DuPage County include the Alexandrian Series overlain by the Niagaran Series. These rocks form essentially all of the bedrock surface beneath the glacial drift and the few bedrock outcrops in the county (fig. 7).
Alexandrian Series The Alexandrian Series is composed chiefly of dolo
mite which decreases in clastic content from the base of the series upward. Shale and very argillaceous dolomite beds occur near the base of the series and grade to a relatively pure dolomite near the top.
Erosional thinning of the Alexandrian Series has occurred where the rocks form the surface of the bedrock. Approximate original depositional thicknesses are present throughout most of the county where these rocks are overlain by the Niagaran Series.
Two formations make up the Alexandrian Series, the Edgewood below and the Kankakee above. The Edge-wood Formation is a gray to brownish gray, argillaceous, cherty dolomite which contains coarse silt and fine sand and shale partings toward the base. The Kankakee Formation is a white to light brown to light gray, relatively clean, locally glauconitic dolomite which contains thin green shale partings. It is difficult to distinguish the upper Edgewood Formation from the overlying Kankakee Formation by study of cuttings from water wells. The two formations are not differentiated for this study. The character of the Alexandrian rocks is shown in the study of reference wells DUP 38N11E-30.5d and DUP 39NllE-4.1e (Appendix B) .
The lithologic changes which mark the boundary between the Alexandrian Series and the Maquoketa or Neda Formations have been described. The contact between the Alexandrian and Niagaran Series is a smooth bedding surface which can be seen in the Elmhurst quarry and in outcrops along the Des Plaines and Kankakee Valleys in Will County. In DuPage County, the basal beds of the Niagaran Series are red, green, and greenish gray, shaly dolomite and shale. The abrupt change in color and lithologic character between these beds and the Kankakee Dolomite of the Alexandrian Series is easily discernible.
Niagaran Series The rocks of the Niagaran Series have been subdivided
into the Joliet, Waukesha, and Racine Formations. These formations range from clean dolomite to highly silty, argillaceous, and cherty dolomite with some thin shale beds, and contain reefs locally. Reefs and associated strata are most characteristic of the Racine Formation but may occur stratigraphically as low as the Joliet Formation (Willman, 1949, p. 26).
Regionally, these formations have been defined in outcrop chiefly on differences in the lithologic character of the dolomite. The formations are conformable and have contacts that are transitional between clean carbonates and very silty and argillaceous carbonates. For this report, these lithologically similar formations were not differentiated by study of drill samples from wells be-
20 DUPAGE COUNTY GROUND-WATER RESOURCES
cause of the transitional nature of the contacts and. because of the presence of reef and reef-like deposits.
The lower beds of the Joliet Formation, however, are characterized by their pink or red color and distinctive lithology and are easily recognizable in samples of drill cuttings.
A zone of dolomitic shale about 12 inches thick differentiates these basal beds of the Niagaran Series into three distinct units. From bottom to top, these units are: a shaly dolomite, a dolomitic shale, and a shaly silty dolomite. The presence of the middle shale is usually difficult to determine by study of well cuttings because it tends to be washed away during drilling. The character of these beds is shown in the sample study log of the Villa Park City Well No. 7 (DUP 39N11E-4.1e; Appendix B) .
The red shaly dolomite of the basal beds of the Niagaran Series contrasts markedly with the underlying light brown to light gray, relatively clean dolomite of the Kankakee Formation, and the contact between the Niagaran and the underlying Alexandrian Series is easily distinguished in surface and subsurface studies.
Erosion has been active upon the upper surface of the rocks of Niagaran Series and considerable thinning has resulted, particularly where deep valleys have been carved into the dolomite bedrock. This erosional thinning prevents accurate determination of the original thickness of the Niagaran Series in DuPage County. The upper eroded surface of the dolomite of the Niagaran Series is highly creviced. Black shale has been found in crevices in the dolomite of the Niagaran Series in the Elmhurst quarry and locally throughout the region. Fossils in this material are middle and late Devonian in age (Alden, 1902, p. 93-94). Unconsolidated glacial materials of Pleistocene age overlie the dolomite of Niagaran age in most of the county.
BEDROCK STRUCTURE
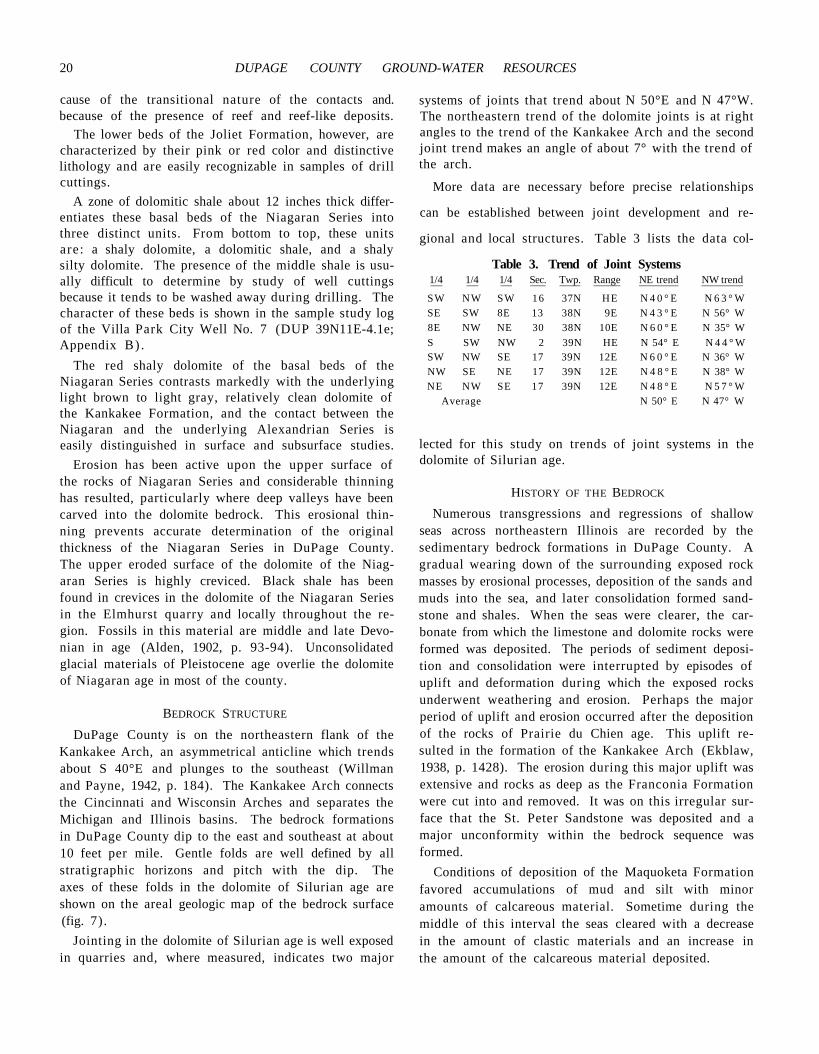
DuPage County is on the northeastern flank of the Kankakee Arch, an asymmetrical anticline which trends about S 40°E and plunges to the southeast (Willman and Payne, 1942, p. 184). The Kankakee Arch connects the Cincinnati and Wisconsin Arches and separates the Michigan and Illinois basins. The bedrock formations in DuPage County dip to the east and southeast at about 10 feet per mile. Gentle folds are well defined by all stratigraphic horizons and pitch with the dip. The axes of these folds in the dolomite of Silurian age are shown on the areal geologic map of the bedrock surface (fig. 7).
Jointing in the dolomite of Silurian age is well exposed in quarries and, where measured, indicates two major
systems of joints that trend about N 50°E and N 47°W. The northeastern trend of the dolomite joints is at right angles to the trend of the Kankakee Arch and the second joint trend makes an angle of about 7° with the trend of the arch.
1/4 1/4 1/4 Sec. Twp. Range NE trend NW trend
SW NW SW 16 37N HE N 4 0 ° E N 6 3 ° W SE SW 8E 13 38N 9E N 4 3 ° E N 56° W 8E NW NE 30 38N 10E N 6 0 ° E N 35° W S SW NW 2 39N HE N 54° E N 4 4 ° W SW NW SE 17 39N 12E N 6 0 ° E N 36° W NW SE NE 17 39N 12E N 4 8 ° E N 38° W NE NW SE 17 39N 12E N 4 8 ° E N 5 7 ° W
Average N 50° E N 47° W
lected for this study on trends of joint systems in the dolomite of Silurian age.
HISTORY OF THE BEDROCK
Numerous transgressions and regressions of shallow seas across northeastern Illinois are recorded by the sedimentary bedrock formations in DuPage County. A gradual wearing down of the surrounding exposed rock masses by erosional processes, deposition of the sands and muds into the sea, and later consolidation formed sandstone and shales. When the seas were clearer, the carbonate from which the limestone and dolomite rocks were formed was deposited. The periods of sediment deposition and consolidation were interrupted by episodes of uplift and deformation during which the exposed rocks underwent weathering and erosion. Perhaps the major period of uplift and erosion occurred after the deposition of the rocks of Prairie du Chien age. This uplift resulted in the formation of the Kankakee Arch (Ekblaw, 1938, p. 1428). The erosion during this major uplift was extensive and rocks as deep as the Franconia Formation were cut into and removed. It was on this irregular surface that the St. Peter Sandstone was deposited and a major unconformity within the bedrock sequence was formed.
Conditions of deposition of the Maquoketa Formation favored accumulations of mud and silt with minor amounts of calcareous material. Sometime during the middle of this interval the seas cleared with a decrease in the amount of clastic materials and an increase in the amount of the calcareous material deposited.
More data are necessary before precise relationships
can be established between joint development and re
gional and local structures. Table 3 lists the data col-
Table 3. Trend of Joint Systems
UNCONSOLIDATED DEPOSITS 21
The shallow sea in which the Alexandrian sediments were deposited transgressed a highly uneven Maquoketa surface and reworked the upper part of the shale depositing it with the carbonate. Clastic material was concentrated in the deeper parts of the sea and particularly in channels which had been cut into the Maquoketa surface (Buschbach, 1959, p. 85). With time, the sea became deeper, cleaner, and more quiet. Clastic deposition decreased and then essentially ceased.
Environmental conditions during the time of the deposition of the Joliet and Waukesha Formations of the Niagaran Series fluctuated from those which cause continuous deposition of relatively clean carbonates to those which cause deposition of very silty and argillaceous carbonates. The recognition of individual units in the Joliet Formation from outcrop to outcrop throughout most of the region and the great similarity of insoluble residues of these units show widespread uniformity of depositional conditions (Workman, 1949). In contrast, during the time of deposition of the Racine Formation, reef building was more widespread and caused highly variable and complex sedimentation conditions locally.
Unknown thicknesses of sediments were deposited on the dolomite of Silurian age in shallow, continental seas which invaded the county during Devonian and perhaps even Mississippian and Pennsylvanian times. Major periods of structural disturbance which formed the gentle folds in the bedrock and emergence of the land took place in late Silurian time and near the end of the Mississippian period (Willman and Payne, 1942, p. 195). The sediments which were deposited on the dolomite of Silurian age may have been removed during the late-Mississippian-pre-Pennsylvanian erosional interval or during the long period of time between the Pennsylvanian and the Pleistocene. The only evidence of transgression of the seas over the county after Silurian time is limited to the small quantities of shale of Devonian age found in some of the openings near the upper surface of the dolomite of Silurian age.
The geologic record of the time between the Pennsylvanian and the Pleistocene in this region is poorly known. After withdrawal of the Paleozoic long period of weathering and erosion produced a surface of low relief upon the dolomite. Advances of the ice sheets during the Pleistocene scoured the surface of the dolomite and covered it with thick deposits of unconsolidated material.
BEDROCK TOPOGRAPHY
The bedrock topography map of DuPage County (pl. 1) was compiled almost entirely from about 1250 records of water wells and test borings because of the few outcrops of bedrock and the thick glacial drift
cover. This map agrees in general with an earlier interpretation presented by Horberg (1950, pl. 1, sheet 1).
The bedrock surface is principally a broad, gently rolling upland, part of the Central Illinois Peneplain (Horberg, 1950, p. 95), which extends over northeastern and central Illinois. The development of the peneplain began some time after the Pennsylvanian Period and was terminated by Pleistocene glaciation.
Regionally, because of the presence of less resistant shales above and below it and because of its gentle eastward dip, the Silurian dolomite became a cuesta. The ridge of the cuesta became a major divide for drainage, so that many streams drained westward. The eastward-draining bedrock valleys trend approximately parallel to the dip of the bedrock but diverge slightly to the northeast. They have been interpreted as tributaries of a valley cut into the soft Devonian shales to the east (Horberg, 1950, p. 28).
The bedrock surface in DuPage County slopes from about 700 feet above mean sea level in the northwest to about 640 feet in the southeast and to about 580 feet in the northeast. Some small isolated hills in the bedrock surface in the eastern part of the county may reflect relatively resistant reef structures.
The valleys in the bedrock surface are generally about one-half to one mile wide and about 80 feet deep and for the most part are filled completely with glacial drift. The tributary valleys which were cut back into the rock uplands have steep slopes and are commonly narrow. Major joint systems appear to have locally influenced the trend of the valleys. Most of the valleys were created by preglacial erosion, but some are related to glacial events.
Only two present-day river valleys overlie bedrock valleys in DuPage County. The southern reaches of the East Branch of DuPage River flow in a broad lowland which partly overlies a buried bedrock valley. Where the West Branch of DuPage River leaves the county, it overlies the head of a buried bedrock valley. Des Plaines River, along the southeastern boundary of the county, flows in an outlet valley of Glacial Lake Chicago cut down to an elevation of about 585 feet above mean sea level, across the bedrock drainage divide.
UNCONSOLIDATED DEPOSITS
GLACIAL DRIFT Almost all unconsolidated glacial deposits in DuPage
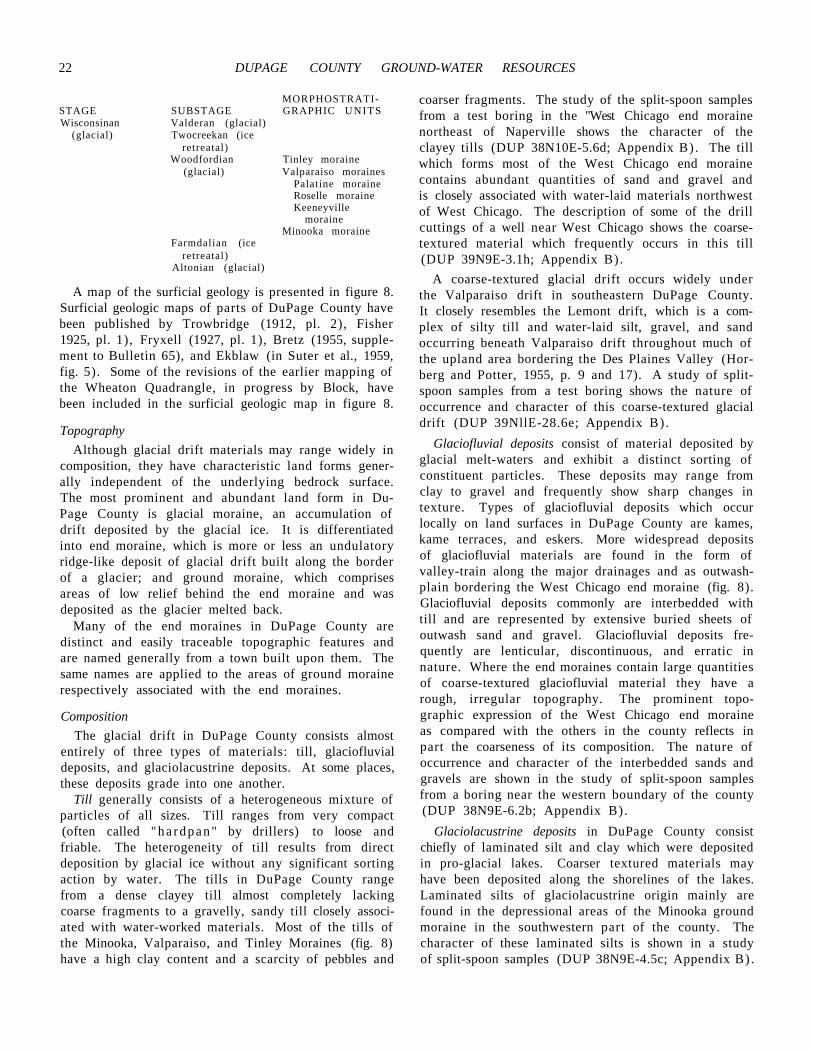
County were deposited by ice of the Lake Michigan glacial lobe of Wisconsinan age, the most recent Pleistocene glacial stage. The recent classification of the Wisconsinan stage by Frye and Willman (1960) is as follows:
22 DUPAGE COUNTY GROUND-WATER RESOURCES
MORPHOSTRATI-STAGE SUBSTAGE GRAPHIC UNITS Wisconsinan Valderan (glacial)
(glacial) Twocreekan (ice retreatal)
Woodfordian Tinley moraine (glacial) Valparaiso moraines
Palatine moraine Roselle moraine Keeneyville
moraine Minooka moraine
Farmdalian (ice retreatal)
Altonian (glacial)
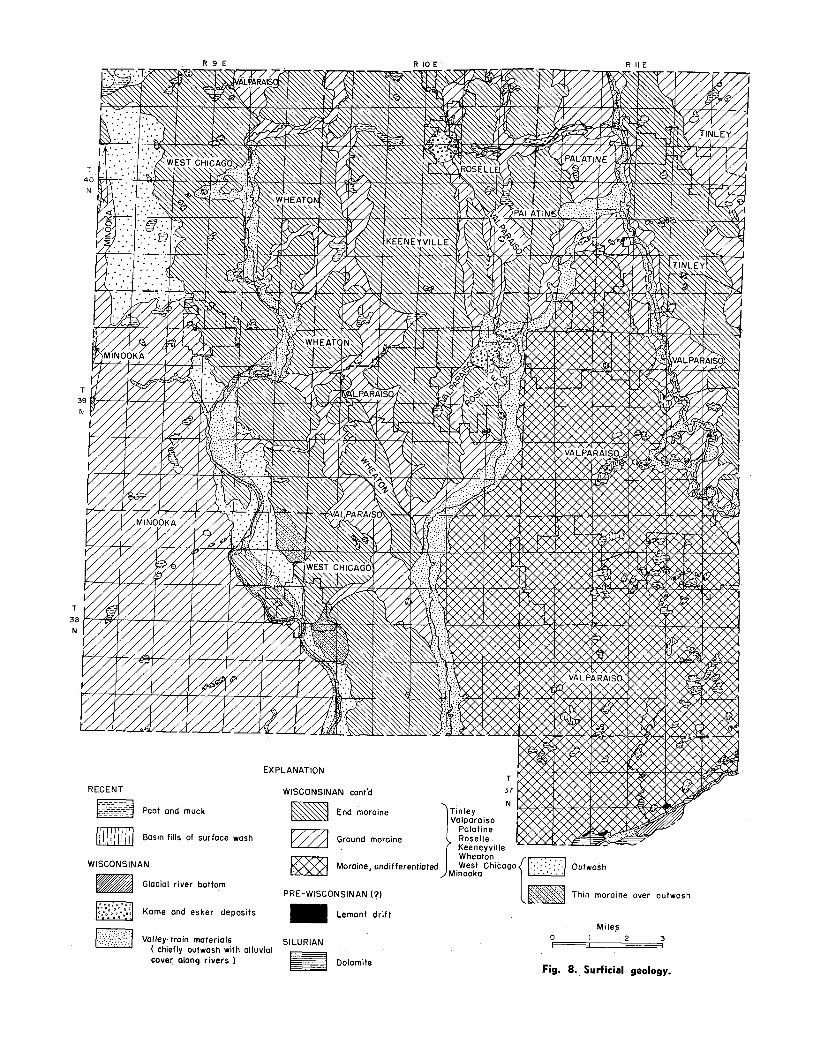
A map of the surficial geology is presented in figure 8. Surficial geologic maps of parts of DuPage County have been published by Trowbridge (1912, pl. 2), Fisher 1925, pl. 1), Fryxell (1927, pl. 1), Bretz (1955, supplement to Bulletin 65), and Ekblaw (in Suter et al., 1959, fig. 5). Some of the revisions of the earlier mapping of the Wheaton Quadrangle, in progress by Block, have been included in the surficial geologic map in figure 8.
Topography Although glacial drift materials may range widely in
composition, they have characteristic land forms generally independent of the underlying bedrock surface. The most prominent and abundant land form in DuPage County is glacial moraine, an accumulation of drift deposited by the glacial ice. It is differentiated into end moraine, which is more or less an undulatory ridge-like deposit of glacial drift built along the border of a glacier; and ground moraine, which comprises areas of low relief behind the end moraine and was deposited as the glacier melted back.
Many of the end moraines in DuPage County are distinct and easily traceable topographic features and are named generally from a town built upon them. The same names are applied to the areas of ground moraine respectively associated with the end moraines.
Composition The glacial drift in DuPage County consists almost
entirely of three types of materials: till, glaciofluvial deposits, and glaciolacustrine deposits. At some places, these deposits grade into one another.
Till generally consists of a heterogeneous mixture of particles of all sizes. Till ranges from very compact (often called "ha rdpan" by drillers) to loose and friable. The heterogeneity of till results from direct deposition by glacial ice without any significant sorting action by water. The tills in DuPage County range from a dense clayey till almost completely lacking coarse fragments to a gravelly, sandy till closely associated with water-worked materials. Most of the tills of the Minooka, Valparaiso, and Tinley Moraines (fig. 8) have a high clay content and a scarcity of pebbles and
coarser fragments. The study of the split-spoon samples from a test boring in the "West Chicago end moraine northeast of Naperville shows the character of the clayey tills (DUP 38N10E-5.6d; Appendix B) . The till which forms most of the West Chicago end moraine contains abundant quantities of sand and gravel and is closely associated with water-laid materials northwest of West Chicago. The description of some of the drill cuttings of a well near West Chicago shows the coarse-textured material which frequently occurs in this till (DUP 39N9E-3.1h; Appendix B).
A coarse-textured glacial drift occurs widely under the Valparaiso drift in southeastern DuPage County. It closely resembles the Lemont drift, which is a complex of silty till and water-laid silt, gravel, and sand occurring beneath Valparaiso drift throughout much of the upland area bordering the Des Plaines Valley (Hor-berg and Potter, 1955, p. 9 and 17). A study of split-spoon samples from a test boring shows the nature of occurrence and character of this coarse-textured glacial drift (DUP 39NllE-28.6e; Appendix B) .
Glaciofluvial deposits consist of material deposited by glacial melt-waters and exhibit a distinct sorting of constituent particles. These deposits may range from clay to gravel and frequently show sharp changes in texture. Types of glaciofluvial deposits which occur locally on land surfaces in DuPage County are kames, kame terraces, and eskers. More widespread deposits of glaciofluvial materials are found in the form of valley-train along the major drainages and as outwash-plain bordering the West Chicago end moraine (fig. 8). Glaciofluvial deposits commonly are interbedded with till and are represented by extensive buried sheets of outwash sand and gravel. Glaciofluvial deposits frequently are lenticular, discontinuous, and erratic in nature. Where the end moraines contain large quantities of coarse-textured glaciofluvial material they have a rough, irregular topography. The prominent topographic expression of the West Chicago end moraine as compared with the others in the county reflects in part the coarseness of its composition. The nature of occurrence and character of the interbedded sands and gravels are shown in the study of split-spoon samples from a boring near the western boundary of the county (DUP 38N9E-6.2b; Appendix B).
Glaciolacustrine deposits in DuPage County consist chiefly of laminated silt and clay which were deposited in pro-glacial lakes. Coarser textured materials may have been deposited along the shorelines of the lakes. Laminated silts of glaciolacustrine origin mainly are found in the depressional areas of the Minooka ground moraine in the southwestern part of the county. The character of these laminated silts is shown in a study of split-spoon samples (DUP 38N9E-4.5c; Appendix B) .
24 DUPAGE COUNTY GROUND-WATER RESOURCES
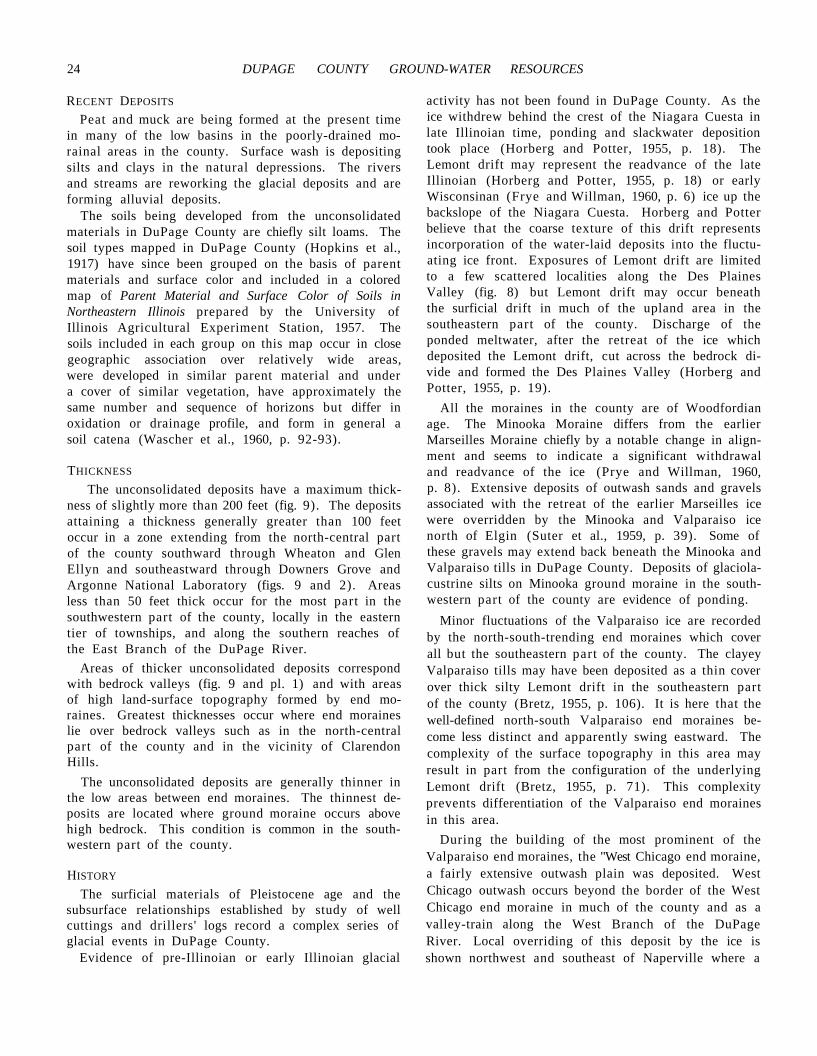
RECENT DEPOSITS
Peat and muck are being formed at the present time in many of the low basins in the poorly-drained mo-rainal areas in the county. Surface wash is depositing silts and clays in the natural depressions. The rivers and streams are reworking the glacial deposits and are forming alluvial deposits.
The soils being developed from the unconsolidated materials in DuPage County are chiefly silt loams. The soil types mapped in DuPage County (Hopkins et al., 1917) have since been grouped on the basis of parent materials and surface color and included in a colored map of Parent Material and Surface Color of Soils in Northeastern Illinois prepared by the University of Illinois Agricultural Experiment Station, 1957. The soils included in each group on this map occur in close geographic association over relatively wide areas, were developed in similar parent material and under a cover of similar vegetation, have approximately the same number and sequence of horizons but differ in oxidation or drainage profile, and form in general a soil catena (Wascher et al., 1960, p. 92-93).
THICKNESS
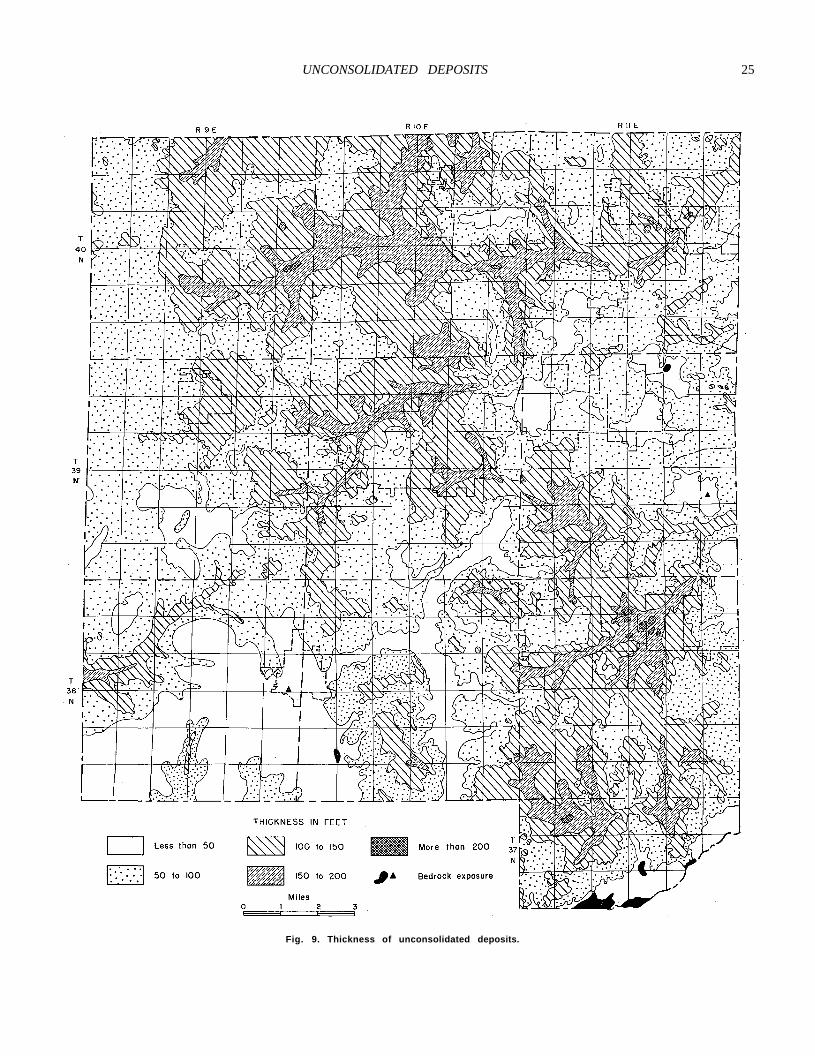
The unconsolidated deposits have a maximum thickness of slightly more than 200 feet (fig. 9). The deposits attaining a thickness generally greater than 100 feet occur in a zone extending from the north-central part of the county southward through Wheaton and Glen Ellyn and southeastward through Downers Grove and Argonne National Laboratory (figs. 9 and 2). Areas less than 50 feet thick occur for the most part in the southwestern part of the county, locally in the eastern tier of townships, and along the southern reaches of the East Branch of the DuPage River.
Areas of thicker unconsolidated deposits correspond with bedrock valleys (fig. 9 and pl. 1) and with areas of high land-surface topography formed by end moraines. Greatest thicknesses occur where end moraines lie over bedrock valleys such as in the north-central part of the county and in the vicinity of Clarendon Hills.
The unconsolidated deposits are generally thinner in the low areas between end moraines. The thinnest deposits are located where ground moraine occurs above high bedrock. This condition is common in the southwestern part of the county.
HISTORY
The surficial materials of Pleistocene age and the subsurface relationships established by study of well cuttings and drillers' logs record a complex series of glacial events in DuPage County.
Evidence of pre-Illinoian or early Illinoian glacial
activity has not been found in DuPage County. As the ice withdrew behind the crest of the Niagara Cuesta in late Illinoian time, ponding and slackwater deposition took place (Horberg and Potter, 1955, p. 18). The Lemont drift may represent the readvance of the late Illinoian (Horberg and Potter, 1955, p. 18) or early Wisconsinan (Frye and Willman, 1960, p. 6) ice up the backslope of the Niagara Cuesta. Horberg and Potter believe that the coarse texture of this drift represents incorporation of the water-laid deposits into the fluctuating ice front. Exposures of Lemont drift are limited to a few scattered localities along the Des Plaines Valley (fig. 8) but Lemont drift may occur beneath the surficial drift in much of the upland area in the southeastern part of the county. Discharge of the ponded meltwater, after the retreat of the ice which deposited the Lemont drift, cut across the bedrock divide and formed the Des Plaines Valley (Horberg and Potter, 1955, p. 19).
All the moraines in the county are of Woodfordian age. The Minooka Moraine differs from the earlier Marseilles Moraine chiefly by a notable change in alignment and seems to indicate a significant withdrawal and readvance of the ice (Prye and Willman, 1960, p. 8). Extensive deposits of outwash sands and gravels associated with the retreat of the earlier Marseilles ice were overridden by the Minooka and Valparaiso ice north of Elgin (Suter et al., 1959, p. 39). Some of these gravels may extend back beneath the Minooka and Valparaiso tills in DuPage County. Deposits of glaciola-custrine silts on Minooka ground moraine in the southwestern part of the county are evidence of ponding.
Minor fluctuations of the Valparaiso ice are recorded by the north-south-trending end moraines which cover all but the southeastern part of the county. The clayey Valparaiso tills may have been deposited as a thin cover over thick silty Lemont drift in the southeastern part of the county (Bretz, 1955, p. 106). It is here that the well-defined north-south Valparaiso end moraines become less distinct and apparently swing eastward. The complexity of the surface topography in this area may result in part from the configuration of the underlying Lemont drift (Bretz, 1955, p. 71). This complexity prevents differentiation of the Valparaiso end moraines in this area.
During the building of the most prominent of the Valparaiso end moraines, the "West Chicago end moraine, a fairly extensive outwash plain was deposited. West Chicago outwash occurs beyond the border of the West Chicago end moraine in much of the county and as a valley-train along the West Branch of the DuPage River. Local overriding of this deposit by the ice is shown northwest and southeast of Naperville where a
UNCONSOLIDATED DEPOSITS 25
Fig. 9. Thickness of unconsolidated deposits.
26 DUPAGE COUNTY GROUND-WATER RESOURCES
thin cover of West Chicago till is found over West Chicago outwash (figs. 8 and 12 BB' ) .
After building the narrow end moraines and depositing considerable quantities of outwash materials along what is now the Bast Branch of the DuPage River, the Valparaiso ice retreated from the county. Readvance of the ice up the backslope of the Valparaiso Moraine resulted in construction of the Tinley Moraine in the
northeastern corner of the county. The Tinley end moraine is relatively slender and extends as a ridge parallel to the lake basin to the east. Withdrawal of the ice from the position of the Tinley end moraine initiated Glacial Lake Chicago and ended major glacial activity in DuPage County. The Des Plaines Valley, however, from time to time continued to act as an outlet for Glacial Lake Chicago.
RELATIONSHIP OF GEOLOGY TO GROUND WATER
A large reservoir of ground water occurs in the saturated earth materials beneath the land surface in DuPage County. Variations in the lithologic character, distribution, and structure of the earth materials control the occurrence, source, movement, and availability of ground water. A sound and detailed knowledge of the geology is necessary for a basic understanding and interpretation of ground-water conditions.
Aquifers are lithologic units or combinations of such units that have an appreciably greater transmissivity than adjacent units and that store and transmit water that is recoverable in usable quantities. The aquifers in DuPage County consist of sand and gravel, sandstones, and creviced limestones and dolomites.
Geohydrologic units are geologic units which act hydraulically more or less as a distinct hydraulic system. On the basis of character and origin of the deposit, stratigraphic position, water-bearing properties, and use, six principal geohydrologic units are recognized in the earth materials beneath DuPage County. From top to bottom, these geohydrologic units are: 1) glacial drift aquifers, 2) Silurian dolomite aquifer, 3) confining beds of the Maquoketa Formation, 4) Cambrian-Ordovician aquifer, 5) confining beds of the Eau Claire Formation, and 6) the Mt. Simon aquifer. The glacial drift and Silurian dolomite aquifers are hydraulically separated from the Cambrian-Ordovician aquifer by the relatively impermeable shales of the Maquoketa Formation. The Cambrian-Ordovician aquifer is separated from the deeper Mt. Simon aquifer by the impermeable beds of the Eau Claire Formation.
GLACIAL DRIFT AQUIFERS
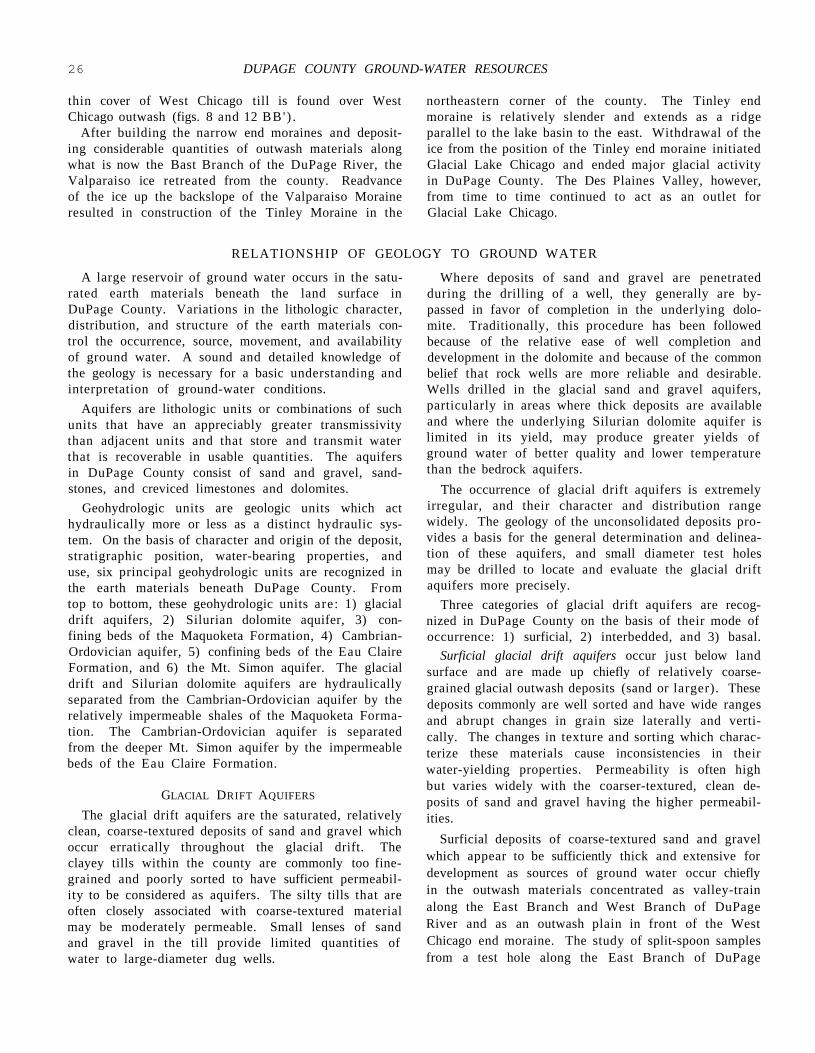
The glacial drift aquifers are the saturated, relatively clean, coarse-textured deposits of sand and gravel which occur erratically throughout the glacial drift. The clayey tills within the county are commonly too finegrained and poorly sorted to have sufficient permeability to be considered as aquifers. The silty tills that are often closely associated with coarse-textured material may be moderately permeable. Small lenses of sand and gravel in the till provide limited quantities of water to large-diameter dug wells.
Where deposits of sand and gravel are penetrated during the drilling of a well, they generally are bypassed in favor of completion in the underlying dolomite. Traditionally, this procedure has been followed because of the relative ease of well completion and development in the dolomite and because of the common belief that rock wells are more reliable and desirable. Wells drilled in the glacial sand and gravel aquifers, particularly in areas where thick deposits are available and where the underlying Silurian dolomite aquifer is limited in its yield, may produce greater yields of ground water of better quality and lower temperature than the bedrock aquifers.
The occurrence of glacial drift aquifers is extremely irregular, and their character and distribution range widely. The geology of the unconsolidated deposits provides a basis for the general determination and delineation of these aquifers, and small diameter test holes may be drilled to locate and evaluate the glacial drift aquifers more precisely.
Three categories of glacial drift aquifers are recognized in DuPage County on the basis of their mode of occurrence: 1) surficial, 2) interbedded, and 3) basal.
Surficial glacial drift aquifers occur just below land surface and are made up chiefly of relatively coarsegrained glacial outwash deposits (sand or larger). These deposits commonly are well sorted and have wide ranges and abrupt changes in grain size laterally and vertically. The changes in texture and sorting which characterize these materials cause inconsistencies in their water-yielding properties. Permeability is often high but varies widely with the coarser-textured, clean deposits of sand and gravel having the higher permeabilities.
Surficial deposits of coarse-textured sand and gravel which appear to be sufficiently thick and extensive for development as sources of ground water occur chiefly in the outwash materials concentrated as valley-train along the East Branch and West Branch of DuPage River and as an outwash plain in front of the West Chicago end moraine. The study of split-spoon samples from a test hole along the East Branch of DuPage
PERMEABILITY OF SOILS 27
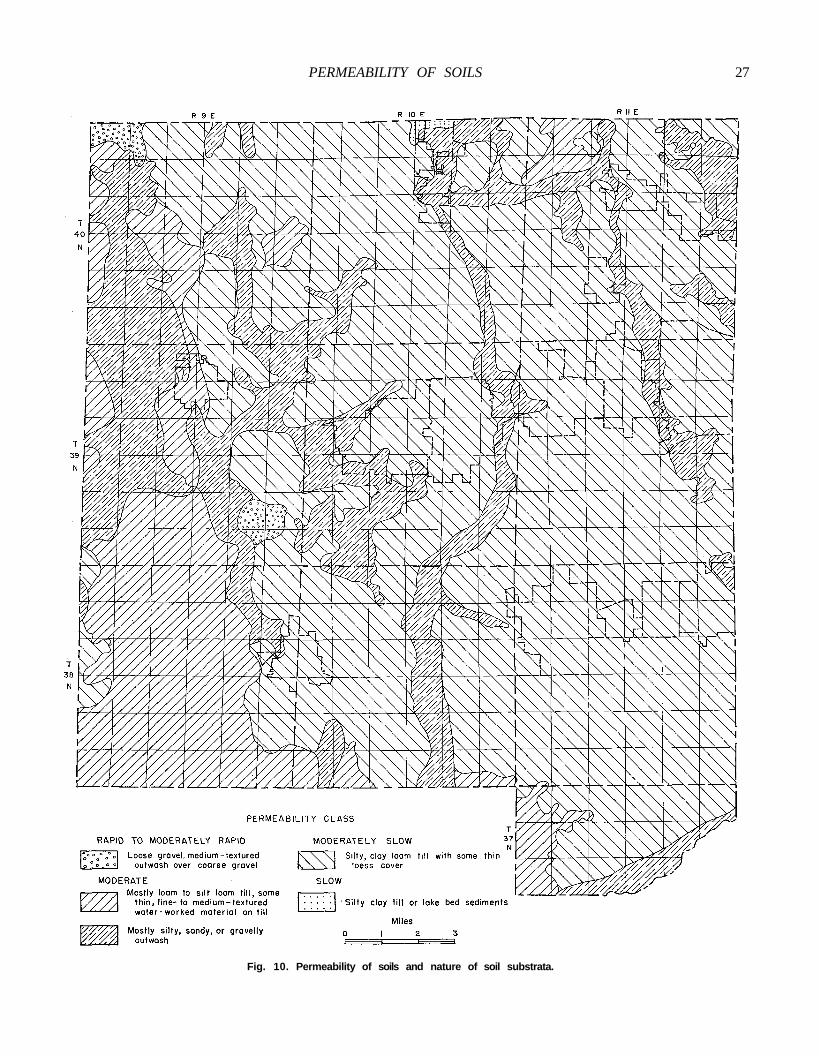
Fig. 10. Permeability of soils and nature of soil substrata.
28 DUPAGE COUNTY GROUND-WATER RESOURCES
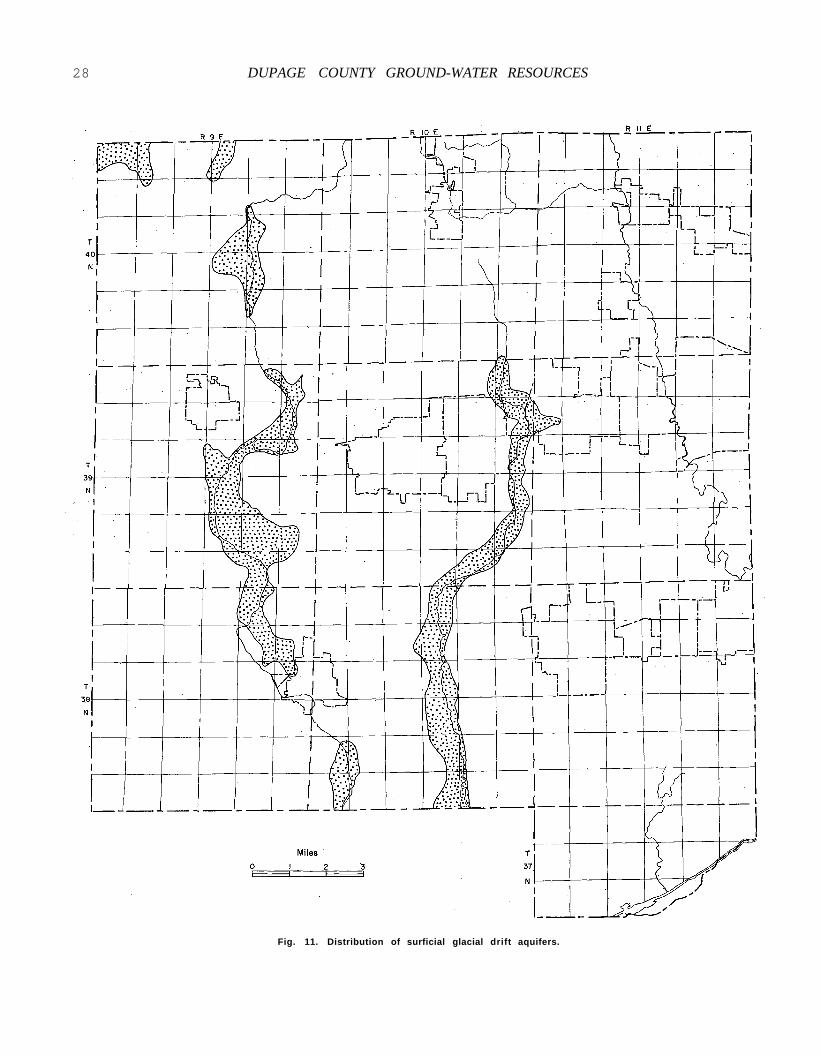
Fig. 11. Distribution of surficial glacial drift aquifers.
GLAGIAL DRIFT AQUIFERS 29
River shows the general character of these outwash materials (DUP 38N10E-3.2f; Appendix B) .
A map of the permeability of soils and the nature of soil substrata (fig. 10) was constructed from the map of Parent Material and Surface Color of Soils in Northeastern Illinois prepared by the University of Illinois Agricultural Experiment Station (1957), and from data on permeability available in soil type descriptions published by the Department of Agronomy at the University of Illinois. The designation of permeability given to a soil type refers to the least permeable horizon in the soil profile and is based upon empirical data. In most instances, the least permeable horizon is the substrata (any material below the subsoil which is agriculturally significant).
Table 4 presents the rate of penetration of water under a one-inch head into a moist soil.
Table 4. Rate of Penetration of Water into Soils by Permeability Class
Permeability class
Moder- Moder-Very ately Moder- ately Very slow Slow slow ate rapid Rapid rapid
Hate of penetration, inches per hour
Less 0.05 0.2 0.8 2.5 5.0 More than to to to to to than 0.05 0.2 0.8 2.5 5.0 10.0. 10.0
Correlation of the maps of surficial geology (fig. 8) and permeability of soils and nature of substrata (fig. 10) with data obtained from studies of samples from test borings and from well and drillers' logs on the character and thickness of material provides the basis for delineation of surficial glacial drift aquifers favorable for development of moderate to large ground-water supplies (fig. 11).
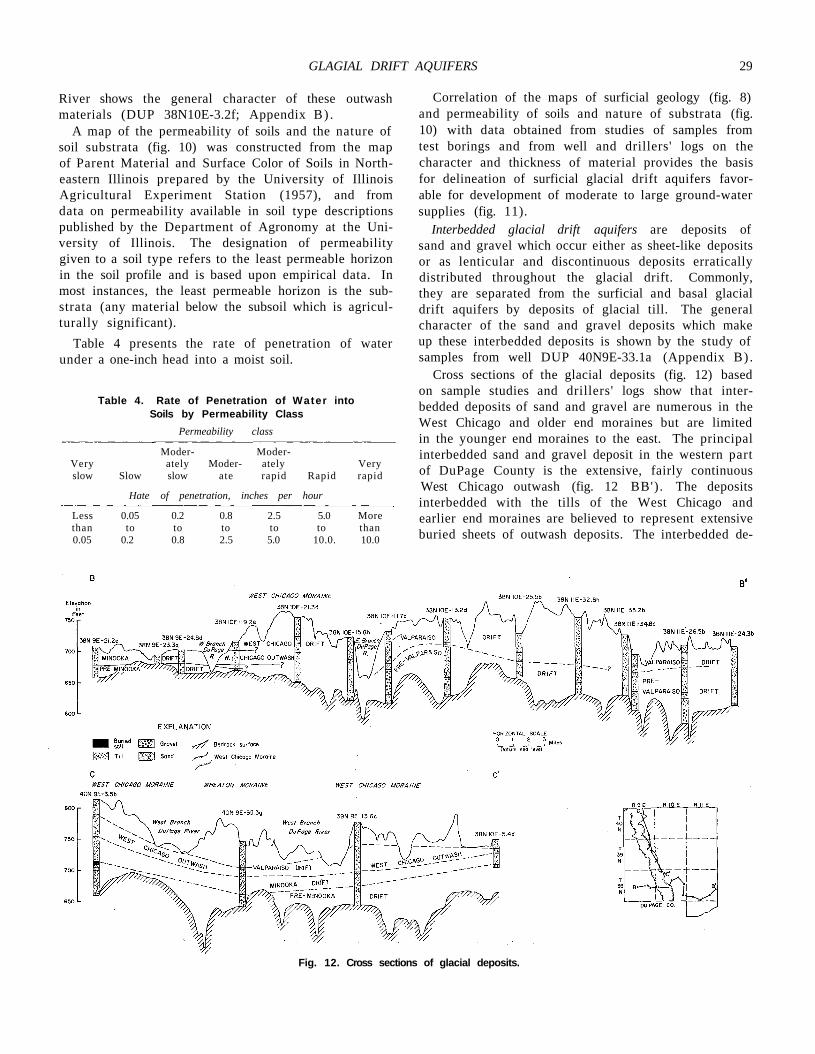
Interbedded glacial drift aquifers are deposits of sand and gravel which occur either as sheet-like deposits or as lenticular and discontinuous deposits erratically distributed throughout the glacial drift. Commonly, they are separated from the surficial and basal glacial drift aquifers by deposits of glacial till. The general character of the sand and gravel deposits which make up these interbedded deposits is shown by the study of samples from well DUP 40N9E-33.1a (Appendix B) .
Cross sections of the glacial deposits (fig. 12) based on sample studies and drillers' logs show that interbedded deposits of sand and gravel are numerous in the West Chicago and older end moraines but are limited in the younger end moraines to the east. The principal interbedded sand and gravel deposit in the western part of DuPage County is the extensive, fairly continuous West Chicago outwash (fig. 12 BB'). The deposits interbedded with the tills of the West Chicago and earlier end moraines are believed to represent extensive buried sheets of outwash deposits. The interbedded de-
Fig. 12. Cross sections of glacial deposits.
30 DUPAGE COUNTY GROUND-WATER RESOURCES
posits of sand and gravel in the later drifts are more lenticular, discontinuous, and erratically distributed.
The scarcity of subsurface data prohibits detailed mapping of individual interbedded deposits of sand and gravel. The occurrence and distribution of these deposits are incorporated in the map of total thickness of sand and gravel in glacial drift, based upon moving averages (fig. 14).
Basal glacial drift aquifers are the sand and gravel deposits at the base of the glacial drift directly above the dolomite in DuPage County. These deposits are commonly coarse-grained and have relatively high permeabilities. A study of samples of drill cuttings from a water well shows the general character of the basal glacial drift aquifers (DUP 38N10E-12.2b; Appendix B) .
The extreme ranges in the thickness of basal sand and gravel deposits which commonly occur within short distances, and the unequal distribution of well control make impractical the construction of a map of the thickness and distribution of the basal sand and gravel deposits. A map based upon moving averages (Pelletier, 1958, p. 1036) shows the general distribution of basal sand and gravel deposits in the county (fig. 13). In general, greater thicknesses of basal sand and gravel deposits occur in areas of thicker glacial drift (compare figs. 9 and 13). The basal sand and gravel deposits probably exceed 60 feet in thickness in the north-central part of the county.
Throughout much of Illinois concentration and greater thickness of sand and gravel often result from the channeling of glacial melt-waters in bedrock valleys.
The data in table 5 show that the percentage of wells
Table 5. Occurrence and Thickness of Basal Sand and Gravel
Bedrock Bedrock upland valley
Total number of wells 328 407. Number of wells which record
basal sand and gravel 256 299 Percentage of wells which record
basal sand and gravel 78 73 Total thickness in feet of basal sand
and gravel deposits recorded by wells 6933 9634 Average thickness in feet of basal sand
and gravel deposits per well 27 32
which penetrate basal sand and gravel in DuPage County is slightly smaller in bedrock valleys than in bedrock uplands. Even though the average thickness of basal sand and gravel per penetrating well is slightly greater in bedrock valleys, no significant relationship is found between the occurrence and thickness of basal sand and gravel deposits and bedrock topography in the county.
DISTRIBUTION
The map of total thickness of sand and gravel deposits in glacial drift, based on moving averages (fig. 14) includes all sand and gravel deposits regardless of mode of occurrence and continuity. Total thickness of sand and gravel greater than 60 feet occurs in the north-central part of the county, the area of thicker glacial drift.
The distribution of glacial drift aquifers in DuPage County is shown in figure 15. Throughout most of the county these aquifers are scattered in occurrence, range from 20 to 40 feet in thickness, and vary widely in extent and permeability. Glacial drift aquifers which locally exceed 40 feet in thickness are concentrated in the north-central part of the county. Locally in the southwestern, southeastern, and eastern parts of the county, glacial drift aquifers are generally thin or absent.
The limitations of the geologic and hydrologic data permit only generalized interpretations of the character, occurrence, and distribution of the glacial drift aquifers. Additional data are necessary before the glacial drift aquifers in DuPage County can be better defined and their potential as sources of ground water more precisely evaluated.
SILURIAN DOLOMITE AQUIFER The Silurian dolomite aquifer is made up of the
rocks of the Niagaran and Alexandrian Series of Silurian age. It occurs directly beneath the glacial drift throughout all of DuPage County with the exception of a narrow strip in the north-central part of the county where a deep bedrock valley has been cut through this dolomite into the Maquoketa Formation (fig. 7). Depths to the top of the Silurian dolomite aquifer vary widely within short distances and can be estimated generally from the map of thickness of the overlying unconsolidated deposits (fig. 9), or by use of the bedrock topography map and appropriate topographic maps (pl. 1). The configuration of the upper surface of the Silurian dolomite aquifer is shown by the map of bedrock topography at a contour interval of 20 feet (pl. 1). The thickness of the Silurian dolomite aquifer in the relatively unpopulated western half of the county ranges from 50 to 100 feet (fig. 16). It thickens to the east and southeast and is 150 to 200 feet thick in the southeastern part of the county. Thicknesses of greater than 200 feet occur in the Downers Grove-Hinsdale area where the Silurian dolomite aquifer is heavily developed for industrial and municipal supply. A maximum thickness of 252 feet is reported in the Clarendon Hills City Well No. 4 (DUP 38N11E-11.5d). Thicknesses of less than 50 feet are limited to the northwestern and south-
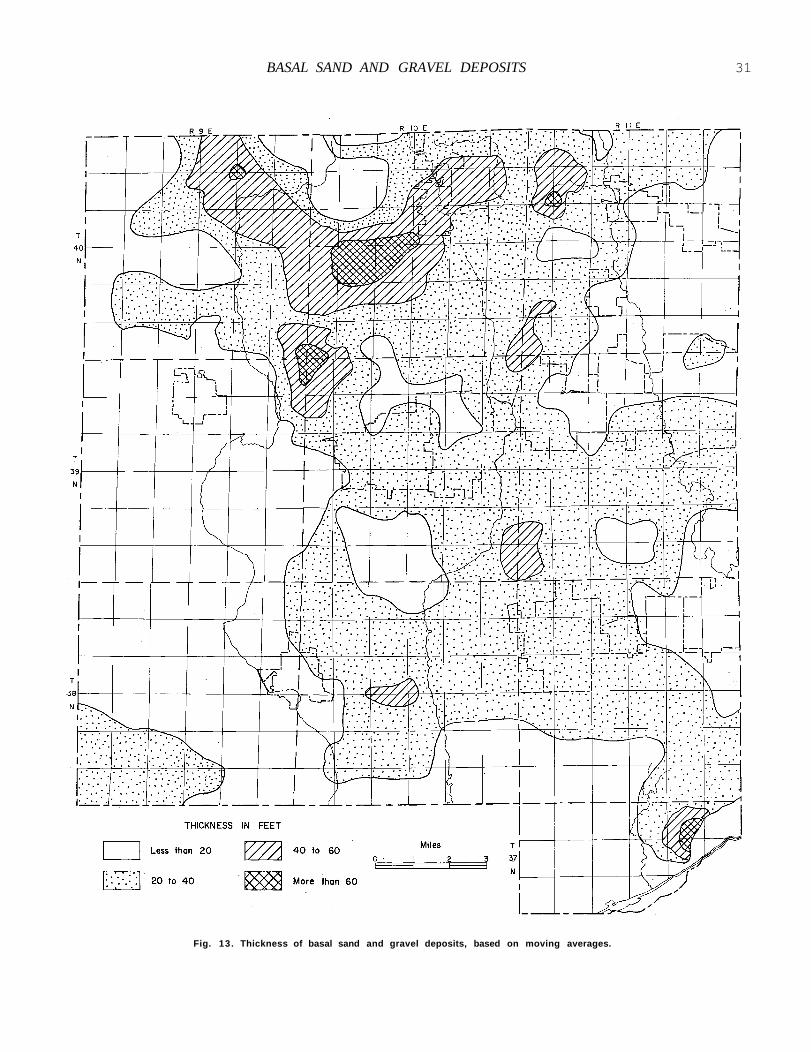
BASAL SAND AND GRAVEL DEPOSITS 31
Fig. 13. Thickness of basal sand and gravel deposits, based on moving averages.
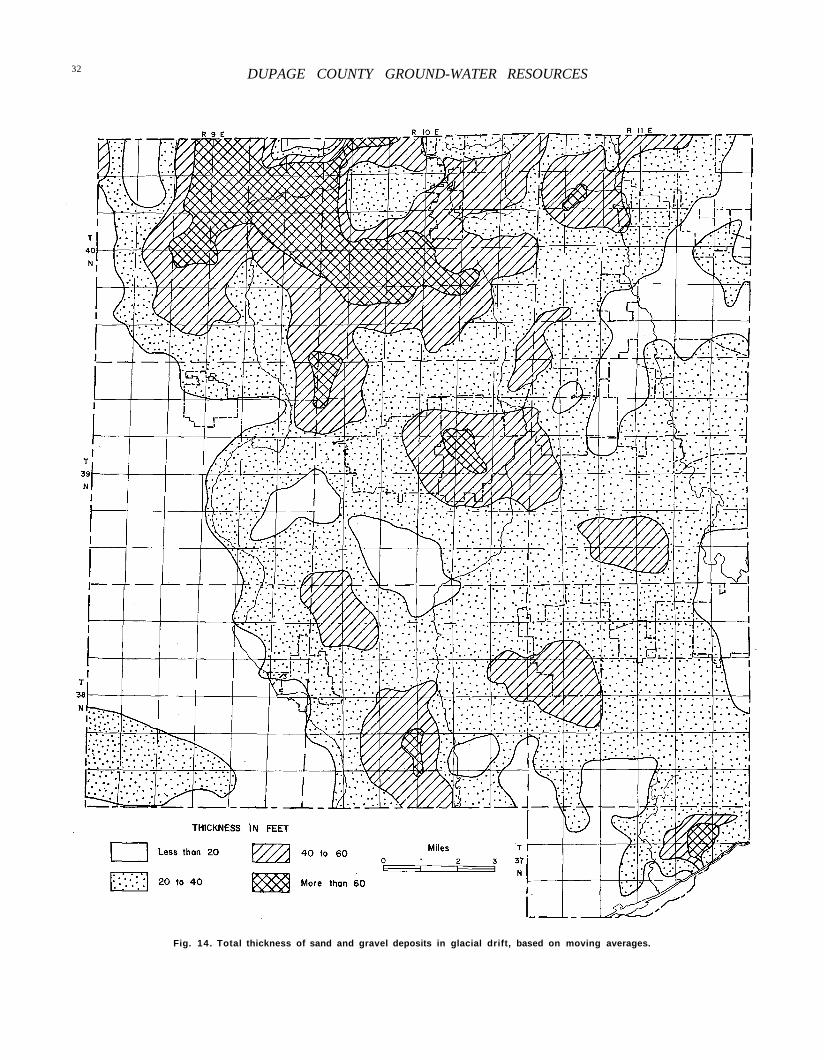
32 DUPAGE COUNTY GROUND-WATER RESOURCES
Fig. 14. Total thickness of sand and gravel deposits in glacial drift, based on moving averages.
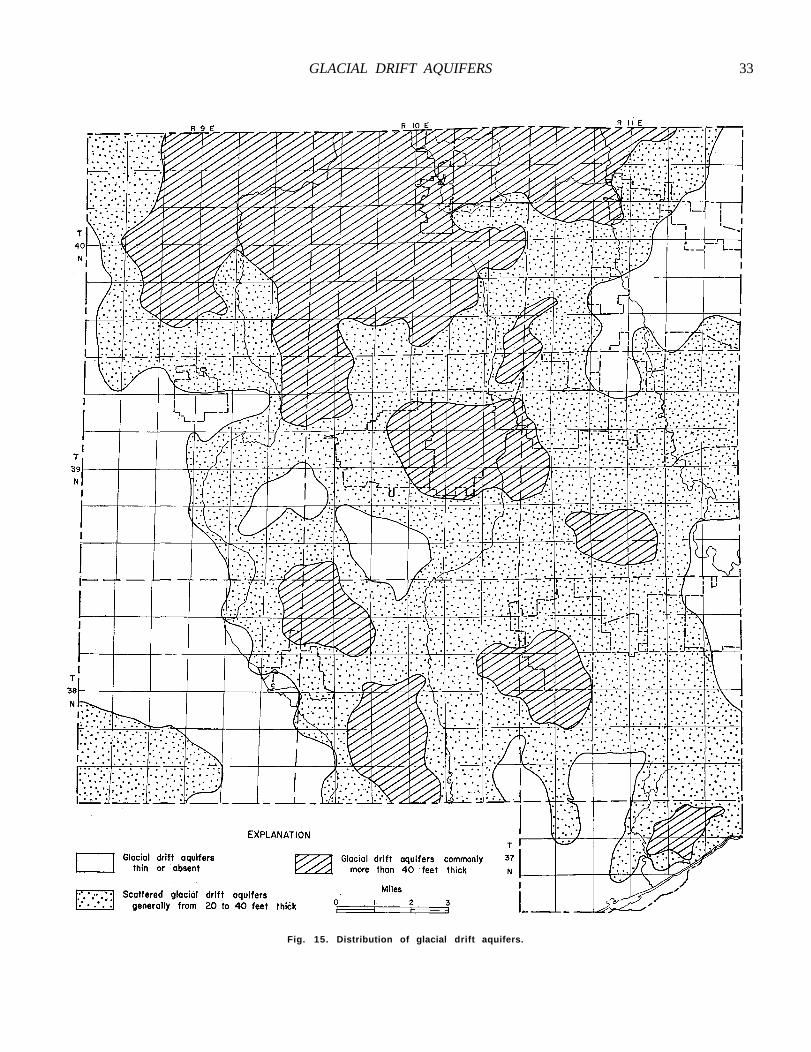
GLACIAL DRIFT AQUIFERS 33
Fig. 15. Distribution of glacial drift aquifers.
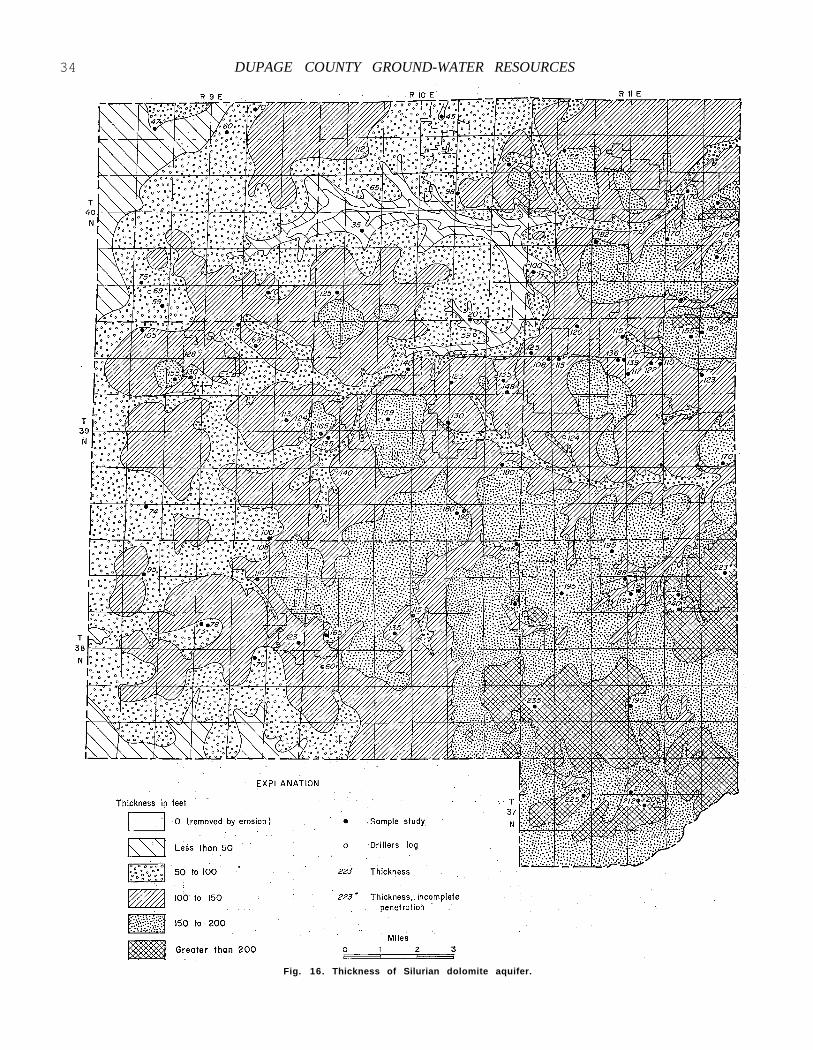
34 DUPAGE COUNTY GROUND-WATER RESOURCES
Fig. 16. Thickness of Silurian dolomite aquifer.
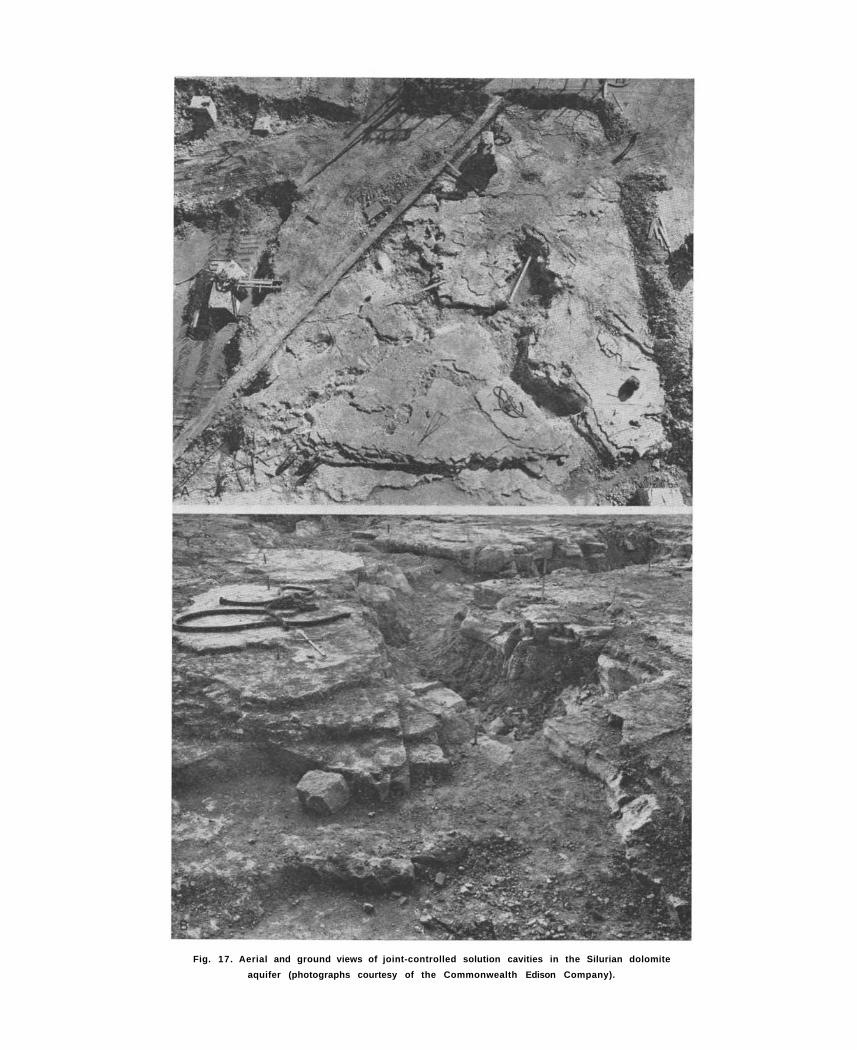
Fig. 17. Aerial and ground views of joint-controlled solution cavities in the Silurian dolomite aquifer (photographs courtesy of the Commonwealth Edison Company).
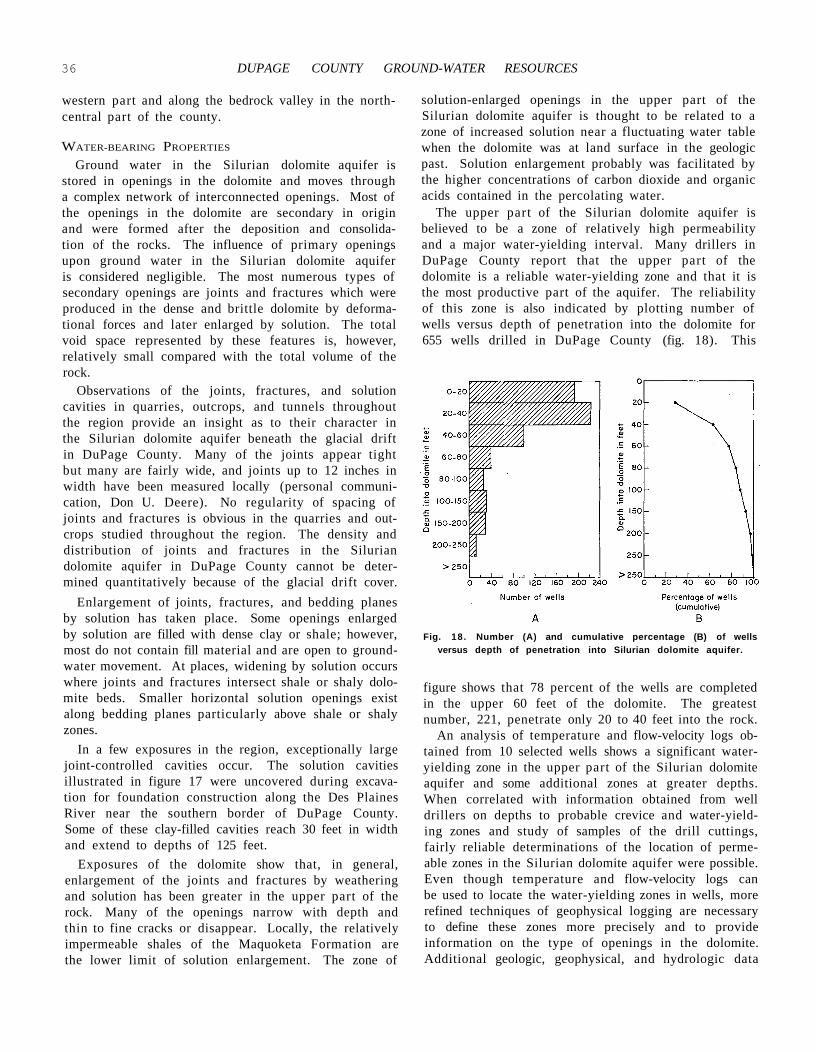
36 DUPAGE COUNTY GROUND-WATER RESOURCES
western part and along the bedrock valley in the north-central part of the county.
WATER-BEARING PROPERTIES
Ground water in the Silurian dolomite aquifer is stored in openings in the dolomite and moves through a complex network of interconnected openings. Most of the openings in the dolomite are secondary in origin and were formed after the deposition and consolidation of the rocks. The influence of primary openings upon ground water in the Silurian dolomite aquifer is considered negligible. The most numerous types of secondary openings are joints and fractures which were produced in the dense and brittle dolomite by deforma-tional forces and later enlarged by solution. The total void space represented by these features is, however, relatively small compared with the total volume of the rock.
Observations of the joints, fractures, and solution cavities in quarries, outcrops, and tunnels throughout the region provide an insight as to their character in the Silurian dolomite aquifer beneath the glacial drift in DuPage County. Many of the joints appear tight but many are fairly wide, and joints up to 12 inches in width have been measured locally (personal communication, Don U. Deere). No regularity of spacing of joints and fractures is obvious in the quarries and outcrops studied throughout the region. The density and distribution of joints and fractures in the Silurian dolomite aquifer in DuPage County cannot be determined quantitatively because of the glacial drift cover.
Enlargement of joints, fractures, and bedding planes by solution has taken place. Some openings enlarged by solution are filled with dense clay or shale; however, most do not contain fill material and are open to groundwater movement. At places, widening by solution occurs where joints and fractures intersect shale or shaly dolomite beds. Smaller horizontal solution openings exist along bedding planes particularly above shale or shaly zones.
In a few exposures in the region, exceptionally large joint-controlled cavities occur. The solution cavities illustrated in figure 17 were uncovered during excavation for foundation construction along the Des Plaines River near the southern border of DuPage County. Some of these clay-filled cavities reach 30 feet in width and extend to depths of 125 feet.
Exposures of the dolomite show that, in general, enlargement of the joints and fractures by weathering and solution has been greater in the upper part of the rock. Many of the openings narrow with depth and thin to fine cracks or disappear. Locally, the relatively impermeable shales of the Maquoketa Formation are the lower limit of solution enlargement. The zone of
solution-enlarged openings in the upper part of the Silurian dolomite aquifer is thought to be related to a zone of increased solution near a fluctuating water table when the dolomite was at land surface in the geologic past. Solution enlargement probably was facilitated by the higher concentrations of carbon dioxide and organic acids contained in the percolating water.
The upper part of the Silurian dolomite aquifer is believed to be a zone of relatively high permeability and a major water-yielding interval. Many drillers in DuPage County report that the upper part of the dolomite is a reliable water-yielding zone and that it is the most productive part of the aquifer. The reliability of this zone is also indicated by plotting number of wells versus depth of penetration into the dolomite for 655 wells drilled in DuPage County (fig. 18). This
Fig. 18. Number (A) and cumulative percentage (B) of wells versus depth of penetration into Silurian dolomite aquifer.
figure shows that 78 percent of the wells are completed in the upper 60 feet of the dolomite. The greatest number, 221, penetrate only 20 to 40 feet into the rock.
An analysis of temperature and flow-velocity logs obtained from 10 selected wells shows a significant water-yielding zone in the upper part of the Silurian dolomite aquifer and some additional zones at greater depths. When correlated with information obtained from well drillers on depths to probable crevice and water-yielding zones and study of samples of the drill cuttings, fairly reliable determinations of the location of permeable zones in the Silurian dolomite aquifer were possible. Even though temperature and flow-velocity logs can be used to locate the water-yielding zones in wells, more refined techniques of geophysical logging are necessary to define these zones more precisely and to provide information on the type of openings in the dolomite. Additional geologic, geophysical, and hydrologic data
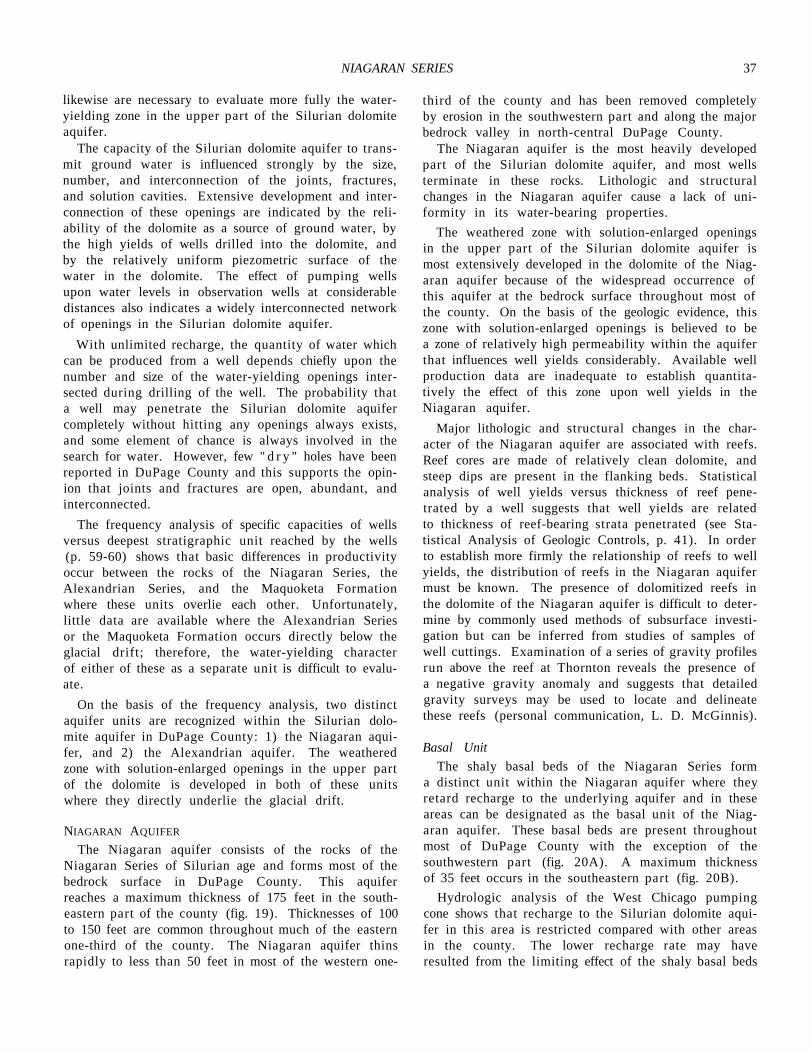
NIAGARAN SERIES 37
likewise are necessary to evaluate more fully the water-yielding zone in the upper part of the Silurian dolomite aquifer.
The capacity of the Silurian dolomite aquifer to transmit ground water is influenced strongly by the size, number, and interconnection of the joints, fractures, and solution cavities. Extensive development and interconnection of these openings are indicated by the reliability of the dolomite as a source of ground water, by the high yields of wells drilled into the dolomite, and by the relatively uniform piezometric surface of the water in the dolomite. The effect of pumping wells upon water levels in observation wells at considerable distances also indicates a widely interconnected network of openings in the Silurian dolomite aquifer.
With unlimited recharge, the quantity of water which can be produced from a well depends chiefly upon the number and size of the water-yielding openings intersected during drilling of the well. The probability that a well may penetrate the Silurian dolomite aquifer completely without hitting any openings always exists, and some element of chance is always involved in the search for water. However, few " d r y " holes have been reported in DuPage County and this supports the opinion that joints and fractures are open, abundant, and interconnected.
The frequency analysis of specific capacities of wells versus deepest stratigraphic unit reached by the wells (p. 59-60) shows that basic differences in productivity occur between the rocks of the Niagaran Series, the Alexandrian Series, and the Maquoketa Formation where these units overlie each other. Unfortunately, little data are available where the Alexandrian Series or the Maquoketa Formation occurs directly below the glacial drift; therefore, the water-yielding character of either of these as a separate unit is difficult to evaluate.
On the basis of the frequency analysis, two distinct aquifer units are recognized within the Silurian dolomite aquifer in DuPage County: 1) the Niagaran aquifer, and 2) the Alexandrian aquifer. The weathered zone with solution-enlarged openings in the upper part of the dolomite is developed in both of these units where they directly underlie the glacial drift.
NIAGARAN AQUIFER
The Niagaran aquifer consists of the rocks of the Niagaran Series of Silurian age and forms most of the bedrock surface in DuPage County. This aquifer reaches a maximum thickness of 175 feet in the southeastern part of the county (fig. 19). Thicknesses of 100 to 150 feet are common throughout much of the eastern one-third of the county. The Niagaran aquifer thins rapidly to less than 50 feet in most of the western one-
third of the county and has been removed completely by erosion in the southwestern part and along the major bedrock valley in north-central DuPage County.
The Niagaran aquifer is the most heavily developed part of the Silurian dolomite aquifer, and most wells terminate in these rocks. Lithologic and structural changes in the Niagaran aquifer cause a lack of uniformity in its water-bearing properties.
The weathered zone with solution-enlarged openings in the upper part of the Silurian dolomite aquifer is most extensively developed in the dolomite of the Niagaran aquifer because of the widespread occurrence of this aquifer at the bedrock surface throughout most of the county. On the basis of the geologic evidence, this zone with solution-enlarged openings is believed to be a zone of relatively high permeability within the aquifer that influences well yields considerably. Available well production data are inadequate to establish quantitatively the effect of this zone upon well yields in the Niagaran aquifer.
Major lithologic and structural changes in the character of the Niagaran aquifer are associated with reefs. Reef cores are made of relatively clean dolomite, and steep dips are present in the flanking beds. Statistical analysis of well yields versus thickness of reef penetrated by a well suggests that well yields are related to thickness of reef-bearing strata penetrated (see Statistical Analysis of Geologic Controls, p. 41). In order to establish more firmly the relationship of reefs to well yields, the distribution of reefs in the Niagaran aquifer must be known. The presence of dolomitized reefs in the dolomite of the Niagaran aquifer is difficult to determine by commonly used methods of subsurface investigation but can be inferred from studies of samples of well cuttings. Examination of a series of gravity profiles run above the reef at Thornton reveals the presence of a negative gravity anomaly and suggests that detailed gravity surveys may be used to locate and delineate these reefs (personal communication, L. D. McGinnis).
Basal Unit The shaly basal beds of the Niagaran Series form
a distinct unit within the Niagaran aquifer where they retard recharge to the underlying aquifer and in these areas can be designated as the basal unit of the Niagaran aquifer. These basal beds are present throughout most of DuPage County with the exception of the southwestern part (fig. 20A). A maximum thickness of 35 feet occurs in the southeastern part (fig. 20B).
Hydrologic analysis of the West Chicago pumping cone shows that recharge to the Silurian dolomite aquifer in this area is restricted compared with other areas in the county. The lower recharge rate may have resulted from the limiting effect of the shaly basal beds
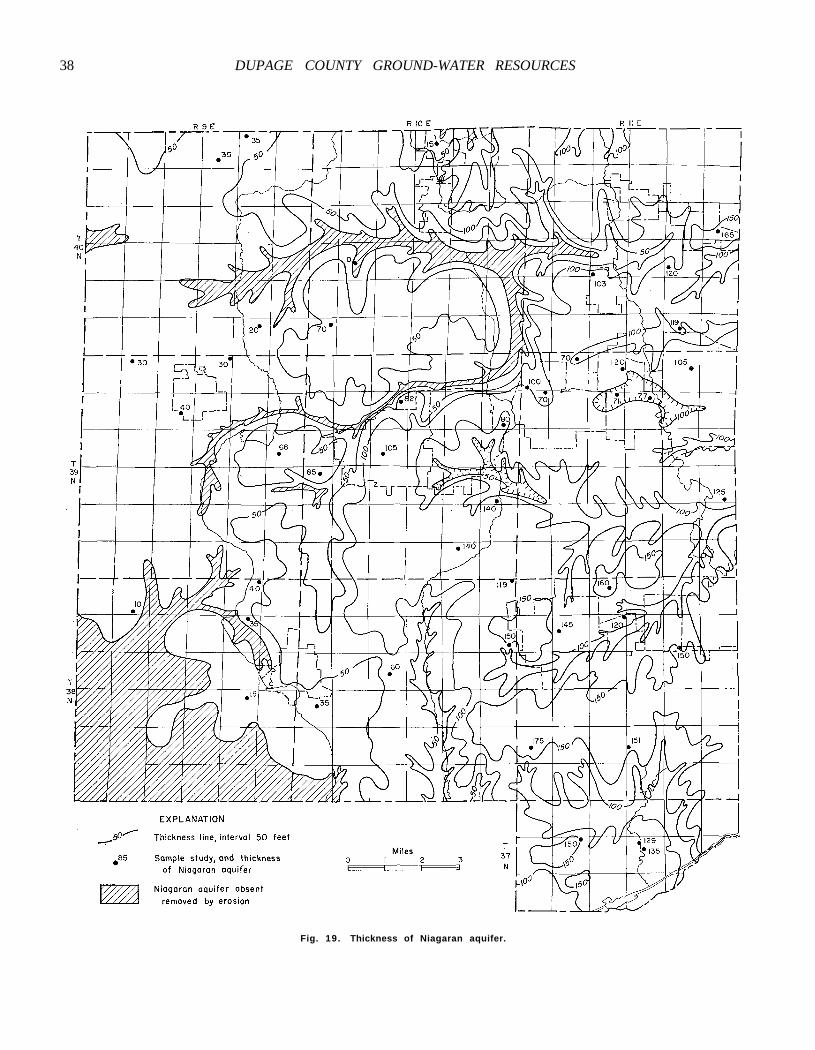
38 DUPAGE COUNTY GROUND-WATER RESOURCES
Fig. 19. Thickness of Niagaran aquifer.
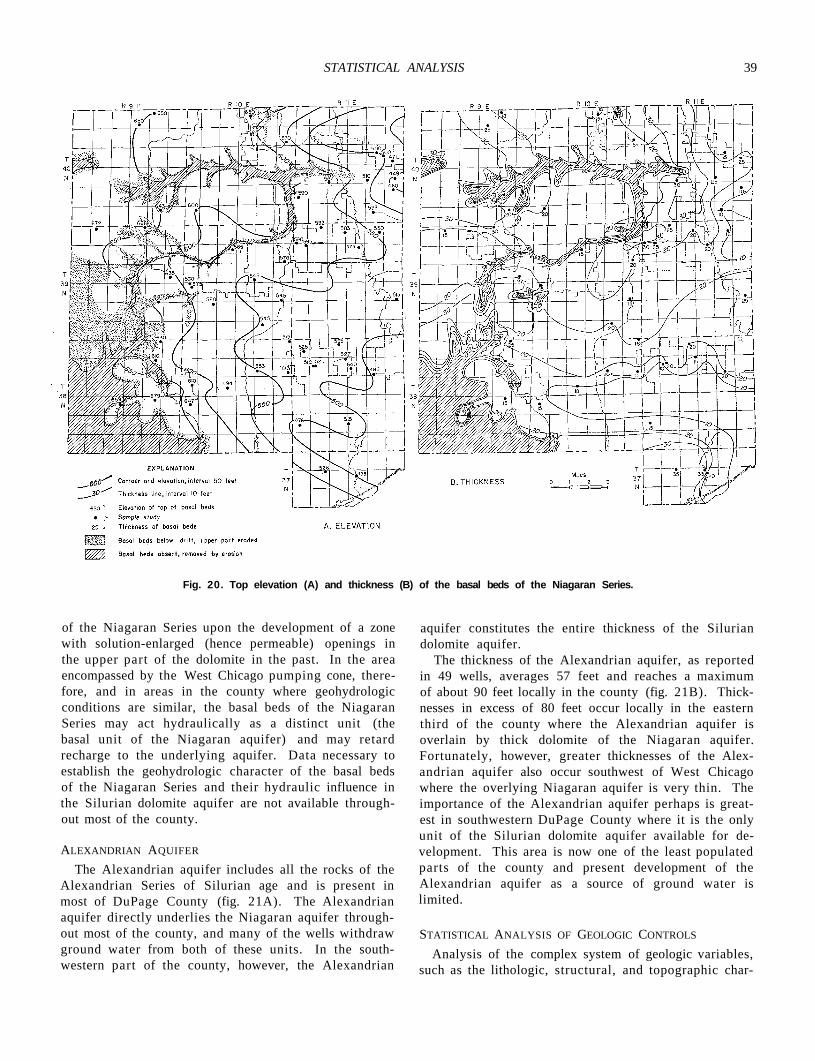
STATISTICAL ANALYSIS 39
Fig. 20. Top elevation (A) and thickness (B) of the basal beds of the Niagaran Series.
of the Niagaran Series upon the development of a zone with solution-enlarged (hence permeable) openings in the upper part of the dolomite in the past. In the area encompassed by the West Chicago pumping cone, therefore, and in areas in the county where geohydrologic conditions are similar, the basal beds of the Niagaran Series may act hydraulically as a distinct unit (the basal unit of the Niagaran aquifer) and may retard recharge to the underlying aquifer. Data necessary to establish the geohydrologic character of the basal beds of the Niagaran Series and their hydraulic influence in the Silurian dolomite aquifer are not available throughout most of the county.
ALEXANDRIAN AQUIFER
The Alexandrian aquifer includes all the rocks of the Alexandrian Series of Silurian age and is present in most of DuPage County (fig. 21A). The Alexandrian aquifer directly underlies the Niagaran aquifer throughout most of the county, and many of the wells withdraw ground water from both of these units. In the southwestern part of the county, however, the Alexandrian
aquifer constitutes the entire thickness of the Silurian dolomite aquifer.
The thickness of the Alexandrian aquifer, as reported in 49 wells, averages 57 feet and reaches a maximum of about 90 feet locally in the county (fig. 21B). Thicknesses in excess of 80 feet occur locally in the eastern third of the county where the Alexandrian aquifer is overlain by thick dolomite of the Niagaran aquifer. Fortunately, however, greater thicknesses of the Alexandrian aquifer also occur southwest of West Chicago where the overlying Niagaran aquifer is very thin. The importance of the Alexandrian aquifer perhaps is greatest in southwestern DuPage County where it is the only unit of the Silurian dolomite aquifer available for development. This area is now one of the least populated parts of the county and present development of the Alexandrian aquifer as a source of ground water is limited.
STATISTICAL ANALYSIS OF GEOLOGIC CONTROLS
Analysis of the complex system of geologic variables, such as the lithologic, structural, and topographic char-
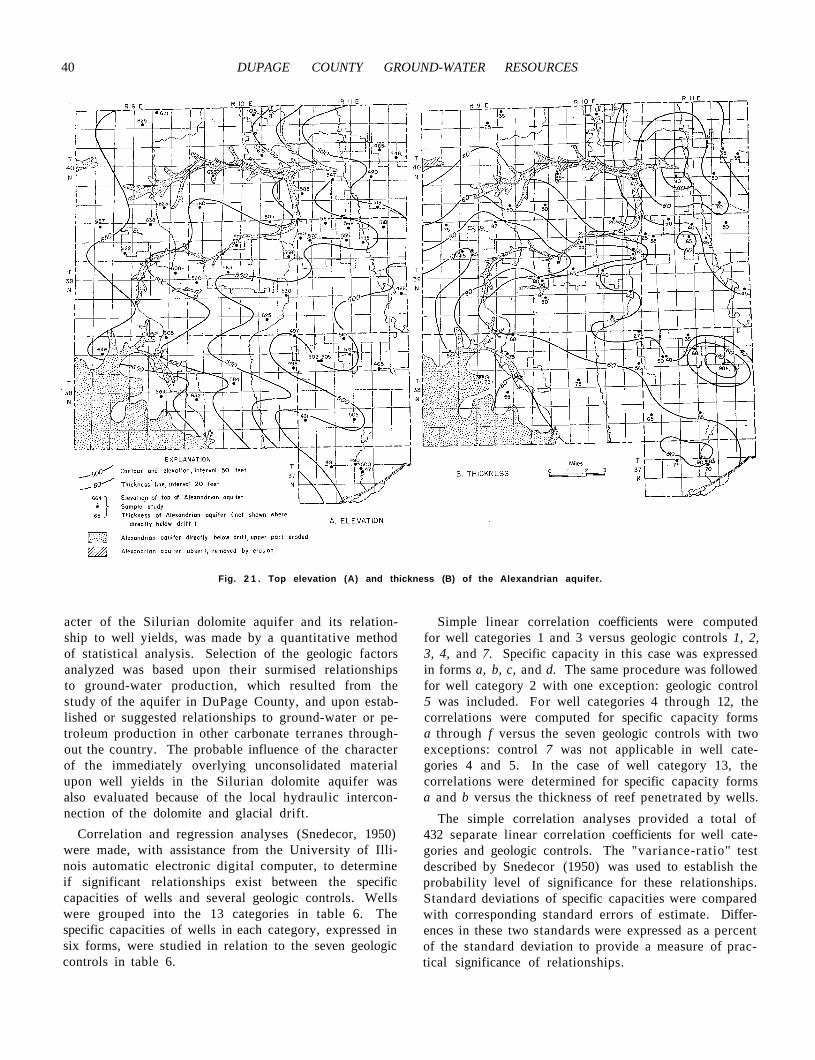
40 DUPAGE COUNTY GROUND-WATER RESOURCES
Fig. 2 1 . Top elevation (A) and thickness (B) of the Alexandrian aquifer.
acter of the Silurian dolomite aquifer and its relationship to well yields, was made by a quantitative method of statistical analysis. Selection of the geologic factors analyzed was based upon their surmised relationships to ground-water production, which resulted from the study of the aquifer in DuPage County, and upon established or suggested relationships to ground-water or petroleum production in other carbonate terranes throughout the country. The probable influence of the character of the immediately overlying unconsolidated material upon well yields in the Silurian dolomite aquifer was also evaluated because of the local hydraulic interconnection of the dolomite and glacial drift.
Correlation and regression analyses (Snedecor, 1950) were made, with assistance from the University of Illinois automatic electronic digital computer, to determine if significant relationships exist between the specific capacities of wells and several geologic controls. Wells were grouped into the 13 categories in table 6. The specific capacities of wells in each category, expressed in six forms, were studied in relation to the seven geologic controls in table 6.
Simple linear correlation coefficients were computed for well categories 1 and 3 versus geologic controls 1, 2, 3, 4, and 7. Specific capacity in this case was expressed in forms a, b, c, and d. The same procedure was followed for well category 2 with one exception: geologic control 5 was included. For well categories 4 through 12, the correlations were computed for specific capacity forms a through f versus the seven geologic controls with two exceptions: control 7 was not applicable in well categories 4 and 5. In the case of well category 13, the correlations were determined for specific capacity forms a and b versus the thickness of reef penetrated by wells.
The simple correlation analyses provided a total of 432 separate linear correlation coefficients for well categories and geologic controls. The "variance-ratio" test described by Snedecor (1950) was used to establish the probability level of significance for these relationships. Standard deviations of specific capacities were compared with corresponding standard errors of estimate. Differences in these two standards were expressed as a percent of the standard deviation to provide a measure of practical significance of relationships.
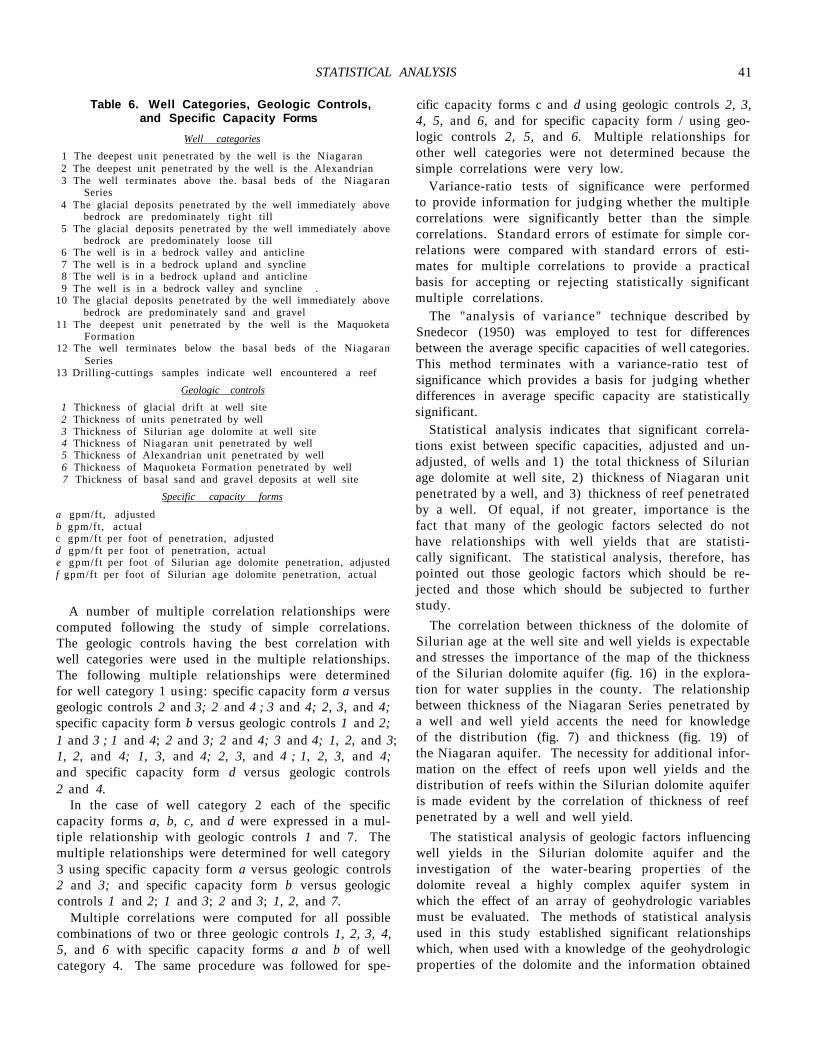
STATISTICAL ANALYSIS 41
Table 6. Well Categories, Geologic Controls, and Specific Capacity Forms
Well categories 1 The deepest unit penetrated by the well is the Niagaran 2 The deepest unit penetrated by the well is the Alexandrian 3 The well terminates above the. basal beds of the Niagaran
Series 4 The glacial deposits penetrated by the well immediately above
bedrock are predominately tight till 5 The glacial deposits penetrated by the well immediately above
bedrock are predominately loose till 6 The well is in a bedrock valley and anticline 7 The well is in a bedrock upland and syncline 8 The well is in a bedrock upland and anticline 9 The well is in a bedrock valley and syncline .
10 The glacial deposits penetrated by the well immediately above bedrock are predominately sand and gravel
11 The deepest unit penetrated by the well is the Maquoketa Formation
12 The well terminates below the basal beds of the Niagaran Series
13 Drilling-cuttings samples indicate well encountered a reef Geologic controls
1 Thickness of glacial drift at well site 2 Thickness of units penetrated by well 3 Thickness of Silurian age dolomite at well site 4 Thickness of Niagaran unit penetrated by well 5 Thickness of Alexandrian unit penetrated by well 6 Thickness of Maquoketa Formation penetrated by well 7 Thickness of basal sand and gravel deposits at well site
Specific capacity forms
a gpm/ft, adjusted b gpm/ft, actual c gpm/f t per foot of penetration, adjusted d gpm/f t per foot of penetration, actual e gpm/ft per foot of Silurian age dolomite penetration, adjusted f gpm/ft per foot of Silurian age dolomite penetration, actual
A number of multiple correlation relationships were computed following the study of simple correlations. The geologic controls having the best correlation with well categories were used in the multiple relationships. The following multiple relationships were determined for well category 1 using: specific capacity form a versus geologic controls 2 and 3; 2 and 4 ; 3 and 4; 2, 3, and 4; specific capacity form b versus geologic controls 1 and 2; 1 and 3 ; 1 and 4; 2 and 3; 2 and 4; 3 and 4; 1, 2, and 3; 1, 2, and 4; 1, 3, and 4; 2, 3, and 4 ; 1, 2, 3, and 4; and specific capacity form d versus geologic controls 2 and 4.
In the case of well category 2 each of the specific capacity forms a, b, c, and d were expressed in a multiple relationship with geologic controls 1 and 7. The multiple relationships were determined for well category 3 using specific capacity form a versus geologic controls 2 and 3; and specific capacity form b versus geologic controls 1 and 2; 1 and 3; 2 and 3; 1, 2, and 7.
Multiple correlations were computed for all possible combinations of two or three geologic controls 1, 2, 3, 4, 5, and 6 with specific capacity forms a and b of well category 4. The same procedure was followed for spe
cific capacity forms c and d using geologic controls 2, 3, 4, 5, and 6, and for specific capacity form / using geologic controls 2, 5, and 6. Multiple relationships for other well categories were not determined because the simple correlations were very low.
Variance-ratio tests of significance were performed to provide information for judging whether the multiple correlations were significantly better than the simple correlations. Standard errors of estimate for simple correlations were compared with standard errors of estimates for multiple correlations to provide a practical basis for accepting or rejecting statistically significant multiple correlations.
The "analysis of variance" technique described by Snedecor (1950) was employed to test for differences between the average specific capacities of well categories. This method terminates with a variance-ratio test of significance which provides a basis for judging whether differences in average specific capacity are statistically significant.
Statistical analysis indicates that significant correlations exist between specific capacities, adjusted and unadjusted, of wells and 1) the total thickness of Silurian age dolomite at well site, 2) thickness of Niagaran unit penetrated by a well, and 3) thickness of reef penetrated by a well. Of equal, if not greater, importance is the fact that many of the geologic factors selected do not have relationships with well yields that are statistically significant. The statistical analysis, therefore, has pointed out those geologic factors which should be rejected and those which should be subjected to further study.
The correlation between thickness of the dolomite of Silurian age at the well site and well yields is expectable and stresses the importance of the map of the thickness of the Silurian dolomite aquifer (fig. 16) in the exploration for water supplies in the county. The relationship between thickness of the Niagaran Series penetrated by a well and well yield accents the need for knowledge of the distribution (fig. 7) and thickness (fig. 19) of the Niagaran aquifer. The necessity for additional information on the effect of reefs upon well yields and the distribution of reefs within the Silurian dolomite aquifer is made evident by the correlation of thickness of reef penetrated by a well and well yield.
The statistical analysis of geologic factors influencing well yields in the Silurian dolomite aquifer and the investigation of the water-bearing properties of the dolomite reveal a highly complex aquifer system in which the effect of an array of geohydrologic variables must be evaluated. The methods of statistical analysis used in this study established significant relationships which, when used with a knowledge of the geohydrologic properties of the dolomite and the information obtained
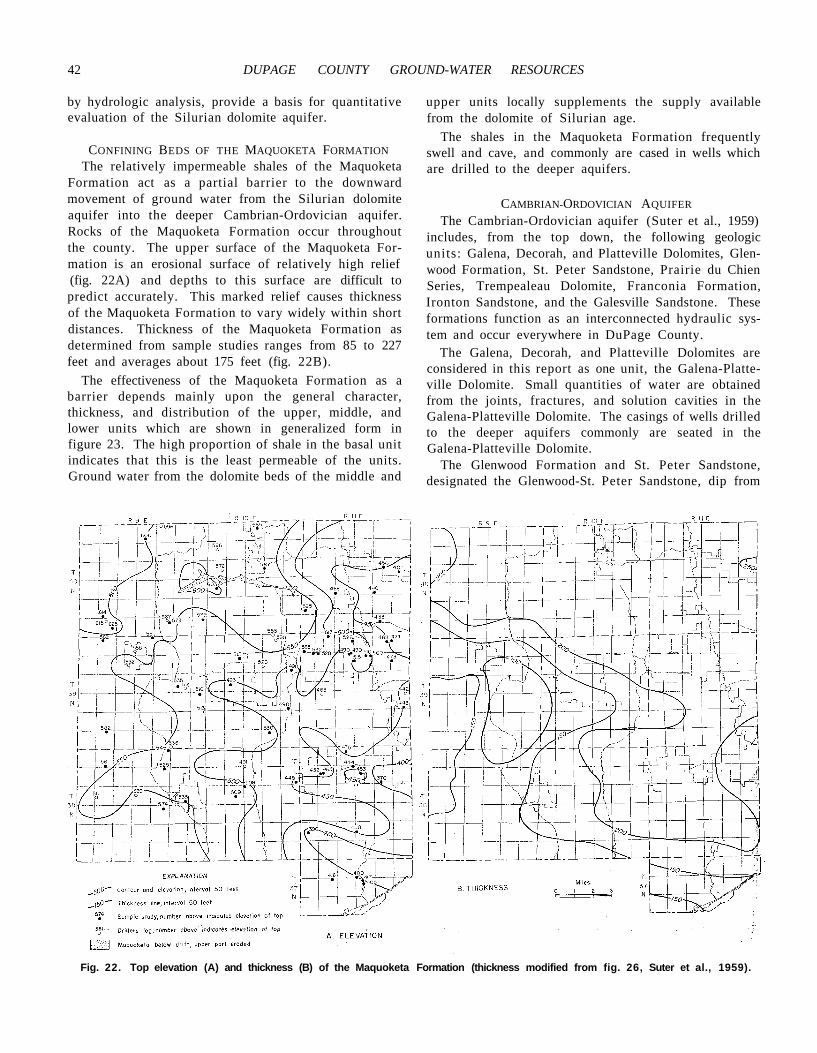
42 DUPAGE COUNTY GROUND-WATER RESOURCES
by hydrologic analysis, provide a basis for quantitative evaluation of the Silurian dolomite aquifer.
CONFINING BEDS OF THE MAQUOKETA FORMATION The relatively impermeable shales of the Maquoketa
Formation act as a partial barrier to the downward movement of ground water from the Silurian dolomite aquifer into the deeper Cambrian-Ordovician aquifer. Rocks of the Maquoketa Formation occur throughout the county. The upper surface of the Maquoketa Formation is an erosional surface of relatively high relief (fig. 22A) and depths to this surface are difficult to predict accurately. This marked relief causes thickness of the Maquoketa Formation to vary widely within short distances. Thickness of the Maquoketa Formation as determined from sample studies ranges from 85 to 227 feet and averages about 175 feet (fig. 22B).
The effectiveness of the Maquoketa Formation as a barrier depends mainly upon the general character, thickness, and distribution of the upper, middle, and lower units which are shown in generalized form in figure 23. The high proportion of shale in the basal unit indicates that this is the least permeable of the units. Ground water from the dolomite beds of the middle and
upper units locally supplements the supply available from the dolomite of Silurian age.
The shales in the Maquoketa Formation frequently swell and cave, and commonly are cased in wells which are drilled to the deeper aquifers.
CAMBRIAN-ORDOVICIAN AQUIFER The Cambrian-Ordovician aquifer (Suter et al., 1959)
includes, from the top down, the following geologic units: Galena, Decorah, and Platteville Dolomites, Glen-wood Formation, St. Peter Sandstone, Prairie du Chien Series, Trempealeau Dolomite, Franconia Formation, Ironton Sandstone, and the Galesville Sandstone. These formations function as an interconnected hydraulic system and occur everywhere in DuPage County.
The Galena, Decorah, and Platteville Dolomites are considered in this report as one unit, the Galena-Platte-ville Dolomite. Small quantities of water are obtained from the joints, fractures, and solution cavities in the Galena-Platteville Dolomite. The casings of wells drilled to the deeper aquifers commonly are seated in the Galena-Platteville Dolomite.
The Glenwood Formation and St. Peter Sandstone, designated the Glenwood-St. Peter Sandstone, dip from
Fig. 22. Top elevation (A) and thickness (B) of the Maquoketa Formation (thickness modified from fig. 26, Suter et al., 1959).
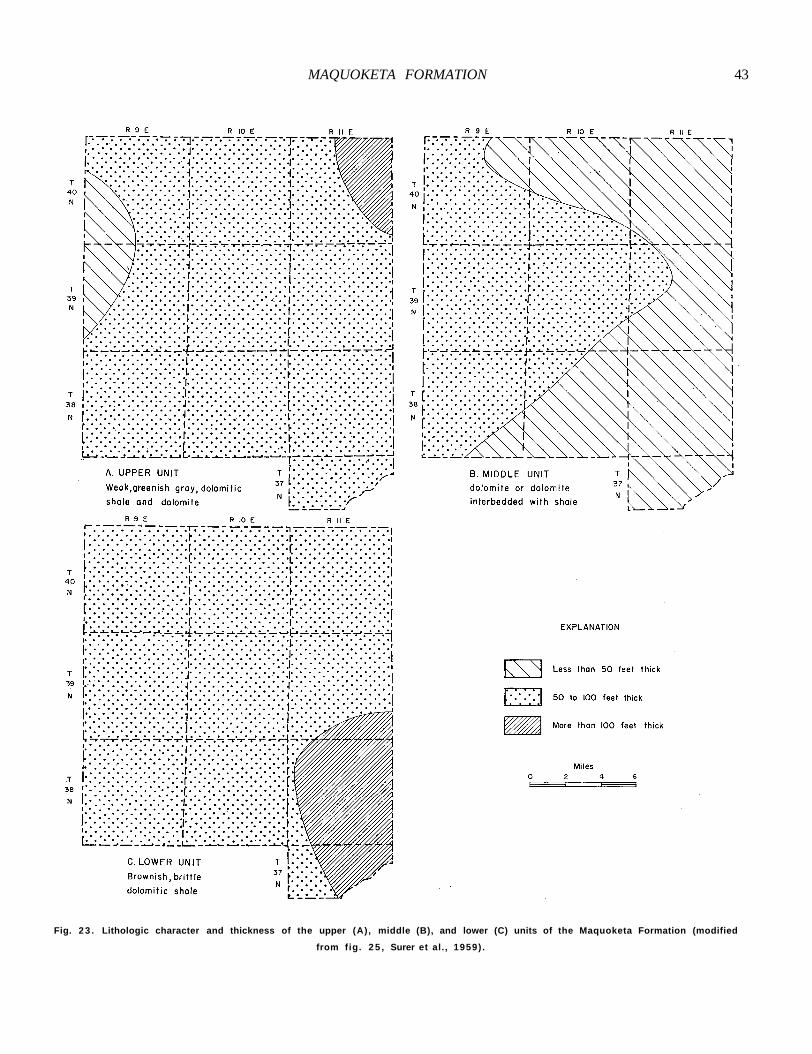
MAQUOKETA FORMATION 43
Fig. 2 3 . Lithologic character and thickness of the upper (A), middle (B), and lower (C) units of the Maquoketa Formation (modified
from fig. 2 5 , Surer et al., 1959) .
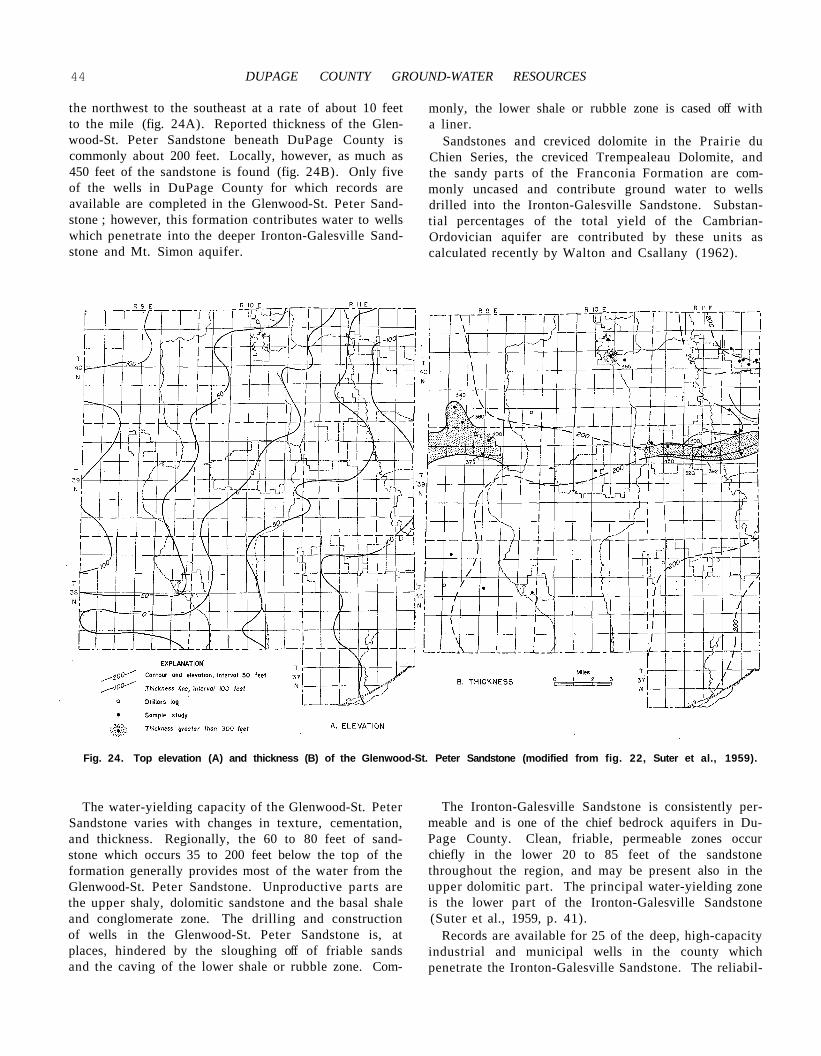
44 DUPAGE COUNTY GROUND-WATER RESOURCES
the northwest to the southeast at a rate of about 10 feet to the mile (fig. 24A). Reported thickness of the Glenwood-St. Peter Sandstone beneath DuPage County is commonly about 200 feet. Locally, however, as much as 450 feet of the sandstone is found (fig. 24B). Only five of the wells in DuPage County for which records are available are completed in the Glenwood-St. Peter Sandstone ; however, this formation contributes water to wells which penetrate into the deeper Ironton-Galesville Sandstone and Mt. Simon aquifer.
monly, the lower shale or rubble zone is cased off with a liner.
Sandstones and creviced dolomite in the Prairie du Chien Series, the creviced Trempealeau Dolomite, and the sandy parts of the Franconia Formation are commonly uncased and contribute ground water to wells drilled into the Ironton-Galesville Sandstone. Substantial percentages of the total yield of the Cambrian-Ordovician aquifer are contributed by these units as calculated recently by Walton and Csallany (1962).
Fig. 24. Top elevation (A) and thickness (B) of the Glenwood-St. Peter Sandstone (modified from fig. 22, Suter et al., 1959).
The water-yielding capacity of the Glenwood-St. Peter Sandstone varies with changes in texture, cementation, and thickness. Regionally, the 60 to 80 feet of sandstone which occurs 35 to 200 feet below the top of the formation generally provides most of the water from the Glenwood-St. Peter Sandstone. Unproductive parts are the upper shaly, dolomitic sandstone and the basal shale and conglomerate zone. The drilling and construction of wells in the Glenwood-St. Peter Sandstone is, at places, hindered by the sloughing off of friable sands and the caving of the lower shale or rubble zone. Com-
The Ironton-Galesville Sandstone is consistently permeable and is one of the chief bedrock aquifers in DuPage County. Clean, friable, permeable zones occur chiefly in the lower 20 to 85 feet of the sandstone throughout the region, and may be present also in the upper dolomitic part. The principal water-yielding zone is the lower part of the Ironton-Galesville Sandstone (Suter et al., 1959, p. 41).
Records are available for 25 of the deep, high-capacity industrial and municipal wells in the county which penetrate the Ironton-Galesville Sandstone. The reliabil-
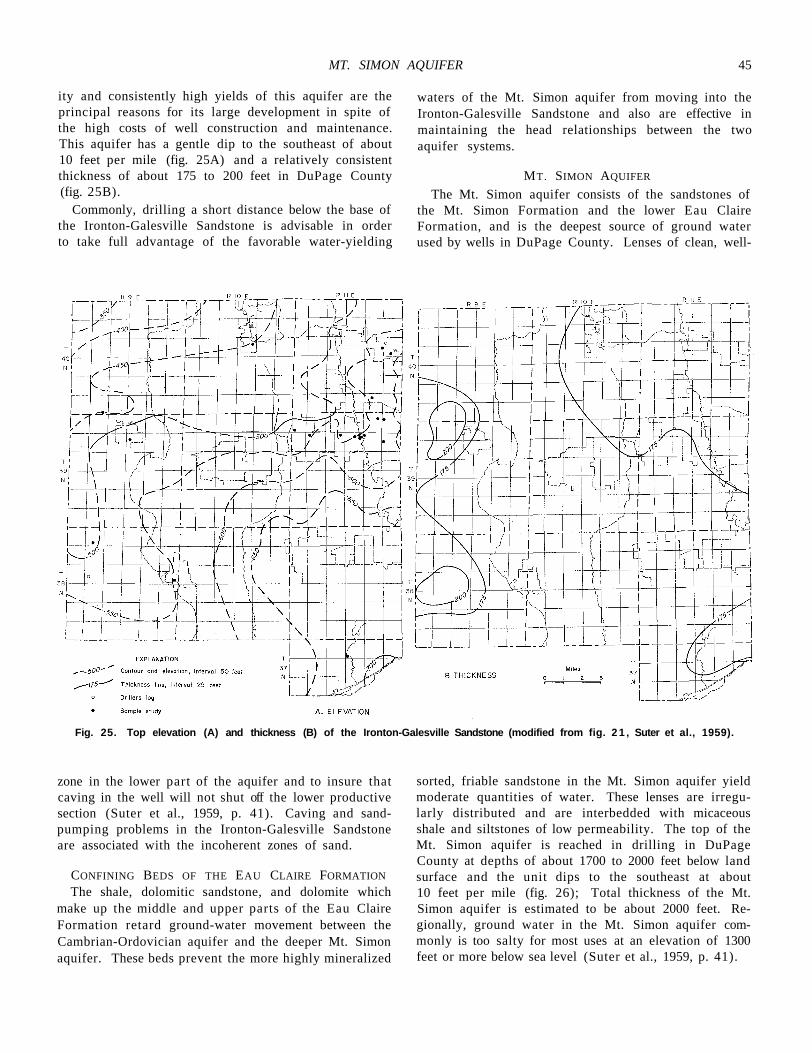
MT. SIMON AQUIFER 45
ity and consistently high yields of this aquifer are the principal reasons for its large development in spite of the high costs of well construction and maintenance. This aquifer has a gentle dip to the southeast of about 10 feet per mile (fig. 25A) and a relatively consistent thickness of about 175 to 200 feet in DuPage County (fig. 25B).
Commonly, drilling a short distance below the base of the Ironton-Galesville Sandstone is advisable in order to take full advantage of the favorable water-yielding
waters of the Mt. Simon aquifer from moving into the Ironton-Galesville Sandstone and also are effective in maintaining the head relationships between the two aquifer systems.
MT. SIMON AQUIFER
The Mt. Simon aquifer consists of the sandstones of the Mt. Simon Formation and the lower Eau Claire Formation, and is the deepest source of ground water used by wells in DuPage County. Lenses of clean, well-
Fig. 25. Top elevation (A) and thickness (B) of the Ironton-Galesville Sandstone (modified from fig. 2 1 , Suter et al., 1959).
zone in the lower part of the aquifer and to insure that caving in the well will not shut off the lower productive section (Suter et al., 1959, p. 41). Caving and sand-pumping problems in the Ironton-Galesville Sandstone are associated with the incoherent zones of sand.
CONFINING BEDS OF THE EAU CLAIRE FORMATION The shale, dolomitic sandstone, and dolomite which
make up the middle and upper parts of the Eau Claire Formation retard ground-water movement between the Cambrian-Ordovician aquifer and the deeper Mt. Simon aquifer. These beds prevent the more highly mineralized
sorted, friable sandstone in the Mt. Simon aquifer yield moderate quantities of water. These lenses are irregularly distributed and are interbedded with micaceous shale and siltstones of low permeability. The top of the Mt. Simon aquifer is reached in drilling in DuPage County at depths of about 1700 to 2000 feet below land surface and the unit dips to the southeast at about 10 feet per mile (fig. 26); Total thickness of the Mt. Simon aquifer is estimated to be about 2000 feet. Regionally, ground water in the Mt. Simon aquifer commonly is too salty for most uses at an elevation of 1300 feet or more below sea level (Suter et al., 1959, p. 41).
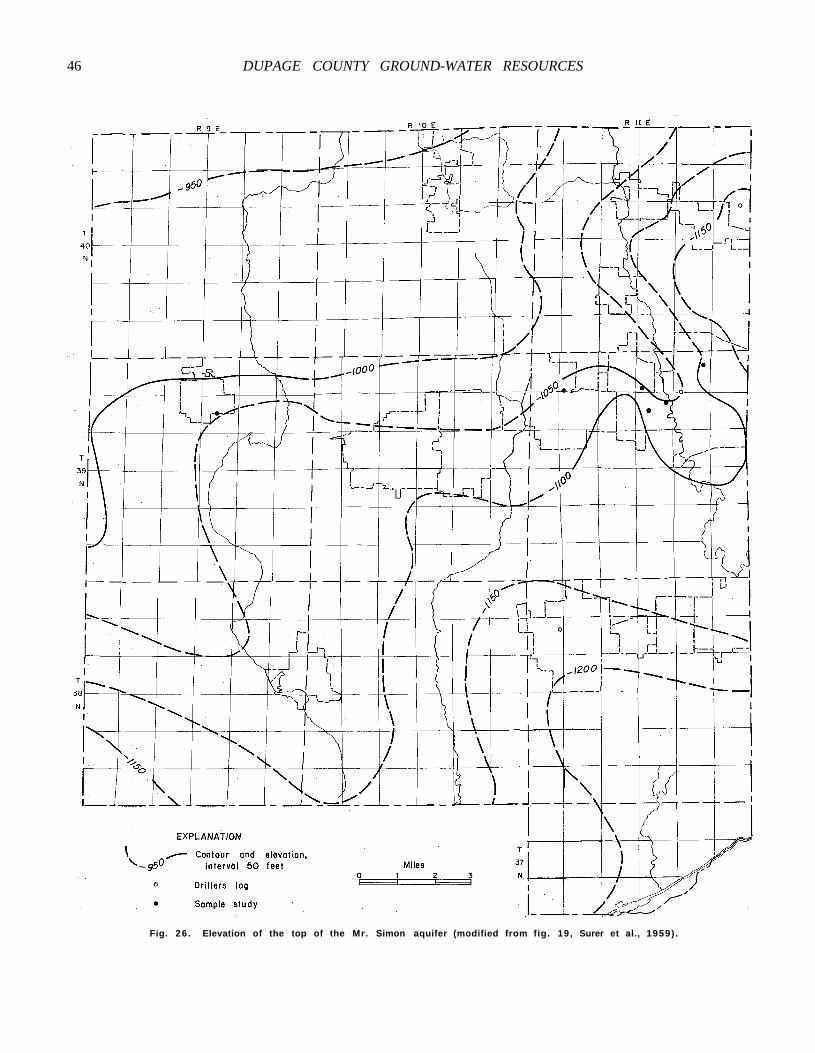
46 DUPAGE COUNTY GROUND-WATER RESOURCES
Fig. 26 . Elevation of the top of the Mr. Simon aquifer (modified from fig. 19, Surer et al., 1959) .
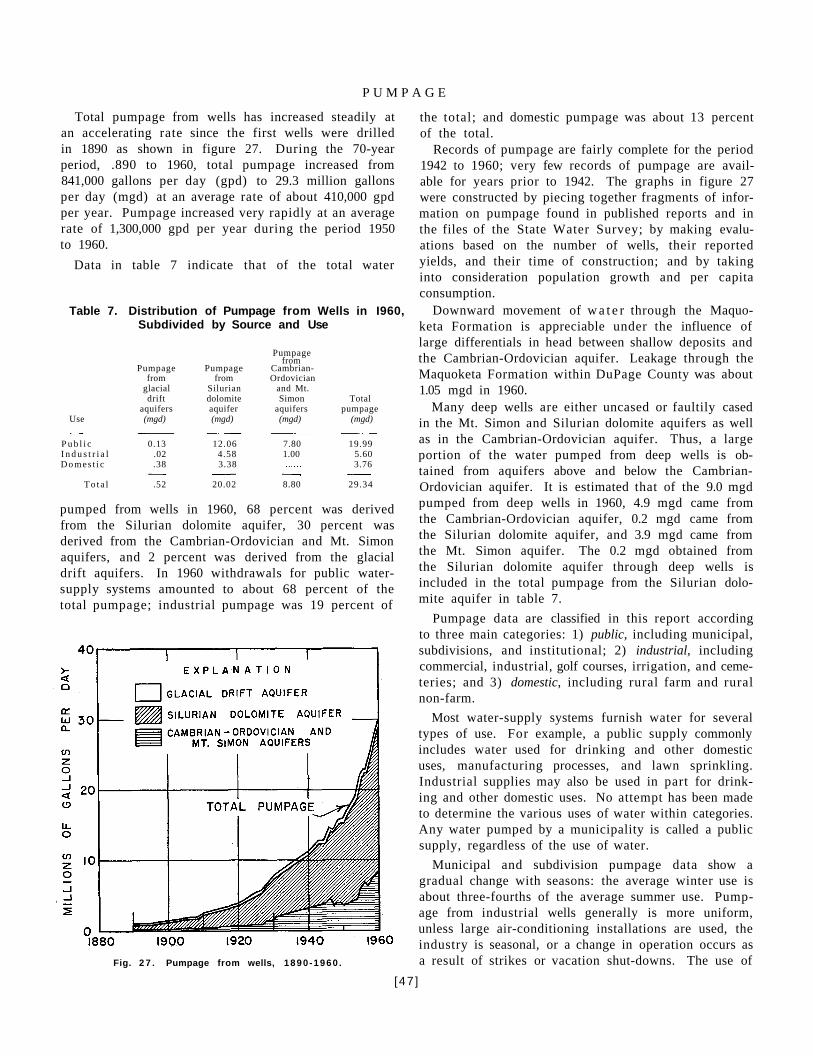
P U M P A G E
Total pumpage from wells has increased steadily at an accelerating rate since the first wells were drilled in 1890 as shown in figure 27. During the 70-year period, .890 to 1960, total pumpage increased from 841,000 gallons per day (gpd) to 29.3 million gallons per day (mgd) at an average rate of about 410,000 gpd per year. Pumpage increased very rapidly at an average rate of 1,300,000 gpd per year during the period 1950 to 1960.
Data in table 7 indicate that of the total water
Table 7. Distribution of Pumpage from Wells in I960, Subdivided by Source and Use
pumped from wells in 1960, 68 percent was derived from the Silurian dolomite aquifer, 30 percent was derived from the Cambrian-Ordovician and Mt. Simon aquifers, and 2 percent was derived from the glacial drift aquifers. In 1960 withdrawals for public water-supply systems amounted to about 68 percent of the total pumpage; industrial pumpage was 19 percent of
Fig. 2 7 . Pumpage from wells, 1890 -1960 .
the total; and domestic pumpage was about 13 percent of the total.
Records of pumpage are fairly complete for the period 1942 to 1960; very few records of pumpage are available for years prior to 1942. The graphs in figure 27 were constructed by piecing together fragments of information on pumpage found in published reports and in the files of the State Water Survey; by making evaluations based on the number of wells, their reported yields, and their time of construction; and by taking into consideration population growth and per capita consumption.
Downward movement of w a t e r through the Maquo-keta Formation is appreciable under the influence of large differentials in head between shallow deposits and the Cambrian-Ordovician aquifer. Leakage through the Maquoketa Formation within DuPage County was about 1.05 mgd in 1960.
Many deep wells are either uncased or faultily cased in the Mt. Simon and Silurian dolomite aquifers as well as in the Cambrian-Ordovician aquifer. Thus, a large portion of the water pumped from deep wells is obtained from aquifers above and below the Cambrian-Ordovician aquifer. It is estimated that of the 9.0 mgd pumped from deep wells in 1960, 4.9 mgd came from the Cambrian-Ordovician aquifer, 0.2 mgd came from the Silurian dolomite aquifer, and 3.9 mgd came from the Mt. Simon aquifer. The 0.2 mgd obtained from the Silurian dolomite aquifer through deep wells is included in the total pumpage from the Silurian dolomite aquifer in table 7.
Pumpage data are classified in this report according to three main categories: 1) public, including municipal, subdivisions, and institutional; 2) industrial, including commercial, industrial, golf courses, irrigation, and cemeteries; and 3) domestic, including rural farm and rural non-farm.
Most water-supply systems furnish water for several types of use. For example, a public supply commonly includes water used for drinking and other domestic uses, manufacturing processes, and lawn sprinkling. Industrial supplies may also be used in part for drinking and other domestic uses. No attempt has been made to determine the various uses of water within categories. Any water pumped by a municipality is called a public supply, regardless of the use of water.
Municipal and subdivision pumpage data show a gradual change with seasons: the average winter use is about three-fourths of the average summer use. Pumpage from industrial wells generally is more uniform, unless large air-conditioning installations are used, the industry is seasonal, or a change in operation occurs as a result of strikes or vacation shut-downs. The use of
[47 ]
Pumpage from
Pumpage Pumpage Cambrian-from from Ordovician
glacial Silurian and Mt. drift dolomite Simon Total
aquifers aquifer aquifers pumpage Use (mgd) (mgd) (mgd) (mgd)
P u b l i c 0.13 12.06 7.80 19.99 I n d u s t r i a l .02 4.58 1.00 5.60 Domes t i c .38 3.38 3.76
T o t a l .52 20.02 8.80 29.34
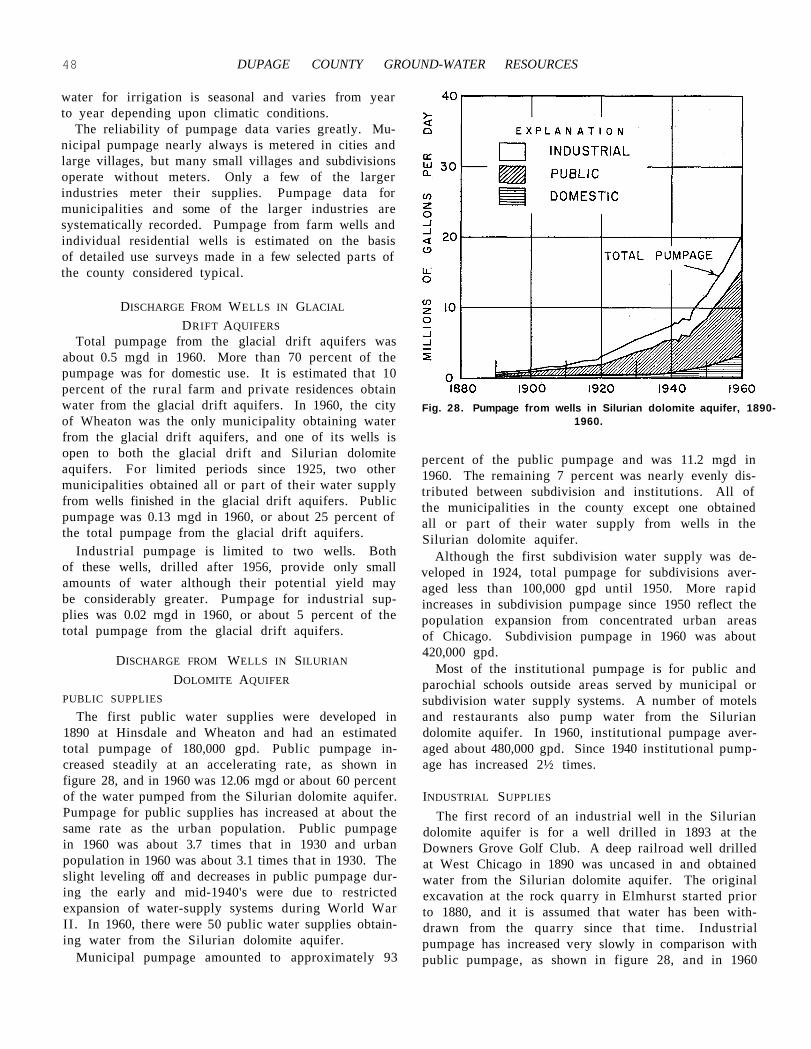
48 DUPAGE COUNTY GROUND-WATER RESOURCES
water for irrigation is seasonal and varies from year to year depending upon climatic conditions.
The reliability of pumpage data varies greatly. Municipal pumpage nearly always is metered in cities and large villages, but many small villages and subdivisions operate without meters. Only a few of the larger industries meter their supplies. Pumpage data for municipalities and some of the larger industries are systematically recorded. Pumpage from farm wells and individual residential wells is estimated on the basis of detailed use surveys made in a few selected parts of the county considered typical.
DISCHARGE FROM WELLS IN GLACIAL
DRIFT AQUIFERS Total pumpage from the glacial drift aquifers was
about 0.5 mgd in 1960. More than 70 percent of the pumpage was for domestic use. It is estimated that 10 percent of the rural farm and private residences obtain water from the glacial drift aquifers. In 1960, the city of Wheaton was the only municipality obtaining water from the glacial drift aquifers, and one of its wells is open to both the glacial drift and Silurian dolomite aquifers. For limited periods since 1925, two other municipalities obtained all or part of their water supply from wells finished in the glacial drift aquifers. Public pumpage was 0.13 mgd in 1960, or about 25 percent of the total pumpage from the glacial drift aquifers.
Industrial pumpage is limited to two wells. Both of these wells, drilled after 1956, provide only small amounts of water although their potential yield may be considerably greater. Pumpage for industrial supplies was 0.02 mgd in 1960, or about 5 percent of the total pumpage from the glacial drift aquifers.
DISCHARGE FROM WELLS IN SILURIAN
DOLOMITE AQUIFER
PUBLIC SUPPLIES
The first public water supplies were developed in 1890 at Hinsdale and Wheaton and had an estimated total pumpage of 180,000 gpd. Public pumpage increased steadily at an accelerating rate, as shown in figure 28, and in 1960 was 12.06 mgd or about 60 percent of the water pumped from the Silurian dolomite aquifer. Pumpage for public supplies has increased at about the same rate as the urban population. Public pumpage in 1960 was about 3.7 times that in 1930 and urban population in 1960 was about 3.1 times that in 1930. The slight leveling off and decreases in public pumpage during the early and mid-1940's were due to restricted expansion of water-supply systems during World War II . In 1960, there were 50 public water supplies obtaining water from the Silurian dolomite aquifer.
Municipal pumpage amounted to approximately 93
Fig. 28. Pumpage from wells in Silurian dolomite aquifer, 1890-1960.
percent of the public pumpage and was 11.2 mgd in 1960. The remaining 7 percent was nearly evenly distributed between subdivision and institutions. All of the municipalities in the county except one obtained all or part of their water supply from wells in the Silurian dolomite aquifer.
Although the first subdivision water supply was developed in 1924, total pumpage for subdivisions averaged less than 100,000 gpd until 1950. More rapid increases in subdivision pumpage since 1950 reflect the population expansion from concentrated urban areas of Chicago. Subdivision pumpage in 1960 was about 420,000 gpd.
Most of the institutional pumpage is for public and parochial schools outside areas served by municipal or subdivision water supply systems. A number of motels and restaurants also pump water from the Silurian dolomite aquifer. In 1960, institutional pumpage averaged about 480,000 gpd. Since 1940 institutional pumpage has increased 2½ times.
INDUSTRIAL SUPPLIES
The first record of an industrial well in the Silurian dolomite aquifer is for a well drilled in 1893 at the Downers Grove Golf Club. A deep railroad well drilled at West Chicago in 1890 was uncased in and obtained water from the Silurian dolomite aquifer. The original excavation at the rock quarry in Elmhurst started prior to 1880, and it is assumed that water has been withdrawn from the quarry since that time. Industrial pumpage has increased very slowly in comparison with public pumpage, as shown in figure 28, and in 1960
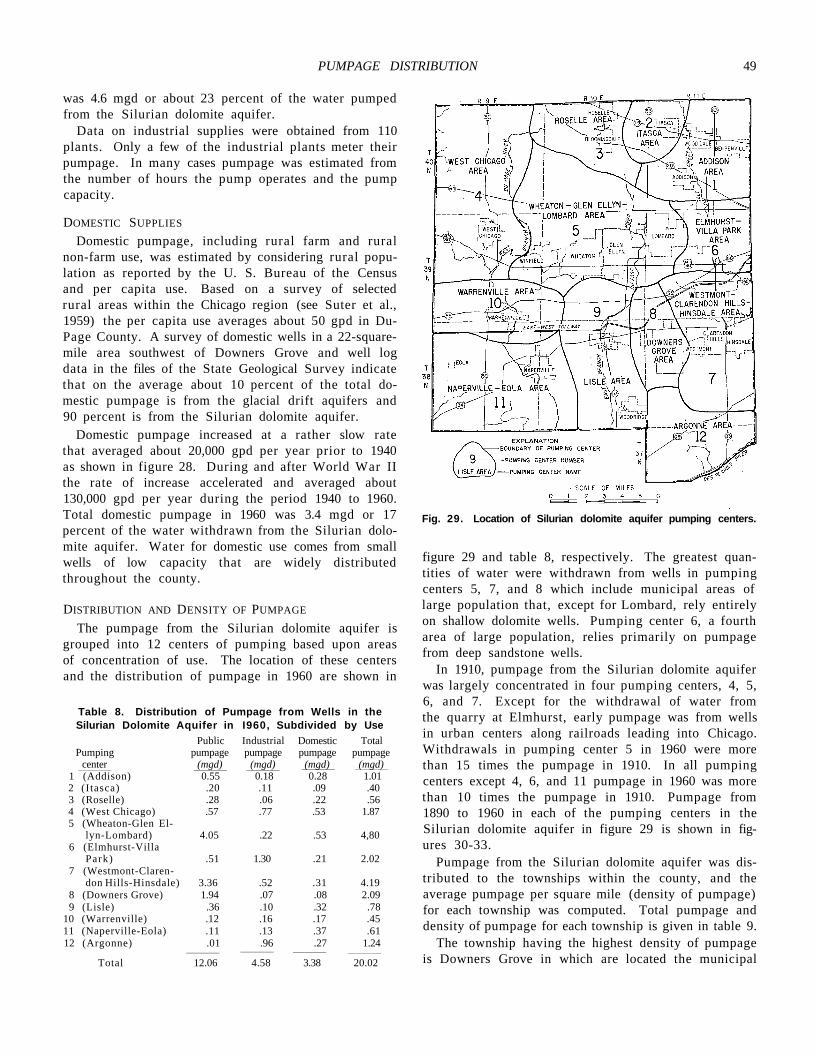
PUMPAGE DISTRIBUTION 49
was 4.6 mgd or about 23 percent of the water pumped from the Silurian dolomite aquifer.
Data on industrial supplies were obtained from 110 plants. Only a few of the industrial plants meter their pumpage. In many cases pumpage was estimated from the number of hours the pump operates and the pump capacity.
DOMESTIC SUPPLIES
Domestic pumpage, including rural farm and rural non-farm use, was estimated by considering rural population as reported by the U. S. Bureau of the Census and per capita use. Based on a survey of selected rural areas within the Chicago region (see Suter et al., 1959) the per capita use averages about 50 gpd in Du-Page County. A survey of domestic wells in a 22-square-mile area southwest of Downers Grove and well log data in the files of the State Geological Survey indicate that on the average about 10 percent of the total domestic pumpage is from the glacial drift aquifers and 90 percent is from the Silurian dolomite aquifer.
Domestic pumpage increased at a rather slow rate that averaged about 20,000 gpd per year prior to 1940 as shown in figure 28. During and after World War II the rate of increase accelerated and averaged about 130,000 gpd per year during the period 1940 to 1960. Total domestic pumpage in 1960 was 3.4 mgd or 17 percent of the water withdrawn from the Silurian dolomite aquifer. Water for domestic use comes from small wells of low capacity that are widely distributed throughout the county.
DISTRIBUTION AND DENSITY OF PUMPAGE
The pumpage from the Silurian dolomite aquifer is grouped into 12 centers of pumping based upon areas of concentration of use. The location of these centers and the distribution of pumpage in 1960 are shown in
Table 8. Distribution of Pumpage from Wells in the Silurian Dolomite Aquifer in I960, Subdivided by Use
Public Industrial Domestic Total Pumping pumpage pumpage pumpage pumpage
center (mgd) (mgd) (mgd) (mgd) 1 (Addison) 0.55 0.18 0.28 1.01 2 (Itasca) .20 .11 .09 .40 3 (Roselle) .28 .06 .22 .56 4 (West Chicago) .57 .77 .53 1.87 5 (Wheaton-Glen El-
lyn-Lombard) 4.05 .22 .53 4,80 6 (Elmhurst-Villa
Park) .51 1.30 .21 2.02 7 (Westmont-Claren-
don Hills-Hinsdale) 3.36 .52 .31 4.19 8 (Downers Grove) 1.94 .07 .08 2.09 9 (Lisle) .36 .10 .32 .78
10 (Warrenville) .12 .16 .17 .45 11 (Naperville-Eola) .11 .13 .37 .61 12 (Argonne) .01 .96 .27 1.24
Total 12.06 4.58 3.38 20.02
Fig. 29. Location of Silurian dolomite aquifer pumping centers.
figure 29 and table 8, respectively. The greatest quantities of water were withdrawn from wells in pumping centers 5, 7, and 8 which include municipal areas of large population that, except for Lombard, rely entirely on shallow dolomite wells. Pumping center 6, a fourth area of large population, relies primarily on pumpage from deep sandstone wells.
In 1910, pumpage from the Silurian dolomite aquifer was largely concentrated in four pumping centers, 4, 5, 6, and 7. Except for the withdrawal of water from the quarry at Elmhurst, early pumpage was from wells in urban centers along railroads leading into Chicago. Withdrawals in pumping center 5 in 1960 were more than 15 times the pumpage in 1910. In all pumping centers except 4, 6, and 11 pumpage in 1960 was more than 10 times the pumpage in 1910. Pumpage from 1890 to 1960 in each of the pumping centers in the Silurian dolomite aquifer in figure 29 is shown in figures 30-33.
Pumpage from the Silurian dolomite aquifer was distributed to the townships within the county, and the average pumpage per square mile (density of pumpage) for each township was computed. Total pumpage and density of pumpage for each township is given in table 9.
The township having the highest density of pumpage is Downers Grove in which are located the municipal
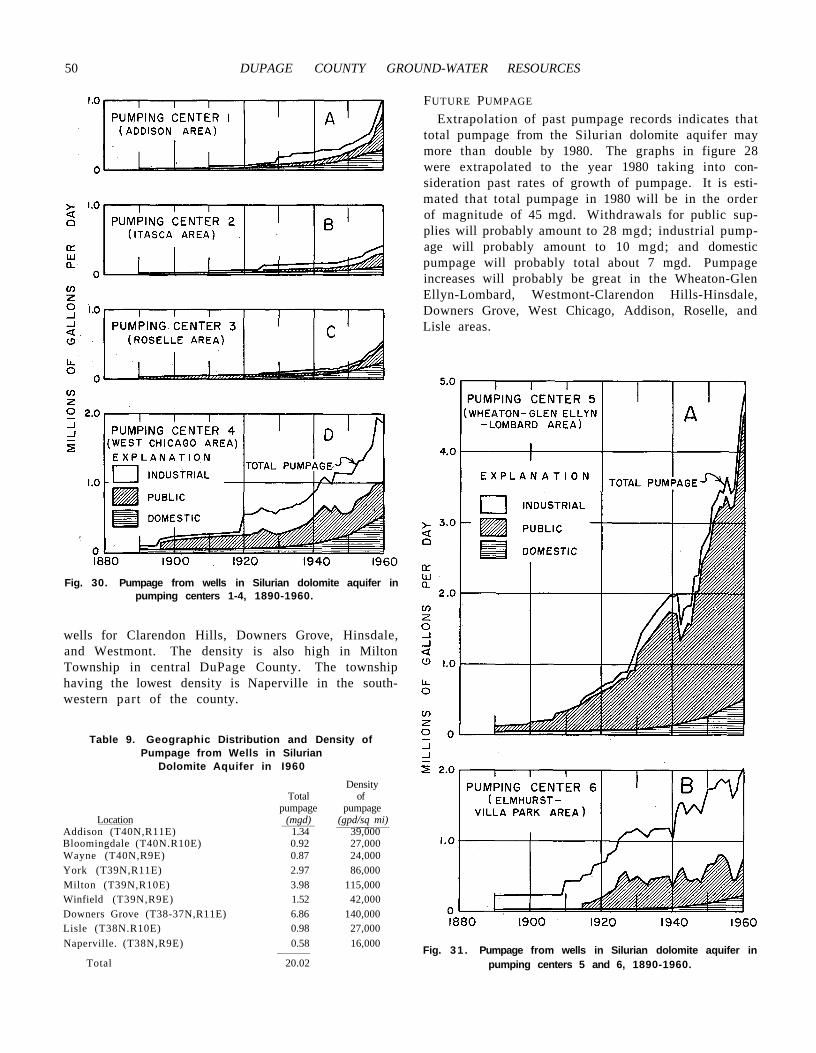
50 DUPAGE COUNTY GROUND-WATER RESOURCES
Fig. 30. Pumpage from wells in Silurian dolomite aquifer in pumping centers 1-4, 1890-1960.
wells for Clarendon Hills, Downers Grove, Hinsdale, and Westmont. The density is also high in Milton Township in central DuPage County. The township having the lowest density is Naperville in the southwestern part of the county.
Table 9. Geographic Distribution and Density of Pumpage from Wells in Silurian
Dolomite Aquifer in I960 Density
Total of pumpage pumpage
Location (mgd) (gpd/sq mi) Addison (T40N,R11E) 1.34 39,000 Bloomingdale (T40N.R10E) 0.92 27,000 Wayne (T40N,R9E) 0.87 24,000 York (T39N,R11E) 2.97 86,000 Milton (T39N,R10E) 3.98 115,000 Winfield (T39N,R9E) 1.52 42,000 Downers Grove (T38-37N,R11E) 6.86 140,000 Lisle (T38N.R10E) 0.98 27,000 Naperville. (T38N,R9E) 0.58 16,000
Total 20.02
FUTURE PUMPAGE
Extrapolation of past pumpage records indicates that total pumpage from the Silurian dolomite aquifer may more than double by 1980. The graphs in figure 28 were extrapolated to the year 1980 taking into consideration past rates of growth of pumpage. It is estimated that total pumpage in 1980 will be in the order of magnitude of 45 mgd. Withdrawals for public supplies will probably amount to 28 mgd; industrial pumpage will probably amount to 10 mgd; and domestic pumpage will probably total about 7 mgd. Pumpage increases will probably be great in the Wheaton-Glen Ellyn-Lombard, Westmont-Clarendon Hills-Hinsdale, Downers Grove, West Chicago, Addison, Roselle, and Lisle areas.
Fig. 31 . Pumpage from wells in Silurian dolomite aquifer in pumping centers 5 and 6, 1890-1960.
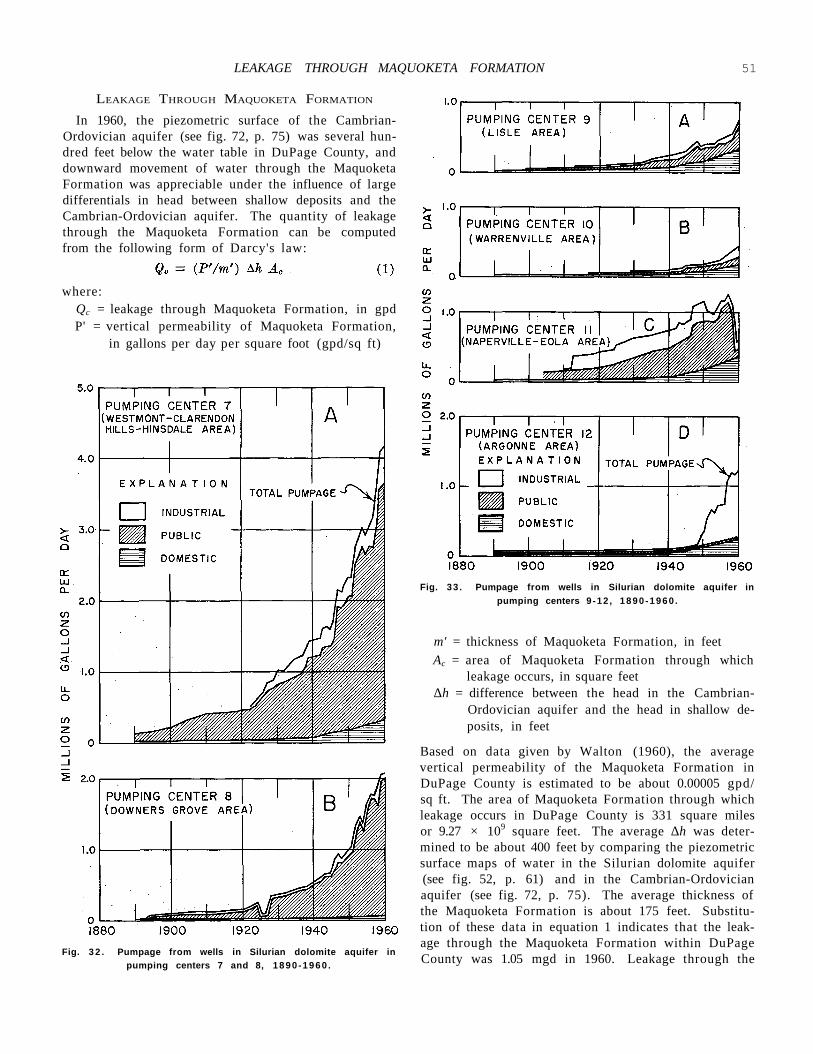
LEAKAGE THROUGH MAQUOKETA FORMATION 51
LEAKAGE THROUGH MAQUOKETA FORMATION
In 1960, the piezometric surface of the Cambrian-Ordovician aquifer (see fig. 72, p. 75) was several hundred feet below the water table in DuPage County, and downward movement of water through the Maquoketa Formation was appreciable under the influence of large differentials in head between shallow deposits and the Cambrian-Ordovician aquifer. The quantity of leakage through the Maquoketa Formation can be computed from the following form of Darcy's law:
where: Qc = leakage through Maquoketa Formation, in gpd P' = vertical permeability of Maquoketa Formation,
in gallons per day per square foot (gpd/sq ft)
Fig. 3 2 . Pumpage from wells in Silurian dolomite aquifer in pumping centers 7 and 8, 1890 -1960 .
Fig. 33 . Pumpage from wells in Silurian dolomite aquifer in pumping centers 9 -12 , 1890 -1960 .
m' = thickness of Maquoketa Formation, in feet Ac = area of Maquoketa Formation through which
leakage occurs, in square feet ∆h = difference between the head in the Cambrian-
Ordovician aquifer and the head in shallow deposits, in feet
Based on data given by Walton (1960), the average vertical permeability of the Maquoketa Formation in DuPage County is estimated to be about 0.00005 gpd/ sq ft. The area of Maquoketa Formation through which leakage occurs in DuPage County is 331 square miles or 9.27 × 10⁹ square feet. The average ∆h was determined to be about 400 feet by comparing the piezometric surface maps of water in the Silurian dolomite aquifer (see fig. 52, p. 61) and in the Cambrian-Ordovician aquifer (see fig. 72, p. 75). The average thickness of the Maquoketa Formation is about 175 feet. Substitution of these data in equation 1 indicates that the leakage through the Maquoketa Formation within DuPage County was 1.05 mgd in 1960. Leakage through the
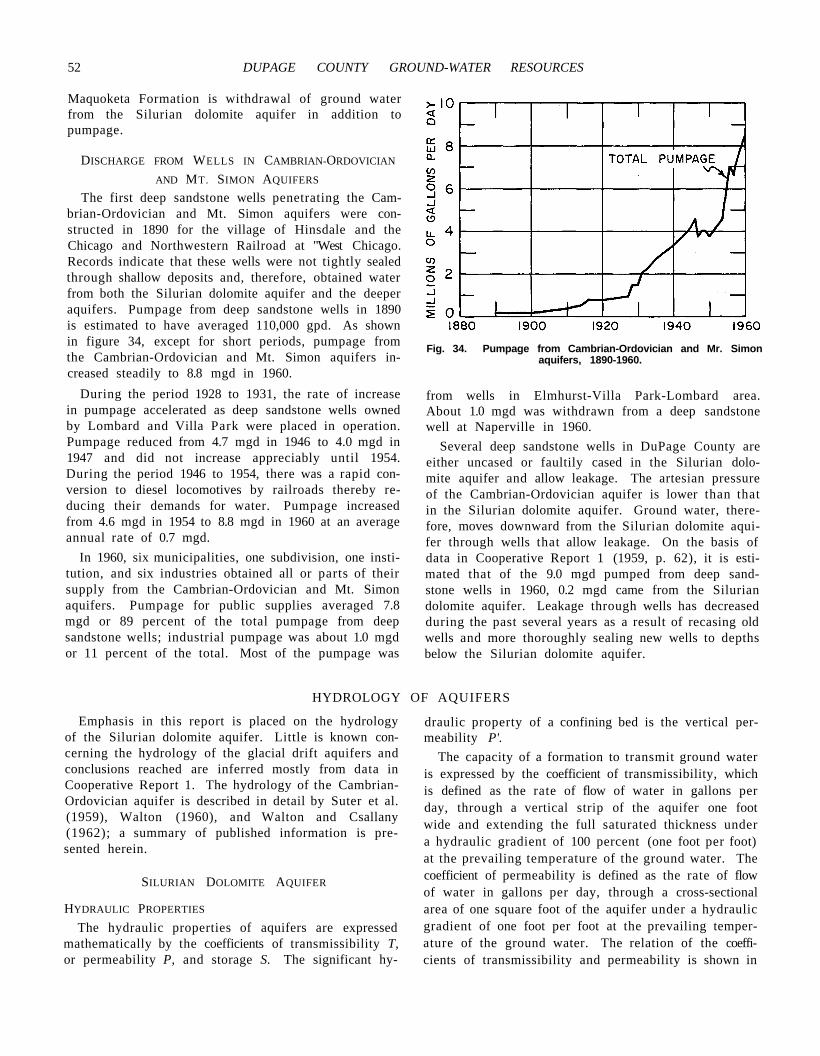
52 DUPAGE COUNTY GROUND-WATER RESOURCES
Maquoketa Formation is withdrawal of ground water from the Silurian dolomite aquifer in addition to pumpage.
DISCHARGE FROM WELLS IN CAMBRIAN-ORDOVICIAN
AND MT. SIMON AQUIFERS
The first deep sandstone wells penetrating the Cambrian-Ordovician and Mt. Simon aquifers were constructed in 1890 for the village of Hinsdale and the Chicago and Northwestern Railroad at "West Chicago. Records indicate that these wells were not tightly sealed through shallow deposits and, therefore, obtained water from both the Silurian dolomite aquifer and the deeper aquifers. Pumpage from deep sandstone wells in 1890 is estimated to have averaged 110,000 gpd. As shown in figure 34, except for short periods, pumpage from the Cambrian-Ordovician and Mt. Simon aquifers increased steadily to 8.8 mgd in 1960.
During the period 1928 to 1931, the rate of increase in pumpage accelerated as deep sandstone wells owned by Lombard and Villa Park were placed in operation. Pumpage reduced from 4.7 mgd in 1946 to 4.0 mgd in 1947 and did not increase appreciably until 1954. During the period 1946 to 1954, there was a rapid conversion to diesel locomotives by railroads thereby reducing their demands for water. Pumpage increased from 4.6 mgd in 1954 to 8.8 mgd in 1960 at an average annual rate of 0.7 mgd.
In 1960, six municipalities, one subdivision, one institution, and six industries obtained all or parts of their supply from the Cambrian-Ordovician and Mt. Simon aquifers. Pumpage for public supplies averaged 7.8 mgd or 89 percent of the total pumpage from deep sandstone wells; industrial pumpage was about 1.0 mgd or 11 percent of the total. Most of the pumpage was
Fig. 34. Pumpage from Cambrian-Ordovician and Mr. Simon aquifers, 1890-1960.
from wells in Elmhurst-Villa Park-Lombard area. About 1.0 mgd was withdrawn from a deep sandstone well at Naperville in 1960.
Several deep sandstone wells in DuPage County are either uncased or faultily cased in the Silurian dolomite aquifer and allow leakage. The artesian pressure of the Cambrian-Ordovician aquifer is lower than that in the Silurian dolomite aquifer. Ground water, therefore, moves downward from the Silurian dolomite aquifer through wells that allow leakage. On the basis of data in Cooperative Report 1 (1959, p. 62), it is estimated that of the 9.0 mgd pumped from deep sandstone wells in 1960, 0.2 mgd came from the Silurian dolomite aquifer. Leakage through wells has decreased during the past several years as a result of recasing old wells and more thoroughly sealing new wells to depths below the Silurian dolomite aquifer.
HYDROLOGY OF AQUIFERS
Emphasis in this report is placed on the hydrology of the Silurian dolomite aquifer. Little is known concerning the hydrology of the glacial drift aquifers and conclusions reached are inferred mostly from data in Cooperative Report 1. The hydrology of the Cambrian-Ordovician aquifer is described in detail by Suter et al. (1959), Walton (1960), and Walton and Csallany (1962); a summary of published information is presented herein.
SILURIAN DOLOMITE AQUIFER
HYDRAULIC PROPERTIES
The hydraulic properties of aquifers are expressed mathematically by the coefficients of transmissibility T, or permeability P, and storage S. The significant hy
draulic property of a confining bed is the vertical permeability P'.
The capacity of a formation to transmit ground water is expressed by the coefficient of transmissibility, which is defined as the rate of flow of water in gallons per day, through a vertical strip of the aquifer one foot wide and extending the full saturated thickness under a hydraulic gradient of 100 percent (one foot per foot) at the prevailing temperature of the ground water. The coefficient of permeability is defined as the rate of flow of water in gallons per day, through a cross-sectional area of one square foot of the aquifer under a hydraulic gradient of one foot per foot at the prevailing temperature of the ground water. The relation of the coefficients of transmissibility and permeability is shown in
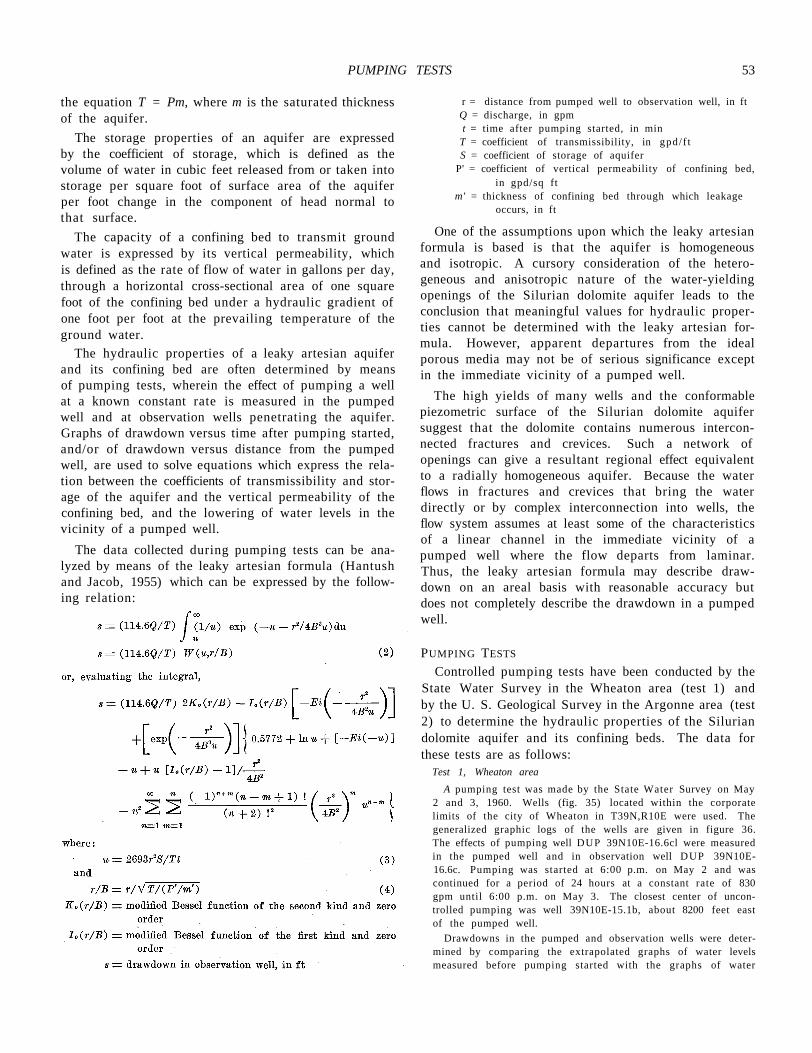
PUMPING TESTS 53
the equation T = Pm, where m is the saturated thickness of the aquifer.
The storage properties of an aquifer are expressed by the coefficient of storage, which is defined as the volume of water in cubic feet released from or taken into storage per square foot of surface area of the aquifer per foot change in the component of head normal to that surface.
The capacity of a confining bed to transmit ground water is expressed by its vertical permeability, which is defined as the rate of flow of water in gallons per day, through a horizontal cross-sectional area of one square foot of the confining bed under a hydraulic gradient of one foot per foot at the prevailing temperature of the ground water.
The hydraulic properties of a leaky artesian aquifer and its confining bed are often determined by means of pumping tests, wherein the effect of pumping a well at a known constant rate is measured in the pumped well and at observation wells penetrating the aquifer. Graphs of drawdown versus time after pumping started, and/or of drawdown versus distance from the pumped well, are used to solve equations which express the relation between the coefficients of transmissibility and storage of the aquifer and the vertical permeability of the confining bed, and the lowering of water levels in the vicinity of a pumped well.
The data collected during pumping tests can be analyzed by means of the leaky artesian formula (Hantush and Jacob, 1955) which can be expressed by the following relation:
r = distance from pumped well to observation well, in ft Q = discharge, in gpm t = time after pumping started, in min
T = coefficient of transmissibility, in gpd/f t S = coefficient of storage of aquifer
P' = coefficient of vertical permeability of confining bed, in gpd/sq ft
m' = thickness of confining bed through which leakage occurs, in ft
One of the assumptions upon which the leaky artesian formula is based is that the aquifer is homogeneous and isotropic. A cursory consideration of the heterogeneous and anisotropic nature of the water-yielding openings of the Silurian dolomite aquifer leads to the conclusion that meaningful values for hydraulic properties cannot be determined with the leaky artesian formula. However, apparent departures from the ideal porous media may not be of serious significance except in the immediate vicinity of a pumped well.
The high yields of many wells and the conformable piezometric surface of the Silurian dolomite aquifer suggest that the dolomite contains numerous interconnected fractures and crevices. Such a network of openings can give a resultant regional effect equivalent to a radially homogeneous aquifer. Because the water flows in fractures and crevices that bring the water directly or by complex interconnection into wells, the flow system assumes at least some of the characteristics of a linear channel in the immediate vicinity of a pumped well where the flow departs from laminar. Thus, the leaky artesian formula may describe drawdown on an areal basis with reasonable accuracy but does not completely describe the drawdown in a pumped well.
PUMPING TESTS
Controlled pumping tests have been conducted by the State Water Survey in the Wheaton area (test 1) and by the U. S. Geological Survey in the Argonne area (test 2) to determine the hydraulic properties of the Silurian dolomite aquifer and its confining beds. The data for these tests are as follows:
Test 1, Wheaton area A pumping test was made by the State Water Survey on May
2 and 3, 1960. Wells (fig. 35) located within the corporate limits of the city of Wheaton in T39N,R10E were used. The generalized graphic logs of the wells are given in figure 36. The effects of pumping well DUP 39N10E-16.6cl were measured in the pumped well and in observation well DUP 39N10E-16.6c. Pumping was started at 6:00 p.m. on May 2 and was continued for a period of 24 hours at a constant rate of 830 gpm until 6:00 p.m. on May 3. The closest center of uncontrolled pumping was well 39N10E-15.1b, about 8200 feet east of the pumped well.
Drawdowns in the pumped and observation wells were determined by comparing the extrapolated graphs of water levels measured before pumping started with the graphs of water
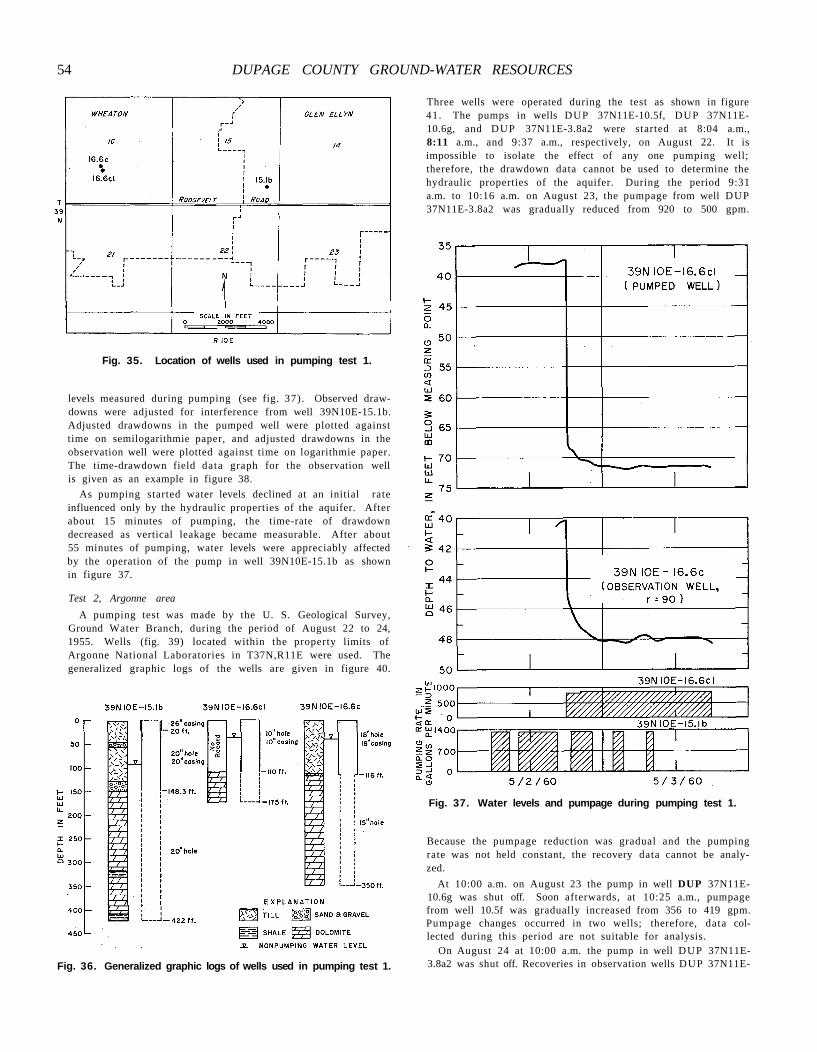
54 DUPAGE COUNTY GROUND-WATER RESOURCES
Fig. 35. Location of wells used in pumping test 1.
levels measured during pumping (see fig. 37). Observed drawdowns were adjusted for interference from well 39N10E-15.1b. Adjusted drawdowns in the pumped well were plotted against time on semilogarithmie paper, and adjusted drawdowns in the observation well were plotted against time on logarithmie paper. The time-drawdown field data graph for the observation well is given as an example in figure 38.
As pumping started water levels declined at an initial rate influenced only by the hydraulic properties of the aquifer. After about 15 minutes of pumping, the time-rate of drawdown decreased as vertical leakage became measurable. After about 55 minutes of pumping, water levels were appreciably affected by the operation of the pump in well 39N10E-15.1b as shown in figure 37.
Test 2, Argonne area A pumping test was made by the U. S. Geological Survey,
Ground Water Branch, during the period of August 22 to 24, 1955. Wells (fig. 39) located within the property limits of Argonne National Laboratories in T37N,R11E were used. The generalized graphic logs of the wells are given in figure 40.
Fig. 36. Generalized graphic logs of wells used in pumping test 1.
Three wells were operated during the test as shown in figure 41. The pumps in wells DUP 37N11E-10.5f, DUP 37N11E-10.6g, and DUP 37N11E-3.8a2 were started at 8:04 a.m., 8:11 a.m., and 9:37 a.m., respectively, on August 22. It is impossible to isolate the effect of any one pumping well; therefore, the drawdown data cannot be used to determine the hydraulic properties of the aquifer. During the period 9:31 a.m. to 10:16 a.m. on August 23, the pumpage from well DUP 37N11E-3.8a2 was gradually reduced from 920 to 500 gpm.
Fig. 37. Water levels and pumpage during pumping test 1.
Because the pumpage reduction was gradual and the pumping rate was not held constant, the recovery data cannot be analyzed.
At 10:00 a.m. on August 23 the pump in well DUP 37N11E-10.6g was shut off. Soon afterwards, at 10:25 a.m., pumpage from well 10.5f was gradually increased from 356 to 419 gpm. Pumpage changes occurred in two wells; therefore, data collected during this period are not suitable for analysis.
On August 24 at 10:00 a.m. the pump in well DUP 37N11E-3.8a2 was shut off. Recoveries in observation wells DUP 37N11E-
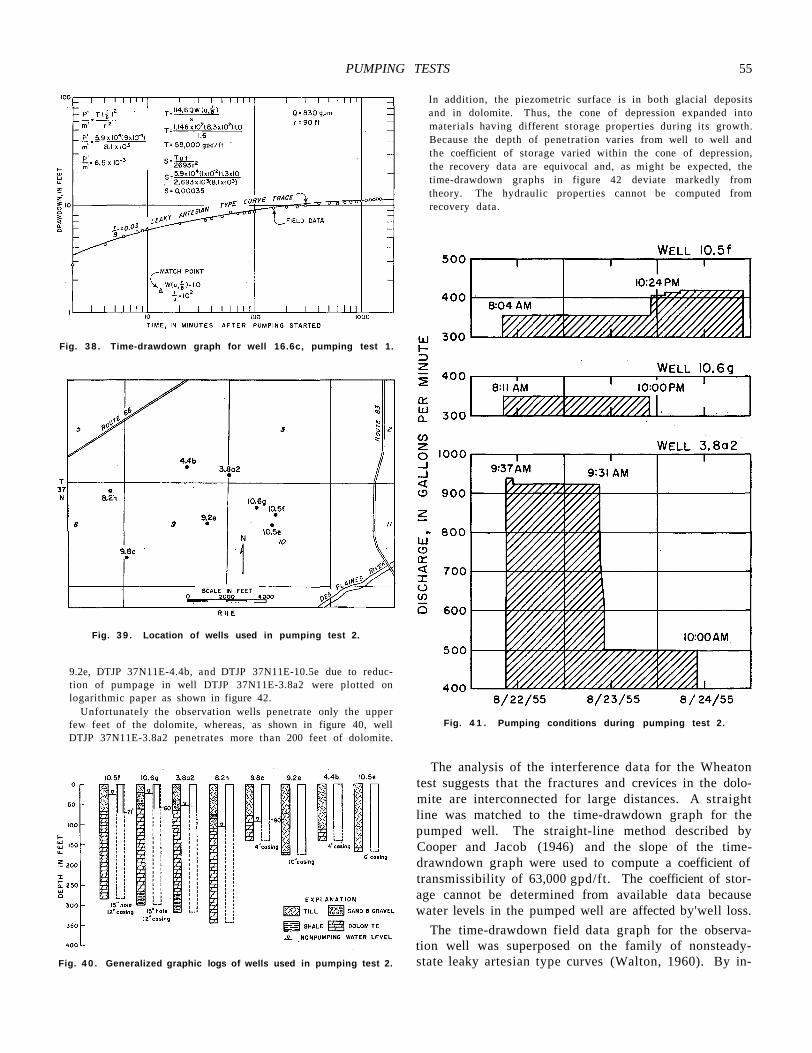
PUMPING TESTS 55
Fig. 3 8 . Time-drawdown graph for well 16.6c, pumping test 1.
Fig. 3 9 . Location of wells used in pumping test 2.
9.2e, DTJP 37N11E-4.4b, and DTJP 37N11E-10.5e due to reduction of pumpage in well DTJP 37N11E-3.8a2 were plotted on logarithmic paper as shown in figure 42.
Unfortunately the observation wells penetrate only the upper few feet of the dolomite, whereas, as shown in figure 40, well DTJP 37N11E-3.8a2 penetrates more than 200 feet of dolomite.
Fig. 4 0 . Generalized graphic logs of wells used in pumping test 2.
In addition, the piezometric surface is in both glacial deposits and in dolomite. Thus, the cone of depression expanded into materials having different storage properties during its growth. Because the depth of penetration varies from well to well and the coefficient of storage varied within the cone of depression, the recovery data are equivocal and, as might be expected, the time-drawdown graphs in figure 42 deviate markedly from theory. The hydraulic properties cannot be computed from recovery data.
Fig. 4 1 . Pumping conditions during pumping test 2.
The analysis of the interference data for the Wheaton test suggests that the fractures and crevices in the dolomite are interconnected for large distances. A straight line was matched to the time-drawdown graph for the pumped well. The straight-line method described by Cooper and Jacob (1946) and the slope of the time-drawndown graph were used to compute a coefficient of transmissibility of 63,000 gpd/ft. The coefficient of storage cannot be determined from available data because water levels in the pumped well are affected by'well loss.
The time-drawdown field data graph for the observation well was superposed on the family of nonsteady-state leaky artesian type curves (Walton, 1960). By in-
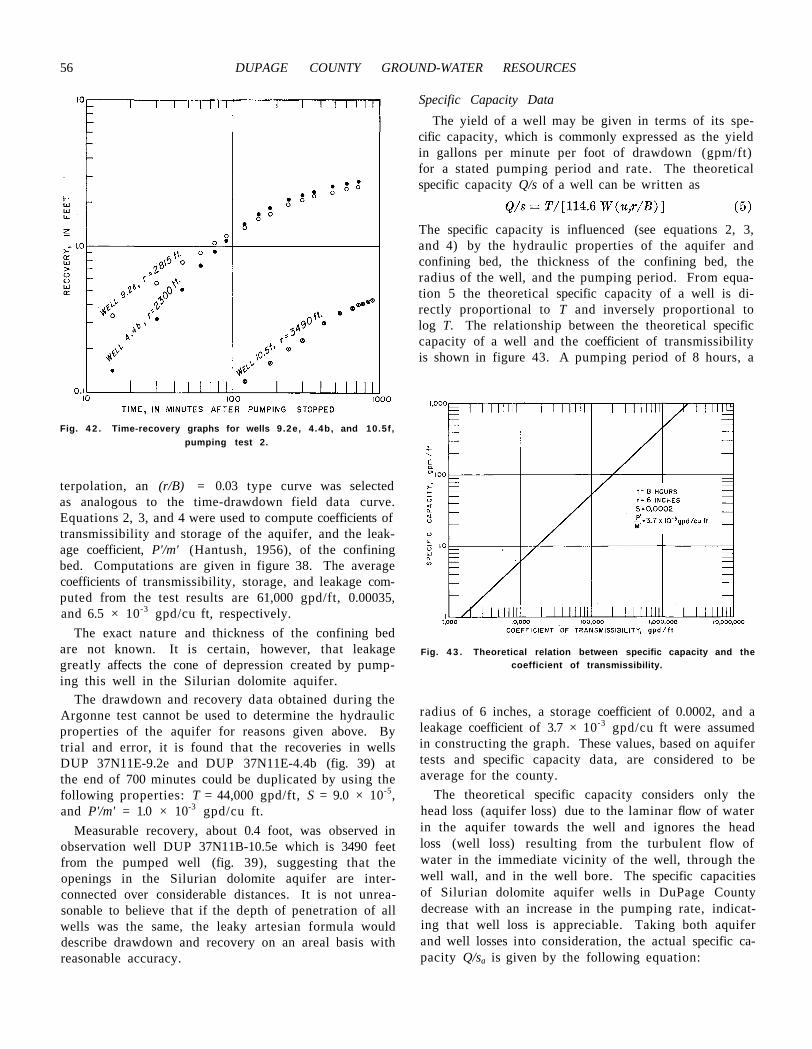
56 DUPAGE COUNTY GROUND-WATER RESOURCES
Fig. 4 2 . Time-recovery graphs for wells 9.2e, 4.4b, and 10.5f, pumping test 2.
terpolation, an (r/B) = 0.03 type curve was selected as analogous to the time-drawdown field data curve. Equations 2, 3, and 4 were used to compute coefficients of transmissibility and storage of the aquifer, and the leakage coefficient, P'/m' (Hantush, 1956), of the confining bed. Computations are given in figure 38. The average coefficients of transmissibility, storage, and leakage computed from the test results are 61,000 gpd/ft, 0.00035, and 6.5 × 10⁻³ gpd/cu ft, respectively.
The exact nature and thickness of the confining bed are not known. It is certain, however, that leakage greatly affects the cone of depression created by pumping this well in the Silurian dolomite aquifer.
The drawdown and recovery data obtained during the Argonne test cannot be used to determine the hydraulic properties of the aquifer for reasons given above. By trial and error, it is found that the recoveries in wells DUP 37N11E-9.2e and DUP 37N11E-4.4b (fig. 39) at the end of 700 minutes could be duplicated by using the following properties: T = 44,000 gpd/ft, S = 9.0 × 10⁻⁵, and P'/m' = 1.0 × 10⁻³ gpd/cu ft.
Measurable recovery, about 0.4 foot, was observed in observation well DUP 37N11B-10.5e which is 3490 feet from the pumped well (fig. 39), suggesting that the openings in the Silurian dolomite aquifer are interconnected over considerable distances. It is not unreasonable to believe that if the depth of penetration of all wells was the same, the leaky artesian formula would describe drawdown and recovery on an areal basis with reasonable accuracy.
Specific Capacity Data The yield of a well may be given in terms of its spe
cific capacity, which is commonly expressed as the yield in gallons per minute per foot of drawdown (gpm/ft) for a stated pumping period and rate. The theoretical specific capacity Q/s of a well can be written as
The specific capacity is influenced (see equations 2, 3, and 4) by the hydraulic properties of the aquifer and confining bed, the thickness of the confining bed, the radius of the well, and the pumping period. From equation 5 the theoretical specific capacity of a well is directly proportional to T and inversely proportional to log T. The relationship between the theoretical specific capacity of a well and the coefficient of transmissibility is shown in figure 43. A pumping period of 8 hours, a
Fig. 4 3 . Theoretical relation between specific capacity and the coefficient of transmissibility.
radius of 6 inches, a storage coefficient of 0.0002, and a leakage coefficient of 3.7 × 10⁻³ gpd/cu ft were assumed in constructing the graph. These values, based on aquifer tests and specific capacity data, are considered to be average for the county.
The theoretical specific capacity considers only the head loss (aquifer loss) due to the laminar flow of water in the aquifer towards the well and ignores the head loss (well loss) resulting from the turbulent flow of water in the immediate vicinity of the well, through the well wall, and in the well bore. The specific capacities of Silurian dolomite aquifer wells in DuPage County decrease with an increase in the pumping rate, indicating that well loss is appreciable. Taking both aquifer and well losses into consideration, the actual specific capacity Q/sa is given by the following equation:
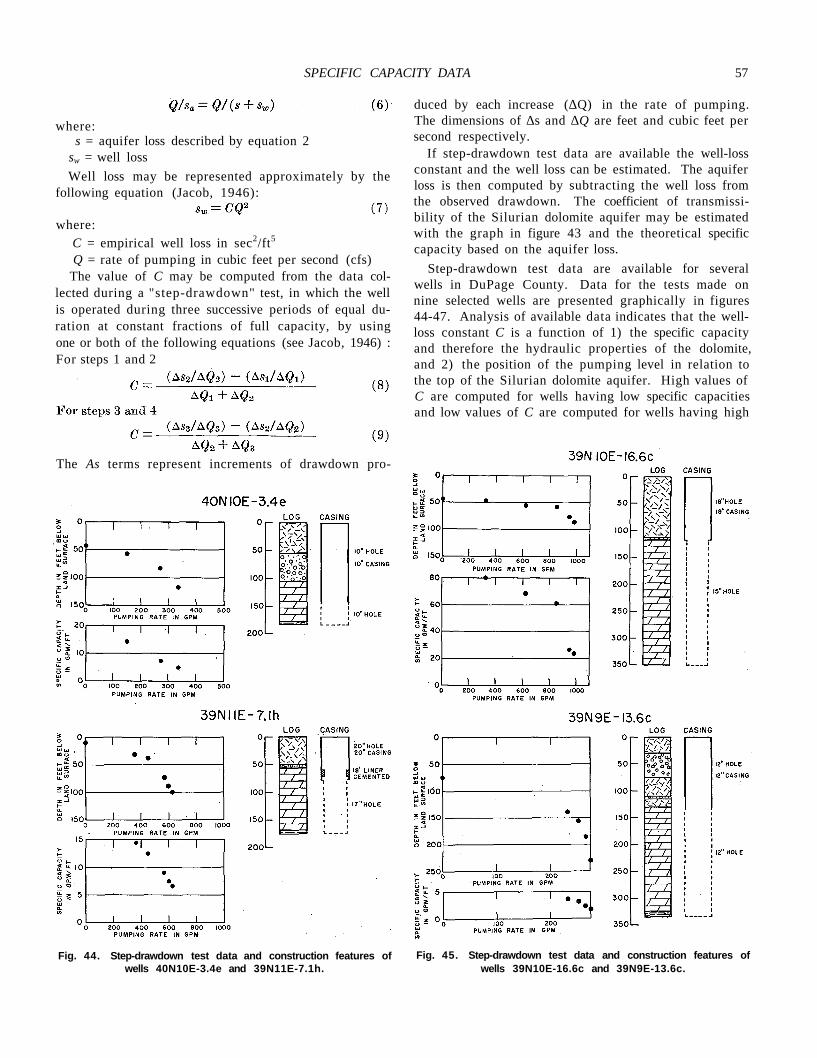
SPECIFIC CAPACITY DATA 57
where: s = aquifer loss described by equation 2
sw = well loss Well loss may be represented approximately by the
following equation (Jacob, 1946):
where: C = empirical well loss in sec2/ft5
Q = rate of pumping in cubic feet per second (cfs) The value of C may be computed from the data col
lected during a "step-drawdown" test, in which the well is operated during three successive periods of equal duration at constant fractions of full capacity, by using one or both of the following equations (see Jacob, 1946) : For steps 1 and 2
The As terms represent increments of drawdown pro-
Fig. 44. Step-drawdown test data and construction features of wells 40N10E-3.4e and 39N11E-7.1h.
duced by each increase (∆Q) in the rate of pumping. The dimensions of ∆s and ∆Q are feet and cubic feet per second respectively.
If step-drawdown test data are available the well-loss constant and the well loss can be estimated. The aquifer loss is then computed by subtracting the well loss from the observed drawdown. The coefficient of transmissi-bility of the Silurian dolomite aquifer may be estimated with the graph in figure 43 and the theoretical specific capacity based on the aquifer loss.
Step-drawdown test data are available for several wells in DuPage County. Data for the tests made on nine selected wells are presented graphically in figures 44-47. Analysis of available data indicates that the well-loss constant C is a function of 1) the specific capacity and therefore the hydraulic properties of the dolomite, and 2) the position of the pumping level in relation to the top of the Silurian dolomite aquifer. High values of C are computed for wells having low specific capacities and low values of C are computed for wells having high
Fig. 45. Step-drawdown test data and construction features of wells 39N10E-16.6c and 39N9E-13.6c.
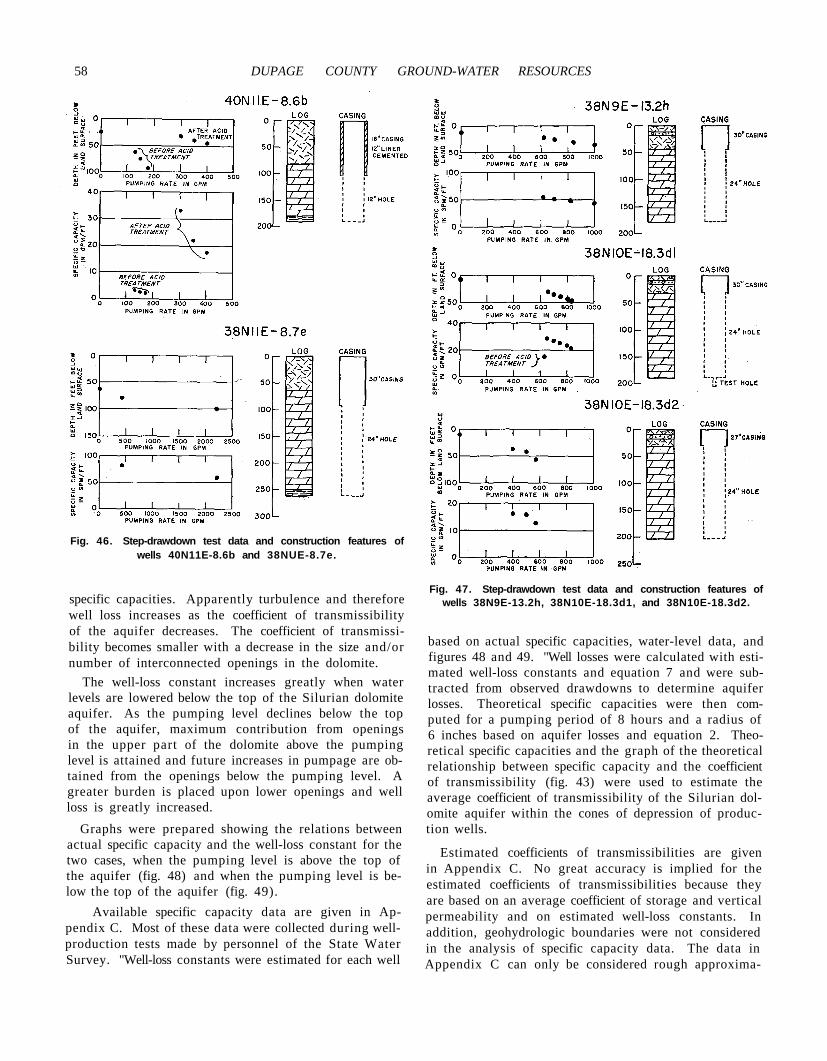
58 DUPAGE COUNTY GROUND-WATER RESOURCES
Fig. 46. Step-drawdown test data and construction features of wells 40N11E-8.6b and 38NUE-8.7e.
specific capacities. Apparently turbulence and therefore well loss increases as the coefficient of transmissibility of the aquifer decreases. The coefficient of transmissibility becomes smaller with a decrease in the size and/or number of interconnected openings in the dolomite.
The well-loss constant increases greatly when water levels are lowered below the top of the Silurian dolomite aquifer. As the pumping level declines below the top of the aquifer, maximum contribution from openings in the upper part of the dolomite above the pumping level is attained and future increases in pumpage are obtained from the openings below the pumping level. A greater burden is placed upon lower openings and well loss is greatly increased.
Graphs were prepared showing the relations between actual specific capacity and the well-loss constant for the two cases, when the pumping level is above the top of the aquifer (fig. 48) and when the pumping level is below the top of the aquifer (fig. 49).
Available specific capacity data are given in Appendix C. Most of these data were collected during well-production tests made by personnel of the State Water Survey. "Well-loss constants were estimated for each well
Fig. 47. Step-drawdown test data and construction features of wells 38N9E-13.2h, 38N10E-18.3d1, and 38N10E-18.3d2.
based on actual specific capacities, water-level data, and figures 48 and 49. "Well losses were calculated with estimated well-loss constants and equation 7 and were subtracted from observed drawdowns to determine aquifer losses. Theoretical specific capacities were then computed for a pumping period of 8 hours and a radius of 6 inches based on aquifer losses and equation 2. Theoretical specific capacities and the graph of the theoretical relationship between specific capacity and the coefficient of transmissibility (fig. 43) were used to estimate the average coefficient of transmissibility of the Silurian dolomite aquifer within the cones of depression of production wells.
Estimated coefficients of transmissibilities are given in Appendix C. No great accuracy is implied for the estimated coefficients of transmissibilities because they are based on an average coefficient of storage and vertical permeability and on estimated well-loss constants. In addition, geohydrologic boundaries were not considered in the analysis of specific capacity data. The data in Appendix C can only be considered rough approxima-
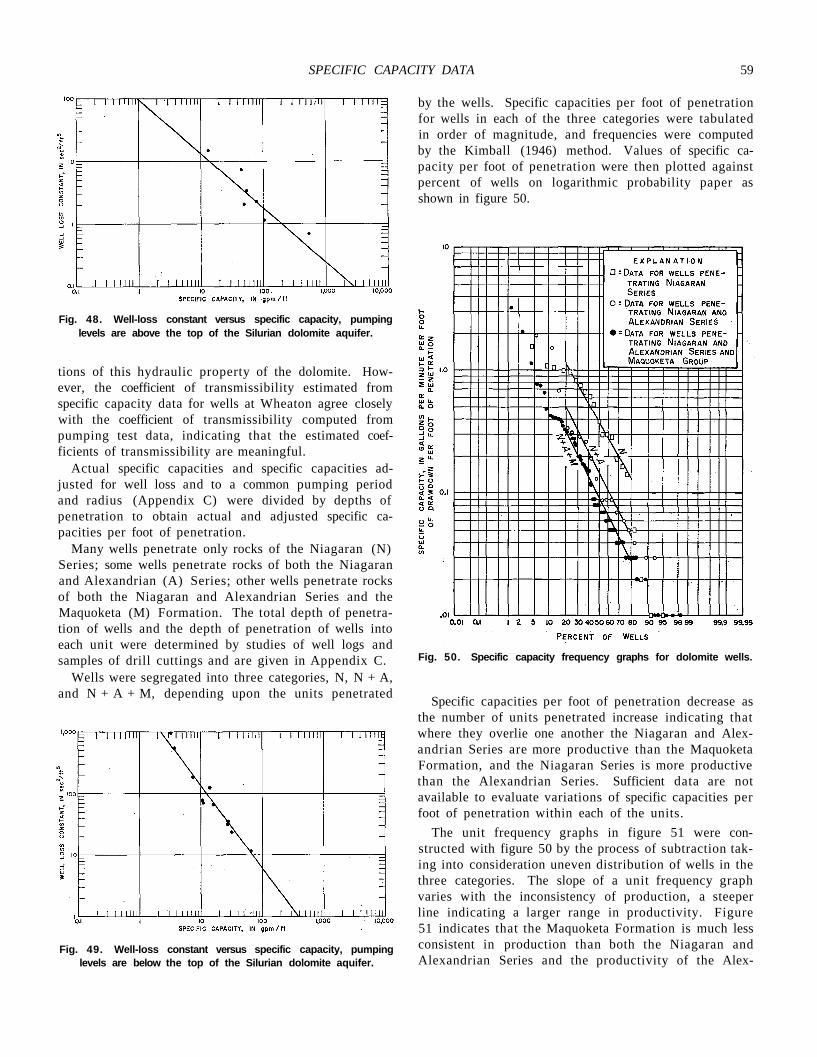
SPECIFIC CAPACITY DATA 59
Fig. 48. Well-loss constant versus specific capacity, pumping levels are above the top of the Silurian dolomite aquifer.
tions of this hydraulic property of the dolomite. However, the coefficient of transmissibility estimated from specific capacity data for wells at Wheaton agree closely with the coefficient of transmissibility computed from pumping test data, indicating that the estimated coefficients of transmissibility are meaningful.
Actual specific capacities and specific capacities adjusted for well loss and to a common pumping period and radius (Appendix C) were divided by depths of penetration to obtain actual and adjusted specific capacities per foot of penetration.
Many wells penetrate only rocks of the Niagaran (N) Series; some wells penetrate rocks of both the Niagaran and Alexandrian (A) Series; other wells penetrate rocks of both the Niagaran and Alexandrian Series and the Maquoketa (M) Formation. The total depth of penetration of wells and the depth of penetration of wells into each unit were determined by studies of well logs and samples of drill cuttings and are given in Appendix C.
Wells were segregated into three categories, N, N + A, and N + A + M, depending upon the units penetrated
Fig. 49. Well-loss constant versus specific capacity, pumping levels are below the top of the Silurian dolomite aquifer.
by the wells. Specific capacities per foot of penetration for wells in each of the three categories were tabulated in order of magnitude, and frequencies were computed by the Kimball (1946) method. Values of specific capacity per foot of penetration were then plotted against percent of wells on logarithmic probability paper as shown in figure 50.
Fig. 50. Specific capacity frequency graphs for dolomite wells.
Specific capacities per foot of penetration decrease as the number of units penetrated increase indicating that where they overlie one another the Niagaran and Alexandrian Series are more productive than the Maquoketa Formation, and the Niagaran Series is more productive than the Alexandrian Series. Sufficient data are not available to evaluate variations of specific capacities per foot of penetration within each of the units.
The unit frequency graphs in figure 51 were constructed with figure 50 by the process of subtraction taking into consideration uneven distribution of wells in the three categories. The slope of a unit frequency graph varies with the inconsistency of production, a steeper line indicating a larger range in productivity. Figure 51 indicates that the Maquoketa Formation is much less consistent in production than both the Niagaran and Alexandrian Series and the productivity of the Alex-
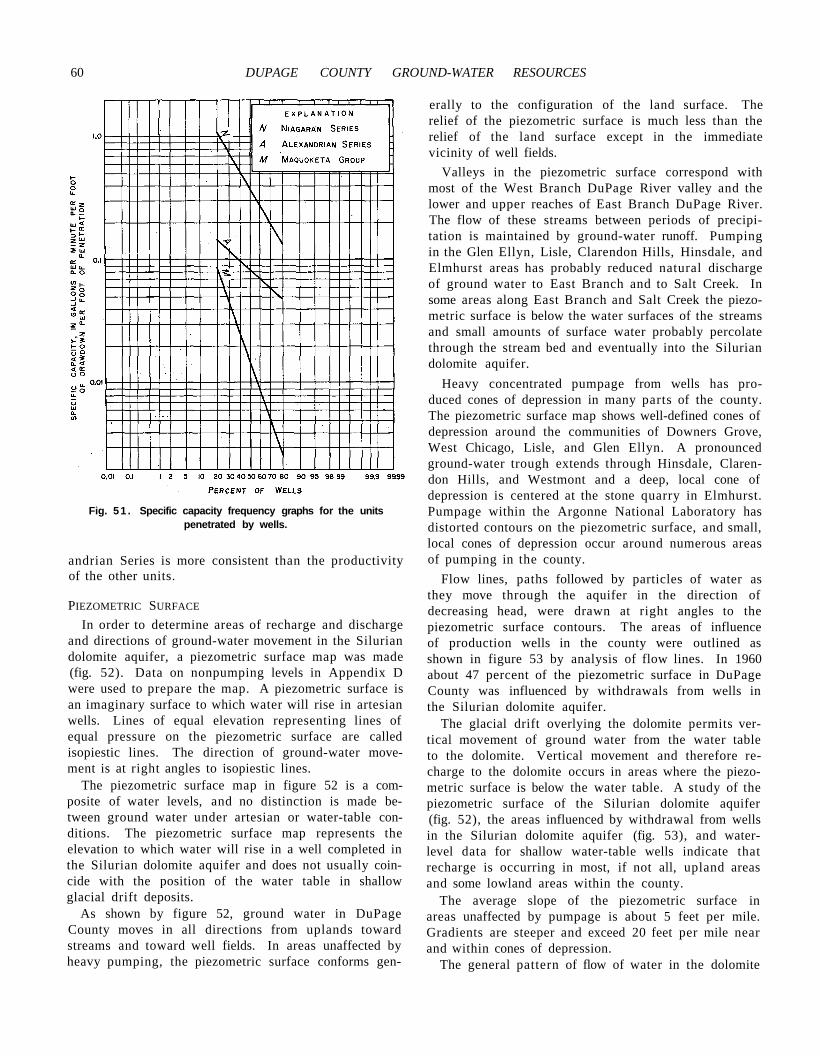
60 DUPAGE COUNTY GROUND-WATER RESOURCES
Fig. 51 . Specific capacity frequency graphs for the units penetrated by wells.
andrian Series is more consistent than the productivity of the other units.
PIEZOMETRIC SURFACE
In order to determine areas of recharge and discharge and directions of ground-water movement in the Silurian dolomite aquifer, a piezometric surface map was made (fig. 52). Data on nonpumping levels in Appendix D were used to prepare the map. A piezometric surface is an imaginary surface to which water will rise in artesian wells. Lines of equal elevation representing lines of equal pressure on the piezometric surface are called isopiestic lines. The direction of ground-water movement is at right angles to isopiestic lines.
The piezometric surface map in figure 52 is a composite of water levels, and no distinction is made between ground water under artesian or water-table conditions. The piezometric surface map represents the elevation to which water will rise in a well completed in the Silurian dolomite aquifer and does not usually coincide with the position of the water table in shallow glacial drift deposits.
As shown by figure 52, ground water in DuPage County moves in all directions from uplands toward streams and toward well fields. In areas unaffected by heavy pumping, the piezometric surface conforms gen
erally to the configuration of the land surface. The relief of the piezometric surface is much less than the relief of the land surface except in the immediate vicinity of well fields.
Valleys in the piezometric surface correspond with most of the West Branch DuPage River valley and the lower and upper reaches of East Branch DuPage River. The flow of these streams between periods of precipitation is maintained by ground-water runoff. Pumping in the Glen Ellyn, Lisle, Clarendon Hills, Hinsdale, and Elmhurst areas has probably reduced natural discharge of ground water to East Branch and to Salt Creek. In some areas along East Branch and Salt Creek the piezometric surface is below the water surfaces of the streams and small amounts of surface water probably percolate through the stream bed and eventually into the Silurian dolomite aquifer.
Heavy concentrated pumpage from wells has produced cones of depression in many parts of the county. The piezometric surface map shows well-defined cones of depression around the communities of Downers Grove, West Chicago, Lisle, and Glen Ellyn. A pronounced ground-water trough extends through Hinsdale, Clarendon Hills, and Westmont and a deep, local cone of depression is centered at the stone quarry in Elmhurst. Pumpage within the Argonne National Laboratory has distorted contours on the piezometric surface, and small, local cones of depression occur around numerous areas of pumping in the county.
Flow lines, paths followed by particles of water as they move through the aquifer in the direction of decreasing head, were drawn at right angles to the piezometric surface contours. The areas of influence of production wells in the county were outlined as shown in figure 53 by analysis of flow lines. In 1960 about 47 percent of the piezometric surface in DuPage County was influenced by withdrawals from wells in the Silurian dolomite aquifer.
The glacial drift overlying the dolomite permits vertical movement of ground water from the water table to the dolomite. Vertical movement and therefore recharge to the dolomite occurs in areas where the piezometric surface is below the water table. A study of the piezometric surface of the Silurian dolomite aquifer (fig. 52), the areas influenced by withdrawal from wells in the Silurian dolomite aquifer (fig. 53), and water-level data for shallow water-table wells indicate that recharge is occurring in most, if not all, upland areas and some lowland areas within the county.
The average slope of the piezometric surface in areas unaffected by pumpage is about 5 feet per mile. Gradients are steeper and exceed 20 feet per mile near and within cones of depression.
The general pattern of flow of water in the dolomite
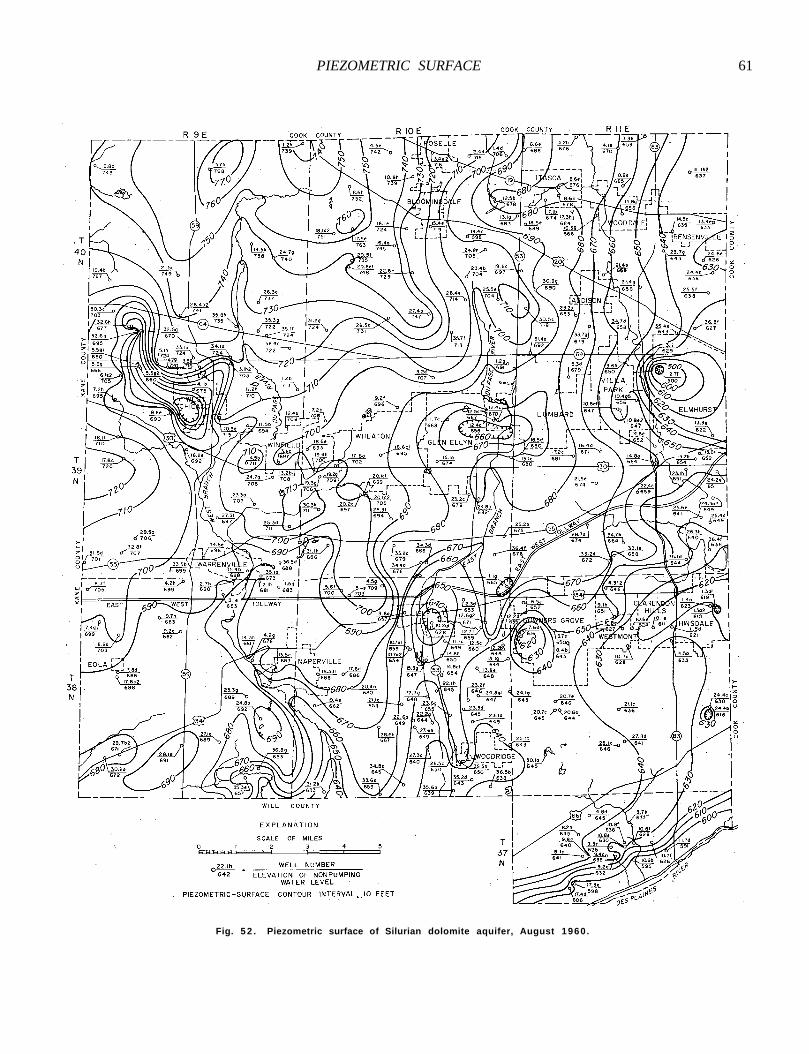
PIEZOMETRIC SURFACE 61
Fig. 5 2 . Piezometric surface of Silurian dolomite aquifer, August 1960 .
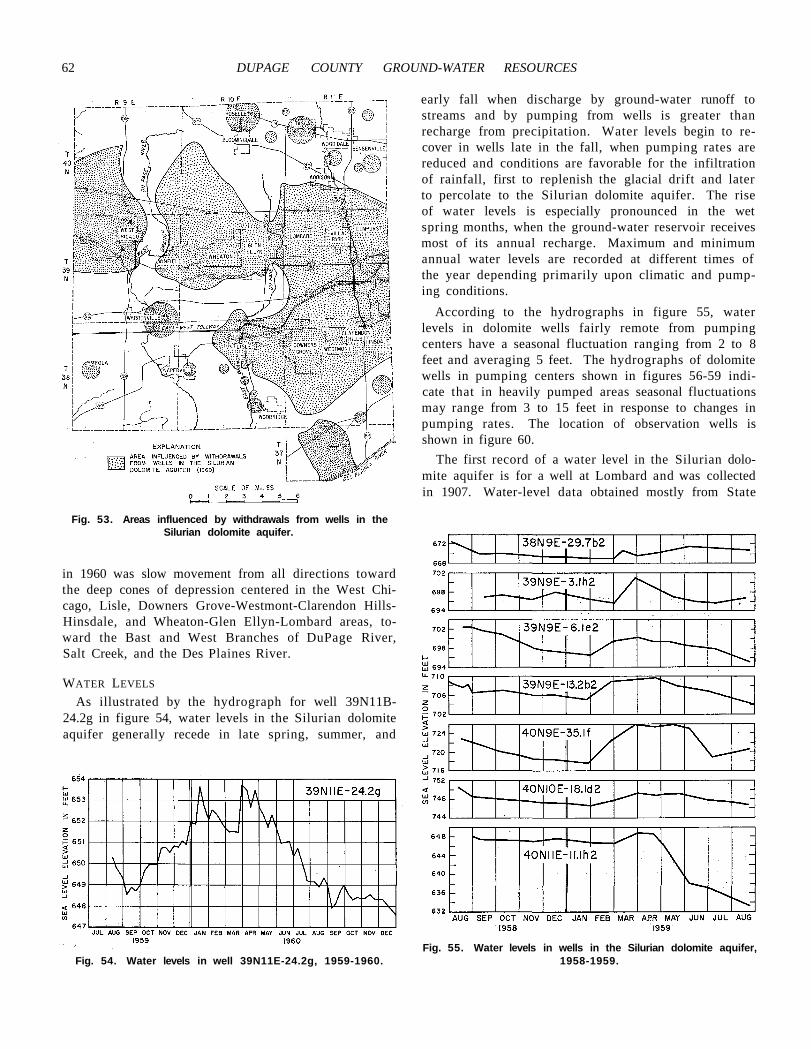
62 DUPAGE COUNTY GROUND-WATER RESOURCES
Fig. 53. Areas influenced by withdrawals from wells in the Silurian dolomite aquifer.
in 1960 was slow movement from all directions toward the deep cones of depression centered in the West Chicago, Lisle, Downers Grove-Westmont-Clarendon Hills-Hinsdale, and Wheaton-Glen Ellyn-Lombard areas, toward the Bast and West Branches of DuPage River, Salt Creek, and the Des Plaines River.
WATER LEVELS
As illustrated by the hydrograph for well 39N11B-24.2g in figure 54, water levels in the Silurian dolomite aquifer generally recede in late spring, summer, and
Fig. 54. Water levels in well 39N11E-24.2g, 1959-1960.
early fall when discharge by ground-water runoff to streams and by pumping from wells is greater than recharge from precipitation. Water levels begin to recover in wells late in the fall, when pumping rates are reduced and conditions are favorable for the infiltration of rainfall, first to replenish the glacial drift and later to percolate to the Silurian dolomite aquifer. The rise of water levels is especially pronounced in the wet spring months, when the ground-water reservoir receives most of its annual recharge. Maximum and minimum annual water levels are recorded at different times of the year depending primarily upon climatic and pumping conditions.
According to the hydrographs in figure 55, water levels in dolomite wells fairly remote from pumping centers have a seasonal fluctuation ranging from 2 to 8 feet and averaging 5 feet. The hydrographs of dolomite wells in pumping centers shown in figures 56-59 indicate that in heavily pumped areas seasonal fluctuations may range from 3 to 15 feet in response to changes in pumping rates. The location of observation wells is shown in figure 60.
The first record of a water level in the Silurian dolomite aquifer is for a well at Lombard and was collected in 1907. Water-level data obtained mostly from State
Fig. 55. Water levels in wells in the Silurian dolomite aquifer, 1958-1959.
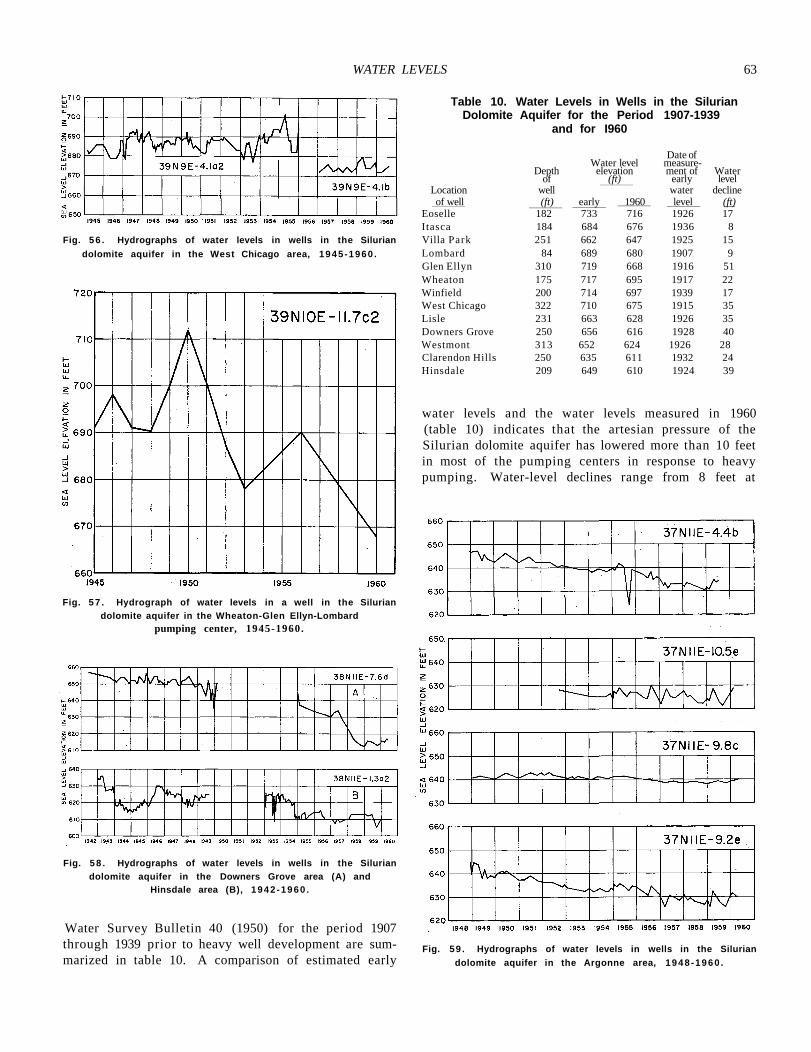
WATER LEVELS 63
Fig. 56 . Hydrographs of water levels in wells in the Silurian dolomite aquifer in the West Chicago area, 1945 -1960 .
Fig. 5 7 . Hydrograph of water levels in a well in the Silurian dolomite aquifer in the Wheaton-Glen Ellyn-Lombard
pumping center, 1945-1960.
Fig. 5 8 . Hydrographs of water levels in wells in the Silurian dolomite aquifer in the Downers Grove area (A) and
Hinsdale area (B), 1942 -1960 .
Water Survey Bulletin 40 (1950) for the period 1907 through 1939 prior to heavy well development are summarized in table 10. A comparison of estimated early
Table 10. Water Levels in Wells in the Silurian Dolomite Aquifer for the Period 1907-1939
and for I960
Date of Water level measure-
Depth elevation ment of Water of (ft) early level
Location well water decline of well (ft) early 1960 level (ft)
Eoselle 182 733 716 1926 17 Itasca 184 684 676 1936 8 Villa Park 251 662 647 1925 15 Lombard 84 689 680 1907 9 Glen Ellyn 310 719 668 1916 51 Wheaton 175 717 695 1917 22 Winfield 200 714 697 1939 17 West Chicago 322 710 675 1915 35 Lisle 231 663 628 1926 35 Downers Grove 250 656 616 1928 40 Westmont 313 652 624 1926 28 Clarendon Hills 250 635 611 1932 24 Hinsdale 209 649 610 1924 39
water levels and the water levels measured in 1960 (table 10) indicates that the artesian pressure of the Silurian dolomite aquifer has lowered more than 10 feet in most of the pumping centers in response to heavy pumping. Water-level declines range from 8 feet at
Fig. 59 . Hydrographs of water levels in wells in the Silurian dolomite aquifer in the Argonne area, 1948 -1960 .
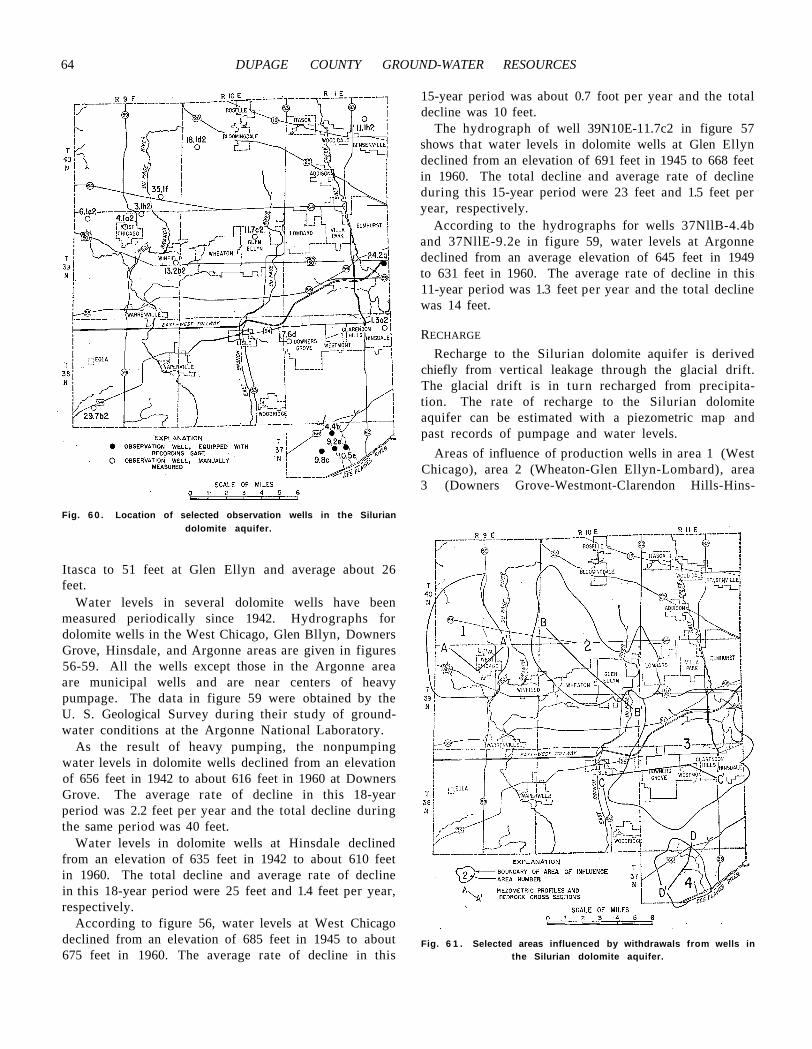
64 DUPAGE COUNTY GROUND-WATER RESOURCES
Fig. 6 0 . Location of selected observation wells in the Silurian dolomite aquifer.
Itasca to 51 feet at Glen Ellyn and average about 26 feet.
Water levels in several dolomite wells have been measured periodically since 1942. Hydrographs for dolomite wells in the West Chicago, Glen Bllyn, Downers Grove, Hinsdale, and Argonne areas are given in figures 56-59. All the wells except those in the Argonne area are municipal wells and are near centers of heavy pumpage. The data in figure 59 were obtained by the U. S. Geological Survey during their study of groundwater conditions at the Argonne National Laboratory.
As the result of heavy pumping, the nonpumping water levels in dolomite wells declined from an elevation of 656 feet in 1942 to about 616 feet in 1960 at Downers Grove. The average rate of decline in this 18-year period was 2.2 feet per year and the total decline during the same period was 40 feet.
Water levels in dolomite wells at Hinsdale declined from an elevation of 635 feet in 1942 to about 610 feet in 1960. The total decline and average rate of decline in this 18-year period were 25 feet and 1.4 feet per year, respectively.
According to figure 56, water levels at West Chicago declined from an elevation of 685 feet in 1945 to about 675 feet in 1960. The average rate of decline in this
15-year period was about 0.7 foot per year and the total decline was 10 feet.
The hydrograph of well 39N10E-11.7c2 in figure 57 shows that water levels in dolomite wells at Glen Ellyn declined from an elevation of 691 feet in 1945 to 668 feet in 1960. The total decline and average rate of decline during this 15-year period were 23 feet and 1.5 feet per year, respectively.
According to the hydrographs for wells 37NllB-4.4b and 37NllE-9.2e in figure 59, water levels at Argonne declined from an average elevation of 645 feet in 1949 to 631 feet in 1960. The average rate of decline in this 11-year period was 1.3 feet per year and the total decline was 14 feet.
RECHARGE
Recharge to the Silurian dolomite aquifer is derived chiefly from vertical leakage through the glacial drift. The glacial drift is in turn recharged from precipitation. The rate of recharge to the Silurian dolomite aquifer can be estimated with a piezometric map and past records of pumpage and water levels.
Areas of influence of production wells in area 1 (West Chicago), area 2 (Wheaton-Glen Ellyn-Lombard), area 3 (Downers Grove-Westmont-Clarendon Hills-Hins-
Fig. 6 1 . Selected areas influenced by withdrawals from wells in the Silurian dolomite aquifer.
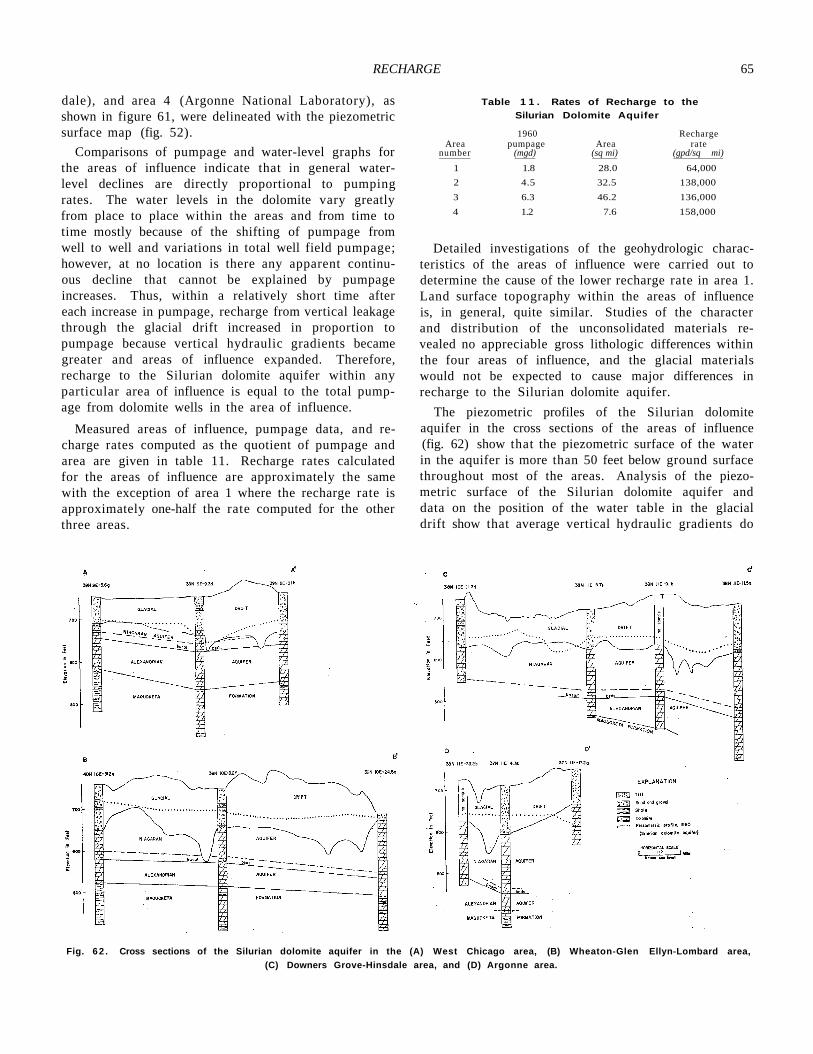
RECHARGE 65
dale), and area 4 (Argonne National Laboratory), as shown in figure 61, were delineated with the piezometric surface map (fig. 52).
Comparisons of pumpage and water-level graphs for the areas of influence indicate that in general water-level declines are directly proportional to pumping rates. The water levels in the dolomite vary greatly from place to place within the areas and from time to time mostly because of the shifting of pumpage from well to well and variations in total well field pumpage; however, at no location is there any apparent continuous decline that cannot be explained by pumpage increases. Thus, within a relatively short time after each increase in pumpage, recharge from vertical leakage through the glacial drift increased in proportion to pumpage because vertical hydraulic gradients became greater and areas of influence expanded. Therefore, recharge to the Silurian dolomite aquifer within any particular area of influence is equal to the total pumpage from dolomite wells in the area of influence.
Measured areas of influence, pumpage data, and recharge rates computed as the quotient of pumpage and area are given in table 11. Recharge rates calculated for the areas of influence are approximately the same with the exception of area 1 where the recharge rate is approximately one-half the rate computed for the other three areas.
Table 1 1 . Rates of Recharge to the Silurian Dolomite Aquifer
1960 Recharge Area pumpage Area rate
number (mgd) (sq mi) (gpd/sq mi) 1 1.8 28.0 64,000 2 4.5 32.5 138,000 3 6.3 46.2 136,000 4 1.2 7.6 158,000
Detailed investigations of the geohydrologic characteristics of the areas of influence were carried out to determine the cause of the lower recharge rate in area 1. Land surface topography within the areas of influence is, in general, quite similar. Studies of the character and distribution of the unconsolidated materials revealed no appreciable gross lithologic differences within the four areas of influence, and the glacial materials would not be expected to cause major differences in recharge to the Silurian dolomite aquifer.
The piezometric profiles of the Silurian dolomite aquifer in the cross sections of the areas of influence (fig. 62) show that the piezometric surface of the water in the aquifer is more than 50 feet below ground surface throughout most of the areas. Analysis of the piezometric surface of the Silurian dolomite aquifer and data on the position of the water table in the glacial drift show that average vertical hydraulic gradients do
Fig. 62 . Cross sections of the Silurian dolomite aquifer in the (A) West Chicago area, (B) Wheaton-Glen Ellyn-Lombard area, (C) Downers Grove-Hinsdale area, and (D) Argonne area.
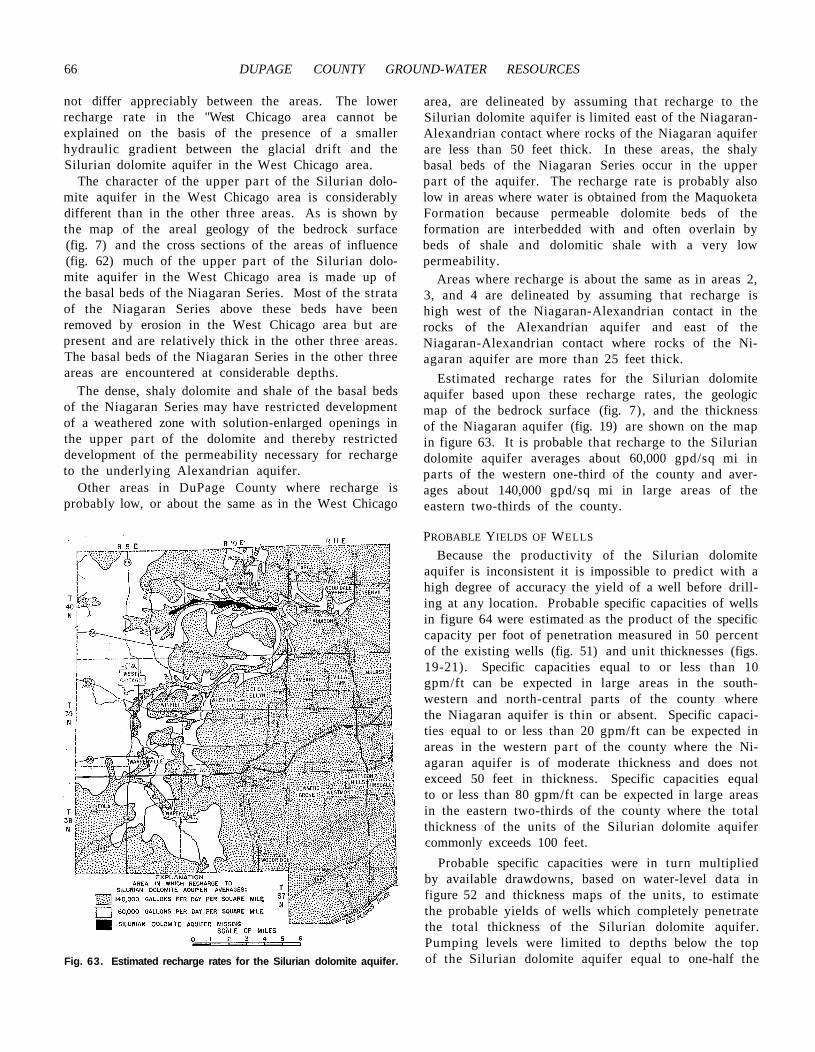
66 DUPAGE COUNTY GROUND-WATER RESOURCES
not differ appreciably between the areas. The lower recharge rate in the "West Chicago area cannot be explained on the basis of the presence of a smaller hydraulic gradient between the glacial drift and the Silurian dolomite aquifer in the West Chicago area.
The character of the upper part of the Silurian dolomite aquifer in the West Chicago area is considerably different than in the other three areas. As is shown by the map of the areal geology of the bedrock surface (fig. 7) and the cross sections of the areas of influence (fig. 62) much of the upper part of the Silurian dolomite aquifer in the West Chicago area is made up of the basal beds of the Niagaran Series. Most of the strata of the Niagaran Series above these beds have been removed by erosion in the West Chicago area but are present and are relatively thick in the other three areas. The basal beds of the Niagaran Series in the other three areas are encountered at considerable depths.
The dense, shaly dolomite and shale of the basal beds of the Niagaran Series may have restricted development of a weathered zone with solution-enlarged openings in the upper part of the dolomite and thereby restricted development of the permeability necessary for recharge to the underlying Alexandrian aquifer.
Other areas in DuPage County where recharge is probably low, or about the same as in the West Chicago
Fig. 63. Estimated recharge rates for the Silurian dolomite aquifer.
area, are delineated by assuming that recharge to the Silurian dolomite aquifer is limited east of the Niagaran-Alexandrian contact where rocks of the Niagaran aquifer are less than 50 feet thick. In these areas, the shaly basal beds of the Niagaran Series occur in the upper part of the aquifer. The recharge rate is probably also low in areas where water is obtained from the Maquoketa Formation because permeable dolomite beds of the formation are interbedded with and often overlain by beds of shale and dolomitic shale with a very low permeability.
Areas where recharge is about the same as in areas 2, 3, and 4 are delineated by assuming that recharge is high west of the Niagaran-Alexandrian contact in the rocks of the Alexandrian aquifer and east of the Niagaran-Alexandrian contact where rocks of the Niagaran aquifer are more than 25 feet thick.
Estimated recharge rates for the Silurian dolomite aquifer based upon these recharge rates, the geologic map of the bedrock surface (fig. 7), and the thickness of the Niagaran aquifer (fig. 19) are shown on the map in figure 63. It is probable that recharge to the Silurian dolomite aquifer averages about 60,000 gpd/sq mi in parts of the western one-third of the county and averages about 140,000 gpd/sq mi in large areas of the eastern two-thirds of the county.
PROBABLE YIELDS OF WELLS
Because the productivity of the Silurian dolomite aquifer is inconsistent it is impossible to predict with a high degree of accuracy the yield of a well before drilling at any location. Probable specific capacities of wells in figure 64 were estimated as the product of the specific capacity per foot of penetration measured in 50 percent of the existing wells (fig. 51) and unit thicknesses (figs. 19-21). Specific capacities equal to or less than 10 gpm/ft can be expected in large areas in the southwestern and north-central parts of the county where the Niagaran aquifer is thin or absent. Specific capacities equal to or less than 20 gpm/ft can be expected in areas in the western part of the county where the Niagaran aquifer is of moderate thickness and does not exceed 50 feet in thickness. Specific capacities equal to or less than 80 gpm/ft can be expected in large areas in the eastern two-thirds of the county where the total thickness of the units of the Silurian dolomite aquifer commonly exceeds 100 feet.
Probable specific capacities were in turn multiplied by available drawdowns, based on water-level data in figure 52 and thickness maps of the units, to estimate the probable yields of wells which completely penetrate the total thickness of the Silurian dolomite aquifer. Pumping levels were limited to depths below the top of the Silurian dolomite aquifer equal to one-half the
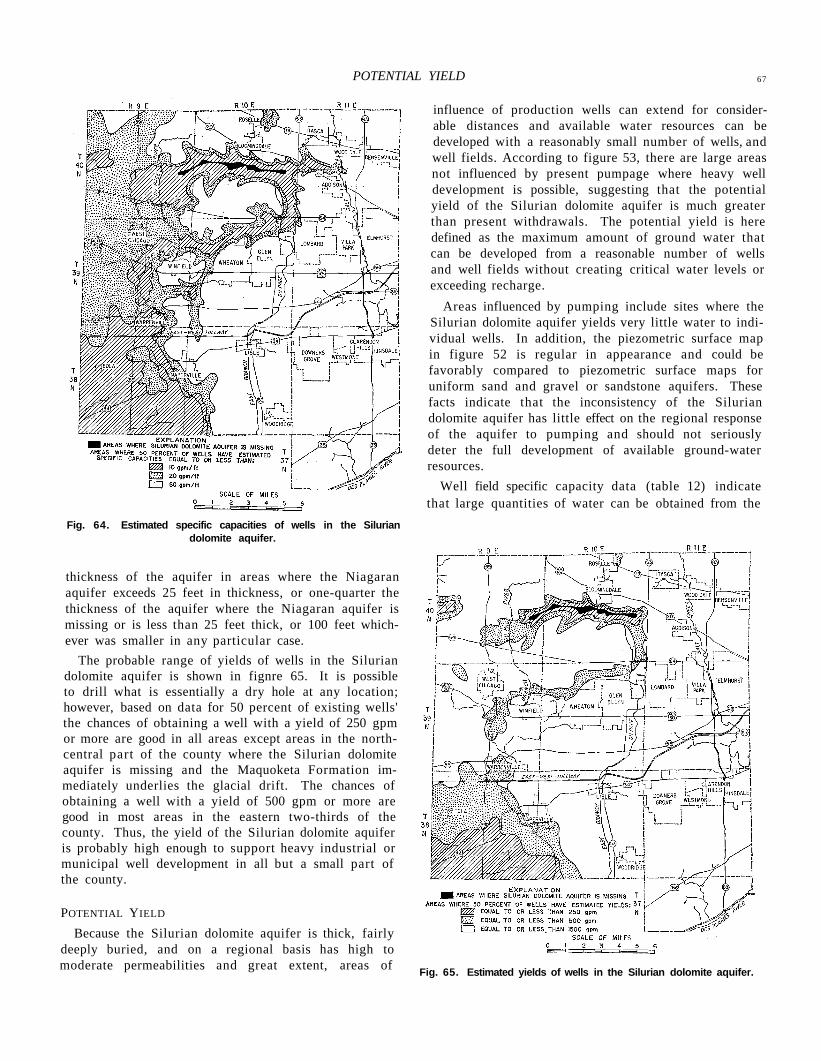
POTENTIAL YIELD 67
Fig. 64. Estimated specific capacities of wells in the Silurian dolomite aquifer.
thickness of the aquifer in areas where the Niagaran aquifer exceeds 25 feet in thickness, or one-quarter the thickness of the aquifer where the Niagaran aquifer is missing or is less than 25 feet thick, or 100 feet whichever was smaller in any particular case.
The probable range of yields of wells in the Silurian dolomite aquifer is shown in fignre 65. It is possible to drill what is essentially a dry hole at any location; however, based on data for 50 percent of existing wells' the chances of obtaining a well with a yield of 250 gpm or more are good in all areas except areas in the north-central part of the county where the Silurian dolomite aquifer is missing and the Maquoketa Formation immediately underlies the glacial drift. The chances of obtaining a well with a yield of 500 gpm or more are good in most areas in the eastern two-thirds of the county. Thus, the yield of the Silurian dolomite aquifer is probably high enough to support heavy industrial or municipal well development in all but a small part of the county.
POTENTIAL YIELD
Because the Silurian dolomite aquifer is thick, fairly deeply buried, and on a regional basis has high to moderate permeabilities and great extent, areas of
influence of production wells can extend for considerable distances and available water resources can be developed with a reasonably small number of wells, and well fields. According to figure 53, there are large areas not influenced by present pumpage where heavy well development is possible, suggesting that the potential yield of the Silurian dolomite aquifer is much greater than present withdrawals. The potential yield is here defined as the maximum amount of ground water that can be developed from a reasonable number of wells and well fields without creating critical water levels or exceeding recharge.
Areas influenced by pumping include sites where the Silurian dolomite aquifer yields very little water to individual wells. In addition, the piezometric surface map in figure 52 is regular in appearance and could be favorably compared to piezometric surface maps for uniform sand and gravel or sandstone aquifers. These facts indicate that the inconsistency of the Silurian dolomite aquifer has little effect on the regional response of the aquifer to pumping and should not seriously deter the full development of available ground-water resources.
Well field specific capacity data (table 12) indicate that large quantities of water can be obtained from the
Fig. 65. Estimated yields of wells in the Silurian dolomite aquifer.
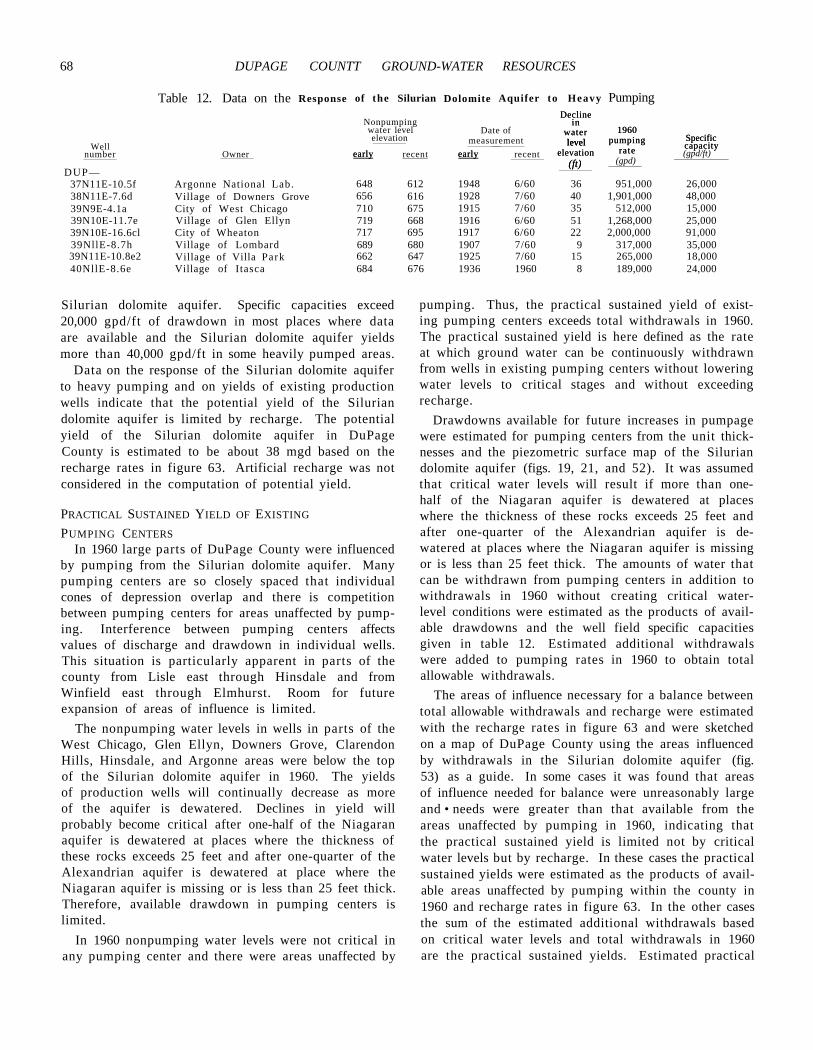
68 DUPAGE COUNTT GROUND-WATER RESOURCES
Table 12. Data on the Response of the Silurian Dolomite Aquifer to Heavy Pumping
Well number Owner
Nonpumping water level elevation
Date of measurement
Decline in
water level
elevation (ft)
1960 pumping
rate (gpd)
Specific capacity (gpd/ft) early recent early recent
Decline in
water level
elevation (ft)
1960 pumping
rate Specific capacity
DUP—
early early level
37N11E-10.5f Argonne National Lab. 648 612 1948 6/60 36 951,000 26,000 38N11E-7.6d Village of Downers Grove 656 616 1928 7/60 40 1,901,000 48,000 39N9E-4.1a City of West Chicago 710 675 1915 7/60 35 512,000 15,000 39N10E-11.7e Village of Glen Ellyn 719 668 1916 6/60 51 1,268,000 25,000 39N10E-16.6cl City of Wheaton 717 695 1917 6/60 22 2,000,000 91,000 39NllE-8.7h Village of Lombard 689 680 1907 7/60 9 317,000 35,000
39N11E-10.8e2 Village of Villa Park 662 647 1925 7/60 15 265,000 18,000 40NllE-8.6e Village of Itasca 684 676 1936 1960 8 189,000 24,000
Silurian dolomite aquifer. Specific capacities exceed 20,000 gpd/ft of drawdown in most places where data are available and the Silurian dolomite aquifer yields more than 40,000 gpd/ft in some heavily pumped areas.
Data on the response of the Silurian dolomite aquifer to heavy pumping and on yields of existing production wells indicate that the potential yield of the Silurian dolomite aquifer is limited by recharge. The potential yield of the Silurian dolomite aquifer in DuPage County is estimated to be about 38 mgd based on the recharge rates in figure 63. Artificial recharge was not considered in the computation of potential yield.
PRACTICAL SUSTAINED YIELD OF EXISTING
PUMPING CENTERS In 1960 large parts of DuPage County were influenced
by pumping from the Silurian dolomite aquifer. Many pumping centers are so closely spaced that individual cones of depression overlap and there is competition between pumping centers for areas unaffected by pumping. Interference between pumping centers affects values of discharge and drawdown in individual wells. This situation is particularly apparent in parts of the county from Lisle east through Hinsdale and from Winfield east through Elmhurst. Room for future expansion of areas of influence is limited.
The nonpumping water levels in wells in parts of the West Chicago, Glen Ellyn, Downers Grove, Clarendon Hills, Hinsdale, and Argonne areas were below the top of the Silurian dolomite aquifer in 1960. The yields of production wells will continually decrease as more of the aquifer is dewatered. Declines in yield will probably become critical after one-half of the Niagaran aquifer is dewatered at places where the thickness of these rocks exceeds 25 feet and after one-quarter of the Alexandrian aquifer is dewatered at place where the Niagaran aquifer is missing or is less than 25 feet thick. Therefore, available drawdown in pumping centers is limited.
In 1960 nonpumping water levels were not critical in any pumping center and there were areas unaffected by
pumping. Thus, the practical sustained yield of existing pumping centers exceeds total withdrawals in 1960. The practical sustained yield is here defined as the rate at which ground water can be continuously withdrawn from wells in existing pumping centers without lowering water levels to critical stages and without exceeding recharge.
Drawdowns available for future increases in pumpage were estimated for pumping centers from the unit thicknesses and the piezometric surface map of the Silurian dolomite aquifer (figs. 19, 21, and 52). It was assumed that critical water levels will result if more than one-half of the Niagaran aquifer is dewatered at places where the thickness of these rocks exceeds 25 feet and after one-quarter of the Alexandrian aquifer is de-watered at places where the Niagaran aquifer is missing or is less than 25 feet thick. The amounts of water that can be withdrawn from pumping centers in addition to withdrawals in 1960 without creating critical water-level conditions were estimated as the products of available drawdowns and the well field specific capacities given in table 12. Estimated additional withdrawals were added to pumping rates in 1960 to obtain total allowable withdrawals.
The areas of influence necessary for a balance between total allowable withdrawals and recharge were estimated with the recharge rates in figure 63 and were sketched on a map of DuPage County using the areas influenced by withdrawals in the Silurian dolomite aquifer (fig. 53) as a guide. In some cases it was found that areas of influence needed for balance were unreasonably large and • needs were greater than that available from the areas unaffected by pumping in 1960, indicating that the practical sustained yield is limited not by critical water levels but by recharge. In these cases the practical sustained yields were estimated as the products of available areas unaffected by pumping within the county in 1960 and recharge rates in figure 63. In the other cases the sum of the estimated additional withdrawals based on critical water levels and total withdrawals in 1960 are the practical sustained yields. Estimated practical
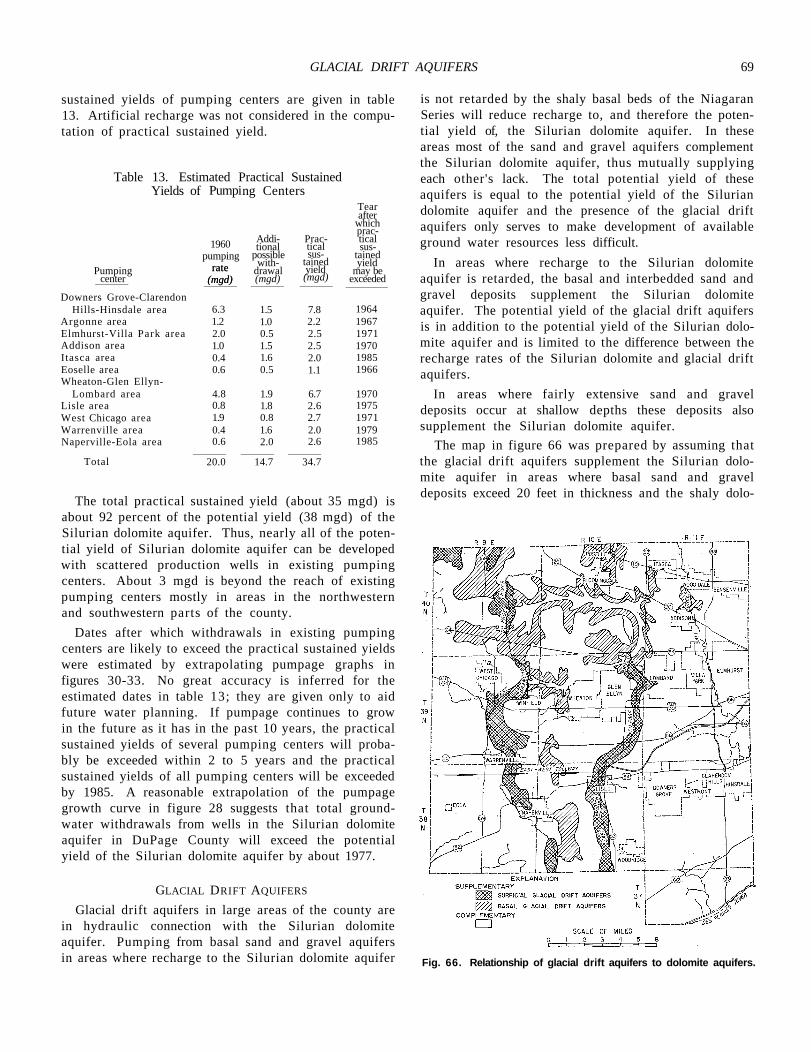
GLACIAL DRIFT AQUIFERS 69
sustained yields of pumping centers are given in table 13. Artificial recharge was not considered in the computation of practical sustained yield.
Table 13. Estimated Practical Sustained Yields of Pumpi ng Centers
Tear after
which
Pumping center
1960 pumping
rate (mgd)
Additional
possible with
drawal (mgd)
Practical sus
tained yield (mgd)
practical sus
tained yield
may be exceeded
Downers Grove-Clarendon
rate (mgd)
Hills-Hinsdale area 6.3 1.5 7.8 1964 Argonne area 1.2 1.0 2.2 1967 Elmhurst-Villa Park area 2.0 0.5 2.5 1971 Addison area 1.0 1.5 2.5 1970 Itasca area 0.4 1.6 2.0 1985 Eoselle area 0.6 0.5 1.1 1966 Wheaton-Glen Ellyn-
Lombard area 4.8 1.9 6.7 1970 Lisle area 0.8 1.8 2.6 1975 West Chicago area 1.9 0.8 2.7 1971 Warrenville area 0.4 1.6 2.0 1979 Naperville-Eola area 0.6 2.0 2.6 1985
Total 20.0 14.7 34.7
The total practical sustained yield (about 35 mgd) is about 92 percent of the potential yield (38 mgd) of the Silurian dolomite aquifer. Thus, nearly all of the potential yield of Silurian dolomite aquifer can be developed with scattered production wells in existing pumping centers. About 3 mgd is beyond the reach of existing pumping centers mostly in areas in the northwestern and southwestern parts of the county.
Dates after which withdrawals in existing pumping centers are likely to exceed the practical sustained yields were estimated by extrapolating pumpage graphs in figures 30-33. No great accuracy is inferred for the estimated dates in table 13; they are given only to aid future water planning. If pumpage continues to grow in the future as it has in the past 10 years, the practical sustained yields of several pumping centers will probably be exceeded within 2 to 5 years and the practical sustained yields of all pumping centers will be exceeded by 1985. A reasonable extrapolation of the pumpage growth curve in figure 28 suggests that total groundwater withdrawals from wells in the Silurian dolomite aquifer in DuPage County will exceed the potential yield of the Silurian dolomite aquifer by about 1977.
GLACIAL DRIFT AQUIFERS
Glacial drift aquifers in large areas of the county are in hydraulic connection with the Silurian dolomite aquifer. Pumping from basal sand and gravel aquifers in areas where recharge to the Silurian dolomite aquifer
is not retarded by the shaly basal beds of the Niagaran Series will reduce recharge to, and therefore the potential yield of, the Silurian dolomite aquifer. In these areas most of the sand and gravel aquifers complement the Silurian dolomite aquifer, thus mutually supplying each other's lack. The total potential yield of these aquifers is equal to the potential yield of the Silurian dolomite aquifer and the presence of the glacial drift aquifers only serves to make development of available ground water resources less difficult.
In areas where recharge to the Silurian dolomite aquifer is retarded, the basal and interbedded sand and gravel deposits supplement the Silurian dolomite aquifer. The potential yield of the glacial drift aquifers is in addition to the potential yield of the Silurian dolomite aquifer and is limited to the difference between the recharge rates of the Silurian dolomite and glacial drift aquifers.
In areas where fairly extensive sand and gravel deposits occur at shallow depths these deposits also supplement the Silurian dolomite aquifer.
The map in figure 66 was prepared by assuming that the glacial drift aquifers supplement the Silurian dolomite aquifer in areas where basal sand and gravel deposits exceed 20 feet in thickness and the shaly dolo-
Fig. 66. Relationship of glacial drift aquifers to dolomite aquifers.
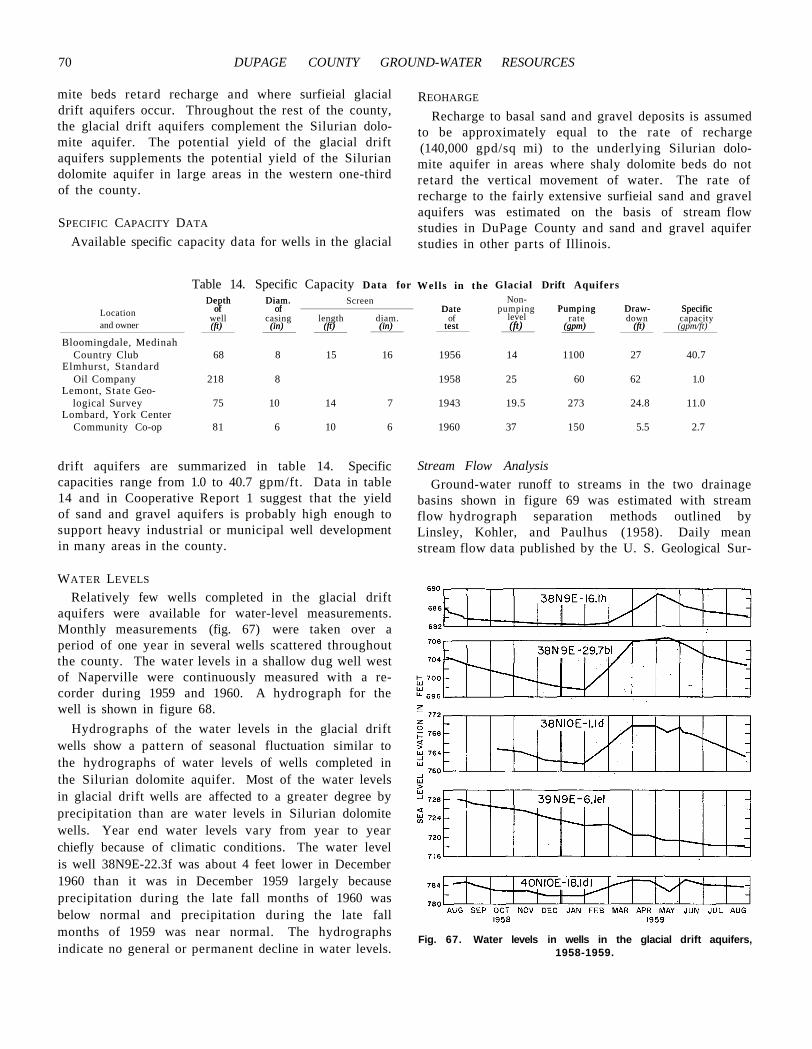
70 DUPAGE COUNTY GROUND-WATER RESOURCES
mite beds retard recharge and where surfieial glacial drift aquifers occur. Throughout the rest of the county, the glacial drift aquifers complement the Silurian dolomite aquifer. The potential yield of the glacial drift aquifers supplements the potential yield of the Silurian dolomite aquifer in large areas in the western one-third of the county.
SPECIFIC CAPACITY DATA
Available specific capacity data for wells in the glacial
REOHARGE
Recharge to basal sand and gravel deposits is assumed to be approximately equal to the rate of recharge (140,000 gpd/sq mi) to the underlying Silurian dolomite aquifer in areas where shaly dolomite beds do not retard the vertical movement of water. The rate of recharge to the fairly extensive surfieial sand and gravel aquifers was estimated on the basis of stream flow studies in DuPage County and sand and gravel aquifer studies in other parts of Illinois.
Table 14. Specific Capacity Data for Wells in the Glacial Drift Aquifers Depth
of Diam.
of Screen
Date Non-
Pumping Draw- Specific Depth
of Diam.
of Date pumping Pumping Draw- Specific Locationand owner
well casing length diam. of level rate down capacity (ft) (in) (ft) (in) test (ft) (gpm) (ft) (gpm/ft)
Bloomingdale, Medinah (ft) (in) (ft) (in) test (ft) (gpm) (ft)
Country Club 68 8 15 16 1956 14 1100 27 40.7 Elmhurst, Standard
Oil Company 218 8 1958 25 60 62 1.0 Lemont, State Geo
logical Survey 75 10 14 7 1943 19.5 273 24.8 11.0 Lombard, York Center
Community Co-op 81 6 10 6 1960 37 150 5.5 2.7
drift aquifers are summarized in table 14. Specific capacities range from 1.0 to 40.7 gpm/ft. Data in table 14 and in Cooperative Report 1 suggest that the yield of sand and gravel aquifers is probably high enough to support heavy industrial or municipal well development in many areas in the county.
WATER LEVELS
Relatively few wells completed in the glacial drift aquifers were available for water-level measurements. Monthly measurements (fig. 67) were taken over a period of one year in several wells scattered throughout the county. The water levels in a shallow dug well west of Naperville were continuously measured with a recorder during 1959 and 1960. A hydrograph for the well is shown in figure 68.
Hydrographs of the water levels in the glacial drift wells show a pattern of seasonal fluctuation similar to the hydrographs of water levels of wells completed in the Silurian dolomite aquifer. Most of the water levels in glacial drift wells are affected to a greater degree by precipitation than are water levels in Silurian dolomite wells. Year end water levels vary from year to year chiefly because of climatic conditions. The water level is well 38N9E-22.3f was about 4 feet lower in December 1960 than it was in December 1959 largely because precipitation during the late fall months of 1960 was below normal and precipitation during the late fall months of 1959 was near normal. The hydrographs indicate no general or permanent decline in water levels.
Stream Flow Analysis Ground-water runoff to streams in the two drainage
basins shown in figure 69 was estimated with stream flow hydrograph separation methods outlined by Linsley, Kohler, and Paulhus (1958). Daily mean stream flow data published by the U. S. Geological Sur-
Fig. 67. Water levels in wells in the glacial drift aquifers, 1958-1959.
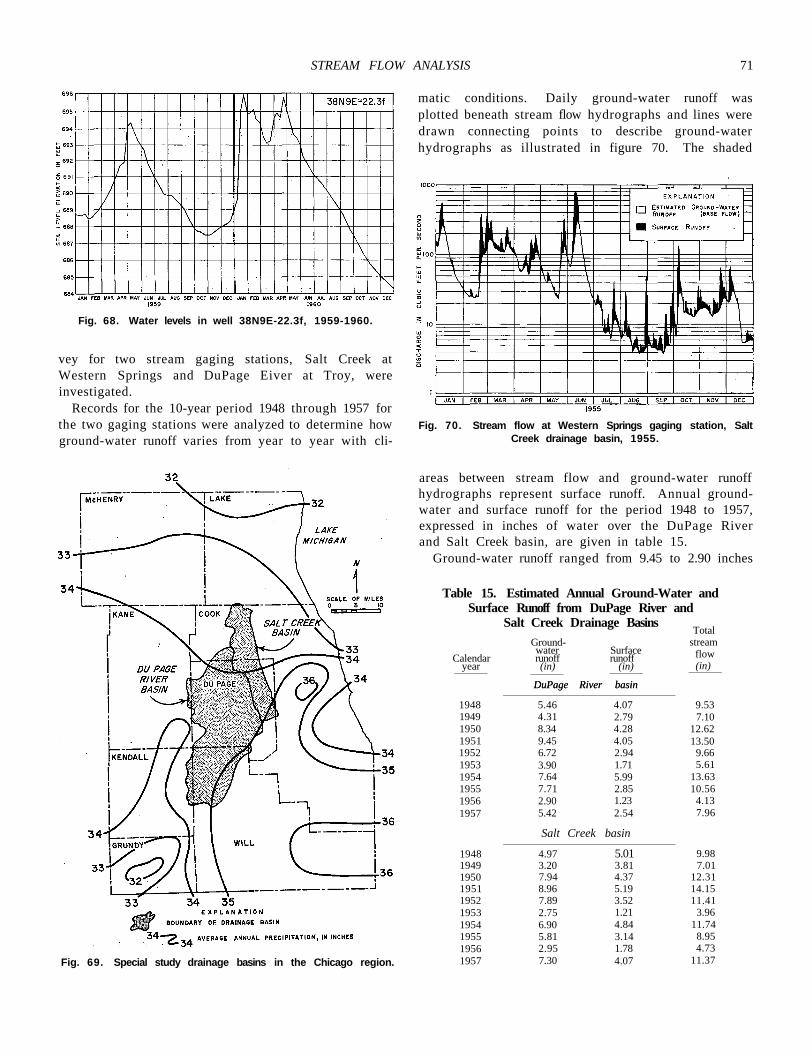
STREAM FLOW ANALYSIS 71
Fig. 68. Water levels in well 38N9E-22.3f, 1959-1960.
vey for two stream gaging stations, Salt Creek at Western Springs and DuPage Eiver at Troy, were investigated.
Records for the 10-year period 1948 through 1957 for the two gaging stations were analyzed to determine how ground-water runoff varies from year to year with cli-
Fig. 69. Special study drainage basins in the Chicago region.
matic conditions. Daily ground-water runoff was plotted beneath stream flow hydrographs and lines were drawn connecting points to describe ground-water hydrographs as illustrated in figure 70. The shaded
Fig. 70. Stream flow at Western Springs gaging station, Salt Creek drainage basin, 1955.
areas between stream flow and ground-water runoff hydrographs represent surface runoff. Annual groundwater and surface runoff for the period 1948 to 1957, expressed in inches of water over the DuPage River and Salt Creek basin, are given in table 15.
Ground-water runoff ranged from 9.45 to 2.90 inches
Calendar year
Groundwater Surface runoff runoff (in) (in)
DuPage River basin
Total stream
flow (in)
DuPage River basin
1948 5.46 4.07 9.53 1949 4.31 2.79 7.10 1950 8.34 4.28 12.62 1951 9.45 4.05 13.50 1952 6.72 2.94 9.66 1953 3.90 1.71 5.61 1954 7.64 5.99 13.63 1955 7.71 2.85 10.56 1956 2.90 1.23 4.13 1957 5.42 2.54 7.96
Salt Creek basin
1948 4.97 5.01 9.98 1949 3.20 3.81 7.01 1950 7.94 4.37 12.31 1951 8.96 5.19 14.15 1952 7.89 3.52 11.41 1953 2.75 1.21 3.96 1954 6.90 4.84 11.74 1955 5.81 3.14 8.95 1956 2.95 1.78 4.73 1957 7.30 4.07 11.37
Table 15. Estimated Annual Ground-Water and Surface Runoff from DuPage River and
Salt Creek Drainage Basins
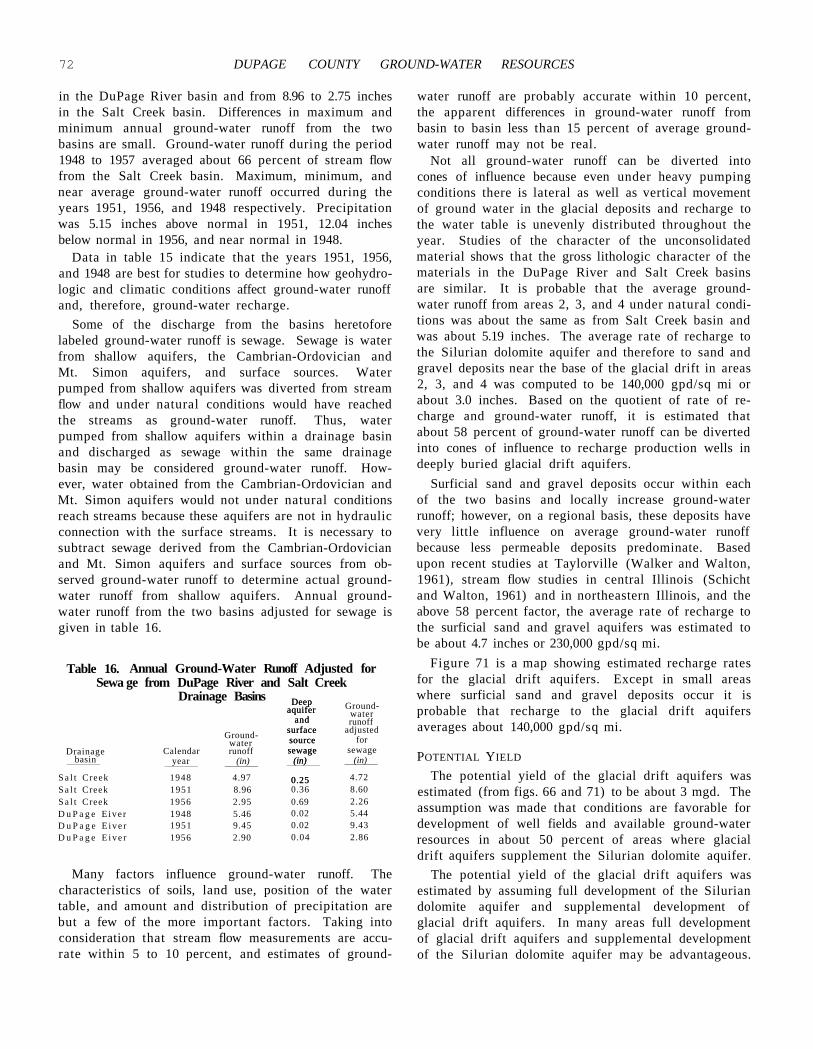
72 DUPAGE COUNTY GROUND-WATER RESOURCES
in the DuPage River basin and from 8.96 to 2.75 inches in the Salt Creek basin. Differences in maximum and minimum annual ground-water runoff from the two basins are small. Ground-water runoff during the period 1948 to 1957 averaged about 66 percent of stream flow from the Salt Creek basin. Maximum, minimum, and near average ground-water runoff occurred during the years 1951, 1956, and 1948 respectively. Precipitation was 5.15 inches above normal in 1951, 12.04 inches below normal in 1956, and near normal in 1948.
Data in table 15 indicate that the years 1951, 1956, and 1948 are best for studies to determine how geohydro-logic and climatic conditions affect ground-water runoff and, therefore, ground-water recharge.
Some of the discharge from the basins heretofore labeled ground-water runoff is sewage. Sewage is water from shallow aquifers, the Cambrian-Ordovician and Mt. Simon aquifers, and surface sources. Water pumped from shallow aquifers was diverted from stream flow and under natural conditions would have reached the streams as ground-water runoff. Thus, water pumped from shallow aquifers within a drainage basin and discharged as sewage within the same drainage basin may be considered ground-water runoff. However, water obtained from the Cambrian-Ordovician and Mt. Simon aquifers would not under natural conditions reach streams because these aquifers are not in hydraulic connection with the surface streams. It is necessary to subtract sewage derived from the Cambrian-Ordovician and Mt. Simon aquifers and surface sources from observed ground-water runoff to determine actual groundwater runoff from shallow aquifers. Annual groundwater runoff from the two basins adjusted for sewage is given in table 16.
Drainage basin
Groundwater
Calendar runoff year (in)
Deep aquifer
and surface source sewage
(in)
0.25
Groundwater runoff
adjusted for
sewage (in)
S a l t Creek 1948 4.97
Deep aquifer
and surface source sewage
(in)
0.25 4.72 S a l t Creek 1951 8.96 0.36 8.60 S a l t Creek 1956 2.95 0.69 2.26 D u P a g e E ive r 1948 5.46 0.02 5.44 D u P a g e E i v e r 1951 9.45 0.02 9.43 D u P a g e E i v e r 1956 2.90 0.04 2.86
Many factors influence ground-water runoff. The characteristics of soils, land use, position of the water table, and amount and distribution of precipitation are but a few of the more important factors. Taking into consideration that stream flow measurements are accurate within 5 to 10 percent, and estimates of ground
water runoff are probably accurate within 10 percent, the apparent differences in ground-water runoff from basin to basin less than 15 percent of average groundwater runoff may not be real.
Not all ground-water runoff can be diverted into cones of influence because even under heavy pumping conditions there is lateral as well as vertical movement of ground water in the glacial deposits and recharge to the water table is unevenly distributed throughout the year. Studies of the character of the unconsolidated material shows that the gross lithologic character of the materials in the DuPage River and Salt Creek basins are similar. It is probable that the average groundwater runoff from areas 2, 3, and 4 under natural conditions was about the same as from Salt Creek basin and was about 5.19 inches. The average rate of recharge to the Silurian dolomite aquifer and therefore to sand and gravel deposits near the base of the glacial drift in areas 2, 3, and 4 was computed to be 140,000 gpd/sq mi or about 3.0 inches. Based on the quotient of rate of recharge and ground-water runoff, it is estimated that about 58 percent of ground-water runoff can be diverted into cones of influence to recharge production wells in deeply buried glacial drift aquifers.
Surficial sand and gravel deposits occur within each of the two basins and locally increase ground-water runoff; however, on a regional basis, these deposits have very little influence on average ground-water runoff because less permeable deposits predominate. Based upon recent studies at Taylorville (Walker and Walton, 1961), stream flow studies in central Illinois (Schicht and Walton, 1961) and in northeastern Illinois, and the above 58 percent factor, the average rate of recharge to the surficial sand and gravel aquifers was estimated to be about 4.7 inches or 230,000 gpd/sq mi.
Figure 71 is a map showing estimated recharge rates for the glacial drift aquifers. Except in small areas where surficial sand and gravel deposits occur it is probable that recharge to the glacial drift aquifers averages about 140,000 gpd/sq mi.
POTENTIAL YIELD
The potential yield of the glacial drift aquifers was estimated (from figs. 66 and 71) to be about 3 mgd. The assumption was made that conditions are favorable for development of well fields and available ground-water resources in about 50 percent of areas where glacial drift aquifers supplement the Silurian dolomite aquifer.
The potential yield of the glacial drift aquifers was estimated by assuming full development of the Silurian dolomite aquifer and supplemental development of glacial drift aquifers. In many areas full development of glacial drift aquifers and supplemental development of the Silurian dolomite aquifer may be advantageous.
Table 16. Annual Ground-Water Runoff Adjusted for Sewa ge from DuPage River and Salt Creek
Drainage Basins
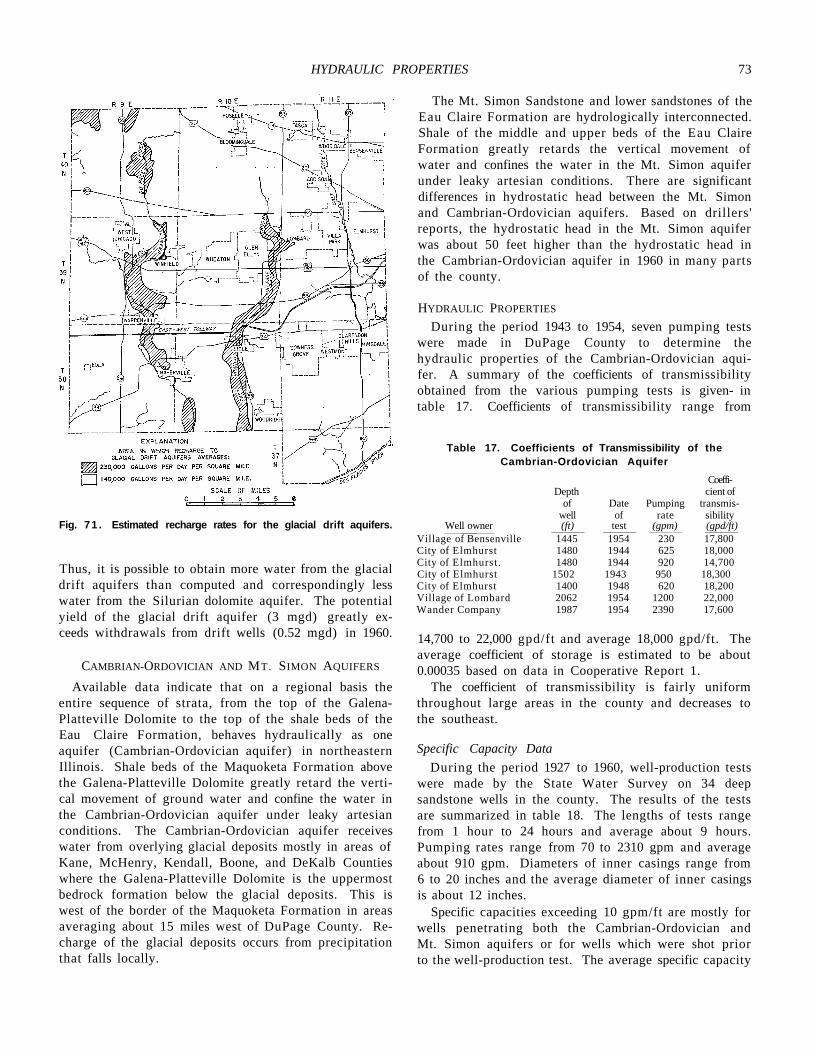
HYDRAULIC PROPERTIES 73
Fig. 71 . Estimated recharge rates for the glacial drift aquifers.
Thus, it is possible to obtain more water from the glacial drift aquifers than computed and correspondingly less water from the Silurian dolomite aquifer. The potential yield of the glacial drift aquifer (3 mgd) greatly exceeds withdrawals from drift wells (0.52 mgd) in 1960.
CAMBRIAN-ORDOVICIAN AND MT. SIMON AQUIFERS
Available data indicate that on a regional basis the entire sequence of strata, from the top of the Galena-Platteville Dolomite to the top of the shale beds of the Eau Claire Formation, behaves hydraulically as one aquifer (Cambrian-Ordovician aquifer) in northeastern Illinois. Shale beds of the Maquoketa Formation above the Galena-Platteville Dolomite greatly retard the vertical movement of ground water and confine the water in the Cambrian-Ordovician aquifer under leaky artesian conditions. The Cambrian-Ordovician aquifer receives water from overlying glacial deposits mostly in areas of Kane, McHenry, Kendall, Boone, and DeKalb Counties where the Galena-Platteville Dolomite is the uppermost bedrock formation below the glacial deposits. This is west of the border of the Maquoketa Formation in areas averaging about 15 miles west of DuPage County. Recharge of the glacial deposits occurs from precipitation that falls locally.
The Mt. Simon Sandstone and lower sandstones of the Eau Claire Formation are hydrologically interconnected. Shale of the middle and upper beds of the Eau Claire Formation greatly retards the vertical movement of water and confines the water in the Mt. Simon aquifer under leaky artesian conditions. There are significant differences in hydrostatic head between the Mt. Simon and Cambrian-Ordovician aquifers. Based on drillers' reports, the hydrostatic head in the Mt. Simon aquifer was about 50 feet higher than the hydrostatic head in the Cambrian-Ordovician aquifer in 1960 in many parts of the county.
HYDRAULIC PROPERTIES
During the period 1943 to 1954, seven pumping tests were made in DuPage County to determine the hydraulic properties of the Cambrian-Ordovician aquifer. A summary of the coefficients of transmissibility obtained from the various pumping tests is given- in table 17. Coefficients of transmissibility range from
Table 17. Coefficients of Transmissibility of the Cambrian-Ordovician Aquifer
Coeffi-Depth cient of
of Date Pumping transmis-well of rate sibility
Well owner (ft) test (gpm) (gpd/ft) Village of Bensenville 1445 1954 230 17,800 City of Elmhurst 1480 1944 625 18,000 City of Elmhurst. 1480 1944 920 14,700 City of Elmhurst 1502 1943 950 18,300 City of Elmhurst 1400 1948 620 18,200 Village of Lombard 2062 1954 1200 22,000 Wander Company 1987 1954 2390 17,600
14,700 to 22,000 gpd/ft and average 18,000 gpd/ft. The average coefficient of storage is estimated to be about 0.00035 based on data in Cooperative Report 1.
The coefficient of transmissibility is fairly uniform throughout large areas in the county and decreases to the southeast.
Specific Capacity Data During the period 1927 to 1960, well-production tests
were made by the State Water Survey on 34 deep sandstone wells in the county. The results of the tests are summarized in table 18. The lengths of tests range from 1 hour to 24 hours and average about 9 hours. Pumping rates range from 70 to 2310 gpm and average about 910 gpm. Diameters of inner casings range from 6 to 20 inches and the average diameter of inner casings is about 12 inches.
Specific capacities exceeding 10 gpm/ft are mostly for wells penetrating both the Cambrian-Ordovician and Mt. Simon aquifers or for wells which were shot prior to the well-production test. The average specific capacity
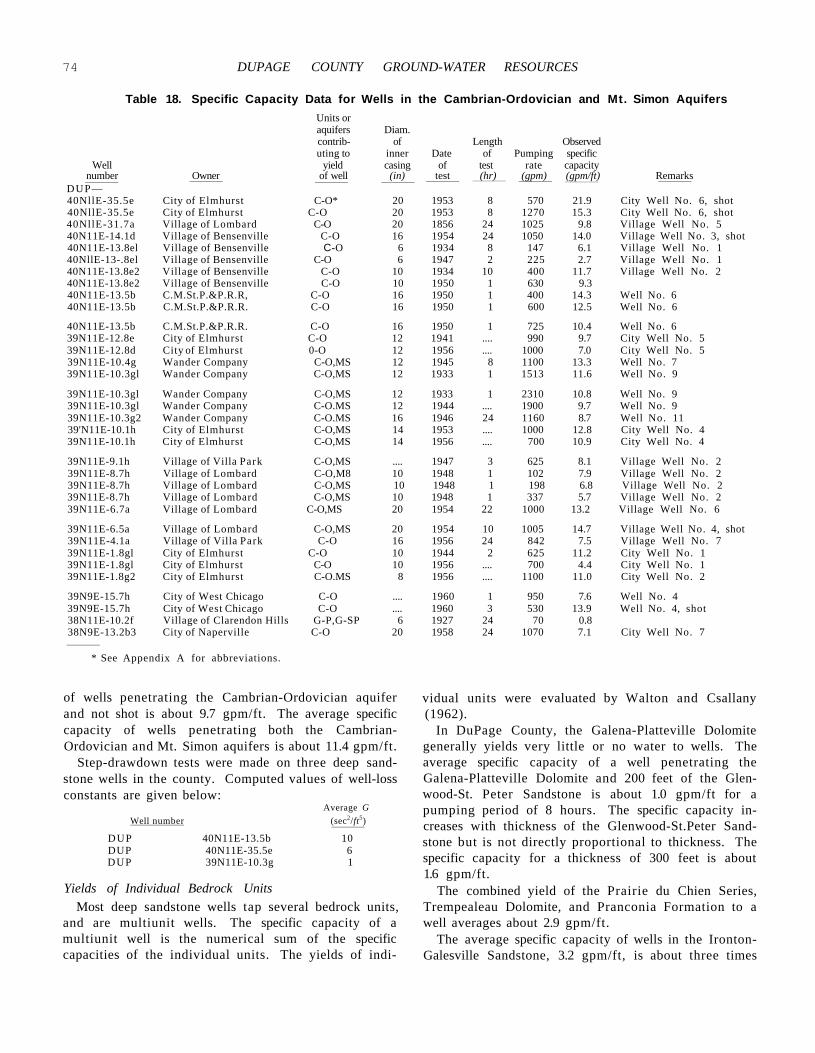
74 DUPAGE COUNTY GROUND-WATER RESOURCES
Table 18. Specific Capacity Data for Wells in the Cambrian-Ordovician and Mt. Simon Aquifers Units or aquifers Diam. contrib- of Length Observed uting to inner Date of Pumping specific
Well yield casing of test rate capacity number Owner of well (in) test (hr) (gpm) (gpm/ft) Remarks
DUP— 40NllE-35.5e City of Elmhurst C-O* 20 1953 8 570 21.9 City Well No. 6, shot 40NllE-35.5e City of Elmhurst C-O 20 1953 8 1270 15.3 City Well No. 6, shot 40NllE-31.7a Village of Lombard C-O 20 1856 24 1025 9.8 Village Well No. 5 40N11E-14.1d Village of Bensenville C-O 16 1954 24 1050 14.0 Village Well No. 3, shot 40N11E-13.8el Village of Bensenville C-O 6 1934 8 147 6.1 Village Well No. 1 40NllE-13-.8el Village of Bensenville C-O 6 1947 2 225 2.7 Village Well No. 1 40N11E-13.8e2 Village of Bensenville C-O 10 1934 10 400 11.7 Village Well No. 2 40N11E-13.8e2 Village of Bensenville C-O 10 1950 1 630 9.3 40N11E-13.5b C.M.St.P.&P.R.R, C-O 16 1950 1 400 14.3 Well No. 6 40N11E-13.5b C.M.St.P.&P.R.R. C-O 16 1950 1 600 12.5 Well No. 6
40N11E-13.5b C.M.St.P.&P.R.R. C-O 16 1950 1 725 10.4 Well No. 6 39N11E-12.8e City of Elmhurst C-O 12 1941 .... 990 9.7 City Well No. 5 39N11E-12.8d City of Elmhurst 0-O 12 1956 .... 1000 7.0 City Well No. 5 39N11E-10.4g Wander Company C-O,MS 12 1945 8 1100 13.3 Well No. 7 39N11E-10.3gl Wander Company C-O,MS 12 1933 1 1513 11.6 Well No. 9
39N11E-10.3gl Wander Company C-O,MS 12 1933 1 2310 10.8 Well No. 9 39N11E-10.3gl Wander Company C-O.MS 12 1944 .... 1900 9.7 Well No. 9 39N11E-10.3g2 Wander Company C-O.MS 16 1946 24 1160 8.7 Well No. 11 39'N11E-10.1h City of Elmhurst C-O,MS 14 1953 .... 1000 12.8 City Well No. 4 39N11E-10.1h City of Elmhurst C-O,MS 14 1956 .... 700 10.9 City Well No. 4
39N11E-9.1h Village of Villa Park C-O,MS .... 1947 3 625 8.1 Village Well No. 2 39N11E-8.7h Village of Lombard C-O,M8 10 1948 1 102 7.9 Village Well No. 2 39N11E-8.7h Village of Lombard C-O,MS 10 1948 1 198 6.8 Village Well No. 2 39N11E-8.7h Village of Lombard C-O,MS 10 1948 1 337 5.7 Village Well No. 2 39N11E-6.7a Village of Lombard C-O,MS 20 1954 22 1000 13.2 Village Well No. 6
39N11E-6.5a Village of Lombard C-O,MS 20 1954 10 1005 14.7 Village Well No. 4, shot 39N11E-4.1a Village of Villa Park C-O 16 1956 24 842 7.5 Village Well No. 7 39N11E-1.8gl City of Elmhurst C-O 10 1944 2 625 11.2 City Well No. 1 39N11E-1.8gl City of Elmhurst C-O 10 1956 .... 700 4.4 City Well No. 1 39N11E-1.8g2 City of Elmhurst C-O.MS 8 1956 .... 1100 11.0 City Well No. 2
39N9E-15.7h City of West Chicago C-O .... 1960 1 950 7.6 Well No. 4 39N9E-15.7h City of West Chicago C-O .... 1960 3 530 13.9 Well No. 4, shot 38N11E-10.2f Village of Clarendon Hills G-P,G-SP 6 1927 24 70 0.8 38N9E-13.2b3 City of Naperville C-O 20 1958 24 1070 7.1 City Well No. 7
* See Appendix A for abbreviations.
of wells penetrating the Cambrian-Ordovician aquifer and not shot is about 9.7 gpm/ft. The average specific capacity of wells penetrating both the Cambrian-Ordovician and Mt. Simon aquifers is about 11.4 gpm/ft.
Step-drawdown tests were made on three deep sandstone wells in the county. Computed values of well-loss constants are given below:
Average G Well number (sec2/ft5)
DUP 40N11E-13.5b 10 DUP 40N11E-35.5e 6 DUP 39N11E-10.3g 1
Yields of Individual Bedrock Units Most deep sandstone wells tap several bedrock units,
and are multiunit wells. The specific capacity of a multiunit well is the numerical sum of the specific capacities of the individual units. The yields of indi
vidual units were evaluated by Walton and Csallany (1962).
In DuPage County, the Galena-Platteville Dolomite generally yields very little or no water to wells. The average specific capacity of a well penetrating the Galena-Platteville Dolomite and 200 feet of the Glen-wood-St. Peter Sandstone is about 1.0 gpm/ft for a pumping period of 8 hours. The specific capacity increases with thickness of the Glenwood-St.Peter Sandstone but is not directly proportional to thickness. The specific capacity for a thickness of 300 feet is about 1.6 gpm/ft.
The combined yield of the Prairie du Chien Series, Trempealeau Dolomite, and Pranconia Formation to a well averages about 2.9 gpm/ft.
The average specific capacity of wells in the Ironton-Galesville Sandstone, 3.2 gpm/ft, is about three times
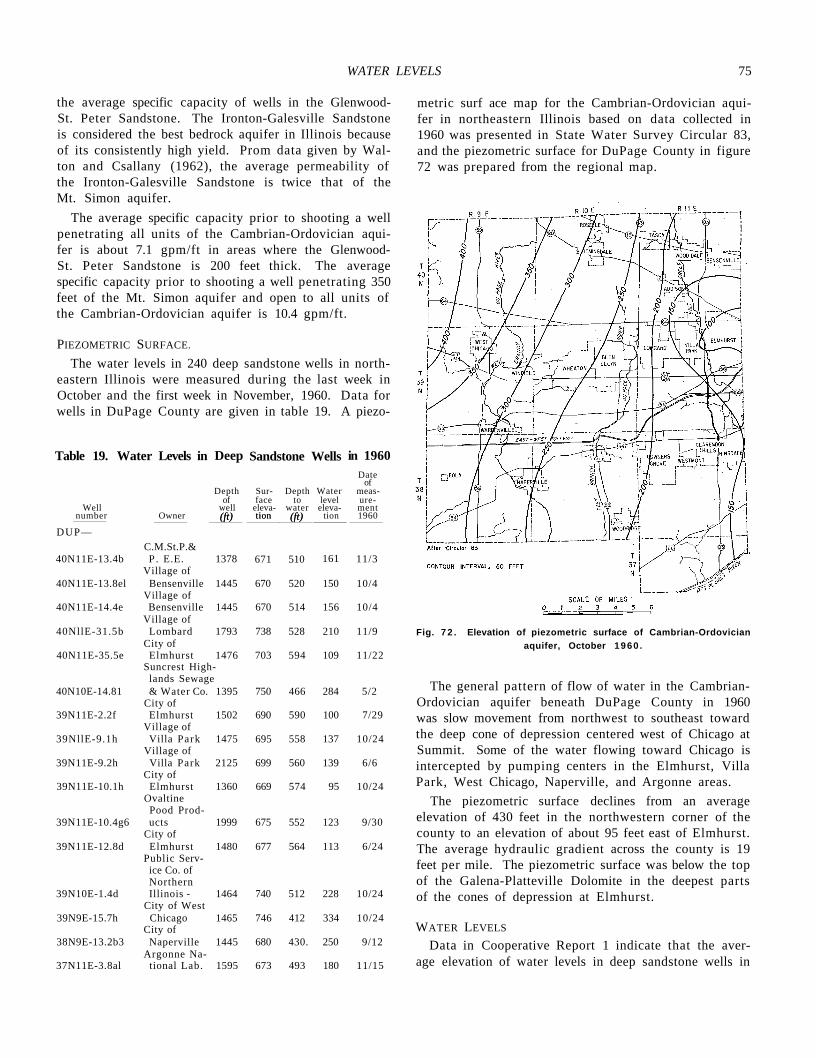
WATER LEVELS 75
the average specific capacity of wells in the Glenwood-St. Peter Sandstone. The Ironton-Galesville Sandstone is considered the best bedrock aquifer in Illinois because of its consistently high yield. Prom data given by Walton and Csallany (1962), the average permeability of the Ironton-Galesville Sandstone is twice that of the Mt. Simon aquifer.
The average specific capacity prior to shooting a well penetrating all units of the Cambrian-Ordovician aquifer is about 7.1 gpm/ft in areas where the Glenwood-St. Peter Sandstone is 200 feet thick. The average specific capacity prior to shooting a well penetrating 350 feet of the Mt. Simon aquifer and open to all units of the Cambrian-Ordovician aquifer is 10.4 gpm/ft.
PIEZOMETRIC SURFACE.
The water levels in 240 deep sandstone wells in northeastern Illinois were measured during the last week in October and the first week in November, 1960. Data for wells in DuPage County are given in table 19. A piezo-
Date of
Depth Sur Depth Water measof face to level ure
Well well eleva water eleva ment number Owner (ft) tion (ft) tion 1960
DUP— (ft) tion (ft)
C.M.St.P.& 40N11E-13.4b P . E.E.
Village of 1378 671 510 161 11/3
40N11E-13.8el Bensenville Village of
1445 670 520 150 10/4
40N11E-14.4e Bensenville Village of
1445 670 514 156 10/4
40NllE-31.5b Lombard City of
1793 738 528 210 11/9
40N11E-35.5e Elmhurst 1476 703 594 109 11/22 Suncrest High
lands Sewage 40N10E-14.81 & Water Co.
City of 1395 750 466 284 5/2
39N11E-2.2f Elmhurst Village of
1502 690 590 100 7/29
39NllE-9.1h Villa Park Village of
1475 695 558 137 10/24
39N11E-9.2h Villa Park City of
2125 699 560 139 6/6
39N11E-10.1h Elmhurst Ovaltine
Pood Prod
1360 669 574 95 10/24
39N11E-10.4g6 ucts City of
1999 675 552 123 9/30
39N11E-12.8d Elmhurst Public Serv
ice Co. of Northern
1480 677 564 113 6/24
39N10E-1.4d Illinois -City of West
1464 740 512 228 10/24
39N9E-15.7h Chicago City of
1465 746 412 334 10/24
38N9E-13.2b3 Naperville Argonne Na
1445 680 430. 250 9/12
37N11E-3.8al tional Lab. 1595 673 493 180 11/15
metric surf ace map for the Cambrian-Ordovician aquifer in northeastern Illinois based on data collected in 1960 was presented in State Water Survey Circular 83, and the piezometric surface for DuPage County in figure 72 was prepared from the regional map.
Fig. 7 2 . Elevation of piezometric surface of Cambrian-Ordovician aquifer, October 1960 .
The general pattern of flow of water in the Cambrian-Ordovician aquifer beneath DuPage County in 1960 was slow movement from northwest to southeast toward the deep cone of depression centered west of Chicago at Summit. Some of the water flowing toward Chicago is intercepted by pumping centers in the Elmhurst, Villa Park, West Chicago, Naperville, and Argonne areas.
The piezometric surface declines from an average elevation of 430 feet in the northwestern corner of the county to an elevation of about 95 feet east of Elmhurst. The average hydraulic gradient across the county is 19 feet per mile. The piezometric surface was below the top of the Galena-Platteville Dolomite in the deepest parts of the cones of depression at Elmhurst.
WATER LEVELS
Data in Cooperative Report 1 indicate that the average elevation of water levels in deep sandstone wells in
Table 19. Water Levels in Deep Sandstone Wells in 1960
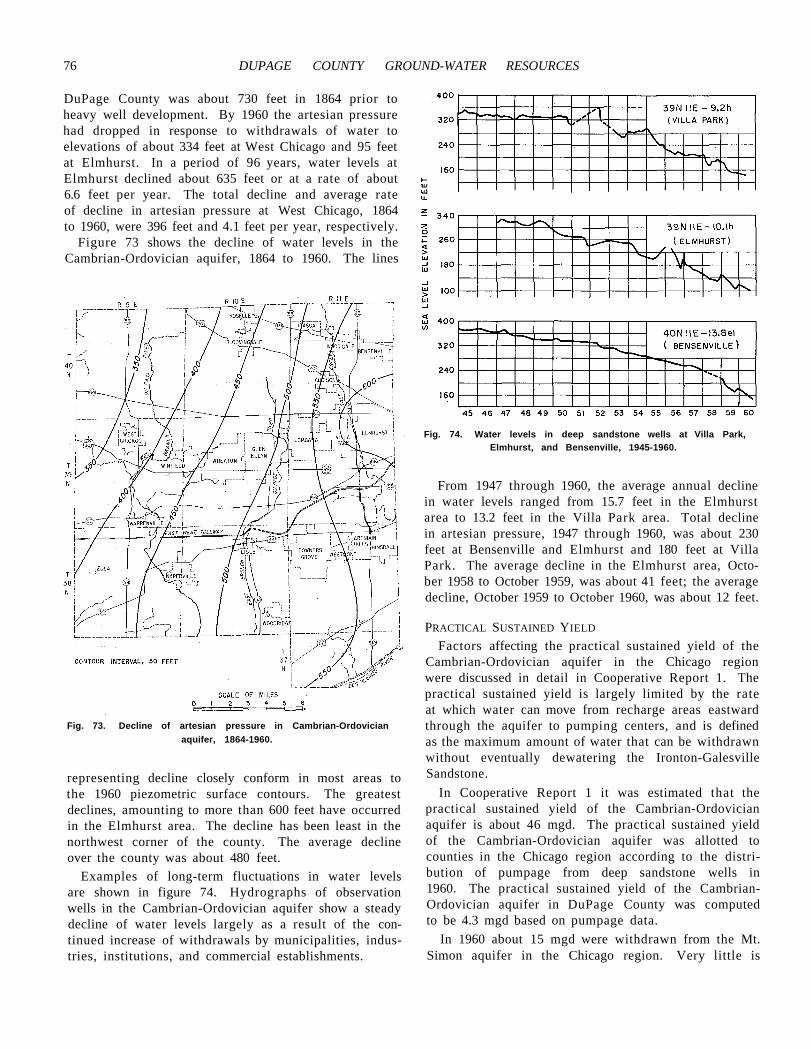
76 DUPAGE COUNTY GROUND-WATER RESOURCES
DuPage County was about 730 feet in 1864 prior to heavy well development. By 1960 the artesian pressure had dropped in response to withdrawals of water to elevations of about 334 feet at West Chicago and 95 feet at Elmhurst. In a period of 96 years, water levels at Elmhurst declined about 635 feet or at a rate of about 6.6 feet per year. The total decline and average rate of decline in artesian pressure at West Chicago, 1864 to 1960, were 396 feet and 4.1 feet per year, respectively.
Figure 73 shows the decline of water levels in the Cambrian-Ordovician aquifer, 1864 to 1960. The lines
Fig. 73. Decline of artesian pressure in Cambrian-Ordovician aquifer, 1864-1960.
representing decline closely conform in most areas to the 1960 piezometric surface contours. The greatest declines, amounting to more than 600 feet have occurred in the Elmhurst area. The decline has been least in the northwest corner of the county. The average decline over the county was about 480 feet.
Examples of long-term fluctuations in water levels are shown in figure 74. Hydrographs of observation wells in the Cambrian-Ordovician aquifer show a steady decline of water levels largely as a result of the continued increase of withdrawals by municipalities, industries, institutions, and commercial establishments.
Fig. 74. Water levels in deep sandstone wells at Villa Park, Elmhurst, and Bensenville, 1945-1960.
From 1947 through 1960, the average annual decline in water levels ranged from 15.7 feet in the Elmhurst area to 13.2 feet in the Villa Park area. Total decline in artesian pressure, 1947 through 1960, was about 230 feet at Bensenville and Elmhurst and 180 feet at Villa Park. The average decline in the Elmhurst area, October 1958 to October 1959, was about 41 feet; the average decline, October 1959 to October 1960, was about 12 feet.
PRACTICAL SUSTAINED YIELD
Factors affecting the practical sustained yield of the Cambrian-Ordovician aquifer in the Chicago region were discussed in detail in Cooperative Report 1. The practical sustained yield is largely limited by the rate at which water can move from recharge areas eastward through the aquifer to pumping centers, and is defined as the maximum amount of water that can be withdrawn without eventually dewatering the Ironton-Galesville Sandstone.
In Cooperative Report 1 it was estimated that the practical sustained yield of the Cambrian-Ordovician aquifer is about 46 mgd. The practical sustained yield of the Cambrian-Ordovician aquifer was allotted to counties in the Chicago region according to the distribution of pumpage from deep sandstone wells in 1960. The practical sustained yield of the Cambrian-Ordovician aquifer in DuPage County was computed to be 4.3 mgd based on pumpage data.
In 1960 about 15 mgd were withdrawn from the Mt. Simon aquifer in the Chicago region. Very little is
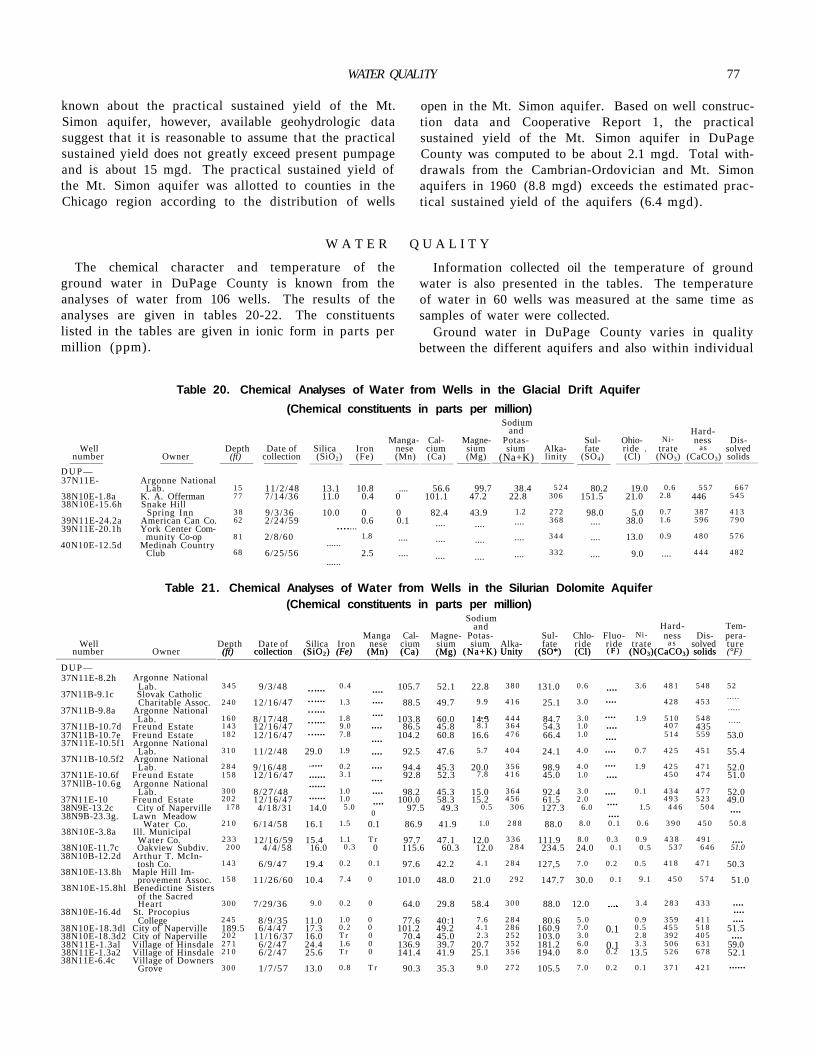
WATER QUAL1TY 77
known about the practical sustained yield of the Mt. Simon aquifer, however, available geohydrologic data suggest that it is reasonable to assume that the practical sustained yield does not greatly exceed present pumpage and is about 15 mgd. The practical sustained yield of the Mt. Simon aquifer was allotted to counties in the Chicago region according to the distribution of wells
open in the Mt. Simon aquifer. Based on well construction data and Cooperative Report 1, the practical sustained yield of the Mt. Simon aquifer in DuPage County was computed to be about 2.1 mgd. Total withdrawals from the Cambrian-Ordovician and Mt. Simon aquifers in 1960 (8.8 mgd) exceeds the estimated practical sustained yield of the aquifers (6.4 mgd).
W A T E R Q U A L I T Y
The chemical character and temperature of the ground water in DuPage County is known from the analyses of water from 106 wells. The results of the analyses are given in tables 20-22. The constituents listed in the tables are given in ionic form in parts per million (ppm).
Information collected oil the temperature of ground water is also presented in the tables. The temperature of water in 60 wells was measured at the same time as samples of water were collected.
Ground water in DuPage County varies in quality between the different aquifers and also within individual
Sodium and Hard
Manga- Cal- Magne Potas Sul- Ohio- Ni ness DisWell Depth Date of Silica Iron nese cium sium sium Alka fate ride . trate as solved
number Owner (ft) collection (SiO2) (Fe) (Mn) (Ca) (Mg) (Na+K) linity (SO4) (Cl) (NO3) (CaCO3) solids D U P — 37N11E- Argonne National
Lab. 15 11/2/48 13.1 10.8 .... 56.6 99.7 38.4 5 2 4 80.2 19.0 0.6 5 5 7 6 6 7 38N10E-1.8a K. A. Offerman 77 7/14/36 11.0 0.4 0 101.1 47.2 22.8 306 151.5 21.0 2.8 446 5 4 5 38N10E-15.6h Snake Hill
Spring Inn 3 8 9/3/36 10.0 0 0 82.4 43.9 1.2 272 98.0 5.0 0.7 387 4 1 3 39N11E-24.2a American Can Co. 62 2/24/59 0.6 0.1 368 38.0 1.6 5 9 6 7 9 0 39N11E-20.1h York Center Com
munity Co-op 8 1 2/8/60 1.8 3 4 4 13.0 0.9 4 8 0 5 7 6 40N10E-12.5d Medinah Country
Club 68 6/25/56 2.5 .... 332 4 4 4 4 8 2
Sodium and Hard Tem
Manga Cal Magne Potas Sul Chlo Fluo Ni ness Dis peraWell Depth Date of Silica Iron nese cium sium sium Alka- fate ride ride trate a s solved ture
number Owner (ft) collection (SiO2) (Fe) (Mn) (Ca) (Mg) (Na+K) Unity (SO*) (Cl) ( F ) (NO3)(CaCO3) solids (°F)
D U P — 37N11E-8.2h Argonne National
(ft) collection (SiO2) (Fe) (Mn) (Ca) (Mg) (Na+K) Unity (SO*) (Cl) ( F ) (NO3)(CaCO3) solids
Lab. 3 4 5 9/3/48 0.4 105.7 52.1 22.8 3 8 0 131.0 0.6 3.6 4 8 1 548 52 37N11B-9.1c Slovak Catholic
Charitable Assoc. 2 4 0 12/16/47 1.3 88.5 49.7 9.9 4 1 6 25.1 3.0 4 2 8 4 5 3 37N11B-9.8a Argonne National
Lab. 1 6 0 8/17/48 1.8 103.8 60.0 14.5 4 4 4 84.7 3.0 1.9 5 1 0 5 4 8 37N11B-10.7d Freund Estate 1 4 3 12/16/47 9.0 86.5 45.8 8.1 3 6 4 54.3 1.0 4 0 7 435 37N11B-10.7e Freund Estate 182 12/16/47 7.8 104.2 60.8 16.6 4 7 6 66.4 1.0 5 1 4 559 53.0 37N11E-10.5f1 Argonne National
Lab. 3 1 0 11/2/48 29.0 1.9 92.5 47.6 5.7 4 0 4 24.1 4.0 0.7 4 2 5 4 5 1 55.4 37N11B-10.5f2 Argonne National
Lab. 2 8 4 9/16/48 0.2 94.4 45.3 20.0 3 5 6 98.9 4.0 1.9 4 2 5 4 7 1 52.0 37N11E-10.6f Freund Estate 1 5 8 12/16/47 3 .1 92.8 52.3 7.8 4 1 6 45.0 1.0 4 5 0 4 7 4 51.0 37NllB-10.6g Argonne National
Lab. 3 0 0 8/27/48 1.0 98.2 45.3 15.0 3 6 4 92.4 3.0 0 .1 4 3 4 4 7 7 52.0 37N11E-10 Freund Estate 2 0 2 12/16/47 1.0 100.0 58.3 15.2 4 5 6 61.5 2.0 4 9 3 523 49.0 38N9E-13.2c City of Naperville 178 4/18/31 14.0 5.0 97.5 49.3 0.5 3 0 6 127.3 6.0 1.5 4 4 6 5 0 4 38N9B-23.3g. Lawn Meadow
Water Co. 2 1 0 6/14/58 16.1 1.5 0.1 86.9 41.9 1.0 2 8 8 88.0 8.0 0 .1 0 .6 3 9 0 4 5 0 5 0 . 8 38N10E-3.8a Ill. Municipal
Water Co. 2 3 3 12/16/59 15.4 1.1 T r 97.7 47.1 12.0 3 3 6 111.9 8.0 0.3 0.9 4 3 8 4 9 1 38N10E-11.7c Oakview Subdiv. 2 0 0 4/4 /58 16.0 0.3 0 115.6 60.3 12.0 2 8 4 234.5 24.0 0.1 0 .5 537 6 4 6 51.0 38N10B-12.2d Arthur T. McIn
tosh Co. 1 4 3 6/9/47 19.4 0.2 0 .1 97.6 42.2 4 .1 2 8 4 127,5 7.0 0.2 0.5 4 1 8 4 7 1 50.3 38N10E-13.8h Maple Hill Im
provement Assoc. 1 5 8 11/26/60 10.4 7.4 0 101.0 48.0 21.0 2 9 2 147.7 30.0 0 .1 9 .1 4 5 0 5 7 4 51.0 38N10E-15.8hl Benedictine Sisters
of the Sacred Heart 3 0 0 7/29/36 9.0 0.2 0 64.0 29.8 58.4 3 0 0 88.0 12.0 3.4 2 8 3 4 3 3
38N10E-16.4d St. Procopius College 2 4 5 8/9/35 11.0 1.0 0 77.6 40:1 7.6 2 8 4 80.6 5 .0 0.9 3 5 9 4 1 1
38N10E-18.3dl City of Naperville 189.5 6/4/47 17.3 0.2 0 101.2 49.2 4 . 1 2 8 6 160.9 7.0 0.1 0.5 4 5 5 5 1 8 51.5 38N10E-18.3d2 City of Naperville 2 0 2 11/16/37 16.0 T r 0 70.4 45.0 2.3 2 5 2 103.0 3.0 2.8 392 4 0 5 38N11E-1.3al Village of Hinsdale 2 7 1 6/2/47 24.4 1.6 0 136.9 39.7 20.7 3 5 2 181.2 6.0 0.1 3.3 5 0 6 6 3 1 59.0 38N11E-1.3a2 Village of Hinsdale 2 1 0 6/2/47 25.6 T r 0 141.4 41.9 25.1 3 5 6 194.0 8.0 0.2 13.5 5 2 6 6 7 8 52.1 38N11E-6.4c Village of Downers
Grove 3 0 0 1/7/57 13.0 0.8 T r 90.3 35.3 9.0 2 7 2 105.5 7.0 0.2 0 .1 3 7 1 4 2 1 ......
.............
......
........
....
....
....
....
....
....
....
....
....
....
.... ....9.0
..... ..... .....
....
....
....
....
....
....
....
....
....
....
....
0
......
......
......
......
......
......
......
......
......
....
....
.... .... .... .... .... .... .... .... .... ....
....
.... ....
.... ....
Table 20. Chemical Analyses of Water from Wells in the Glacial Drift Aquifer (Chemical constituents in parts per million)
Table 21. Chemical Analyses of Water from Wells in the Silurian Dolomite Aquifer (Chemical constituents in parts per million)
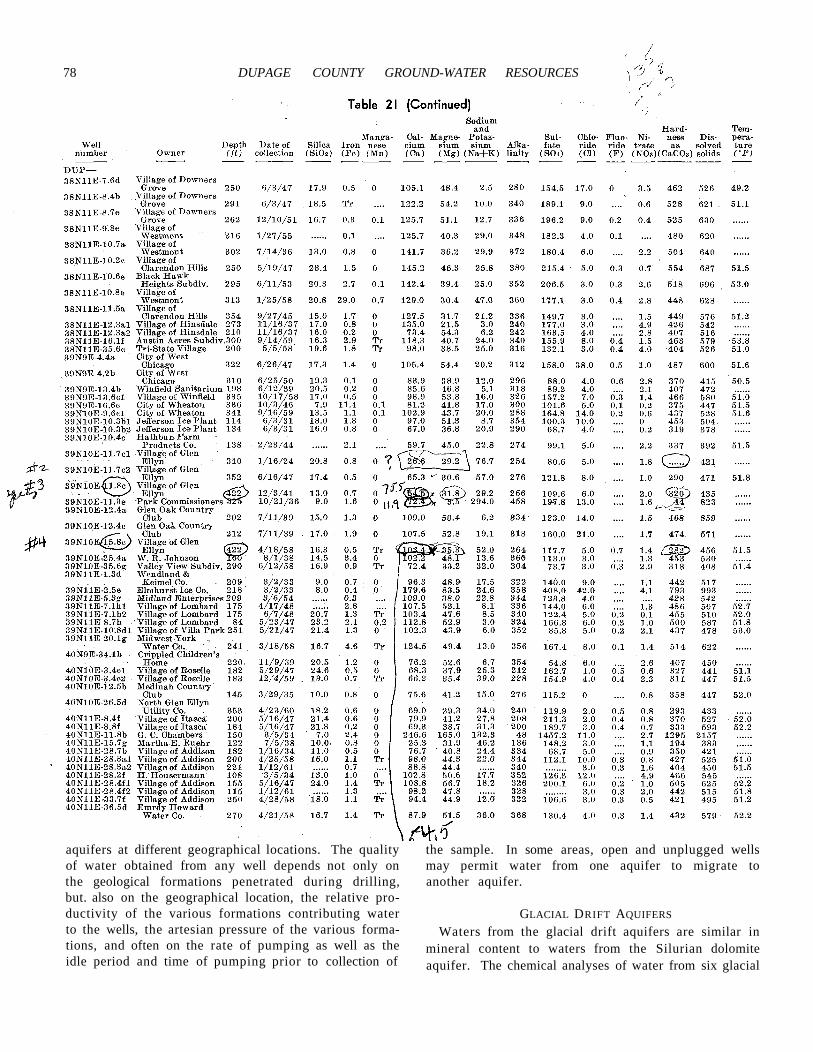
78 DUPAGE COUNTY GROUND-WATER RESOURCES
aquifers at different geographical locations. The quality of water obtained from any well depends not only on the geological formations penetrated during drilling, but. also on the geographical location, the relative productivity of the various formations contributing water to the wells, the artesian pressure of the various forma-tions, and often on the rate of pumping as well as the idle period and time of pumping prior to collection of
the sample. In some areas, open and unplugged wells may permit water from one aquifer to migrate to another aquifer.
GLACIAL DRIFT AQUIFERS
Waters from the glacial drift aquifers are similar in mineral content to waters from the Silurian dolomite aquifer. The chemical analyses of water from six glacial
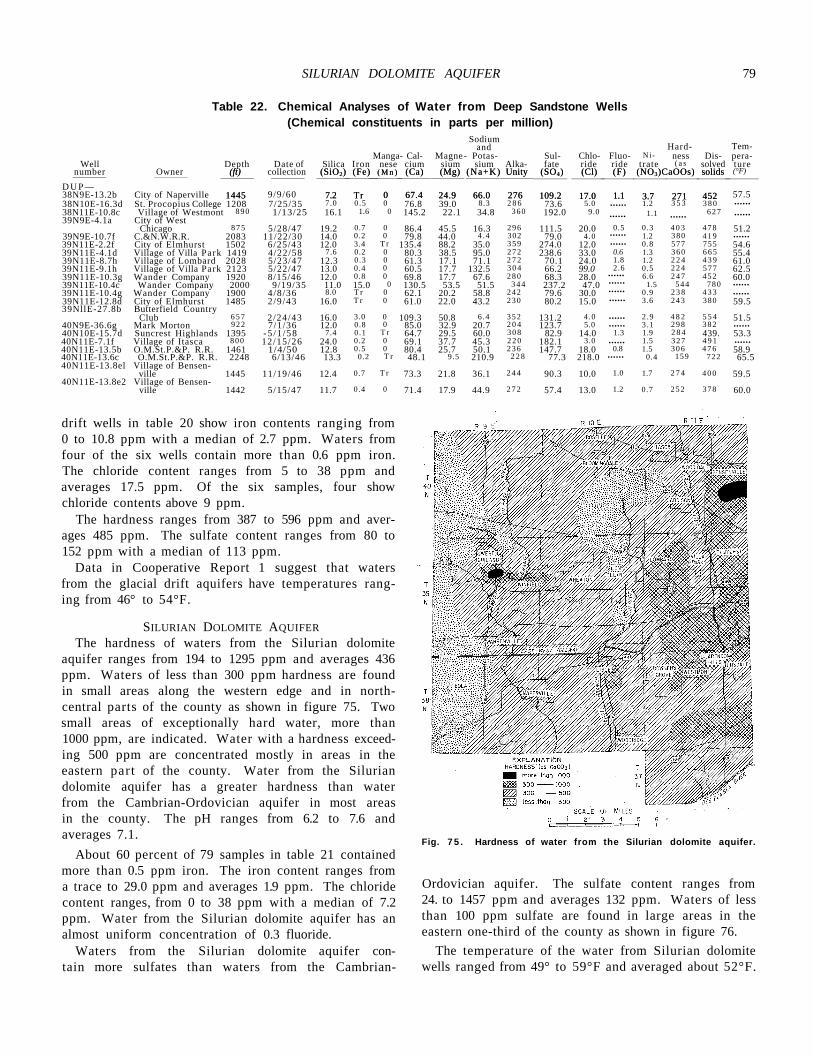
SILURIAN DOLOMITE AQUIFER 79
Table 22. Chemical Analyses of Water from Deep Sandstone Wells (Chemical constituents in parts per million)
Sodium and Hard Tem
Manga- Cal- Magne - Potas Sul Chlo Fluo Ni ness Dis peraWell Depth Date of Silica Iron nese cium sium sium Alka- fate ride ride trate ( a s solved ture
number Owner (ft)
1445
collection (SiO2)
7.2
(Fe)
Tr
( M n ) (Ca)
0 67.4
(Mg)
24.9
(Na+K) Unity
66.0 276
(SO4)
109.2
(Cl)
17.0
(F)
1.1
(NO3)CaOOs)
3.7 271
solids
452
(°F)
D U P — 38N9E-13.2b City of Naperville
(ft)
1445 9/9/60
(SiO2)
7.2
(Fe)
Tr
( M n ) (Ca)
0 67.4
(Mg)
24.9
(Na+K) Unity
66.0 276
(SO4)
109.2
(Cl)
17.0
(F)
1.1
(NO3)CaOOs)
3.7 271
solids
452 57.5 38N10E-16.3d St. Procopius College 1208 7/25/35 7.0 0 .5 0 76.8 39.0 8.3 2 8 6 73.6 5.0 1.2 3 5 3 3 8 0 38N11E-10.8c Village of Westmont 8 9 0 1/13/25 16.1 1.6 0 145.2 22.1 34.8 3 6 0 192.0 9.0 1.1 6 2 7 39N9E-4.1a City of West
Chicago 8 7 5 5/28/47 19.2 0.7 0 86.4 45.5 16.3 2 9 6 111.5 20.0 0.5 0.3 4 0 3 4 7 8 51.2 39N9E-10.7f C.&N.W.R.R. 2083 11/22/30 14.0 0.2 0 79.8 44.0 4 .4 302 79.0 4.0 1.2 3 8 0 4 1 9 39N11E-2.2f City of Elmhurst 1502 6/25/43 12.0 3.4 T r 135.4 88.2 35.0 3 5 9 274.0 12.0 0.8 577 755 54.6 39N11E-4.1d Village of Villa Park 1419 4/22/58 7.6 0.2 0 80.3 38.5 95.0 2 7 2 238.6 33.0 0.6 1.3 3 6 0 6 6 5 55.4 39N11E-8.7h Village of Lombard 2028 5/23/47 12.3 0.3 0 61.3 17.1 71.1 2 7 2 70.1 24.0 1.8 1.2 2 2 4 4 3 9 61.0 39N11E-9.1h Village of Villa Park 2123 5/22/47 13.0 0.4 0 60.5 17.7 132.5 3 0 4 66.2 99.0 2.6 0.5 2 2 4 5 7 7 62.5 39N11E-10.3g Wander Company 1920 8/15/46 12.0 0.8 0 69.8 17.7 67.6 2 8 0 68.3 28.0 6.6 2 4 7 4 5 2 60.0 39N11E-10.4c Wander Company 2000 9/19/35 11.0 15.0 0 130.5 53.5 51.5 3 4 4 237.2 47.0 1.5 5 4 4 7 8 0 39N11E-10.4g Wander Company 1900 4 /8 /36 8.0 T r 0 62.1 20.2 58.8 2 4 2 79.6 30.0 0.9 2 3 8 4 3 3 39N11E-12.8d City of Elmhurst 1485 2 /9 /43 16.0 T r 0 61.0 22.0 43.2 2 3 0 80.2 15.0 3.6 2 4 3 380 59.5 39NllE-27.8b Butterfield Country
Club 6 5 7 2/24/43 16.0 3.0 0 109.3 50.8 6.4 3 5 2 131.2 4.0 2 .9 4 8 2 5 5 4 51.5 40N9E-36.6g Mark Morton 9 2 2 7/1/36 12.0 0.8 0 85.0 32.9 20.7 2 0 4 123.7 5.0 3 .1 2 9 8 3 8 2 40N10E-15.7d Suncrest Highlands 1395 -5 /1 /58 7.4 0.1 T r 64.7 29.5 60.0 3 0 8 82.9 14.0 1.3 1.9 2 8 4 439. 53.3 40N11E-7.1f Village of Itasca 8 0 0 12/15 /26 24.0 0.2 0 69.1 37.7 45.3 2 2 0 182.1 3.0 1.5 3 2 7 4 9 1 40N11E-13.5b O.M.St.P.&P. R.R. 1461 1/4/50 12.8 0.5 0 80.4 25.7 50.1 2 3 6 147.7 18.0 0.8 1.5 3 0 6 4 7 6 58.9 40N11E-13.6c O.M.St.P.&P. R.R. 2248 6/13/46 13.3 0.2 T r 48.1 9.5 210.9 2 2 8 77.3 218.0 0.4 159 722 65.5 40N11E-13.8el Village of Bensen-
ville 1445 11/19/46 12.4 0.7 T r 73.3 21.8 36.1 2 4 4 90.3 10.0 1.0 1.7 2 7 4 4 0 0 59.5 40N11E-13.8e2 Village of Bensen-
ville 1442 5/15/47 11.7 0.4 0 71.4 17.9 44.9 2 7 2 57.4 13.0 1.2 0.7 2 5 2 378 60.0
drift wells in table 20 show iron contents ranging from 0 to 10.8 ppm with a median of 2.7 ppm. Waters from four of the six wells contain more than 0.6 ppm iron. The chloride content ranges from 5 to 38 ppm and averages 17.5 ppm. Of the six samples, four show chloride contents above 9 ppm.
The hardness ranges from 387 to 596 ppm and averages 485 ppm. The sulfate content ranges from 80 to 152 ppm with a median of 113 ppm.
Data in Cooperative Report 1 suggest that waters from the glacial drift aquifers have temperatures ranging from 46° to 54°F.
SILURIAN DOLOMITE AQUIFER The hardness of waters from the Silurian dolomite
aquifer ranges from 194 to 1295 ppm and averages 436 ppm. Waters of less than 300 ppm hardness are found in small areas along the western edge and in north-central parts of the county as shown in figure 75. Two small areas of exceptionally hard water, more than 1000 ppm, are indicated. Water with a hardness exceeding 500 ppm are concentrated mostly in areas in the eastern part of the county. Water from the Silurian dolomite aquifer has a greater hardness than water from the Cambrian-Ordovician aquifer in most areas in the county. The pH ranges from 6.2 to 7.6 and averages 7.1.
About 60 percent of 79 samples in table 21 contained more than 0.5 ppm iron. The iron content ranges from a trace to 29.0 ppm and averages 1.9 ppm. The chloride content ranges, from 0 to 38 ppm with a median of 7.2 ppm. Water from the Silurian dolomite aquifer has an almost uniform concentration of 0.3 fluoride.
Waters from the Silurian dolomite aquifer contain more sulfates than waters from the Cambrian-
Fig. 7 5 . Hardness of water from the Silurian dolomite aquifer.
Ordovician aquifer. The sulfate content ranges from 24. to 1457 ppm and averages 132 ppm. Waters of less than 100 ppm sulfate are found in large areas in the eastern one-third of the county as shown in figure 76.
The temperature of the water from Silurian dolomite wells ranged from 49° to 59°F and averaged about 52°F.
...... ...... ......
......
......
......
......
......
......
......
...... ......
...... ...... ...... ...... ...... ...... ...... ......
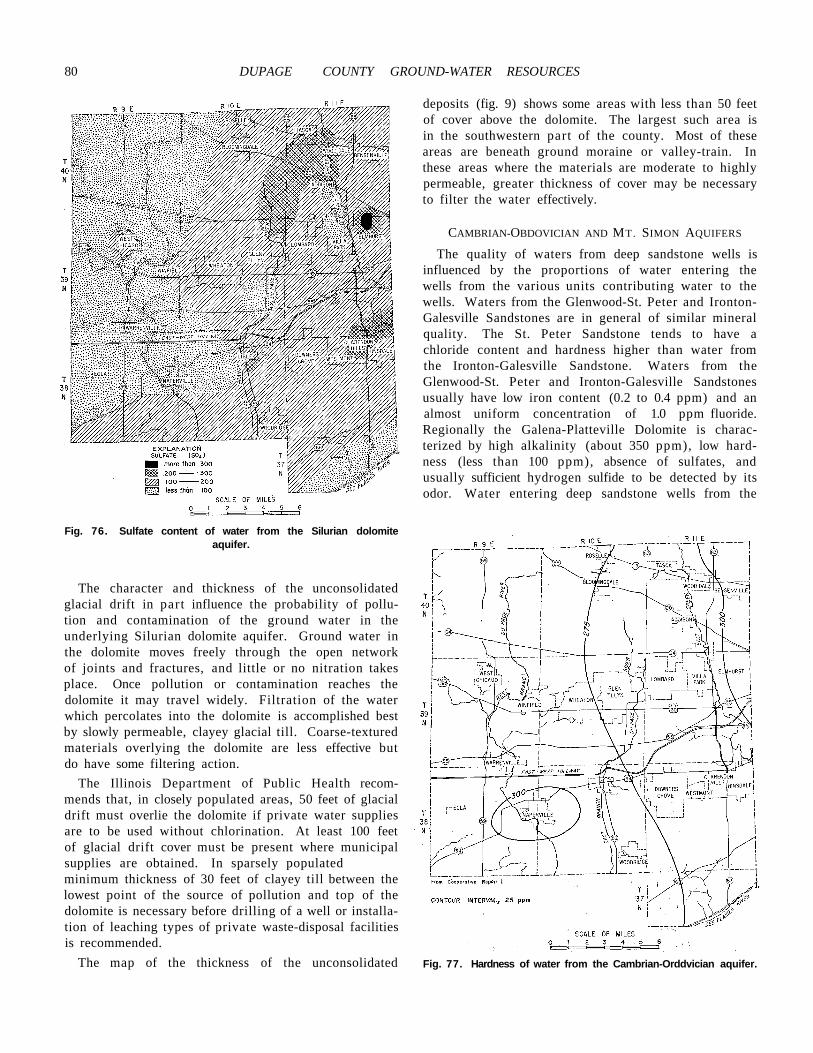
80 DUPAGE COUNTY GROUND-WATER RESOURCES
Fig. 76. Sulfate content of water from the Silurian dolomite aquifer.
The character and thickness of the unconsolidated glacial drift in part influence the probability of pollution and contamination of the ground water in the underlying Silurian dolomite aquifer. Ground water in the dolomite moves freely through the open network of joints and fractures, and little or no nitration takes place. Once pollution or contamination reaches the dolomite it may travel widely. Filtration of the water which percolates into the dolomite is accomplished best by slowly permeable, clayey glacial till. Coarse-textured materials overlying the dolomite are less effective but do have some filtering action.
The Illinois Department of Public Health recommends that, in closely populated areas, 50 feet of glacial drift must overlie the dolomite if private water supplies are to be used without chlorination. At least 100 feet of glacial drift cover must be present where municipal supplies are obtained. In sparsely populated minimum thickness of 30 feet of clayey till between the lowest point of the source of pollution and top of the dolomite is necessary before drilling of a well or installation of leaching types of private waste-disposal facilities is recommended.
The map of the thickness of the unconsolidated
deposits (fig. 9) shows some areas with less than 50 feet of cover above the dolomite. The largest such area is in the southwestern part of the county. Most of these areas are beneath ground moraine or valley-train. In these areas where the materials are moderate to highly permeable, greater thickness of cover may be necessary to filter the water effectively.
CAMBRIAN-OBDOVICIAN AND MT. SIMON AQUIFERS
The quality of waters from deep sandstone wells is influenced by the proportions of water entering the wells from the various units contributing water to the wells. Waters from the Glenwood-St. Peter and Ironton-Galesville Sandstones are in general of similar mineral quality. The St. Peter Sandstone tends to have a chloride content and hardness higher than water from the Ironton-Galesville Sandstone. Waters from the Glenwood-St. Peter and Ironton-Galesville Sandstones usually have low iron content (0.2 to 0.4 ppm) and an almost uniform concentration of 1.0 ppm fluoride. Regionally the Galena-Platteville Dolomite is characterized by high alkalinity (about 350 ppm), low hardness (less than 100 ppm), absence of sulfates, and usually sufficient hydrogen sulfide to be detected by its odor. Water entering deep sandstone wells from the
Fig. 77. Hardness of water from the Cambrian-Orddvician aquifer.
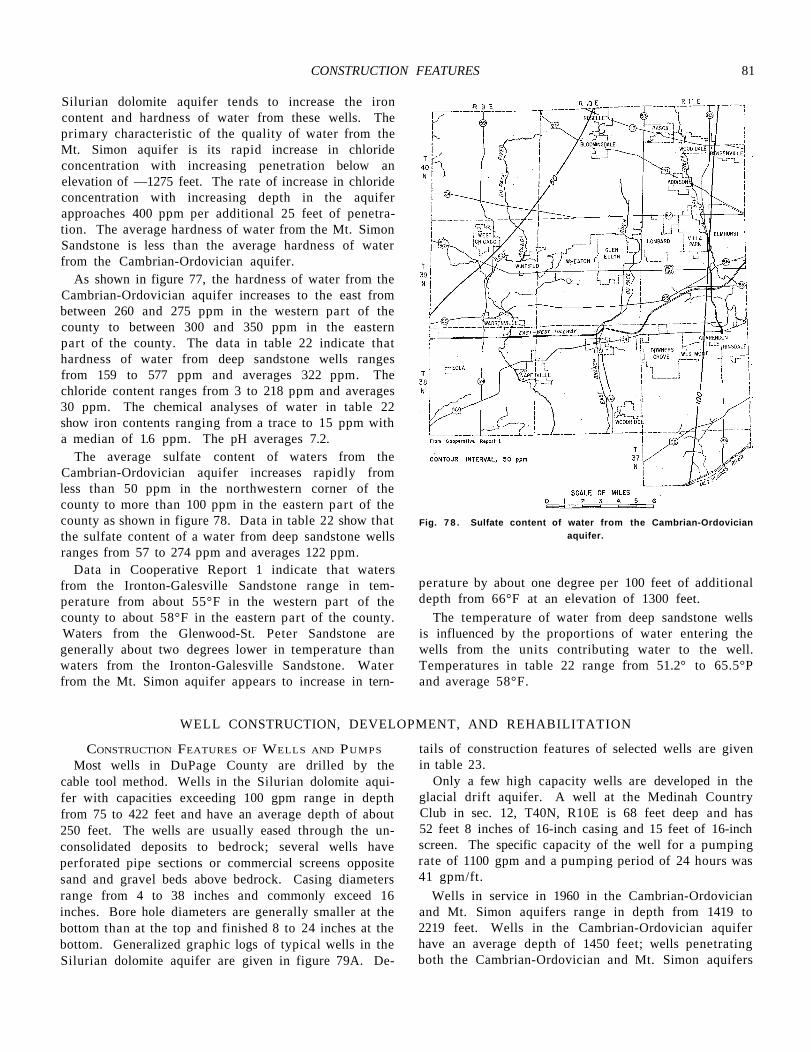
CONSTRUCTION FEATURES 81
Silurian dolomite aquifer tends to increase the iron content and hardness of water from these wells. The primary characteristic of the quality of water from the Mt. Simon aquifer is its rapid increase in chloride concentration with increasing penetration below an elevation of —1275 feet. The rate of increase in chloride concentration with increasing depth in the aquifer approaches 400 ppm per additional 25 feet of penetration. The average hardness of water from the Mt. Simon Sandstone is less than the average hardness of water from the Cambrian-Ordovician aquifer.
As shown in figure 77, the hardness of water from the Cambrian-Ordovician aquifer increases to the east from between 260 and 275 ppm in the western part of the county to between 300 and 350 ppm in the eastern part of the county. The data in table 22 indicate that hardness of water from deep sandstone wells ranges from 159 to 577 ppm and averages 322 ppm. The chloride content ranges from 3 to 218 ppm and averages 30 ppm. The chemical analyses of water in table 22 show iron contents ranging from a trace to 15 ppm with a median of 1.6 ppm. The pH averages 7.2.
The average sulfate content of waters from the Cambrian-Ordovician aquifer increases rapidly from less than 50 ppm in the northwestern corner of the county to more than 100 ppm in the eastern part of the county as shown in figure 78. Data in table 22 show that the sulfate content of a water from deep sandstone wells ranges from 57 to 274 ppm and averages 122 ppm.
Data in Cooperative Report 1 indicate that waters from the Ironton-Galesville Sandstone range in temperature from about 55°F in the western part of the county to about 58°F in the eastern part of the county. Waters from the Glenwood-St. Peter Sandstone are generally about two degrees lower in temperature than waters from the Ironton-Galesville Sandstone. Water from the Mt. Simon aquifer appears to increase in tern-
Fig. 7 8 . Sulfate content of water from the Cambrian-Ordovician aquifer.
perature by about one degree per 100 feet of additional depth from 66°F at an elevation of 1300 feet.
The temperature of water from deep sandstone wells is influenced by the proportions of water entering the wells from the units contributing water to the well. Temperatures in table 22 range from 51.2° to 65.5°P and average 58°F.
WELL CONSTRUCTION, DEVELOPMENT, AND REHABILITATION
CONSTRUCTION FEATURES OF WELLS AND PUMPS
Most wells in DuPage County are drilled by the cable tool method. Wells in the Silurian dolomite aquifer with capacities exceeding 100 gpm range in depth from 75 to 422 feet and have an average depth of about 250 feet. The wells are usually eased through the unconsolidated deposits to bedrock; several wells have perforated pipe sections or commercial screens opposite sand and gravel beds above bedrock. Casing diameters range from 4 to 38 inches and commonly exceed 16 inches. Bore hole diameters are generally smaller at the bottom than at the top and finished 8 to 24 inches at the bottom. Generalized graphic logs of typical wells in the Silurian dolomite aquifer are given in figure 79A. De
tails of construction features of selected wells are given in table 23.
Only a few high capacity wells are developed in the glacial drift aquifer. A well at the Medinah Country Club in sec. 12, T40N, R10E is 68 feet deep and has 52 feet 8 inches of 16-inch casing and 15 feet of 16-inch screen. The specific capacity of the well for a pumping rate of 1100 gpm and a pumping period of 24 hours was 41 gpm/ft.
Wells in service in 1960 in the Cambrian-Ordovician and Mt. Simon aquifers range in depth from 1419 to 2219 feet. Wells in the Cambrian-Ordovician aquifer have an average depth of 1450 feet; wells penetrating both the Cambrian-Ordovician and Mt. Simon aquifers
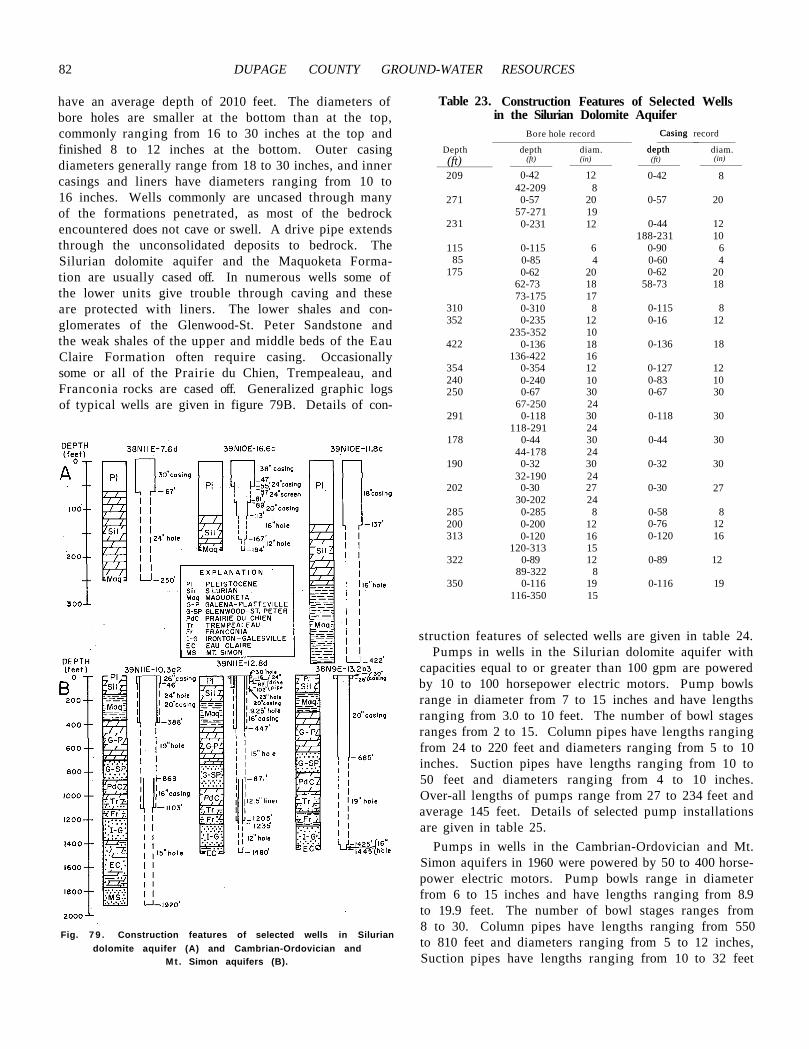
82 DUPAGE COUNTY GROUND-WATER RESOURCES
have an average depth of 2010 feet. The diameters of bore holes are smaller at the bottom than at the top, commonly ranging from 16 to 30 inches at the top and finished 8 to 12 inches at the bottom. Outer casing diameters generally range from 18 to 30 inches, and inner casings and liners have diameters ranging from 10 to 16 inches. Wells commonly are uncased through many of the formations penetrated, as most of the bedrock encountered does not cave or swell. A drive pipe extends through the unconsolidated deposits to bedrock. The Silurian dolomite aquifer and the Maquoketa Formation are usually cased off. In numerous wells some of the lower units give trouble through caving and these are protected with liners. The lower shales and conglomerates of the Glenwood-St. Peter Sandstone and the weak shales of the upper and middle beds of the Eau Claire Formation often require casing. Occasionally some or all of the Prairie du Chien, Trempealeau, and Franconia rocks are cased off. Generalized graphic logs of typical wells are given in figure 79B. Details of con-
Fig. 7 9 . Construction features of selected wells in Silurian dolomite aquifer (A) and Cambrian-Ordovician and
Mt . Simon aquifers (B).
Bore hole record Casing
depth
record
Depth depth diam.
Casing
depth diam. (ft) (ft) (in) (ft) (in)
209 0-42 12 42-209 8
0-42 8
271 0-57 20 57-271 19
0-57 20
231 0-231 12 0-44 12 188-231 10
115 0-115 6 0-90 6 85 0-85 4 0-60 4
175 0-62 20 0-62 20 62-73 18 73-175 17
58-73 18
310 0-310 8 0-115 8 352 0-235 12
235-352 10 0-16 12
422 0-136 18 136-422 16
0-136 18
354 0-354 12 0-127 12 240 0-240 10 0-83 10 250 0-67 30
67-250 24 0-67 30
291 0-118 30 118-291 24
0-118 30
178 0-44 30 44-178 24
0-44 30
190 0-32 30 32-190 24
0-32 30
202 0-30 27 30-202 24
0-30 27
285 0-285 8 0-58 8 200 0-200 12 0-76 12 313 0-120 16
120-313 15 0-120 16
322 0-89 12 89-322 8
0-89 12
350 0-116 19 116-350 15
0-116 19
struction features of selected wells are given in table 24. Pumps in wells in the Silurian dolomite aquifer with
capacities equal to or greater than 100 gpm are powered by 10 to 100 horsepower electric motors. Pump bowls range in diameter from 7 to 15 inches and have lengths ranging from 3.0 to 10 feet. The number of bowl stages ranges from 2 to 15. Column pipes have lengths ranging from 24 to 220 feet and diameters ranging from 5 to 10 inches. Suction pipes have lengths ranging from 10 to 50 feet and diameters ranging from 4 to 10 inches. Over-all lengths of pumps range from 27 to 234 feet and average 145 feet. Details of selected pump installations are given in table 25.
Pumps in wells in the Cambrian-Ordovician and Mt. Simon aquifers in 1960 were powered by 50 to 400 horsepower electric motors. Pump bowls range in diameter from 6 to 15 inches and have lengths ranging from 8.9 to 19.9 feet. The number of bowl stages ranges from 8 to 30. Column pipes have lengths ranging from 550 to 810 feet and diameters ranging from 5 to 12 inches, Suction pipes have lengths ranging from 10 to 32 feet
Table 23. Construction Features of Selected Wells in the Silurian Dolomite Aquifer
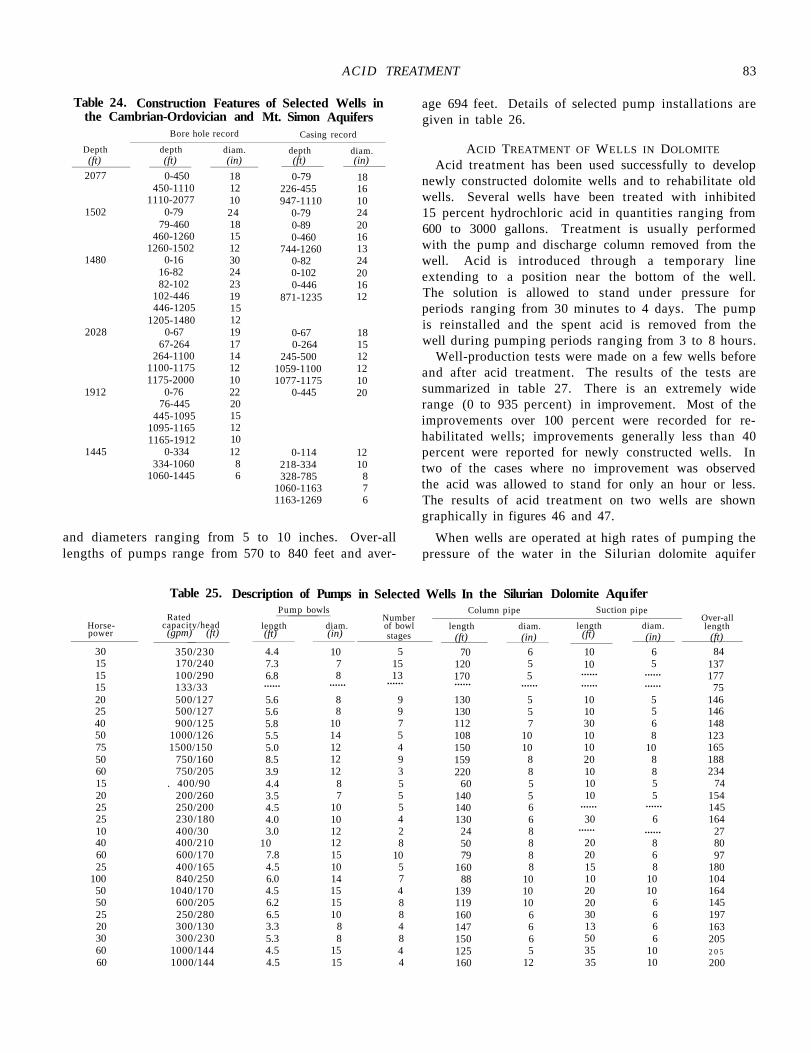
ACID TREATMENT 83
Bore hole record Casing record Depth depth diam. depth diam. (ft) (ft) (in) (ft) (in)
2077 0-450 18 0-79 18 450-1110 12 226-455 16
1110-2077 10 947-1110 10 1502 0-79 24 0-79 24
79-460 18 0-89 20 460-1260 15 0-460 16
1260-1502 12 744-1260 13 1480 0-16 30 0-82 24
16-82 24 0-102 20 82-102 23 0-446 16
102-446 446-1205
1205-1480
19 15 12
871-1235 12
2028 0-67 19 0-67 18 67-264 17 0-264 15
264-1100 14 245-500 12 1100-1175 12 1059-1100 12 1175-2000 10 1077-1175 10
1912 0-76 76-445
445-1095 1095-1165 1165-1912
22 20 15 12 10
0-445 20
1445 0-334 12 0-114 12 334-1060 8 218-334 10
1060-1445 6 328-785 1060-1163 1163-1269
8 7 6
and diameters ranging from 5 to 10 inches. Over-all lengths of pumps range from 570 to 840 feet and aver
age 694 feet. Details of selected pump installations are given in table 26.
ACID TREATMENT OF WELLS IN DOLOMITE Acid treatment has been used successfully to develop
newly constructed dolomite wells and to rehabilitate old wells. Several wells have been treated with inhibited 15 percent hydrochloric acid in quantities ranging from 600 to 3000 gallons. Treatment is usually performed with the pump and discharge column removed from the well. Acid is introduced through a temporary line extending to a position near the bottom of the well. The solution is allowed to stand under pressure for periods ranging from 30 minutes to 4 days. The pump is reinstalled and the spent acid is removed from the well during pumping periods ranging from 3 to 8 hours.
Well-production tests were made on a few wells before and after acid treatment. The results of the tests are summarized in table 27. There is an extremely wide range (0 to 935 percent) in improvement. Most of the improvements over 100 percent were recorded for rehabilitated wells; improvements generally less than 40 percent were reported for newly constructed wells. In two of the cases where no improvement was observed the acid was allowed to stand for only an hour or less. The results of acid treatment on two wells are shown graphically in figures 46 and 47.
When wells are operated at high rates of pumping the pressure of the water in the Silurian dolomite aquifer
Rated capacity/head (gpm) (ft)
Pump bowls
length diam. (ft) (in)
Number of bowl stages
Column pipe Suction pipe Over-all length
(ft) Horsepower
length (ft)
diam. (in)
length (ft)
diam. (in)
30 350/230 4.4 10 5 70 6 10 6 84 15 170/240 7.3 7 15 120 5 10 5 137 15 100/290 6.8 8 13 170 5 177 15 133/33 75 20 500/127 5.6 8 9 130 5 10 5 146 25 500/127 5.6 8 9 130 5 10 5 146 40 900/125 5.8 10 7 112 7 30 6 148 50 1000/126 5.5 14 5 108 10 10 8 123 75 1500/150 5.0 12 4 150 10 10 10 165 50 750/160 8.5 12 9 159 8 20 8 188 60 750/205 3.9 12 3 220 8 10 8 234 15 . 400/90 4.4 8 5 60 5 10 5 74 20 200/260 3.5 7 5 140 5 10 5 154 25 250/200 4.5 10 5 140 6 145 25 230/180 4.0 10 4 130 6 30 6 164 10 400/30 3.0 12 2 24 8 27 40 400/210 10 12 8 50 8 20 8 80 60 600/170 7.8 15 10 79 8 20 6 97 25 400/165 4.5 10 5 160 8 15 8 180
100 840/250 6.0 14 7 88 10 10 10 104 50 1040/170 4.5 15 4 139 10 20 10 164 50 600/205 6.2 15 8 119 10 20 6 145 25 250/280 6.5 10 8 160 6 30 6 197 20 300/130 3.3 8 4 147 6 13 6 163 30 300/230 5.3 8 8 150 6 50 6 205 60 1000/144 4.5 15 4 125 5 35 10 2 0 5 60 1000/144 4.5 15 4 160 12 35 10 200
......
...... ...... ...... ...... ...... ...... ...... ......
......
......
......
......
Table 24. Construction Features of Selected Wells in the Cambrian-Ordovician and Mt. Simon Aquifers
Table 25. Description of Pumps in Selected Wells In the Silurian Dolomite Aqu ifer
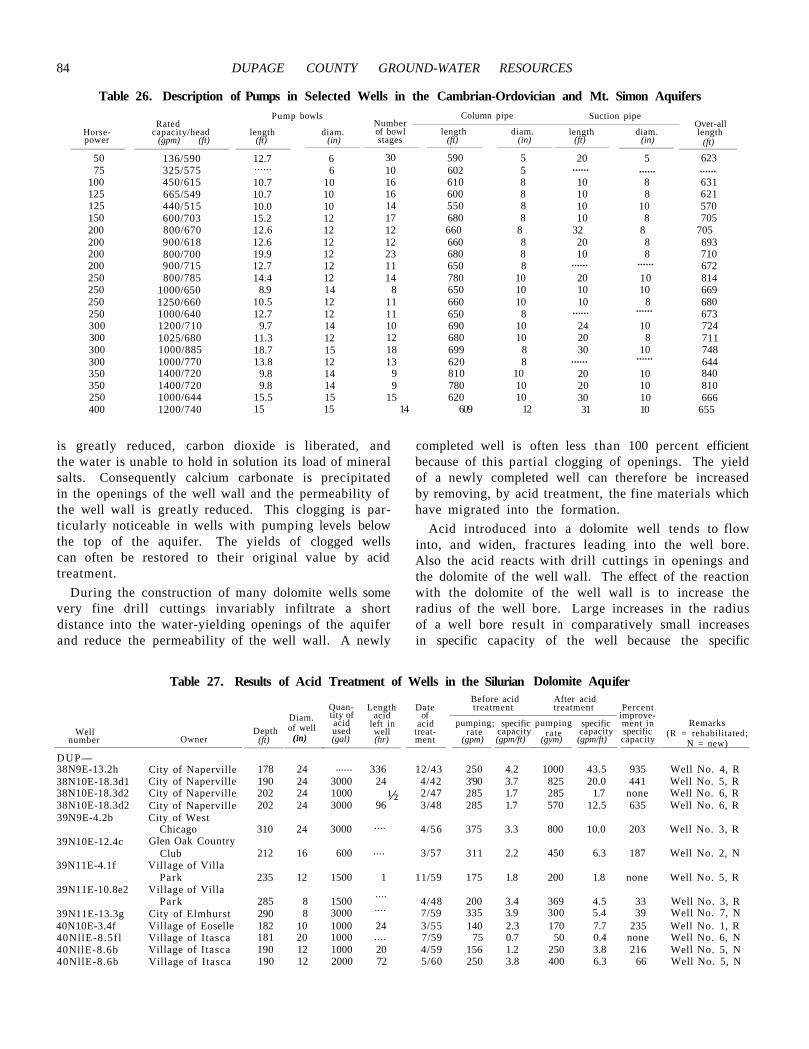
84 DUPAGE COUNTY GROUND-WATER RESOURCES
Rated capacity/head
(gpm) (ft)
Pump bowls
length diam. (ft) (in)
Number of bowl stages
Column pipe Suction pipe Over-all length
(ft) Horsepower
length diam. (ft) (in)
length diam. (ft) (in)
50 136/590 12.7 6 30 590 5 20 5 623 75 325/575 6 10 602 5
100 450/615 10.7 10 16 610 8 10 8 631 125 665/549 10.7 10 16 600 8 10 8 621 125 440/515 10.0 10 14 550 8 10 10 570 150 600/703 15.2 12 17 680 8 10 8 705 200 800/670 12.6 12 12 660 8 32 8 705 200 900/618 12.6 12 12 660 8 20 8 693 200 800/700 19.9 12 23 680 8 10 8 710 200 900/715 12.7 12 11 650 8 672 250 800/785 14.4 12 14 780 10 20 10 814 250 1000/650 8.9 14 8 650 10 10 10 669 250 1250/660 10.5 12 11 660 10 10 8 680 250 1000/640 12.7 12 11 650 8 673 300 1200/710 9.7 14 10 690 10 24 10 724 300 1025/680 11.3 12 12 680 10 20 8 711 300 1000/885 18.7 15 18 699 8 30 10 748 300 1000/770 13.8 12 13 620 8 644 350 1400/720 9.8 14 9 810 10 20 10 840 350 1400/720 9.8 14 9 780 10 20 10 810 250 1000/644 15.5 15 15 620 10 30 10 666 400 1200/740 15 15 14 609 12 31 10 655
is greatly reduced, carbon dioxide is liberated, and the water is unable to hold in solution its load of mineral salts. Consequently calcium carbonate is precipitated in the openings of the well wall and the permeability of the well wall is greatly reduced. This clogging is particularly noticeable in wells with pumping levels below the top of the aquifer. The yields of clogged wells can often be restored to their original value by acid treatment.
During the construction of many dolomite wells some very fine drill cuttings invariably infiltrate a short distance into the water-yielding openings of the aquifer and reduce the permeability of the well wall. A newly
completed well is often less than 100 percent efficient because of this partial clogging of openings. The yield of a newly completed well can therefore be increased by removing, by acid treatment, the fine materials which have migrated into the formation.
Acid introduced into a dolomite well tends to flow into, and widen, fractures leading into the well bore. Also the acid reacts with drill cuttings in openings and the dolomite of the well wall. The effect of the reaction with the dolomite of the well wall is to increase the radius of the well bore. Large increases in the radius of a well bore result in comparatively small increases in specific capacity of the well because the specific
Owner Depth
(ft)
Diam. of well
(in)
Quantity of acid used (gal)
Length acid
left in well (hr)
Date of
acid treatment
Before acid treatment
After acid treatment Percent
improvement in specific capacity
Well number (in)
pumping rate
(gpm)
; specific capacity (gpm/ft)
pumping rate
(gym)
specific capacity (gpm/ft)
Remarks (R = rehabilitated;
N = new) DUP— 38N9E-13.2h City of Naperville 178 24 336 12/43 250 4.2 1000 43.5 935 Well No. 4, R 38N10E-18.3d1 City of Naperville 190 24 3000 24 4/42 3'90 3.7 825 20.0 441 Well No. 5, R 38N10E-18.3d2 City of Naperville 202 24 1000 ½ 2/47 285 1.7 285 1.7 none Well No. 6, R 38N10E-18.3d2 City of Naperville 202 24 3000 96 3/48 285 1.7 570 12.5 635 Well No. 6, R 39N9E-4.2b City of West
Chicago 310 24 3000 4/56 375 3.3 800 10.0 203 Well No. 3, R 39N10E-12.4c Glen Oak Country
Club 212 16 600 3/57 311 2.2 450 6.3 187 Well No. 2, N 39N11E-4.1f Village of Villa
Park 235 12 1500 1 11/59 175 1.8 200 1.8 none Well No. 5, R 39N11E-10.8e2 Village of Villa
Park 285 8 1500 4/48 200 3.4 369 4.5 33 Well No. 3, R 39N11E-13.3g City of Elmhurst 290 8 3000 7/59 335 3.9 300 5.4 39 Well No. 7, N 40N10E-3.4f Village of Eoselle 182 10 1000 24 3/55 140 2.3 170 7.7 235 Well No. 1, R 40NllE-8.5fl Village of Itasca 181 20 1000 7/59 75 0.7 50 0.4 none Well No. 6, N 40NllE-8.6b Village of Itasca 190 12 1000 20 4/59 156 1.2 250 3.8 216 Well No. 5, N 40NllE-8.6b Village of Itasca 190 12 2000 72 5/60 250 3.8 400 6.3 66 Well No. 5, N
...... ...... ......
...... ......
...... ......
...... ......
......
....
....
.... ....
....
......
Table 27. Results of Acid Treatment of Wells in the Silurian Dolomite Aqu ifer
Table 26. Description of Pumps in Selected Wells in the Cambrian-Ordovician and Mt. Simon Aquifers
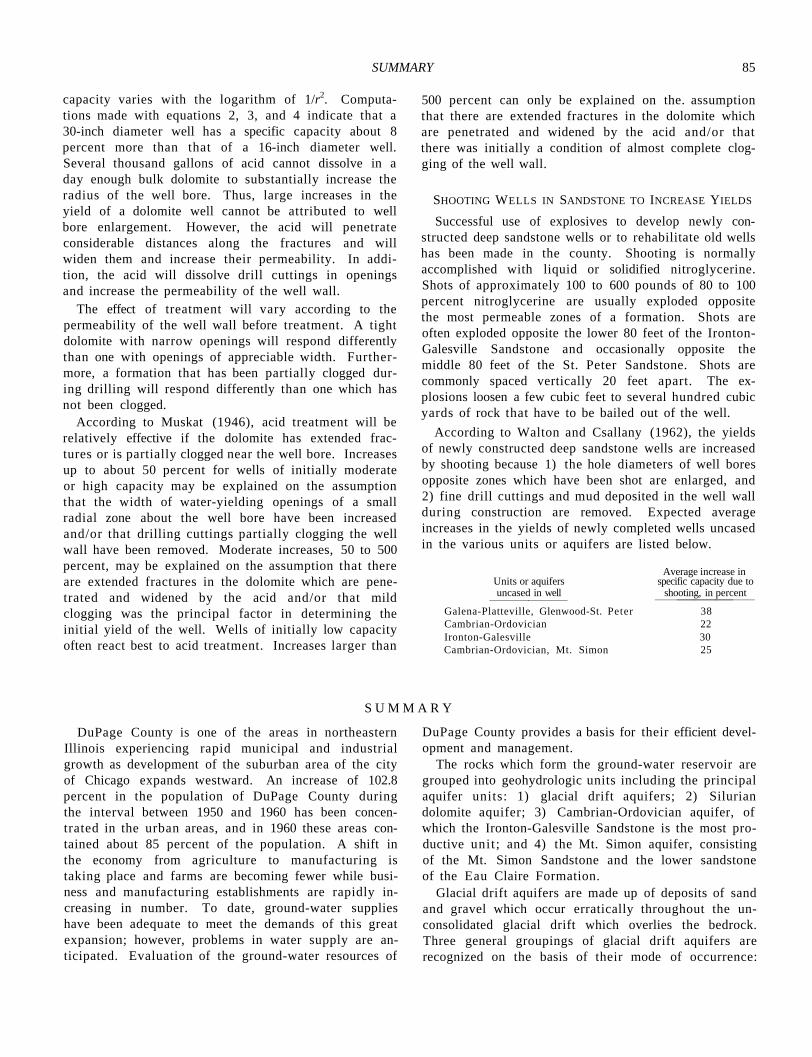
SUMMARY 85
capacity varies with the logarithm of 1/r2. Computations made with equations 2, 3, and 4 indicate that a 30-inch diameter well has a specific capacity about 8 percent more than that of a 16-inch diameter well. Several thousand gallons of acid cannot dissolve in a day enough bulk dolomite to substantially increase the radius of the well bore. Thus, large increases in the yield of a dolomite well cannot be attributed to well bore enlargement. However, the acid will penetrate considerable distances along the fractures and will widen them and increase their permeability. In addition, the acid will dissolve drill cuttings in openings and increase the permeability of the well wall.
The effect of treatment will vary according to the permeability of the well wall before treatment. A tight dolomite with narrow openings will respond differently than one with openings of appreciable width. Furthermore, a formation that has been partially clogged during drilling will respond differently than one which has not been clogged.
According to Muskat (1946), acid treatment will be relatively effective if the dolomite has extended fractures or is partially clogged near the well bore. Increases up to about 50 percent for wells of initially moderate or high capacity may be explained on the assumption that the width of water-yielding openings of a small radial zone about the well bore have been increased and/or that drilling cuttings partially clogging the well wall have been removed. Moderate increases, 50 to 500 percent, may be explained on the assumption that there are extended fractures in the dolomite which are penetrated and widened by the acid and/or that mild clogging was the principal factor in determining the initial yield of the well. Wells of initially low capacity often react best to acid treatment. Increases larger than
500 percent can only be explained on the. assumption that there are extended fractures in the dolomite which are penetrated and widened by the acid and/or that there was initially a condition of almost complete clogging of the well wall.
SHOOTING WELLS IN SANDSTONE TO INCREASE YIELDS
Successful use of explosives to develop newly constructed deep sandstone wells or to rehabilitate old wells has been made in the county. Shooting is normally accomplished with liquid or solidified nitroglycerine. Shots of approximately 100 to 600 pounds of 80 to 100 percent nitroglycerine are usually exploded opposite the most permeable zones of a formation. Shots are often exploded opposite the lower 80 feet of the Ironton-Galesville Sandstone and occasionally opposite the middle 80 feet of the St. Peter Sandstone. Shots are commonly spaced vertically 20 feet apart. The explosions loosen a few cubic feet to several hundred cubic yards of rock that have to be bailed out of the well.
According to Walton and Csallany (1962), the yields of newly constructed deep sandstone wells are increased by shooting because 1) the hole diameters of well bores opposite zones which have been shot are enlarged, and 2) fine drill cuttings and mud deposited in the well wall during construction are removed. Expected average increases in the yields of newly completed wells uncased in the various units or aquifers are listed below.
Average increase in Units or aquifers specific capacity due to uncased in well shooting, in percent
Galena-Platteville, Glenwood-St. Peter 38 Cambrian-Ordovician 22 Ironton-Galesville 30 Cambrian-Ordovician, Mt. Simon 25
S U M M A R Y
DuPage County is one of the areas in northeastern Illinois experiencing rapid municipal and industrial growth as development of the suburban area of the city of Chicago expands westward. An increase of 102.8 percent in the population of DuPage County during the interval between 1950 and 1960 has been concentrated in the urban areas, and in 1960 these areas contained about 85 percent of the population. A shift in the economy from agriculture to manufacturing is taking place and farms are becoming fewer while business and manufacturing establishments are rapidly increasing in number. To date, ground-water supplies have been adequate to meet the demands of this great expansion; however, problems in water supply are anticipated. Evaluation of the ground-water resources of
DuPage County provides a basis for their efficient development and management.
The rocks which form the ground-water reservoir are grouped into geohydrologic units including the principal aquifer units: 1) glacial drift aquifers; 2) Silurian dolomite aquifer; 3) Cambrian-Ordovician aquifer, of which the Ironton-Galesville Sandstone is the most productive unit; and 4) the Mt. Simon aquifer, consisting of the Mt. Simon Sandstone and the lower sandstone of the Eau Claire Formation.
Glacial drift aquifers are made up of deposits of sand and gravel which occur erratically throughout the unconsolidated glacial drift which overlies the bedrock. Three general groupings of glacial drift aquifers are recognized on the basis of their mode of occurrence:
86 DUPAGE COUNTY GROUND-WATER RESOURCES
1) surficial, 2) interbedded, and 3) basal. The surficial glacial drift aquifers occur just below land surface, the interbedded aquifers are separated from the surficial and basal aquifers by deposits of till, and the basal aquifers occur at the base of the drift directly above the dolomite.
The Silurian dolomite aquifer is the most heavily developed source of ground water in the bedrock and is considered in most detail in this report. This aquifer includes rocks of the Niagaran and Alexandrian Series and occurs immediately below the unconsolidated material throughout most of the county. Thickness of the Silurian dolomite aquifer reaches a maximum of about 250 feet. Joints, fractures, and solution cavities influence strongly the occurrence, movement, and availability of ground water in the Silurian dolomite aquifer. The weathered zone with solution-enlarged openings in the upper part of the dolomite directly beneath the bedrock surface is believed to be a major water-yielding zone.
Large ranges in the yields of wells in the Silurian dolomite aquifer suggest that major differences exist in its water-yielding properties. Many aspects of the lithologic, structural, and topographic character of the dolomite influence its capacity to yield water. Statistical analysis establishes significant relationships between specific capacity of wells and 1) thickness of the Silurian dolomite aquifer at the well site, 2) thickness of the Niagaran Series penetrated by the well, and 3) thickness of reef penetrated by the well.
On the basis of a frequency analysis of specific capacities of wells versus deepest stratigraphic unit penetrated by wells, two units of geohydrologic significance are recognized within the Silurian dolomite aquifer: 1) the Niagaran aquifer, and 2) the Alexandrian aquifer. The weathered zone with solution-enlarged openings in the upper part of the dolomite occurs in each of these aquifers where they directly underlie the glacial drift. Locally, the shaly basal beds of the Niagaran Series restrict recharge to the underlying dolomite and are considered as a separate unit (the basal unit of the Niagaran aquifer).
The glacial drift and Silurian dolomite aquifers are connected hydrologically and are separated from the Cambrian-Ordovician aquifer by the shales of the Maquoketa Formation. The relatively impermeable parts of the Eau Claire Formation hydrologically separate the Cambrian-Ordovician aquifer from the underlying Mt. Simon aquifer.
Total pumpage from wells has increased steadily at an accelerating rate since the first wells were drilled in 1890. During the 70-year period, 1890 to 1960, total pumpage from all aquifers increased from 841,000 gpd to 29.3 mgd at an average rate of increase of about 410,000 gpd per year. Of the total water pumped from
wells in 1960, 68 percent was derived from the Silurian dolomite aquifer, 30 percent from the Cambrian-Ordovician and Mt. Simon aquifers, and 2 percent from the glacial drift aquifers.
A comparison of Silurian dolomite aquifer water-level hydrographs and pumpage graphs indicates that in general water-level decline is directly proportional to pumpage and suggests that recharge balances discharge.
Controlled pumping tests were made in two areas in DuPage County to determine the hydraulic properties of the Silurian dolomite aquifer and its confining beds. The average coefficient of storage and the leakage coefficient were calculated to be about 0.0002 and 3.7 × 10⁻³ gpd/cu ft, respectively. The coefficient of transmissibility varies considerably due to the variable thickness of the dolomite aquifer; however, based upon 115 well production tests the regional average coefficient of transmissibility is about 100,000 gpd/ft.
Specific capacity frequency graph analysis for dolomite units penetrated by wells indicates that the Niagaran and Alexandrian Series are more productive than the Maquoketa Formation, and the Niagaran Series is more productive than the Alexandrian Series. The productivity of the Alexandrian Series is the most consistent and that of the Maquoketa Formation is the least consistent.
Data on the response of the Silurian dolomite aquifer to heavy pumping and data on yields of existing production wells indicate that the potential yield of the Silurian dolomite aquifer is limited by recharge. Calculated recharge rates are based upon measured areas of influence and pumpage data. The potential yield of the Silurian dolomite aquifer is estimated to be about 38 mgd based on the recharge rates.
In 1960, nonpumping water levels were not critical in any pumping center and there were areas in the county unaffected by pumping. The practical sustained yield of existing pumping centers exceeded total withdrawals in 1960. The practical sustained yield of the Silurian dolomite aquifer is computed to be about 35 mgd based upon critical water-level and rate of recharge data. Thus, nearly all the potential yield of the Silurian dolomite aquifer can be developed with scattered production wells in existing pumping centers. About 3 mgd is beyond existing pumping centers mostly in areas in the northwestern and southwestern parts of the county.
Extrapolation of pumpage growth curves of pumping centers shows that the practical sustained yields of several pumping centers will probably be exceeded within 2 to 5 years and the practical sustained yields of all pumping centers will be exceeded by 1985. An extrapolation of the pumpage growth curve for the county suggests that the total withdrawals from wells in the
SUMMARY 87
Silurian dolomite aquifer will exceed the potential yield by about 1977.
Pull development of the Silurian dolomite aquifer was assumed in estimating its potential and practical sustained yields, thus the glacial drift may be considered as supplementing the Silurian dolomite aquifer yield.
Hydrographs of the water levels in the glacial drift wells show a pattern of seasonal fluctuation similar to, but affected to a greater degree than, the hydrographs of water levels of wells completed in the Silurian dolomite aquifer. The hydrographs indicate no general or permanent decline in water levels.
The potential yield of the glacial drift aquifers is estimated to be about 3 mgd based upon studies of stream flow data, recharge rates of the Silurian dolomite aquifer, where applicable, and by assuming full development of the Silurian dolomite aquifer and supplemental development of the glacial drift aquifers. In many areas, full development of glacial drift aquifers and supplemental development of the Silurian dolomite aquifer may be advantageous. Thus, it is possible to obtain more water from the glacial drift aquifers than computed and correspondingly less water from the Silurian dolomite aquifer. The potential yield of the glacial drift aquifers (3 mgd) greatly exceeds withdrawal from drift wells (0.52 mgd) in 1960.
During the period 1943 to 1954, seven pumping tests were made in DuPage County to determine the hydraulic properties of the Cambrian-Ordovician aquifer. Coefficients of transmissibility range from 14,700 to 22,000 gpd/ft and average 18,000 gpd/ft. The average coefficient of storage is estimated to be about 0.00035 based on data in Cooperative Report 1.
The general pattern of flow of water in the Cambrian-Ordovician aquifer beneath DuPage County in 1960 was slow movement from northwest to southeast toward the deep cone of depression centered west of Chicago at Summit. The piezometric surface declines from an average elevation of 430 feet in the northwestern corner of the county to an elevation of about 95 feet east of Elmhurst.
Data in Cooperative Report 1 indicate that the aver
age elevation of water levels in deep sandstone wells in DuPage County was about 730 feet in 1864 prior to heavy well development. By 1960, the artesian pressure had dropped in response to withdrawals of w.ater to elevations of about 334 feet at West Chicago and 95 feet at Elmhurst. In a period of 96 years, water levels at Elmhurst declined about 635 feet or at a rate of about 6.6 feet per year. The total decline and average rate of decline in artesian pressure at West Chicago, 1864 to 1960, were 396 feet and 4.1 feet per year, respectively.
Factors affecting the practical sustained yield of the Cambrian-Ordovician aquifer in the Chicago region are discussed in detail in Cooperative Report 1. The practical sustained yield of the Cambrian-Ordovician aquifer in DuPage County was computed to be about 4.3 mgd based on pumpage data.
Based on well construction data and Cooperative Report 1, the practical sustained yield of the Mt. Simon aquifer in DuPage County was computed to be about 2.1 mgd. Total withdrawals from the Cambrian-Ordovician and Mt. Simon aquifers in 1960 (8.8 mgd) exceeded the practical sustained yield of these aquifers (6.4 mgd).
Temperatures in the glacial drift aquifers range from 46° to 54°F. The hardness averages 485 ppm. The temperature of water in the Silurian dolomite aquifer ranges from 49° to 59°P and averages about 52°P. Hardness ranges from 194 to 1295 ppm and averages 436 ppm. Water with hardness exceeding 500 ppm is concentrated mostly in the eastern parts of the county.
The temperature of water from the Cambrian-Ordovician aquifer ranges from about 53° to about 58°F. The hardness ranges from less than 100 ppm to slightly more than 500 ppm.
Water from the Mt. Simon aquifer appears to increase in temperature by about one degree per 100 feet of additional depth below a depth of 2000 feet where the temperature is 66°F. The primary characteristic of the quality of water from the Mt. Simon aquifer is the rapid increase in chloride concentration with depth. At depths below 2000 feet, water from the Mt. Simon aquifer is too highly mineralized for most purposes.
SELECTED REFERENCES ALDEN, W. C., 1902, Chicago folio: U. S. Geol. Survey Folio 81. ANDERSON, C. B., 1919, The artesian waters of northeastern Illi
nois: Illinois Geol. Survey Bull. 34. BERGSTROM, E. E., J. W. FOSTER, L. F. SELKREGG, and W. A.
PRYOR, 1955, Groundwater possibilities in northeastern Illinois: Illinois Geol. Survey Circ. 198.
BRETZ, J HABLEN, 1939, Geology of the Chicago region, Pa r t I— General: Illinois Geol. Survey Bull. 65.
BRETZ, J HARLEN, 1955, Geology of the Chicago region, P a r t I I — The Pleistocene: Illinois Geol. Survey Bull. 65.
BUSCHBACH, T. C., 1959, Stratigraphy of Cambrian and Ordovi-eian formations of northeastern Illinois: Univ. of Illinois unpublished Ph.D. thesis.
COOPER, H. H., J R . , and C. D. JACOB, 1946, A generalization graphical method for evaluating formation constants and summarizing well-field history: Am. Geophys. Union Trans., v. 27.
EKBLAW, G. E., 1938, Kankakee Arch in Illinois: Geol. Soc. Am. Bull., v. 49, p. 1425-1430. (Reprinted as Illinois Geol. Survey Circ. 40).
F ISHER, D. J., 1925, Geology and mineral resources of the Joliet quadrangle: Illinois Geol. Survey Bull. 51.
F ISHER, D. J., 1938, Exhumed Ordovician hill near Joliet: Illinois Acad. Sci. Trans., v. 30.
F R T E , J . C , and H. B. WILLMAN, 1960, Classification of the Wisconsinan Stage in the Lake Michigan glacial lobe: Illinois Geol. Survey Circ. 285.
FRYXELL, F. M., 1927, The physiography of the region of Chicago: Univ. of Chicago Press, Chicago.
HACKETT, J. E., and A. J. ZEIZEL, 1962, Application of vertical variability mapping techniques in hydrogeologie studies in glacial terranes (abs t . ) : Geol. Soc. Am. Spec. Paper 68.
HAMILTON, D. K., 1959, Areas and principles of ground-water occurrence in the Inner Bluegrass region, Kentucky: Kentucky Geol. Survey Bull. 5.
HANTUSH, M. S., and C. D. JACOB, 1955, Nonsteady radial flow in an infinite leaky aquifer: Am. Geophys. Union Trans., v. 36, no. 1.
HANTTJSH, M. S., 1956, Analysis of data from pumping tests in leaky aquifers: Am. Geophys. Union Trans., v. 37, no. 6.
HOHLT, E. B., 1948, The nature and origin of limestone porosity: Colorado School Mines Quart., v. 43, no. 4.
H O P K I N S , C. G., J. G. MOSIER, E. VAN ALSTINE, and F. W. GAR-REH, 1917, DuPage County soils: Univ. of Illinois Agr. Expt. Sta. Soil Kept. no. 16.
HORBERG, LELAND, 1950, Bedrock topography of Illinois: Illinois Geol. Survey Bull. 73.
HORBERG, LELAND, and P . E. POTTER, 1955, Stratigraphie and sedimentologic aspects of the Lemont drift of northeastern Illinois: Illinois Geol. Survey Rept. of Invest. 185.
HOUGH, J. L., 1958, Geology of the Great Lakes: Univ. of Illinois Press, Urbana.
JACOB, C. E., 1937, Drawdown test to determine effective radius of artesian wells: Am. Soc. Civil Eng. Trans., v. 112.
KIMBALL, B. F., 1946, Assignment of frequencies to a completely ordered set of sample da ta : Am. Geophys. Union Trans., v. 27.
KRUMBEIN, W. C, 1933, Textural and lithological variations in glacial t i l l : Jour. Geol., v. 41, p. 382-408.
LAMOREAUX, P . E., and W. J . POWELL, 1960, Stratigraphic and structural guides to the development of water wells and well fields in a limestone terrane: U. S. Geol. Survey unpublished ms.
LEIOHTON, M. M., G. E. EKBLAW, and LELAND HORBERG, 1948, Physiographic divisions of Illinois: Illinois Geol. Survey Eept. of Invest. 129.
LEROUX, E. F., and W. J. DRESCHER, 1959, Statement concerning the probable effects of increased ground-water withdrawals from the Niagara dolomite at Argonne National Laboratory: U. S. Geol. Survey open-file rept.
LINSLEY, E. K., J R . , MAX A. KOHLER, and J. L. PALHUS, 1958, Hydrology for engineers: McGraw-Hill Book Company, Inc., New York.
LOWENSTAM, H. A., circa 1949, Paleontology of the Silurian System in northeastern Illinois: Illinois Geol. Survey unpublished ms.
MEINZER, O. E., 1923, The occurrence of ground water in the United States: U. S. Geol. Survey Water-Supply Paper 489.
MURRAY, E. C, 1960, Origin of porosity in carbonate rocks: Jour. Sed. Petrology, v. 30, no. 2, p. 59-90.
MUSKAT, MORRIS, 1946, The flow of homogeneous fluids through porous media: J. W. Edwards, Inc., Ann Arbor, Mich.
NORRIS, S. E., 1957, Characteristics of limestone and dolomite aquifers in western Ohio: Jour. Am. Water Works Assoc, v. 49, no. 4.
SASMAN, R. T., T. A. PRICKETT, and E. E. EUSSELL, 1961, Water-level decline and pumpage during 1960 in deep wells in the Chicago region, Illinois: Illinois Water Survey Circ. 83.
SCHICHT, E. J., and W. C. WALTON, 1961, Hydrologie budgets for three small watersheds in Illinois: Illinois Water Survey Eept. of Invest. 40.
SNEDECOR, G. W., 1950, Statistical methods: Iowa State College Press, Ames, Iowa, 4th ed.
State of Illinois, Dept. of Eegistration and Education, Div. of Industrial Planning and Education, 1958, Water resources and climate: Atlas of Illinois Eesources, sec. 1.
SUTER, MAX, E. E. BERGSTROM, H. F. SMITH, G. H. EMRICH, W. C. WALTON, and T. E. LARSON, 1959, Preliminary report on ground-water resources of the Chicago region, Illinois: Illinois Geol. Survey and Illinois Water Survey Cooperative Ground-Water Eept. 1.
SWINNERTON, A. C, 1942, Hydrology of limestone terranes, in Hydrology: Dover Publication Inc., New York, p. 656.
TROWBRIDGE, A. C, 1912, Geology and geography of the Wheaton quadrangle: Illinois Geol. Survey Bull. 19.
U. S. Bureau of the Census, 1950, U. S. Dept. of Commerce, Washington, D. C.
U. S. Bureau of the Census, 1952, U. S. census of agriculture, 1950: v. 1, Counties and state economic areas, par t 5— Illinois: U. S. Govt. Print ing Office, Washington, D. C., 340 p.
U. S. Bureau of the Census, 1957, U. S. census of manufacturers, 1954: State Bull. MC-112–Illinois, U. S. Govt. Print ing Office, Washington, D. C, 24 p.
U. S. Bureau of the Census, 1961, U. S. census of agriculture, 1959: v. 1, Counties and state economic areas, part 12— Illinois: U. S. Govt. Print ing Office, Washington, D. C, 255 p.
U. S. Bureau of the Census, 1961, U. S. census of manufacturers, 1958: State Bull. MC 58(3)-12, Illinois, U. S. Govt. Print ing Office, Washington, D. C, 31 p.
WALKER, W. H., and W. C. WALTON, 1961, Ground-water development in three areas of central Illinois: Illinois Water Survey Eept. of Invest. 41.
WALTON, W. C, 1960, Leaky artesian aquifer conditions in Illinois: Illinois Water Survey Eept. of Invest. 39.
WALTON, W. C , and SANDOR CSALLANY, 1962, Yields of deep sandstone wells in northern Illinois: Illinois Water Survey Eept. of Invest. 43.
[ 8 8 ]

SELECTED REFERENCES 89
WASCHER, H. L., J. B. FEHRENBACHER, E. T. ODELL, P. E. VEALE, 1950, Illinois soil type description: Illinois Agr. Expt. Sta. Pub. AG-1443.
WASCHEE, H. L., and E. T. ODELL, 1951, Soils of Cook County: Univ. of Illinois Agr. Expt. Sta., Dept. of Agronomy.
WASCHER, H. L., J. D. ALEXANDER, B. W. BAY, A. H. BEAVERS, and E. T. ODELL, 1960, Charactristics of soils associated with glacial tills in northeastern Illinois: Univ. of Illinois Agr. Expt. Sta. Bull. 665.
WILLMAN, H. B., L. E. WORKMAN, H. A. LOWENSTAM, Silurian
System in northeastern Illinois: Illinois Geol. Survey unpublished ms.
WILLMAN, H. B., and J. N. PAYNE, 1942, Geology and mineral resources of the Marseilles, Ottawa, and Streator quadrangles: Illinois Geol. Survey Bull. 66.
WORKMAN, L. E., 1949, Subsurface Silurian and Devonian strata in the Chicago region: Illinois Geol. Survey unpublished ms.
ZEIZEL, A. J., 1960, Ground-water geology of the shallow aquifers in DuPage County, Illinois: Univ. of Illinois unpublished Ph.D. thesis.
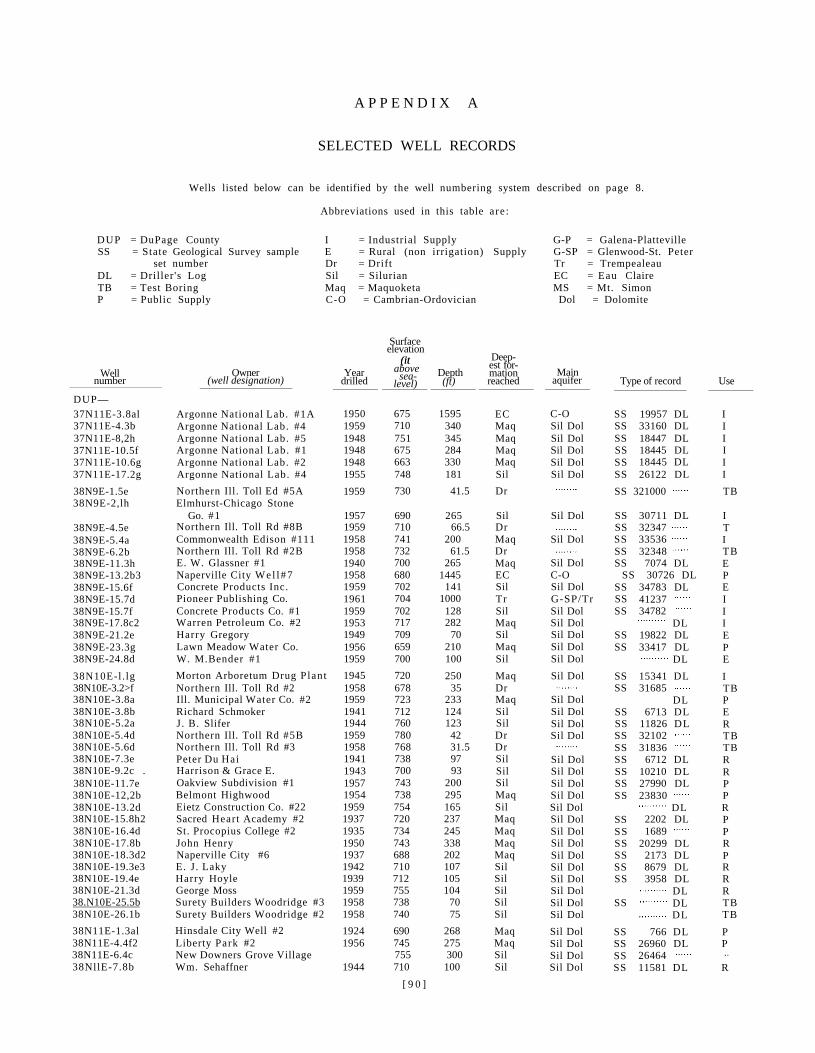
A P P E N D I X A
SELECTED WELL RECORDS
Wells listed below can be identified by the well numbering system described on page 8.
Abbreviations used in this table are :
DUP = DuPage County I = Industrial Supply G-P = Galena-Platteville SS = State Geological Survey sample E = Rural (non irrigation) Supply G-SP = Glenwood-St. Peter
set number Dr = Drift Tr = Trempealeau DL = Driller 's Log Sil = Silurian EC = Eau Claire TB = Test Boring Maq = Maquoketa MS = Mt. Simon P = Public Supply C-O = Cambrian-Ordovician Dol = Dolomite
Well number
Owner (well designation)
Argonne National Lab. #1A
Year drilled
Surface elevation
(it above
sea-level)
675
Depth (ft)
1595
Deepest formation reached
Main aquifer
C-O
Type of record
SS 19957 DL
Use
DUP— 37N11E-3.8al 1950
(it
EC I 37N11E-4.3b Argonne National Lab. #4 1959 710 340 Maq Sil Dol SS 33160 DL I 37N11E-8,2h Argonne National Lab. #5 1948 751 345 Maq Sil Dol SS 18447 DL I 37N11E-10.5f Argonne National Lab. #1 1948 675 284 Maq Sil Dol SS 18445 DL I 37N11E-10.6g Argonne National Lab. #2 1948 663 330 Maq Sil Dol SS 18445 DL I 37N11E-17.2g Argonne National Lab. #4 1955 748 181 Sil Sil Dol SS 26122 DL I 38N9E-1.5e Northern Ill. Toll Ed #5A 1959 730 41.5 Dr SS 321000 TB 38N9E-2,lh Elmhurst-Chicago Stone
Go. #1 1957 690 265 Sil Sil Dol SS 30711 DL I 38N9E-4.5e Northern Ill. Toll Rd #8B 1959 710 66.5 Dr SS 32347 T 38N9E-5.4a Commonwealth Edison #111 1958 741 200 Maq Sil Dol SS 33536 I 38N9E-6.2b Northern Ill. Toll Rd #2B 1958 732 61.5 Dr SS 32348 TB 38N9E-11.3h E. W. Glassner #1 1940 700 265 Maq Sil Dol SS 7074 DL E 38N9E-13.2b3 Naperville City Wel l#7 1958 680 1445 EC C-O SS 30726 DL P 38N9E-15.6f Concrete Products Inc. 1959 702 141 Sil Sil Dol SS 34783 DL E 38N9E-15.7d Pioneer Publishing Co. 1961 704 1000 Tr G-SP/Tr SS 41237 I 38N9E-15.7f Concrete Products Co. #1 1959 702 128 Sil Sil Dol SS 34782 I 38N9E-17.8c2 Warren Petroleum Co. #2 1953 717 282 Maq Sil Dol DL I 38N9E-21.2e Harry Gregory 1949 709 70 Sil Sil Dol SS 19822 DL E 38N9E-23.3g Lawn Meadow Water Co. 1956 659 210 Maq Sil Dol SS 33417 DL P 38N9E-24.8d W. M.Bender #1 1959 700 100 Sil Sil Dol DL E 38N10E-l. lg Morton Arboretum Drug Plant 1945 720 250 Maq Sil Dol SS 15341 DL I 38N10E-3.2>f Northern Ill. Toll Rd #2 1958 678 35 Dr SS 31685 TB 38N10E-3.8a Ill. Municipal Water Co. #2 1959 723 233 Maq Sil Dol DL P 38N10E-3.8b Richard Schmoker 1941 712 124 Sil Sil Dol SS 6713 DL E 38N10E-5.2a J. B. Slifer 1944 760 123 Sil Sil Dol SS 11826 DL R 38N10E-5.4d Northern Ill. Toll Rd #5B 1959 780 42 Dr Sil Dol SS 32102 TB 38N10E-5.6d Northern Ill. Toll Rd #3 1958 768 31.5 Dr SS 31836 TB 38N10E-7.3e Peter Du Hai 1941 738 97 Sil Sil Dol SS 6712 DL R 38N10E-9.2c . Harrison & Grace E. 1943 700 93 Sil Sil Dol SS 10210 DL R 38N10E-11.7e Oakview Subdivision #1 1957 743 200 Sil Sil Dol SS 27990 DL P 38N10E-12,2b Belmont Highwood 1954 738 295 Maq Sil Dol SS 23830 P 38N10E-13.2d Eietz Construction Co. #22 1959 754 165 Sil Sil Dol DL R 38N10E-15.8h2 Sacred Heart Academy #2 1937 720 237 Maq Sil Dol SS 2202 DL P 38N10E-16.4d St. Procopius College #2 1935 734 245 Maq Sil Dol SS 1689 P 38N10E-17.8b John Henry 1950 743 338 Maq Sil Dol SS 20299 DL R 38N10E-18.3d2 Naperville City #6 1937 688 202 Maq Sil Dol SS 2173 DL P 38N10E-19.3e3 E. J. Laky 1942 710 107 Sil Sil Dol SS 8679 DL R 38N10E-19.4e Harry Hoyle 1939 712 105 Sil Sil Dol SS 3958 DL R 38N10E-21.3d George Moss 1959 755 104 Sil Sil Dol DL R 38.N10E-25.5b Surety Builders Woodridge #3 1958 738 70 Sil Sil Dol SS DL TB 38N10E-26.1b Surety Builders Woodridge #2 1958 740 75 Sil Sil Dol DL TB 38N11E-1.3al Hinsdale City Well #2 1924 690 268 Maq Sil Dol SS 766 DL P 38N11E-4.4f2 Liberty Park #2 1956 745 275 Maq Sil Dol SS 26960 DL P 38N11E-6.4c New Downers Grove Village 755 300 Sil Sil Dol SS 26464 38NllE-7.8b Wm. Sehaffner 1944 710
[ 9 0 ] 100 Sil Sil Dol SS 11581 DL R
......
......
......
......
......
...... ......
......
......
...... ......
......
......
...... ......
......
......
......
......
......
...... ..
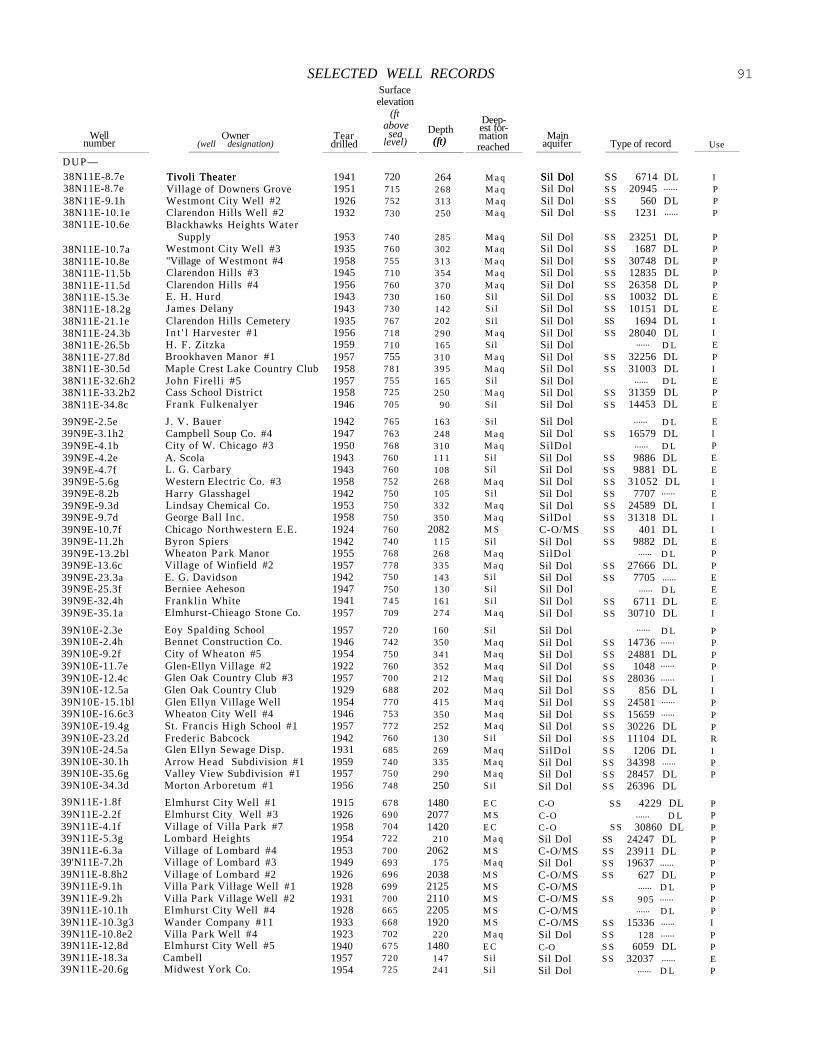
SELECTED WELL RECORDS 91
Well number
Owner (well designation)
Tivoli Theater
Tear drilled
Surface elevation
(ft above sea
level)
720
Depth (ft)
264
Deepest formation reached
Main aquifer
Sil Dol
Type of record
SS 6714 DL
Use
DUP— 38N11E-8.7e Tivoli Theater 1941
(ft)
M a q Sil Dol I 38N11E-8.7e Village of Downers Grove 1951 715 268 M a q Sil Dol S S 20945 P 38N11E-9.1h Westmont City Well #2 1926 752 313 M a q Sil Dol S S 560 DL P 38N11E-10.1e Clarendon Hills Well #2 1932 730 250 M a q Sil Dol S S 1231 P 38N11E-10.6e Blackhawks Heights Water
Supply 1953 740 285 M a q Sil Dol S S 23251 DL P 38N11E-10.7a Westmont City Well #3 1935 760 302 M a q Sil Dol S S 1687 DL P 38N11E-10.8e "Village of Westmont #4 1958 755 313 M a q Sil Dol S S 30748 DL P 38N11E-11.5b Clarendon Hills #3 1945 710 354 M a q Sil Dol S S 12835 DL P 38N11E-11.5d Clarendon Hills #4 1956 760 370 M a q Sil Dol S S 26358 DL P 38N11E-15.3e E. H. Hurd 1943 730 160 Si l Sil Dol S S 10032 DL E 38N11E-18.2g James Delany 1943 730 142 S i l Sil Dol S S 10151 DL E 38N11E-21.1e Clarendon Hills Cemetery 1935 767 202 Si l Sil Dol SS 1694 DL I 38N11E-24.3b I n t ' l Harvester #1 1956 718 290 M a q Sil Dol S S 28040 DL I 38N11E-26.5b H. F. Zitzka 1959 710 165 Sil Sil Dol D L E 38N11E-27.8d Brookhaven Manor #1 1957 755 310 M a q Sil Dol S S 32256 DL P 38N11E-30.5d Maple Crest Lake Country Club 1958 781 395 M a q Sil Dol S S 31003 DL I 38N11E-32.6h2 John Firelli #5 1957 755 165 Sil Sil Dol D L E 38N11E-33.2b2 Cass School District 1958 725 250 M a q Sil Dol S S 31359 DL P 38N11E-34.8c Frank Fulkenalyer 1946 705 90 Si l Sil Dol S S 14453 DL E
39N9E-2.5e J . V. Bauer 1942 765 163 Sil Sil Dol D L E 39N9E-3.1h2 Campbell Soup Co. #4 1947 763 248 M a q Sil Dol S S 16579 DL I 39N9E-4.1b City of W. Chicago #3 1950 768 310 M a q SilDol D L P 39N9E-4.2e A. Scola 1943 760 111 Si l Sil Dol S S 9886 DL E 39N9E-4.7f L. G. Carbary 1943 760 108 Sil Sil Dol S S 9881 DL E 39N9E-5.6g Western Electric Co. #3 1958 752 268 M a q Sil Dol S S 31052 DL I 39N9E-8.2b Harry Glasshagel 1942 750 105 Si l Sil Dol S S 7707 E 39N9E-9.3d Lindsay Chemical Co. 1953 750 332 M a q Sil Dol S S 24589 DL I 39N9E-9.7d George Ball Inc. 1958 750 350 M a q SilDol S S 31318 DL I 39N9E-10.7f Chicago Northwestern E.E. 1924 760 2082 M S C-O/MS S S 401 DL I 39N9E-11.2h Byron Spiers 1942 740 115 Sil Sil Dol S S 9882 DL E 39N9E-13.2bl Wheaton Park Manor 1955 768 268 M a q SilDol D L P 39N9E-13.6c Village of Winfield #2 1957 778 335 M a q Sil Dol S S 27666 DL P 39N9E-23.3a E. G. Davidson 1942 750 143 Si l Sil Dol S S 7705 E 39N9E-25.3f Berniee Aeheson 1947 750 130 Si l Sil Dol D L E 39N9E-32.4h Franklin White 1941 745 161 S i l Sil Dol S S 6711 DL E 39N9E-35.1a Elmhurst-Chieago Stone Co. 1957 709 274 M a q Sil Dol S S 30710 DL I
39N10E-2.3e Eoy Spalding School 1957 720 160 Sil Sil Dol D L P 39N10E-2.4h Bennet Construction Co. 1946 742 350 M a q Sil Dol S S 14736 P 39N10E-9.2f City of Wheaton #5 1954 750 341 M a q Sil Dol S S 24881 DL P 39N10E-11.7e Glen-Ellyn Village #2 1922 760 352 M a q Sil Dol S S 1048 P 39N10E-12.4c Glen Oak Country Club #3 1957 700 212 M a q Sil Dol S S 28036 I 39N10E-12.5a Glen Oak Country Club 1929 688 202 M a q Sil Dol S S 856 DL I 39N10E-15.1bl Glen Ellyn Village Well 1954 770 415 M a q Sil Dol S S 24581 P 39N10E-16.6c3 Wheaton City Well #4 1946 753 350 M a q Sil Dol S S 15659 P 39N10E-19.4g St. Francis High School #1 1957 772 252 M a q Sil Dol S S 30226 DL P 39N10E-23.2d Frederic Babcock 1942 760 130 S i l Sil Dol S S 11104 DL R 39N10E-24.5a Glen Ellyn Sewage Disp. 1931 685 269 M a q SilDol S S 1206 DL I 39N10E-30.1h Arrow Head Subdivision #1 1959 740 335 M a q Sil Dol S S 34398 P 39N10E-35.6g Valley View Subdivision #1 1957 750 290 M a q Sil Dol S S 28457 DL P 39N10E-34.3d Morton Arboretum #1 1956 748 250 Si l Sil Dol S S 26396 DL 39N11E-1.8f Elmhurst City Well #1 1915 678 1480 E C C-O S S 4229 DL P 39N11E-2.2f Elmhurst City Well #3 1926 690 2077 M S C-O D L P 39N11E-4.1f Village of Villa Park #7 1958 704 1420 E C C-O S S 30860 DL P 39N11E-5.3g Lombard Heights 1954 722 210 M a q Sil Dol SS 24247 DL P 39N11E-6.3a Village of Lombard #4 1953 700 2062 M S C-O/MS S S 23911 DL P 39'N11E-7.2h Village of Lombard #3 1949 693 175 M a q Sil Dol S S 19637 P 39N11E-8.8h2 Village of Lombard #2 1926 696 2038 M S C-O/MS S S 627 DL P 39N11E-9.1h Villa Park Village Well #1 1928 699 2125 M S C-O/MS D L P 39N11E-9.2h Villa Park Village Well #2 1931 700 2110 M S C-O/MS S S 905 P 39N11E-10.1h Elmhurst City Well #4 1928 665 2205 M S C-O/MS D L P 39N11E-10.3g3 Wander Company #11 1933 668 1920 M S C-O/MS S S 15336 I 39N11E-10.8e2 Villa Park Well #4 1923 702 220 M a q Sil Dol S S 128 P 39N11E-12,8d Elmhurst City Well #5 1940 675 1480 E C C-O S S 6059 DL P 39N11E-18.3a Cambell 1957 720 147 Sil Sil Dol S S 32037 E 39N11E-20.6g Midwest York Co. 1954 725 241 Si l Sil Dol D L P
......
......
......
......
......
......
......
......
...... ......
...... ......
......
......
......
......
......
......
......
...... ......
...... ...... ......
...... ......
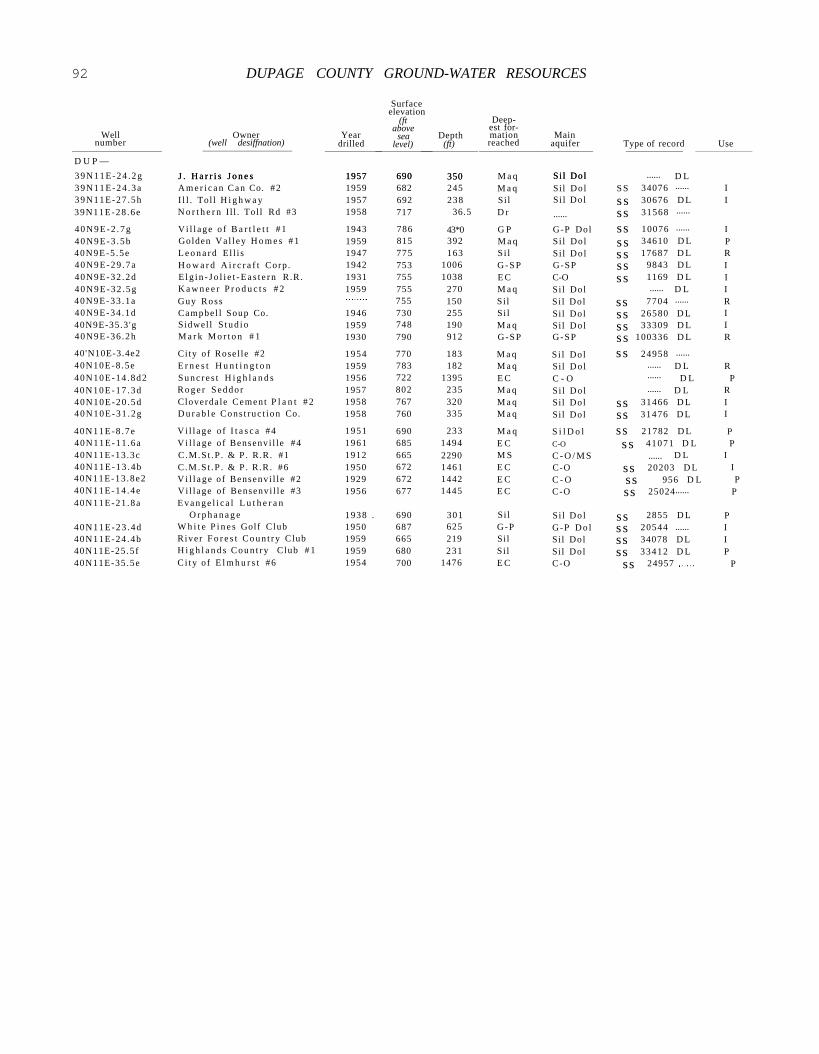
92 DUPAGE COUNTY GROUND-WATER RESOURCES
Well number
Owner (well desiffnation)
J . H a r r i s J o n e s
Year drilled
1957
Surface elevation
(ft above
sea level)
690
Depth (ft)
350
Deepest formation reached
Main aquifer
Si l Dol
Type of record
D L
Use
D U P — 3 9 N 1 1 E - 2 4 . 2 g J . H a r r i s J o n e s 1957
690 350 M a q Si l Dol 39N11E-24 .3a A m e r i c a n C a n Co. #2 1959 682 245 M a q Sil Dol S S 34076 I 39N11E-27 .5h I l l . Tol l H i g h w a y 1957 692 238 Si l Si l Dol s s 30676 D L I 39N11E-28 .6e N o r t h e r n I l l . Tol l Rd #3 1958 717 36.5 D r ss 31568
4 0 N 9 E - 2 . 7 g V i l l a g e o f B a r t l e t t # 1 1943 786 43*0 G P G-P Dol ss 10076 I 4 0 N 9 E - 3 . 5 b Golden Va l l ey H o m e s # 1 1959 815 392 M a q Si l Dol s s 34610 D L P 40N9E-5 .5e L e o n a r d El l i s 1947 775 163 S i l Si l Do l s s 17687 D L R 40N9E-29 .7a H o w a r d A i r c r a f t Corp . 1942 753 1006 G - S P G-SP ss 9843 D L I 40N9E-32 .2d E l g i n - J o l i e t - E a s t e r n R.R. 1931 755 1038 E C C-O s s 1169 D L I 4 0 N 9 E - 3 2 . 5 g K a w n e e r P r o d u c t s # 2 1959 755 270 M a q Si l Dol D L I 40N9E-33 .1a Guy Ross 755 150 Si l Si l Dol ss 7704 R 40N9E-34 .1d Campbe l l Soup Co. 1946 730 255 Si l Sil Dol ss 26580 D L I 40N9E-35.3 'g Sidwel l S t u d i o 1959 748 190 M a q Sil Do l ss 33309 D L I 40N9E-36 .2h M a r k M o r t o n # 1 1930 790 912 G-SP G-SP s s 100336 D L R
40'N10E-3.4e2 Ci ty of Rosel le #2 1954 770 183 M a q S i l Dol s s 24958 40N10E-8 .5e E r n e s t H u n t i n g t o n 1959 783 182 M a q Sil Do l D L R 40N10E-14 .8d2 S u n c r e s t H i g h l a n d s 1956 722 1395 E C C - O D L P 40N10E-17 .3d R o g e r S e d d o r 1957 802 235 M a q Si l Do l D L R 40N10E-20 .5d Cloverda le Cemen t P l a n t # 2 1958 767 320 M a q Sil Dol ss 31466 D L I 40N10E-31 .2g D u r a b l e Cons t ruc t ion Co. 1958 760 335 M a q Sil Dol ss 31476 D L I
40N11E-8 .7e V i l l age o f I t a s c a #4 1951 690 233 M a q S i l D o l ss 21782 D L P 40N11E-11 .6a V i l l a g e o f Bensenvi l l e #4 1961 685 1494 E C C-O s s 41071 D L P 40N11E-13 .3c C .M.S t .P . & P . R.R. #1 1912 665 2290 M S C - O / M S D L I 40N11E-13 .4b C .M.S t .P . & P . R.R. #6 1950 672 1461 E C C-O ss 20203 D L I 40N11E-13 .8e2 V i l l a g e of Bensenv i l l e #2 1929 672 1442 E C C - O ss 956 D L P 40N11E-14 .4e Vi l l age of Bensenvi l l e #3 1956 677 1445 E C C-O ss 25024 P 40N11E-21 .8a E v a n g e l i c a l L u t h e r a n
O r p h a n a g e 1938 . 690 301 Si l Si l Do l ss 2855 D L P 40N11E-23 .4d W h i t e P i n e s Golf Club 1950 687 625 G-P G-P D o l s s 20544 I 40N11E-24 .4b River F o r e s t C o u n t r y Club 1959 665 219 Sil Sil Dol ss 34078 D L I 40N11E-25 .5f H i g h l a n d s C o u n t r y Club # 1 1959 680 231 Si l Sil Dol ss 33412 D L P 40N11E-35 .5e C i t y o f E l m h u r s t #6 1954 700 1476 E C C-O ss 24957 P
...... ......
......
...... ......
...... ......
...... ...... ...... ......
......
......
......
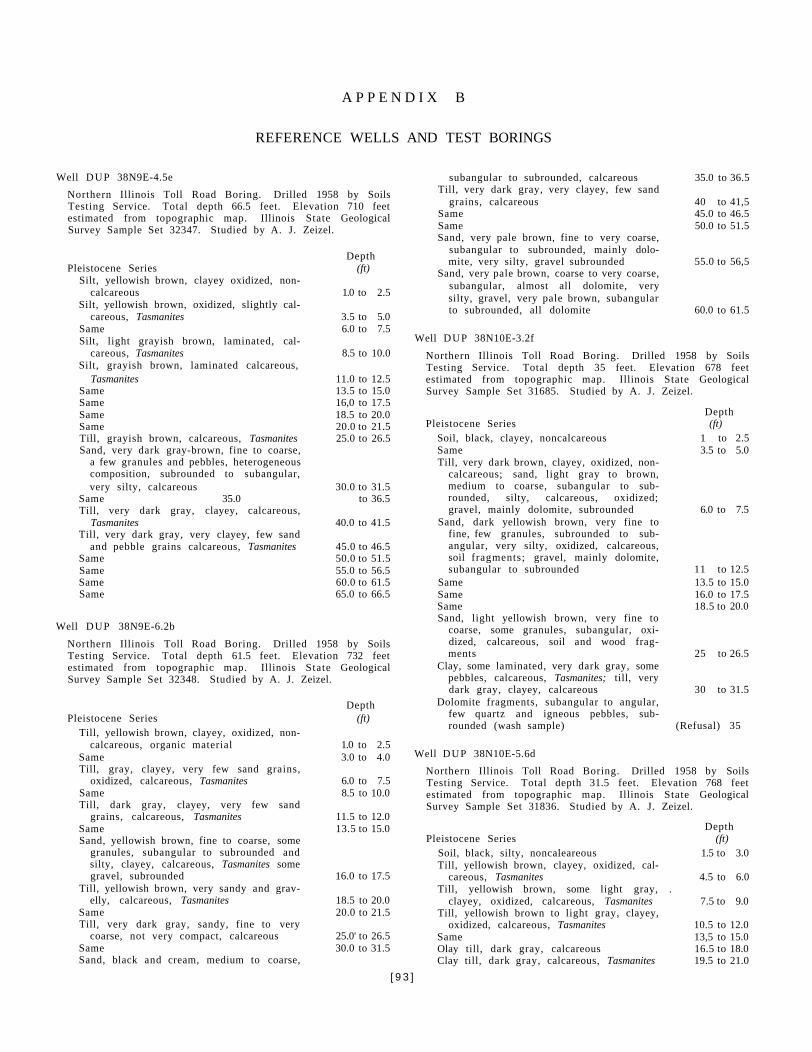
A P P E N D I X B
REFERENCE WELLS AND TEST BORINGS
Well DUP 38N9E-4.5e Northern Illinois Toll Road Boring. Drilled 1958 by Soils Testing Service. Total depth 66.5 feet. Elevation 710 feet estimated from topographic map. Illinois State Geological Survey Sample Set 32347. Studied by A. J. Zeizel.
Depth Pleistocene Series (ft)
Silt, yellowish brown, clayey oxidized, non-calcareous 1.0 to 2.5
Silt, yellowish brown, oxidized, slightly calcareous, Tasmanites 3.5 to 5.0
Same 6.0 to 7.5 Silt, light grayish brown, laminated, cal
careous, Tasmanites 8.5 to 10.0 Silt, grayish brown, laminated calcareous,
Tasmanites 11.0 to 12.5 Same 13.5 to 15.0 Same 16,0 to 17.5 Same 18.5 to 20.0 Same 20.0 to 21.5 Till, grayish brown, calcareous, Tasmanites 25.0 to 26.5 Sand, very dark gray-brown, fine to coarse,
a few granules and pebbles, heterogeneous composition, subrounded to subangular, very silty, calcareous 30.0 to 31.5
Same 35.0 to 36.5 Till, very dark gray, clayey, calcareous,
Tasmanites 40.0 to 41.5 Till, very dark gray, very clayey, few sand
and pebble grains calcareous, Tasmanites 45.0 to 46.5 Same 50.0 to 51.5 Same 55.0 to 56.5 Same 60.0 to 61.5 Same 65.0 to 66.5
Well DUP 38N9E-6.2b
Northern Illinois Toll Road Boring. Drilled 1958 by Soils Testing Service. Total depth 61.5 feet. Elevation 732 feet estimated from topographic map. Illinois State Geological Survey Sample Set 32348. Studied by A. J. Zeizel.
Depth Pleistocene Series (ft)
Till, yellowish brown, clayey, oxidized, non-calcareous, organic material 1.0 to 2.5
Same 3.0 to 4.0 Till, gray, clayey, very few sand grains,
oxidized, calcareous, Tasmanites 6.0 to 7.5 Same 8.5 to 10.0 Till, dark gray, clayey, very few sand
grains, calcareous, Tasmanites 11.5 to 12.0 Same 13.5 to 15.0 Sand, yellowish brown, fine to coarse, some
granules, subangular to subrounded and silty, clayey, calcareous, Tasmanites some gravel, subrounded 16.0 to 17.5
Till, yellowish brown, very sandy and gravelly, calcareous, Tasmanites 18.5 to 20.0
Same 20.0 to 21.5 Till, very dark gray, sandy, fine to very
coarse, not very compact, calcareous 25.0' to 26.5 Same 30.0 to 31.5 Sand, black and cream, medium to coarse,
subangular to subrounded, calcareous 35.0 to 36.5 Till, very dark gray, very clayey, few sand
grains, calcareous 40 to 41,5 Same 45.0 to 46.5 Same 50.0 to 51.5 Sand, very pale brown, fine to very coarse,
subangular to subrounded, mainly dolomite, very silty, gravel subrounded 55.0 to 56,5
Sand, very pale brown, coarse to very coarse, subangular, almost all dolomite, very silty, gravel, very pale brown, subangular to subrounded, all dolomite 60.0 to 61.5
Well DUP 38N10E-3.2f
Northern Illinois Toll Road Boring. Drilled 1958 by Soils Testing Service. Total depth 35 feet. Elevation 678 feet estimated from topographic map. Illinois State Geological Survey Sample Set 31685. Studied by A. J. Zeizel.
Depth Pleistocene Series (ft)
Soil, black, clayey, noncalcareous 1 to 2.5 Same 3.5 to 5.0 Till, very dark brown, clayey, oxidized, non-
calcareous; sand, light gray to brown, medium to coarse, subangular to subrounded, silty, calcareous, oxidized; gravel, mainly dolomite, subrounded 6.0 to 7.5
Sand, dark yellowish brown, very fine to fine, few granules, subrounded to sub-angular, very silty, oxidized, calcareous, soil fragments; gravel, mainly dolomite, subangular to subrounded 11 to 12.5
Same 13.5 to 15.0 Same 16.0 to 17.5 Same 18.5 to 20.0 Sand, light yellowish brown, very fine to
coarse, some granules, subangular, oxidized, calcareous, soil and wood fragments 25 to 26.5
Clay, some laminated, very dark gray, some pebbles, calcareous, Tasmanites; till, very dark gray, clayey, calcareous 30 to 31.5
Dolomite fragments, subangular to angular, few quartz and igneous pebbles, subrounded (wash sample) (Refusal) 35
Well DUP 38N10E-5.6d Northern Illinois Toll Road Boring. Drilled 1958 by Soils Testing Service. Total depth 31.5 feet. Elevation 768 feet estimated from topographic map. Illinois State Geological Survey Sample Set 31836. Studied by A. J. Zeizel.
Depth Pleistocene Series (ft)
Soil, black, silty, noncaleareous 1.5 to 3.0 Till, yellowish brown, clayey, oxidized, cal
careous, Tasmanites 4.5 to 6.0 Till, yellowish brown, some light gray, .
clayey, oxidized, calcareous, Tasmanites 7.5 to 9.0 Till, yellowish brown to light gray, clayey,
oxidized, calcareous, Tasmanites 10.5 to 12.0 Same 13,5 to 15.0 Olay till, dark gray, calcareous 16.5 to 18.0 Clay till, dark gray, calcareous, Tasmanites 19.5 to 21.0
[ 9 3 ]
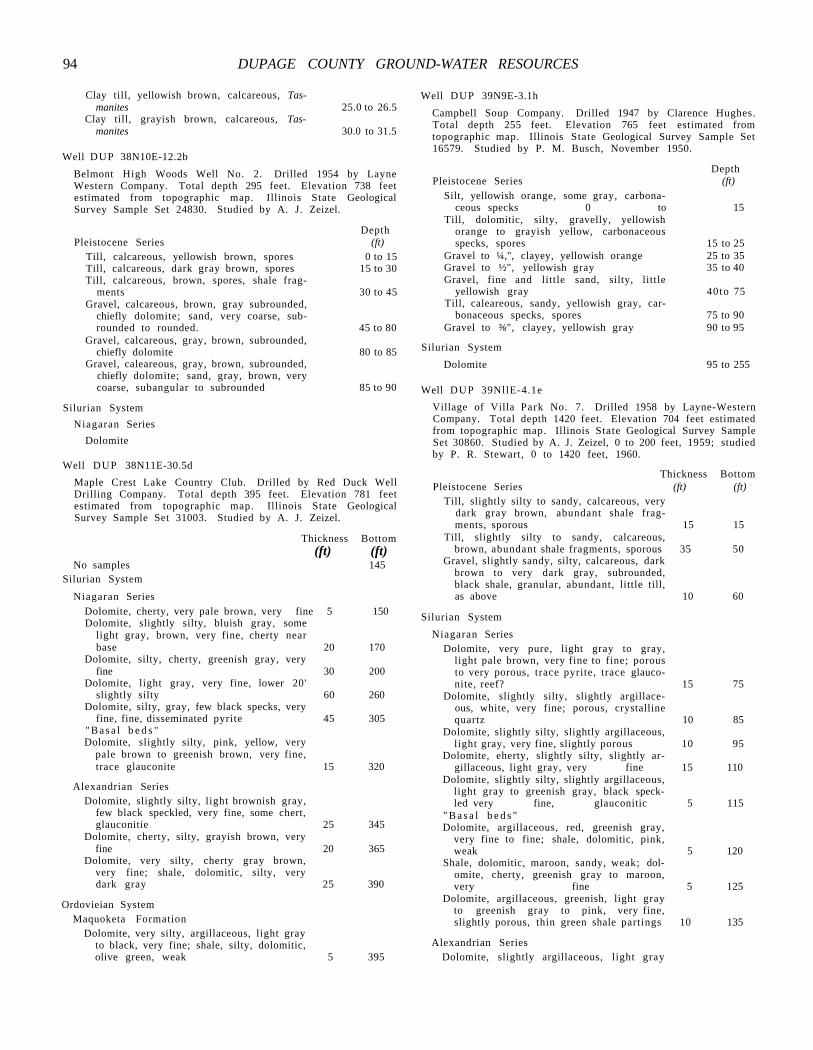
94 DUPAGE COUNTY GROUND-WATER RESOURCES
Clay till, yellowish brown, calcareous, Tas-manites 25.0 to 26.5
Clay till, grayish brown, calcareous, Tas-manites 30.0 to 31.5
Well DUP 38N10E-12.2b Belmont High Woods Well No. 2. Drilled 1954 by Layne Western Company. Total depth 295 feet. Elevation 738 feet estimated from topographic map. Illinois State Geological Survey Sample Set 24830. Studied by A. J. Zeizel.
Depth Pleistocene Series (ft)
Till, calcareous, yellowish brown, spores 0 to 15 Till, calcareous, dark gray brown, spores 15 to 30 Till, calcareous, brown, spores, shale frag
ments 30 to 45 Gravel, calcareous, brown, gray subrounded,
chiefly dolomite; sand, very coarse, sub-rounded to rounded. 45 to 80
Gravel, calcareous, gray, brown, subrounded, chiefly dolomite 80 to 85
Gravel, caleareous, gray, brown, subrounded, chiefly dolomite; sand, gray, brown, very coarse, subangular to subrounded 85 to 90
Silurian System Niagaran Series
Dolomite
Well DUP 38N11E-30.5d Maple Crest Lake Country Club. Drilled by Red Duck Well Drilling Company. Total depth 395 feet. Elevation 781 feet estimated from topographic map. Illinois State Geological Survey Sample Set 31003. Studied by A. J. Zeizel.
Thickness Bottom (ft) (ft)
No samples 145 Silurian System
Niagaran Series Dolomite, cherty, very pale brown, very fine 5 150 Dolomite, slightly silty, bluish gray, some
light gray, brown, very fine, cherty near base 20 170
Dolomite, silty, cherty, greenish gray, very fine 30 200
Dolomite, light gray, very fine, lower 20' slightly silty 60 260
Dolomite, silty, gray, few black specks, very fine, fine, disseminated pyrite 45 305
" B a s a l b e d s " Dolomite, slightly silty, pink, yellow, very
pale brown to greenish brown, very fine, trace glauconite 15 320
Alexandrian Series Dolomite, slightly silty, light brownish gray,
few black speckled, very fine, some chert, glauconitie 25 345
Dolomite, cherty, silty, grayish brown, very fine 20 365
Dolomite, very silty, cherty gray brown, very fine; shale, dolomitic, silty, very dark gray 25 390
Ordovieian System Maquoketa Formation
Dolomite, very silty, argillaceous, light gray to black, very fine; shale, silty, dolomitic, olive green, weak 5 395
Well DUP 39N9E-3.1h Campbell Soup Company. Drilled 1947 by Clarence Hughes. Total depth 255 feet. Elevation 765 feet estimated from topographic map. Illinois State Geological Survey Sample Set 16579. Studied by P. M. Busch, November 1950.
Depth Pleistocene Series (ft)
Silt, yellowish orange, some gray, carbonaceous specks 0 to 15
Till, dolomitic, silty, gravelly, yellowish orange to grayish yellow, carbonaceous specks, spores 15 to 25
Gravel to ¼,", clayey, yellowish orange 25 to 35 Gravel to ½", yellowish gray 35 to 40 Gravel, fine and little sand, silty, little
yellowish gray 40to 75 Till, caleareous, sandy, yellowish gray, car
bonaceous specks, spores 75 to 90 Gravel to ⅜", clayey, yellowish gray 90 to 95
Silurian System Dolomite 95 to 255
Well DUP 39NllE-4.1e Village of Villa Park No. 7. Drilled 1958 by Layne-Western Company. Total depth 1420 feet. Elevation 704 feet estimated from topographic map. Illinois State Geological Survey Sample Set 30860. Studied by A. J. Zeizel, 0 to 200 feet, 1959; studied by P. R. Stewart, 0 to 1420 feet, 1960.
Thickness Bottom Pleistocene Series (ft) (ft)
Till, slightly silty to sandy, calcareous, very dark gray brown, abundant shale fragments, sporous 15 15
Till, slightly silty to sandy, calcareous, brown, abundant shale fragments, sporous 35 50
Gravel, slightly sandy, silty, calcareous, dark brown to very dark gray, subrounded, black shale, granular, abundant, little till, as above 10 60
Silurian System Niagaran Series
Dolomite, very pure, light gray to gray, light pale brown, very fine to fine; porous to very porous, trace pyrite, trace glauconite, reef? 15 75
Dolomite, slightly silty, slightly argillaceous, white, very fine; porous, crystalline quartz 10 85
Dolomite, slightly silty, slightly argillaceous, light gray, very fine, slightly porous 10 95
Dolomite, eherty, slightly silty, slightly argillaceous, light gray, very fine 15 110
Dolomite, slightly silty, slightly argillaceous, light gray to greenish gray, black speckled very fine, glauconitic 5 115
" B a s a l b e d s " Dolomite, argillaceous, red, greenish gray,
very fine to fine; shale, dolomitic, pink, weak 5 120
Shale, dolomitic, maroon, sandy, weak; dolomite, cherty, greenish gray to maroon, very fine 5 125
Dolomite, argillaceous, greenish, light gray to greenish gray to pink, very fine, slightly porous, thin green shale partings 10 135
Alexandrian Series Dolomite, slightly argillaceous, light gray
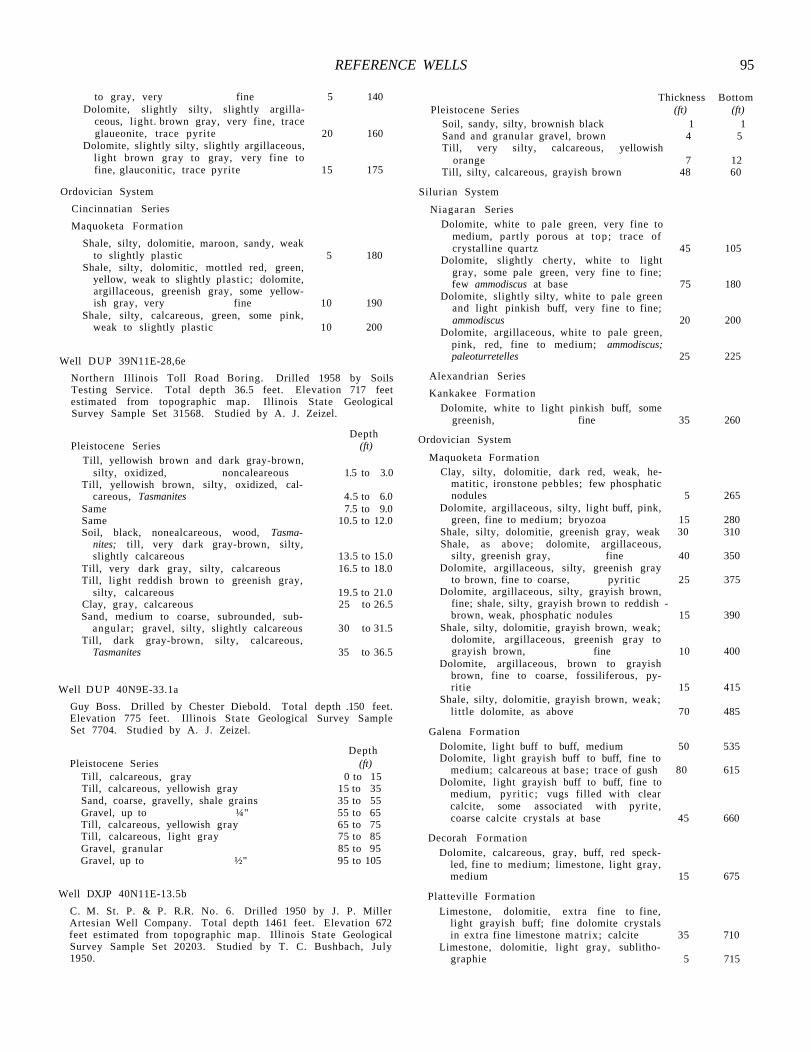
REFERENCE WELLS 95
to gray, very fine 5 140 Dolomite, slightly silty, slightly argilla
ceous, light. brown gray, very fine, trace glaueonite, trace pyrite 20 160
Dolomite, slightly silty, slightly argillaceous, light brown gray to gray, very fine to fine, glauconitic, trace pyrite 15 175
Ordovician System Cincinnatian Series Maquoketa Formation
Shale, silty, dolomitie, maroon, sandy, weak to slightly plastic 5 180
Shale, silty, dolomitic, mottled red, green, yellow, weak to slightly plastic; dolomite, argillaceous, greenish gray, some yellowish gray, very fine 10 190
Shale, silty, calcareous, green, some pink, weak to slightly plastic 10 200
Well DUP 39N11E-28,6e Northern Illinois Toll Road Boring. Drilled 1958 by Soils Testing Service. Total depth 36.5 feet. Elevation 717 feet estimated from topographic map. Illinois State Geological Survey Sample Set 31568. Studied by A. J. Zeizel.
Depth Pleistocene Series (ft)
Till, yellowish brown and dark gray-brown, silty, oxidized, noncaleareous 1.5 to 3.0
Till, yellowish brown, silty, oxidized, calcareous, Tasmanites 4.5 to 6.0
Same 7.5 to 9.0 Same 10.5 to 12.0 Soil, black, nonealcareous, wood, Tasma
nites; till, very dark gray-brown, silty, slightly calcareous 13.5 to 15.0
Till, very dark gray, silty, calcareous 16.5 to 18.0 Till, light reddish brown to greenish gray,
silty, calcareous 19.5 to 21.0 Clay, gray, calcareous 25 to 26.5 Sand, medium to coarse, subrounded, sub-
angular; gravel, silty, slightly calcareous 30 to 31.5 Till, dark gray-brown, silty, calcareous,
Tasmanites 35 to 36.5
Well DUP 40N9E-33.1a Guy Boss. Drilled by Chester Diebold. Total depth .150 feet. Elevation 775 feet. Illinois State Geological Survey Sample Set 7704. Studied by A. J. Zeizel.
Depth Pleistocene Series (ft)
Till, calcareous, gray 0 to 15 Till, calcareous, yellowish gray 15 to 35 Sand, coarse, gravelly, shale grains 35 to 55 Gravel, up to ¼" 55 to 65 Till, calcareous, yellowish gray 65 to 75 Till, calcareous, light gray 75 to 85 Gravel, granular 85 to 95 Gravel, up to ½" 95 to 105
Well DXJP 40N11E-13.5b C. M. St. P. & P. R.R. No. 6. Drilled 1950 by J. P. Miller Artesian Well Company. Total depth 1461 feet. Elevation 672 feet estimated from topographic map. Illinois State Geological Survey Sample Set 20203. Studied by T. C. Bushbach, July 1950.
Thickness Bottom Pleistocene Series (ft) (ft)
Soil, sandy, silty, brownish black 1 1 Sand and granular gravel, brown 4 5 Till, very silty, calcareous, yellowish
orange 7 12 Till, silty, calcareous, grayish brown 48 60
Silurian System
Niagaran Series Dolomite, white to pale green, very fine to
medium, partly porous at top; trace of crystalline quartz 45 105
Dolomite, slightly cherty, white to light gray, some pale green, very fine to fine; few ammodiscus at base 75 180
Dolomite, slightly silty, white to pale green and light pinkish buff, very fine to fine; ammodiscus 20 200
Dolomite, argillaceous, white to pale green, pink, red, fine to medium; ammodiscus; paleoturretelles 25 225
Alexandrian Series Kankakee Formation
Dolomite, white to light pinkish buff, some greenish, fine 35 260
Ordovician System
Maquoketa Formation Clay, silty, dolomitie, dark red, weak, he-
matitic, ironstone pebbles; few phosphatic nodules 5 265
Dolomite, argillaceous, silty, light buff, pink, green, fine to medium; bryozoa 15 280
Shale, silty, dolomitie, greenish gray, weak 30 310 Shale, as above; dolomite, argillaceous,
silty, greenish gray, fine 40 350 Dolomite, argillaceous, silty, greenish gray
to brown, fine to coarse, pyritic 25 375 Dolomite, argillaceous, silty, grayish brown,
fine; shale, silty, grayish brown to reddish -brown, weak, phosphatic nodules 15 390
Shale, silty, dolomitie, grayish brown, weak; dolomite, argillaceous, greenish gray to grayish brown, fine 10 400
Dolomite, argillaceous, brown to grayish brown, fine to coarse, fossiliferous, pyritie 15 415
Shale, silty, dolomitie, grayish brown, weak; little dolomite, as above 70 485
Galena Formation Dolomite, light buff to buff, medium 50 535 Dolomite, light grayish buff to buff, fine to
medium; calcareous at base; trace of gush 80 615 Dolomite, light grayish buff to buff, fine to
medium, pyri t ic; vugs filled with clear calcite, some associated with pyrite, coarse calcite crystals at base 45 660
Decorah Formation Dolomite, calcareous, gray, buff, red speck
led, fine to medium; limestone, light gray, medium 15 675
Platteville Formation Limestone, dolomitie, extra fine to fine,
light grayish buff; fine dolomite crystals in extra fine limestone matrix; calcite 35 710
Limestone, dolomitie, light gray, sublitho-graphie 5 715
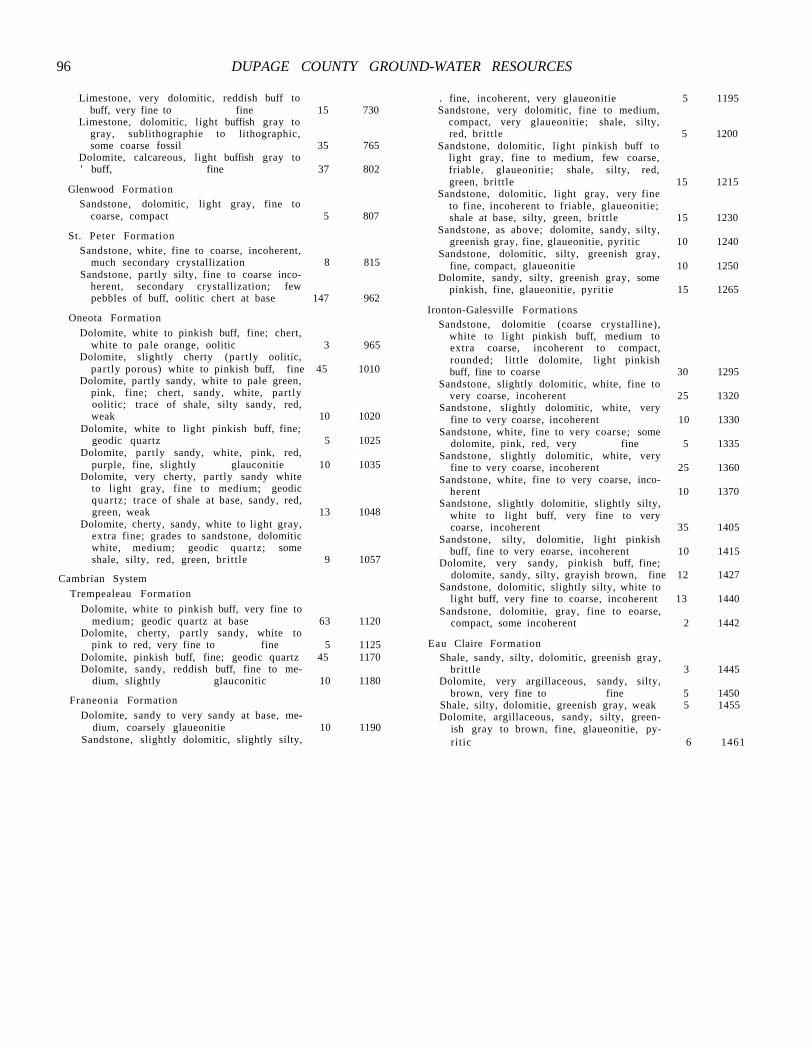
96 DUPAGE COUNTY GROUND-WATER RESOURCES
Limestone, very dolomitic, reddish buff to buff, very fine to fine 15 730
Limestone, dolomitic, light buffish gray to gray, sublithographie to lithographic, some coarse fossil 35 765
Dolomite, calcareous, light buffish gray to ' buff, fine 37 802
Glenwood Formation Sandstone, dolomitic, light gray, fine to
coarse, compact 5 807
St. Peter Formation Sandstone, white, fine to coarse, incoherent,
much secondary crystallization 8 815 Sandstone, partly silty, fine to coarse inco
herent, secondary crystallization; few pebbles of buff, oolitic chert at base 147 962
Oneota Formation Dolomite, white to pinkish buff, fine; chert,
white to pale orange, oolitic 3 965 Dolomite, slightly cherty (partly oolitic,
partly porous) white to pinkish buff, fine 45 1010 Dolomite, partly sandy, white to pale green,
pink, fine; chert, sandy, white, partly oolitic; trace of shale, silty sandy, red, weak 10 1020
Dolomite, white to light pinkish buff, fine; geodic quartz 5 1025
Dolomite, partly sandy, white, pink, red, purple, fine, slightly glauconitie 10 1035
Dolomite, very cherty, partly sandy white to light gray, fine to medium; geodic quartz; trace of shale at base, sandy, red, green, weak 13 1048
Dolomite, cherty, sandy, white to light gray, extra fine; grades to sandstone, dolomitic white, medium; geodic quartz; some shale, silty, red, green, brit t le 9 1057
Cambrian System Trempealeau Formation
Dolomite, white to pinkish buff, very fine to medium; geodic quartz at base 63 1120
Dolomite, cherty, partly sandy, white to pink to red, very fine to fine 5 1125
Dolomite, pinkish buff, fine; geodic quartz 45 1170 Dolomite, sandy, reddish buff, fine to me
dium, slightly glauconitic 10 1180
Franeonia Formation Dolomite, sandy to very sandy at base, me
dium, coarsely glaueonitie 10 1190 Sandstone, slightly dolomitic, slightly silty,
. fine, incoherent, very glaueonitie 5 1195 Sandstone, very dolomitic, fine to medium,
compact, very glaueonitie; shale, silty, red, brittle 5 1200
Sandstone, dolomitic, light pinkish buff to light gray, fine to medium, few coarse, friable, glaueonitie; shale, silty, red, green, brittle 15 1215
Sandstone, dolomitic, light gray, very fine to fine, incoherent to friable, glaueonitie; shale at base, silty, green, brittle 15 1230
Sandstone, as above; dolomite, sandy, silty, greenish gray, fine, glaueonitie, pyritic 10 1240
Sandstone, dolomitic, silty, greenish gray, fine, compact, glaueonitie 10 1250
Dolomite, sandy, silty, greenish gray, some pinkish, fine, glaueonitie, pyritie 15 1265
Ironton-Galesville Formations Sandstone, dolomitie (coarse crystalline),
white to light pinkish buff, medium to extra coarse, incoherent to compact, rounded; little dolomite, light pinkish buff, fine to coarse 30 1295
Sandstone, slightly dolomitic, white, fine to very coarse, incoherent 25 1320
Sandstone, slightly dolomitic, white, very fine to very coarse, incoherent 10 1330
Sandstone, white, fine to very coarse; some dolomite, pink, red, very fine 5 1335
Sandstone, slightly dolomitic, white, very fine to very coarse, incoherent 25 1360
Sandstone, white, fine to very coarse, incoherent 10 1370
Sandstone, slightly dolomitie, slightly silty, white to light buff, very fine to very coarse, incoherent 35 1405
Sandstone, silty, dolomitie, light pinkish buff, fine to very eoarse, incoherent 10 1415
Dolomite, very sandy, pinkish buff, fine; dolomite, sandy, silty, grayish brown, fine 12 1427
Sandstone, dolomitic, slightly silty, white to light buff, very fine to coarse, incoherent 13 1440
Sandstone, dolomitie, gray, fine to eoarse, compact, some incoherent 2 1442
Eau Claire Formation Shale, sandy, silty, dolomitic, greenish gray,
brittle 3 1445 Dolomite, very argillaceous, sandy, silty,
brown, very fine to fine 5 1450 Shale, silty, dolomitie, greenish gray, weak 5 1455 Dolomite, argillaceous, sandy, silty, green-
ish gray to brown, fine, glaueonitie, py-ritic 6 1461
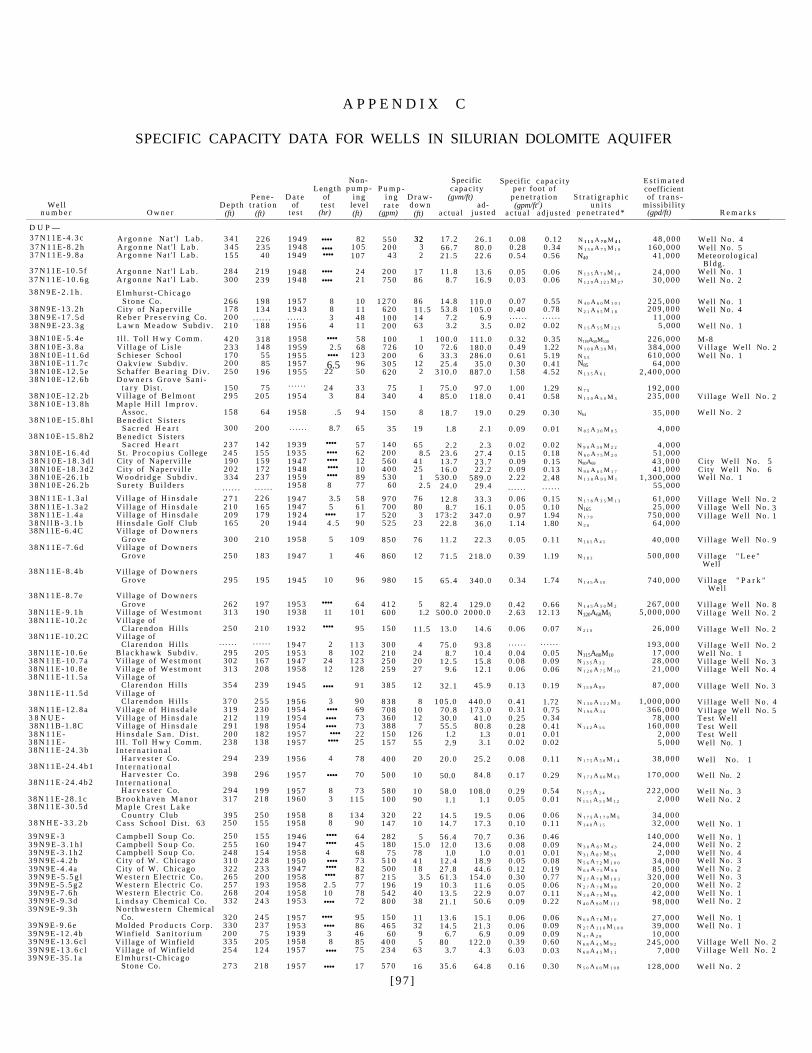
A P P E N D I X C
SPECIFIC CAPACITY DATA FOR WELLS IN SILURIAN DOLOMITE AQUIFER
L e n g t h Non-
p u m p P u m p Specific c apac i t y
Specific c a p a c i t y p e r foot of
E s t i m a t e d coefficient
P e n e - D a t e of i n g i n g D r a w (gvm/ft) p e n e t r a t i o n S t r a t i g r a p h i c of t r a n s -Wel l D e p t h t r a t i o n of t e s t level r a t e d o w n ad (gpm/ft2) u n i t s miss ib i l i ty
n u m b e r O w n e r (ft)
3 4 1
(ft)
2 2 6
t e s t
1 9 4 9
(hr) (ft)
82
(gpm)
5 5 0
(ft)
32
a c t u a l
17 .2
j u s t e d
2 6 . 1
a c t u a l a d j u s t e d
0 .08 0 .12
p e n e t r a t e d *
N 1 1 5 A 7 0 M 4 1
(gpd/ft)
4 8 , 0 0 0
R e m a r k s
D U P — 3 7 N 1 1 E - 4 . 3 c A r g o n n e N a t ' l L a b . 32 1 1 5 7 0 4 1 Wel l N o . 4 3 7 N 1 1 E - 8 . 2 h A r g o n n e N a t ' l L a b . 3 4 5 2 3 5 1 9 4 8 1 0 5 2 0 0 3 66 .7 80 .0 0 .28 0 .34 N 1 5 0 A 7 5 M 1 0 1 6 0 , 0 0 0 Wel l No . 5 3 7 N 1 1 E - 9 . 8 a A r g o n n e N a t ' l L a b . 1 5 5 4 0 1 9 4 9 1 0 7 4 3 2 2 1 . 5 22 .6 0 . 5 4 0 .56 N40 4 1 , 0 0 0 Meteoro log ica l
B l d g . Wel l No. 1 3 7 N 1 1 E - 1 0 . 5 f A r g o n n e N a t ' l L a b . 2 8 4 2 1 9 1 9 4 8 2 4 2 0 0 17 1 1 . 8 13 .6 0 .05 0 .06 N 1 3 5 A 7 0 M 1 4 2 4 , 0 0 0
3 7 N 1 1 E - 1 0 . 6 g A r g o n n e N a t ' l L a b . 3 0 0 2 3 9 1 9 4 8 2 1 7 5 0 86 8.7 16 .9 0 .03 0 .06 N 1 2 9 A 1 2 3 M 2 7 3 0 , 0 0 0 Wel l No . 2 3 8 N 9 E - 2 . 1 h . E l m h u r s t - C h i c a g o
S t o n e Co. 2 6 6 1 9 8 1 9 5 7 8 10 1 2 7 0 86 14 .8 110 .0 0 .07 0 .55 N 4 0 A 6 0 M 1 0 1 2 2 5 , 0 0 0 Wel l No. 1 3 8 N 9 E - 1 3 . 2 h City of Nape rv i l l e 1 7 8 1 3 4 1 9 4 3 8 1 1 620 11 .5 53 .8 105 .0 0 .40 0 .78 N 2 1 A 9 5 M 1 8 2 0 9 , 0 0 0 Wel l No . 4 3 8 N 9 E - 1 7 . 5 d R e b e r P r e s e r v i n g Co. 2 0 0 3 4 8 1 0 0 1 4 7.2 6.9 1 1 , 0 0 0 3 8 N 9 E - 2 3 . 3 g L a w n M e a d o w S u b d i v . 2 1 0 1 8 8 1 9 5 6 4 1 1 2 0 0 63 3.2 3.5 0.02 0.02 N 1 5 A 5 5 M 1 2 5 5,000 Wel l No . 1 3 8 N 1 0 E - 5 . 4 e I l l . Toll H w y Comm. 4 2 0 3 1 8 1958 5 8 1 0 0 1 1 0 0 . 0 1 1 1 . 0 0 .32 0 .35 N118A50M150 2 2 6 , 0 0 0 M-8 3 8 N 1 0 E - 3 . 8 a Vi l l age of L i s l e 2 3 3 1 4 8 1 9 5 9 2.5 68 7 2 6 10 72 .6 180 .0 0 .49 1.22 N 1 0 8 A 3 9 M 1 3 8 4 , 0 0 0 Vi l l age Wel l No. 2 3 8 N 1 0 E - 1 1 . 6 d Sch iese r School 1 7 0 5 5 1 9 5 5 1 2 3 2 0 0 6 33 .3 2 8 6 . 0 0 .61 5.19 N 5 5 6 1 0 , 0 0 0 Wel l No . 1 3 8 N 1 0 E - 1 1 . 7 c O a k v i e w S u b d i v . 2 0 0 85 1 9 5 7 6.5 96 3 0 5 12 2 5 . 4 35 .0 0 .30 0 .41 N85 6 4 , 0 0 0 3 8 N 1 0 E - 1 2 . 5 e Schaffer B e a r i n g D i v . 2 5 0 1 9 6 1 9 5 5 22 50 6 2 0 2 3 1 0 . 0 887 .0 1.58 4 .52 N 1 3 5 A 6 1 2 , 4 0 0 , 0 0 0 3 8 N 1 0 E - 1 2 . 6 b D o w n e r s G r o v e San i
t a r y D i s t . 1 5 0 7 5 2 4 3 3 75 1 75 .0 97 .0 1.00 1.29 N 7 5 1 9 2 , 0 0 0 3 8 N 1 0 E - 1 2 . 2 b Vi l l age of B e l m o n t 2 9 5 2 0 5 1 9 5 4 3 8 4 3 4 0 4 85 .0 118 .0 0 .41 0 .58 N 1 5 0 A 5 0 M 5 2 3 5 , 0 0 0 Vi l l age Wel l No . 2 3 8 N 1 0 E - 1 3 . 8 h M a p l e H i l l I m p r o v .
Assoc . 1 5 8 64 1 9 5 8 .5 9 4 1 5 0 8 18 .7 19 .0 0.29 0 .30 N64 3 5 , 0 0 0 Wel l No . 2 3 8 N 1 0 E - 1 5 . 8 h l B e n e d i c t S i s t e r s
S a c r e d H e a r t 300 2 0 0 8.7 6 5 3 5 19 1.8 2 .1 0.09 0 .01 N 8 5 A 3 0 M 8 5 4 , 0 0 0 3 8 N 1 0 E - 1 5 . 8 h 2 B e n e d i c t S i s t e r s
S a c r e d H e a r t 2 3 7 1 4 2 1 9 3 9 .... 5 7 1 4 0 6 5 2 .2 2 .3 0 .02 0 .02 N 9 0 A 3 0 M 2 2 4 , 0 0 0 3 8 N 1 0 E - 1 6 . 4 d S t . P r o c o p i u s College 2 4 5 1 5 5 1 9 3 5 62 2 0 0 8.5 2 3 . 6 2 7 . 4 0 .15 0 .18 N 6 0 A 7 5 M 2 0 5 1 , 0 0 0 3 8 N 1 0 E - 1 8 . 3 d l Ci ty of Nape rv i l l e 1 9 0 1 5 9 1 9 4 7 12 5 6 0 4 1 13 .7 23 .7 0 .09 0 .15 N80A69 4 3 , 0 0 0 City Wel l No . 5 3 8 N 1 0 E - 1 8 . 3 d 2 City of Nape rv i l l e 2 0 2 172 1 9 4 8 10 4 0 0 2 5 16 .0 22 .2 0 .09 0 .13 N 9 0 A 6 5 M 1 7 4 1 , 0 0 0 City Wel l No. 6 3 8 N 1 0 E - 2 6 . 1 b W o o d r i d g e S u b d i v . 3 3 4 2 3 7 1 9 5 9 89 5 3 0 1 5 3 0 . 0 5 8 9 . 0 2 .22 2 .48 N 1 3 8 A 9 5 M 1 1 ,300 ,000 Wel l No . 1 3 8 N 1 0 E - 2 6 . 2 b S u r e t y B u i l d e r s 1 9 5 8 8 77 60 2 .5 24 .0 29 .4 5 5 , 0 0 0 3 8 N 1 1 E - 1 . 3 a l V i l l age of H i n s d a l e 2 7 1 2 2 6 1 9 4 7 3.5 5 8 9 7 0 76 12 .8 33 .3 0 .06 0 .15 N 1 7 8 A 3 5 M 1 3 6 1 , 0 0 0 Vi l l age Wel l No . 2 3 8 N 1 1 E - 1 . 3 a 2 Vi l l age of H i n s d a l e 2 1 0 1 6 5 1 9 4 7 5 6 1 7 0 0 80 8.7 16 .1 0 .05 0.10 N165 2 5 , 0 0 0 Vi l l age Wel l No . 3 3 8 N 1 1 E - 1 . 4 a Vi l l age of H i n s d a l e 2 0 9 1 7 9 1 9 2 4 17 5 2 0 3 173 :2 3 4 7 . 0 0 .97 1.94 N 1 7 9 7 5 0 , 0 0 0 Vi l l age Wel l No. 1 3 8 N l l B - 3 . 1 b H i n s d a l e Golf Club 1 6 5 20 1 9 4 4 4 . 5 90 5 2 5 2 3 22 .8 36 .0 1.14 1.80 N 2 0 6 4 , 0 0 0 38N11E-6 .4C Vi l lage of D o w n e r s
G r o v e 3 0 0 2 1 0 1 9 5 8 5 1 0 9 8 5 0 76 11 .2 22 .3 0 . 05 0 .11 N 1 6 5 A 4 5 4 0 , 0 0 0 Vi l l age Wel l No . 9 3 8 N 1 1 E - 7 . 6 d Vi l lage of D o w n e r s
Grove 2 5 0 1 8 3 1 9 4 7 1 4 6 8 6 0 12 7 1 . 5 2 1 8 . 0 0.39 1.19 N 1 8 3 5 0 0 , 0 0 0 Vi l l age " L e e " Well
3 8 N 1 1 E - 8 . 4 b Vi l l age of D o w n e r s G r o v e 2 9 5 1 9 5 1 9 4 5 10 96 9 8 0 1 5 6 5 . 4 3 4 0 . 0 0 .34 1.74 N 1 4 5 A 5 0 7 4 0 , 0 0 0 Vi l l age " P a r k "
Wel l 3 8 N 1 1 E - 8 . 7 e Vi l lage of D o w n e r s
Grove 2 6 2 1 9 7 1 9 5 3 6 4 4 1 2 5 8 2 . 4 129 .0 0 .42 0 .66 N 1 4 5 A 5 0 M 2 2 6 7 , 0 0 0 Vi l l age Wel l No. 8 3 8 N 1 1 E - 9 . 1 h Vi l l age of W e s t m o n t 3 1 3 1 9 0 1 9 3 8 11 1 0 1 6 0 0 1.2 5 0 0 . 0 2 0 0 0 . 0 2 .63 1 2 . 1 3 N120A68M5 5 ,000 ,000 V i l l a g e Wel l No . 2 3 8 N 1 1 E - 1 0 . 2 c Vi l l age of
C l a r e n d o n Hi l l s 2 5 0 2 1 0 1 9 3 2 95 1 5 0 11 .5 13 .0 14 .6 0 .06 0.07 N 2 1 0 2 6 , 0 0 0 Vi l l age Wel l No. 2 3 8 N 1 1 E - 1 0 . 2 C Vi l l age of
C l a r e n d o n Hi l l s 1 9 4 7 2 1 1 3 3 0 0 4 75 .0 93 .8 1 9 3 , 0 0 0 Vi l l age Wel l No. 2 3 8 N 1 1 E - 1 0 . 6 e B l a c k h a w k S u b d i v . 2 9 5 2 0 5 1 9 5 3 8 102 2 1 0 24 8.7 10 .4 0 .04 0 .05 N115A80M10 1 7 , 0 0 0 Wel l No. 1 3 8 N 1 1 E - 1 0 . 7 a Vi l l age of W e s t m o n t 302 1 6 7 1 9 4 7 2 4 1 2 3 2 5 0 20 1 2 . 5 15 .8 0 .08 0 .09 N 1 3 5 A 3 2 2 8 , 0 0 0 Vi l l age Wel l No. 3 3 8 N 1 1 E - 1 0 . 8 e Vi l l age of W e s t m o n t 3 1 3 2 0 8 1 9 5 8 12 128 2 5 9 27 9.6 12 .1 0 .06 0.06 N 1 2 0 A 7 5 M 1 0 2 1 , 0 0 0 Vi l l age Wel l No. 4 3 8 N 1 1 E - 1 1 . 5 a Vi l l age of
C l a r e n d o n Hi l l s 3 5 4 2 3 9 1 9 4 5 9 1 3 8 5 12 3 2 . 1 45 .9 0 .13 0 .19 N 1 5 0 A 8 9 8 7 , 0 0 0 Vi l l age Wel l No. 3 3 8 N 1 1 E - 1 1 . 5 d Vi l l age of
C l a r e n d o n H i l l s 3 7 0 2 5 5 1 9 5 6 3 9 0 8 3 8 8 1 0 5 . 0 4 4 0 . 0 0 . 4 1 1.72 N 1 3 0 A 1 2 2 M 3 1 ,000 ,000 V i l l a g e Wel l No . 4 3 8 N 1 1 E - 1 2 . 8 a Vi l l age of H i n s d a l e 3 1 9 2 3 0 1 9 5 4 69 7 0 8 10 70 .8 173 .0 0 .31 0 .75 N 1 9 6 A 3 4 3 6 6 , 0 0 0 Vi l l age Wel l No. 5 3 8 N U E - Vi l l age of H i n s d a l e 2 1 2 1 1 9 1 9 5 4 73 3 6 0 12 30 .0 4 1 . 0 0 .25 0 .34 7 8 , 0 0 0 T e s t Wel l 38N11B-1 .8C Vi l l age of H i n s d a l e 2 9 1 1 9 8 1 9 5 4 73 3 8 8 7 55 .5 80 .8 0 .28 0 .41 N 1 4 2 A 5 6 1 6 0 , 0 0 0 T e s t Wel l 3 8 N 1 1 E - H i n s d a l e S a n . D i s t . 2 0 0 1 8 2 1 9 5 7 22 1 5 0 1 2 6 1.2 1.3 0 . 0 1 0 .01 2 , 0 0 0 T e s t Wel l 3 8 N 1 1 E - I l l . Toll H w y Comm. 2 3 8 1 3 8 1 9 5 7 2 5 1 5 7 55 2.9 3 .1 0 .02 0.02 5 ,000 Wel l No. 1 3 8 N 1 1 E - 2 4 . 3 b I n t e r n a t i o n a l
H a r v e s t e r Co. 2 9 4 2 3 9 1 9 5 6 4 7 8 4 0 0 20 20 .0 25 .2 0 .08 0 .11 N 1 7 5 A 5 0 M 1 4 3 8 , 0 0 0 Wel l No . 1 3 8 N 1 1 E - 2 4 . 4 b 1 I n t e r n a t i o n a l
H a r v e s t e r Co. 3 9 8 2 9 6 1 9 5 7 70 5 0 0 10 50.0 84 .8 0 .17 0 .29 N 1 7 3 A 6 0 M 6 3 1 7 0 , 0 0 0 Wel l No. 2 3 8 N 1 1 E - 2 4 . 4 b 2 I n t e r n a t i o n a l
H a r v e s t e r Co. 2 9 4 1 9 9 1 9 5 7 8 7 3 5 8 0 10 58 .0 108 .0 0 .29 0 .54 N 1 7 5 A 2 4 2 2 2 , 0 0 0 Wel l No. 3 3 8 N 1 1 E - 2 8 . 1 c B r o o k h a v e n M a n o r 3 1 7 2 1 8 1 9 6 0 3 1 1 5 1 0 0 90 1.1 1.1 0 .05 0 . 0 1 N 1 5 1 A 5 5 M 1 2 2 , 0 0 0 Wel l No . 2 3 8 N 1 1 E - 3 0 . 5 d M a p l e Cres t L a k e
C o u n t r y Club 3 9 5 2 5 0 1 9 5 8 8 1 3 4 3 2 0 22 14 .5 1 9 . 5 0.06 0 .06 N 1 7 5 A 1 7 0 M 5 3 4 , 0 0 0 3 8 N H E - 3 3 . 2 b C a s s School Dis t . 63 2 5 0 1 5 5 1 9 5 8 8 90 1 4 7 10 14 .7 17 .3 0 .10 0 .11 N 1 4 0 A 1 5 3 2 , 0 0 0 Well No. 1 3 9 N 9 E - 3 Campbe l l S o u p Co. 2 5 0 1 5 5 1 9 4 6 6 4 2 8 2 5 56 .4 70 .7 0 .36 0.46 1 4 0 , 0 0 0 Wel l No. 1 3 9 N 9 E - 3 . 1 h l Campbel l S o u p Co. 2 5 5 1 6 0 1 9 4 7 4 5 180 15 .0 12.0 13 .6 0 .08 0 .09 N 3 0 A 8 7 M 4 3 2 4 , 0 0 0 Wel l No . 2 3 9 N 9 E - 3 . 1 h 2 Campbel l S o u p Co. 2 4 8 1 5 4 1 9 5 8 4 6 8 7 5 78 1.0 1.0 0 .01 0 .01 N 3 1 A 8 7 M 3 6 2 ,000 Wel l No . 4 3 9 N 9 E - 4 . 2 b Ci ty of W. Chicago 3 1 0 2 2 8 1 9 5 0 7 3 5 1 0 4 1 12 .4 18 .9 0 .05 0 .08 N 5 6 A 7 2 M 1 0 0 3 4 , 0 0 0 Wel l No. 3 3 9 N 9 E - 4 . 4 a Ci ty of W. Chicago 3 2 2 2 3 3 1 9 4 7 82 500 1 8 2 7 . 8 44 .6 0.12 0.19 N 6 0 A 7 5 M 9 8 8 5 , 0 0 0 Wel l No . 2 3 9 N 9 E - 5 . 5 g l W e s t e r n E l e c t r i c Co. 2 6 5 2 0 0 1 9 5 8 87 2 1 5 3.5 61 .3 154 .0 0 .30 0.77 N 2 7 A 7 0 M 1 0 3 3 2 0 , 0 0 0 Wel l No. 3 3 9 N 9 E - 5 . 5 g 2 W e s t e r n E l e c t r i c Co. 2 5 7 1 9 3 1 9 5 8 2 . 5 77 1 9 6 19 10 .3 11 .6 0 .05 0.06 N 2 7 A 7 0 M 9 8 2 0 , 0 0 0 Wel l No . 2 3 9 N 9 E - 7 . 6 h W e s t e r n E l e c t r i c Co. 2 6 8 2 0 4 1 9 5 8 10 78 5 4 2 4 0 1 3 . 5 22 .9 0.07 0 .11 N 3 0 A 7 5 M 9 8 4 2 , 0 0 0 Wel l No . 1 3 9 N 9 E - 9 . 3 d L i n d s a y Chemica l Co. 3 3 2 2 4 3 1 9 5 3 72 8 0 0 3 8 2 1 . 1 50 .6 0 .09 0.22 N 4 0 A 9 0 M 1 1 2 9 8 , 0 0 0 Wel l No . 2 3 9 N 9 E - 9 . 3 h N o r t h w e s t e r n Chemica l
Co. 3 2 0 2 4 5 1 9 5 7 9 5 1 5 0 1 1 13 .6 1 5 . 1 0.06 0 .06 N 6 0 A 7 6 M 1 0 2 7 , 0 0 0 Wel l No. 1 3 9 N 9 E - 9 . 6 e Molded P r o d u c t s Corp . 3 3 0 2 3 7 1 9 5 3 86 4 6 5 32 14 .5 21 .3 0 .06 0.09 N 2 7 A 1 1 0 M 1 0 0 3 9 , 0 0 0 Wel l No . 1 3 9 N 9 E - 1 2 . 4 b Winf ie ld S a n i t o r i u m 2 0 0 7 5 1 9 3 9 3 4 6 60 9 6.7 6.9 0 .09 0 .09 N 4 7 A 2 8 1 0 , 0 0 0 3 9 N 9 E - 1 3 . 6 c l V i l l age of Winfie ld 3 3 5 2 0 5 1 9 5 8 8 85 4 0 0 5 80 1 2 2 . 0 0 .39 0 .60 N 6 8 A 4 5 M 9 2 2 4 5 , 0 0 0 Vi l l age Wel l No . 2 3 9 N 9 E - 1 3 . 6 c l V i l l age of Winfie ld 2 5 4 1 2 4 1 9 5 7 7 5 2 3 4 63 3.7 4 .3 6 .03 0 .03 N 6 8 A 4 5 M 1 1 7 ,000 V i l l a g e Wel l No . 2 3 9 N 9 E - 3 5 . 1 a E l m h u r s t - C h i c a g o
S t o n e Co. 2 7 3 2 1 8 1 9 5 7 17 5 7 0 16 35 .6 6 4 . 8 0 .16 0.30 N 5 0 A 6 0 M 1 0 8 1 2 8 , 0 0 0 Wel l No. 2
[97 ]
. . . . . . . . . . . .. . . . . . . . . . . .
. . . . . .
. . . . . .
. . . . . . . . . . . . . . . . . . . . . . . .
. . . . . . . . . . . .. . . . . . . . . . . .
....
.... ....
....
....
.... .... .... ....
....
....
....
....
.... .... .... .... ....
....
.... ....
.... .... ....
.... .... ....
.... ....
....
....
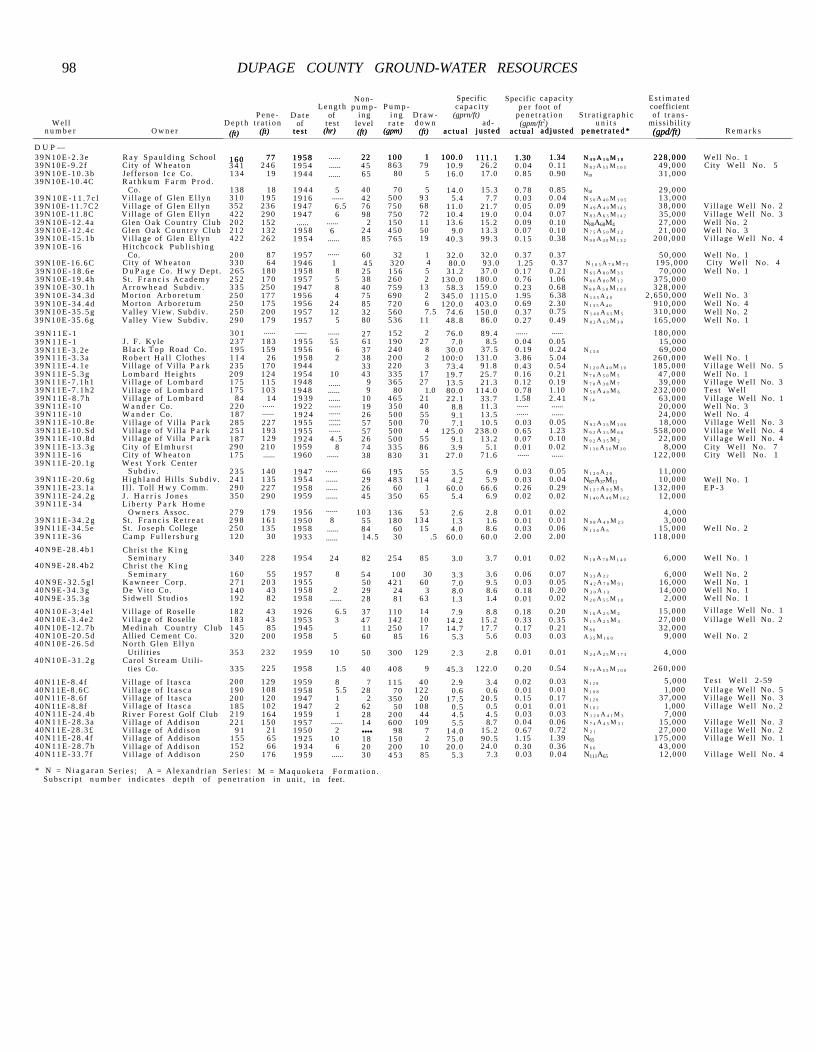
98 DUPAGE COUNTY GROUND-WATER RESOURCES
Non- Specific Specific c apac i t y E s t i m a t e d L e n g t h p u m p P u m p c a p a c i t y p e r foot of coefficient
P e n e - D a t e of i n g i n g D r a w (gprn/ft) p e n e t r a t i o n S t r a t i g r a p h i c of t r a n s -Wel l D e p t h t r a t i o n of t e s t level r a t e d o w n ad (gpm/ft2) u n i t s miss ib i l i ty
n u m b e r O w n e r (ft)
1 6 0
(ft)
77
t e s t
1 9 5 8
(hr) (ft)
22
(gpm)
1 0 0
(ft)
1
a c t u a l
100 .0
j u s t e d
1 1 1 . 1
a c t u a l
1.30
ad jus t ed
1.34
p e n e t r a t e d *
N 4 9 A 1 6 M 1 8
(gpd/ft)
2 2 8 , 0 0 0
R e m a r k s
D U P — 3 9 N 1 0 E - 2 . 3 e R a y S p a u l d i n g School
(ft)
1 6 0
(ft)
77
t e s t
1 9 5 8
(hr) (ft)
22
(gpm)
1 0 0
(ft)
1
a c t u a l
100 .0
j u s t e d
1 1 1 . 1
a c t u a l
1.30
ad jus t ed
1.34
p e n e t r a t e d *
N 4 9 A 1 6 M 1 8
(gpd/ft)
2 2 8 , 0 0 0 Wel l No . 1 3 9 N 1 0 E - 9 . 2 f Ci ty of W h e a t o n 3 4 1 2 4 6 1 9 5 4 4 5 8 6 3 79 10 .9 26 .2 0 .04 0 . 1 1 N 8 2 A 5 5 M 1 0 5 4 9 , 0 0 0 City Wel l No. 5 3 9 N 1 0 E - 1 0 . 3 b Jefferson I c e Co. 1 3 4 19 1 9 4 4 6 5 80 5 16 .0 17.0 0 .85 0.90 N19 3 1 , 0 0 0 39N10E-10 .4C R a t h k u m F a r m P r o d .
Co. 1 3 8 18 1 9 4 4 5 4 0 70 5 14 .0 15 .3 0 .78 0 .85 N18 2 9 , 0 0 0 3 9 N 1 0 E - 1 1 . 7 c l V i l l a g e of Glen E l l y n 3 1 0 1 9 5 1 9 1 6 4 2 5 0 0 9 3 5.4 7.7 0 .03 0 . 0 4 N 5 0 A 4 0 M 1 0 5 1 3 , 0 0 0 39N10E-11 .7C2 Vi l l age of G l e n E l l y n 3 5 2 2 3 6 1 9 4 7 6.5 76 7 5 0 6 8 11 .0 21 .7 0 .05 0 .09 N 4 9 A 4 0 M l 4 5 3 8 , 0 0 0 Vi l l age Wel l No. 2 39N10E-11 .8C Vi l l age of Glen E l l y n 4 2 2 2 9 0 1 9 4 7 6 98 7 5 0 72 10 .4 19 .0 0 . 0 4 0.07 N 8 3 A 6 5 M l 4 2 35 ,000 Vi l l age Wel l No. 3 3 9 N 1 0 E - 1 2 . 4 a Glen O a k C o u n t r y Club 2 0 2 152 2 1 5 0 1 1 13 .6 15.2 0 .09 0.10 N80A68M4 2 7 , 0 0 0 Well No. 2 3 9 N 1 0 E - 1 2 . 4 c Glen O a k C o u n t r y Club 2 1 2 1 3 2 1 9 5 8 6 2 4 4 5 0 50 9.0 13 .3 0 .07 0.10 N 7 5 A 5 0 M 1 2 2 1 , 0 0 0 Wel l No . 3 3 9 N 1 0 E - 1 5 . 1 b Vi l l age of Glen E l lyn 4 2 2 2 6 2 1 9 5 4 8 5 7 6 5 19 4 0 . 3 99 .3 0 .15 0 .38 N 9 0 A 4 0 M 1 3 2 2 0 0 , 0 0 0 Vi l l age Wel l No. 4 3 9 N 1 0 E - 1 6 H i t c h c o c k P u b l i s h i n g
Co. 2 0 0 87 1 9 5 7 60 32 1 32 .0 32 .0 0 .37 0.37 5 0 , 0 0 0 Wel l No. 1 39N10E-16 .6C City of W h e a t o n 3 3 0 64 1 9 4 6 1 4 5 3 2 0 4 80 .0 93 .0 1.25 0.37 N 1 0 5 A 7 0 M 7 5 1 9 5 , 0 0 0 City Wel l No . 4 3 9 N 1 0 E - 1 8 . 6 e D u P a g e Co. H w y D e p t . 2 6 5 1 8 0 1 9 5 8 8 2 5 1 5 6 5 31 .2 37 .0 0 .17 0 .21 N 6 5 A 8 0 M 3 5 7 0 , 0 0 0 Wel l No. 1 3 9 N 1 0 E - 1 9 . 4 h St . F r a n c i s A c a d e m y 2 5 2 1 7 0 1 9 5 7 5 3 8 2 6 0 2 1 3 0 . 0 1 8 0 . 0 0 .76 1.06 N 8 0 A 8 0 M 1 2 3 7 5 , 0 0 0 3 9 N 1 0 E - 3 0 . 1 h A r r o w h e a d S u b d i v . 3 3 5 2 5 0 1 9 4 7 8 40 7 5 9 13 58 .3 1 5 9 . 0 0 .23 0 .68 N 8 0 A 5 0 M 1 0 5 3 2 8 , 0 0 0 3 9 N 1 0 E - 3 4 . 3 d M o r t o n A r b o r e t u m 2 5 0 1 7 7 1 9 5 6 4 7 5 6 9 0 2 3 4 5 . 0 1 1 1 5 . 0 1.95 6.38 N 1 3 5 A 4 0 2 , 6 5 0 , 0 0 0 Wel l No . 3 3 9 N 1 0 E - 3 4 . 4 d M o r t o n A r b o r e t u m 2 5 0 175 1 9 5 6 2 4 85 7 2 0 6 1 2 0 . 0 4 0 3 . 0 0.69 2 .30 N 1 3 5 A 4 0 9 1 0 , 0 0 0 Well No . 4 3 9 N 1 0 E - 3 5 . 5 g Va l l ey View. S u b d i v . 2 5 0 2 0 0 1 9 5 7 12 32 5 6 0 7.5 74 .6 1 5 0 . 0 0.37 0 .75 N 1 4 0 A 6 5 M 5 3 1 0 , 0 0 0 Wel l No. 2 3 9 N 1 0 E - 3 5 . 6 g Val ley V i e w S u b d i v . 2 9 0 1 7 9 1 9 5 7 5 80 5 3 6 1 1 4 8 . 8 86 .0 0 .27 0.49 N 8 2 A 6 5 M 3 0 1 6 5 , 0 0 0 Wel l No. 1
3 9 N 1 1 E - 1 3 0 1 27 1 5 2 2 76 .0 89 .4 1 8 0 , 0 0 0 3 9 N 1 1 E - 1 J . F . Kyle 2 3 7 1 8 3 1 9 5 5 5.5 6 1 1 9 0 27 7.0 8.5 0 .04 0 .05 1 5 , 0 0 0 3 9 N 1 1 E - 3 . 2 e B l a c k T o p Road Co. 1 9 5 1 5 9 1 9 5 6 6 37 2 4 0 8 30 .0 37 .5 0.19 0 .24 N 1 5 8 6 9 , 0 0 0 3 9 N 1 1 E - 3 . 3 a R o b e r t H a l l Clothes 1 1 4 2 6 1 9 5 8 2 3 8 2 0 0 2 100 :0 1 3 1 . 0 3 .86 5 .04 2 6 0 , 0 0 0 Wel l N o . 1 3 9 N 1 1 E - 4 . 1 e Vi l lage of Vil la P a r k 2 3 5 170 1 9 4 4 33 2 2 0 3 7 3 . 4 91 .8 0 .43 0 .54 N 1 2 0 A 4 0 M 1 0 1 8 5 , 0 0 0 V i l l a g e Wel l No. 5 3 9 N 1 1 E - 5 . 3 g L o m b a r d H e i g h t s 2 0 9 1 2 4 1 9 5 4 10 4 3 3 3 5 17 19 .7 25 .7 0 .16 0 .21 N 7 0 A 5 0 M 5 4 7 , 0 0 0 Wel l No. 1 3 9 N 1 1 E - 7 . 1 h 1 Vi l l age of L o m b a r d 175 115 1 9 4 8 9 3 6 5 27 13 .5 21 .3 0 .12 0.19 N 7 0 A 3 8 M 7 3 9 , 0 0 0 Vi l l age Wel l No. 3 3 9 N 1 1 E - 7 . 1 h 2 Vi l l age of L o m b a r d 1 7 5 1 0 3 1 9 4 8 9 80 1.0 80 .0 1 1 4 . 0 0 .78 1.10 N 5 8 A 4 0 M 6 2 3 2 , 0 0 0 T e s t Wel l 3 9 N 1 1 E - 8 . 7 h Vi l l age of L o m b a r d 8 4 14 1 9 3 9 10 4 6 5 2 1 2 2 . 1 33 .7 1.58 2 .41 N l 4 6 3 , 0 0 0 Vi l l age Wel l No. 1 3 9 N 1 1 E - 1 0 W a n d e r Co. 2 2 0 1 9 2 2 19 3 5 0 4 0 8.8 11 .3 2 0 , 0 0 0 Wel l No. 3 3 9 N 1 1 E - 1 0 W a n d e r Co. 1 8 7 1 9 2 4 2 6 5 0 0 55 9 .1 13 .5 2 4 , 0 0 0 Wel l No. 4 3 9 N 1 1 E - 1 0 . 8 e Vi l l age of Vil la P a r k 2 8 5 227 1 9 5 5 57 5 0 0 70 7.1 10 .5 0.03 0 .05 N 9 2 A 3 5 M 1 0 0 1 8 , 0 0 0 Vi l l age Well No. 3 3 9 N 1 1 E - 1 0 . S d Vi l l age of Vi l la P a r k 2 5 1 1 9 3 1 9 5 5 57 5 0 0 4 1 2 5 . 0 2 3 8 . 0 0 .65 1.23 N 9 2 A 3 5 M 6 6 5 5 8 , 0 0 0 Vi l l age Wel l No. 4 3 9 N 1 1 E - 1 0 . 8 d V i l l a g e o f Vi l la P a r k 1 8 7 1 2 9 1 9 2 4 4 . 5 2 6 5 0 0 5 5 9 .1 13 .2 0 .07 0 .10 N 9 2 A 3 5 M 2 2 2 , 0 0 0 V i l l a g e Wel l No. 4 3 9 N 1 1 E - 1 3 . 3 g City of E l m h u r s t 2 9 0 2 1 0 1 9 5 9 8 7 4 3 3 5 86 3.9 5.1 0 .01 0 .02 N 1 3 0 A 5 0 M 3 0 8,000 City Wel l No . 7 3 9 N 1 1 E - 1 6 City of W h e a t o n 1 7 5 1 9 6 0 38 8 3 0 3 1 27 .0 71 .6 1 2 2 , 0 0 0 City Wel l No. 1 3 9 N 1 1 E - 2 0 . 1 g W e s t Y o r k Cen te r
S u b d i v . 2 3 5 1 4 0 1 9 4 7 66 195 55 3.5 6.9 0 .03 0 .05 N 1 2 0 A 2 0 1 1 , 0 0 0 3 9 N 1 1 E - 2 0 . 6 g H i g h l a n d Hi l l s S u b d i v . 2 4 1 135 1 9 5 4 29 4 8 3 114 4.2 5.9 0 .03 0 .04 N87A37M11 1 0 , 0 0 0 Wel l No. 1 3 9 N 1 1 E - 2 3 . 1 a I l l . Toll H w y Comm. 2 9 0 2 2 7 1 9 5 8 2 6 60 1 60 .0 66 .6 0 .26 0.29 N 1 2 7 A 9 5 M 5 1 3 2 , 0 0 0 E P - 3 3 9 N 1 1 E - 2 4 . 2 g J . H a r r i s J o n e s 3 5 0 2 9 0 1 9 5 9 4 5 3 5 0 65 5.4 6.9 0.02 0.02 N 1 4 0 A 4 8 M 1 0 2 1 2 , 0 0 0 3 9 N 1 1 E - 3 4 L i b e r t y P a r k H o m e
O w n e r s Assoc . 2 7 9 1 7 9 1 9 5 6 1 0 3 1 3 6 53 2 .6 2.8 0 . 0 1 0.02 4 , 0 0 0 3 9 N 1 1 E - 3 4 . 2 g St. F r a n c i s R e t r e a t 2 9 8 1 6 1 1 9 5 0 8 5 5 1 8 0 1 3 4 1.3 1.6 0 . 0 1 0 . 0 1 N 9 8 A 4 0 M 2 3 3 ,000 3 9 N 1 1 E - 3 4 . 5 e St . J o s e p h College 2 5 0 1 3 5 1 9 5 8 8 4 60 15 4 .0 8.6 0 .03 0 .06 N 1 3 0 A 5 1 5 , 0 0 0 Wel l No . 2 3 9 N 1 1 E - 3 6 C a m p F u l l e r s b u r g 1 2 0 30 1 9 3 3 14 .5 30 .5 60 .0 60 .0 2 .00 2 .00 1 1 8 , 0 0 0 4 0 N 9 E - 2 8 . 4 b 1 C h r i s t t h e K i n g
S e m i n a r y 3 4 0 2 2 8 1 9 5 4 24 82 2 5 4 85 3.0 3.7 0 .01 0.02 N 1 8 A 7 0 M 1 4 0 6 ,000 Wel l No. 1 4 0 N 9 E - 2 8 . 4 b 2 C h r i s t t h e K i n g
S e m i n a r y 1 6 0 55 1 9 5 7 8 5 4 1 0 0 30 3.3 3.6 0 .06 0.07 N 3 3 A 2 2 6 ,000 Wel l No. 2 4 0 N 9 E - 3 2 . 5 g l K a w n e e r Corp . 2 7 1 2 0 3 1 9 5 5 50 4 2 1 60 7.0 9.5 0 .03 0 .05 N 4 2 A 7 0 M 9 1 1 6 , 0 0 0 Wel l No. 1 4 0 N 9 E - 3 4 . 3 g De V i to Co. 1 4 0 4 3 1 9 5 8 2 29 2 4 3 8.0 8.6 0 .18 0.20 N 3 0 A 1 3 1 4 , 0 0 0 Wel l No. 1 4 0 N 9 E - 3 5 . 3 g S idwel l S t u d i o s 1 9 2 82 1 9 5 8 2 8 8 1 6 3 1.3 1.4 0 . 0 1 0 .02 N 2 0 A 5 5 M 1 0 2 , 0 0 0 Wel l No. 1
4 0 N 1 0 E - 3 ; 4 e l Vi l l age of Rosel le 1 8 2 4 3 1 9 2 6 6.5 37 110 14 7.9 8.8 0.18 0 .20 N 1 6 A 2 5 M 2 1 5 , 0 0 0 Vi l l age Well No. 1 4 0 N 1 0 E - 3 . 4 e 2 Vi l l age of Roselle 1 8 3 4 3 1 9 5 3 3 4 7 142 10 14 .2 15.2 0 .33 0 .35 N 1 5 A 2 5 M 3 2 7 , 0 0 0 Vi l lage Wel l No. 2 4 0 N 1 0 E - 1 2 . 7 b M e d i n a h C o u n t r y Club 1 4 5 85 1 9 4 5 1 1 2 5 0 17 14 .7 17 .7 0.17 0 .21 N 8 6 3 2 , 0 0 0 4 0 N 1 0 E - 2 0 . 5 d Allied C e m e n t Co. 3 2 0 2 0 0 1 9 5 8 5 60 85 16 5.3 5.6 0.03 0 .03 A 3 5 M 1 6 0 9 ,000 Wel l No. 2 4 0 N 1 0 E - 2 6 . 5 d N o r t h Glen E l l y n
Ut i l i t ies 3 5 3 2 3 2 1 9 5 9 10 50 3 0 0 1 2 9 2 .3 2.8 0 .01 0 .01 N 2 4 A 2 5 M 1 7 3 4 , 0 0 0 4 0 N 1 0 E - 3 1 . 2 g Caro l S t r e a m Uti l i
t ies Co. 3 3 5 2 2 5 1 9 5 8 1.5 4 0 4 0 8 9 45 .3 122 .0 0 .20 0 .54 N 7 0 A 5 5 M 1 0 0 2 6 0 , 0 0 0
4 0 N 1 1 E - 8 . 4 f Vi l lage of I t a s c a 2 0 0 1 2 9 1 9 5 9 8 7 1 1 5 4 0 2.9 3.4 0.02 0 .03 N 1 2 9 5,000 T e s t W e l l 2-59 4 0 N 1 1 E - 8 . 6 C Vi l l age of I t a s c a 1 9 0 1 0 8 1 9 5 8 5.5 2 8 70 1 2 2 0.6 0.6 0 .01 0 .01 N 1 0 8 1,000 V i l l a g e Wel l No . 5 4 0 N 1 1 E - 8 . 6 f Vi l l age of I t a s c a 2 0 0 1 2 0 1 9 4 7 1 2 3 5 0 20 17 .5 20 .5 0 .15 0.17 N 1 2 0 3 7 , 0 0 0 Vi l l age Wel l No. 3 4 0 N 1 1 E - 8 . 8 f V i l l age of I t a s c a 1 8 5 102 1 9 4 7 2 62 50 108 0.5 0.5 0 .01 0 .01 N 1 0 2 1,000 Vi l lage Wel l No . : 2 4 0 N 1 1 E - 2 4 . 4 b R i v e r F o r e s t Golf Club 2 1 9 1 6 4 1 9 5 9 1 2 8 2 0 0 4 4 4 .5 4 .5 0 .03 0 .03 N 1 2 0 A 4 1 M 3 7 ,000 4 0 N 1 1 E - 2 8 . 3 a Vi l l age of Add i son 2 2 1 1 5 0 1 9 5 7 1 4 6 0 0 109 5.5 8.7 0 .04 0.06 N 7 4 A 4 5 M 3 1 1 5 , 0 0 0 Vi l l age Wel l No. 3 4 0 N 1 1 E - 2 8 . 3 £ Vi l l age of A d d i s o n 9 1 2 1 1 9 5 0 2 9 8 7 14 .0 15 .2 0 .67 0 .72 N 2 1 2 7 , 0 0 0 Vi l l age Wel l No. 2 4 0 N 1 1 E - 2 8 . 4 f V i l l age of Add i son 1 5 5 6 5 1 9 2 5 10 18 1 5 0 2 75 .0 90 .5 1.15 1.39 N65 1 7 5 , 0 0 0 Vi l l age Wel l No. 1 4 0 N 1 1 E - 2 8 . 7 b Vi l l age of Add i son 152 66 1 9 3 4 6 20 2 0 0 10 20 .0 24 .0 0 .30 0 .36 N 6 6 4 3 , 0 0 0 4 0 N 1 1 E - 3 3 . 7 f V i l l age of A d d i s o n 2 5 0 1 7 6 1 9 5 9 3 0 4 5 3 85 5.3 7.3 0.03 0 .04 N111A65 1 2 , 0 0 0 Vi l l age Wel l No . 4
* N = N i a g a r a n S e r i e s ; A = A l e x a n d r i a n S e r i e s : M = M a q u o k e t a F o r m a t i o n . S u b s c r i p t n u m b e r i n d i c a t e s dep th o f p e n e t r a t i o n in u n i t , i n feet .
......
...... ......
......
......
......
...... ......
......
..................
...... ......
......
......
......
............
......
......
......
............
......
......
............
......
........................
......
......
......
......
......
..................
....
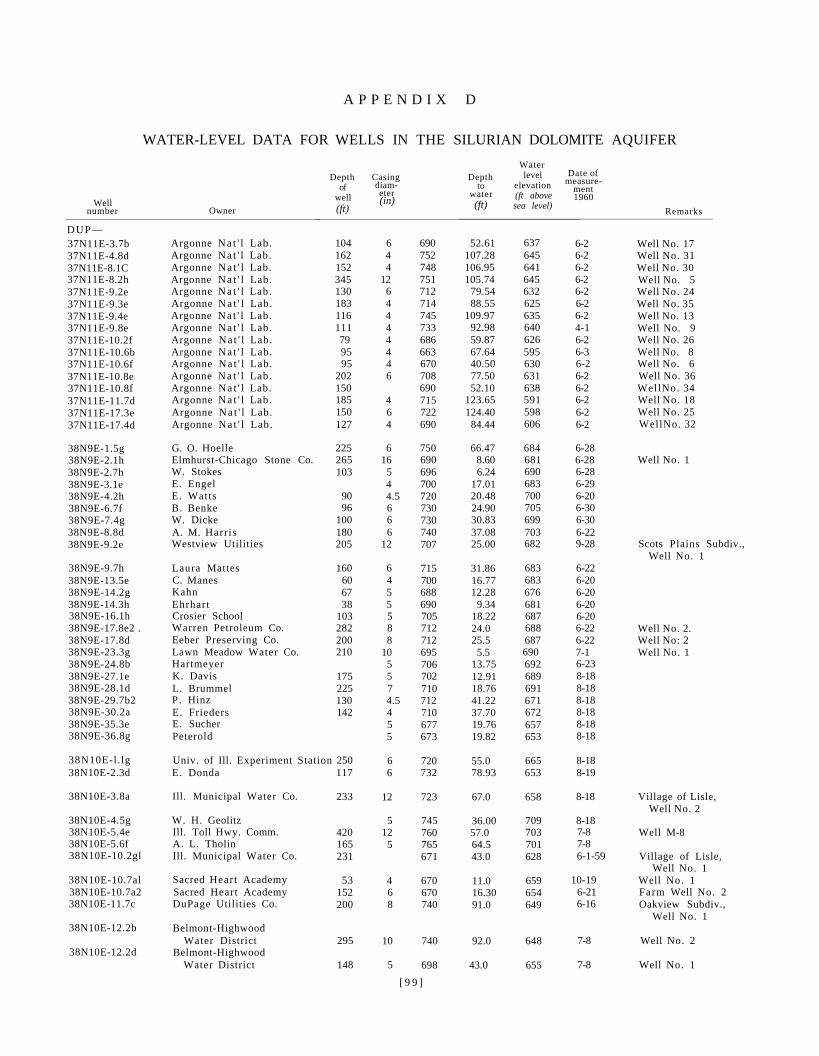
A P P E N D I X D
WATER-LEVEL DATA FOR WELLS IN THE SILURIAN DOLOMITE AQUIFER
Well number Owner
Depth of
well (ft)
Casing diameter (in)
Depth to
water (ft)
Water level
elevation (ft above sea level)
Date of measure
ment 1960
Remarks
DUP— 37N11E-3.7b Argonne N a t ' l Lab. 104 6 690 52.61 637 6-2 Well No. 17 37N11E-4.8d Argonne N a t ' l Lab. 162 4 752 107.28 645 6-2 Well No. 31 37N11E-8.1C Argonne N a t ' l Lab. 152 4 748 106.95 641 6-2 Well No. 30 37N11E-8.2h Argonne N a t ' l Lab. 345 12 751 105.74 645 6-2 Well No. 5 37N11E-9.2e Argonne N a t ' l Lab. 130 6 712 79.54 632 6-2 Well No. 24 37N11E-9.3e Argonne N a t ' l Lab. 183 4 714 88.55 625 6-2 Well No. 35 37N11E-9.4e Argonne N a t ' l Lab. 116 4 745 109.97 635 6-2 Well No. 13 37N11E-9.8e Argonne N a t ' l Lab. 111 4 733 92.98 640 4-1 Well No. 9 37N11E-10.2f Argonne N a t ' l Lab. 79 4 686 59.87 626 6-2 Well No. 26 37N11E-10.6b Argonne N a t ' l Lab. 95 4 663 67.64 595 6-3 Well No. 8 37N11E-10.6f Argonne N a t ' l Lab. 95 4 670 40.50 630 6-2 Well No. 6 37N11E-10.8e Argonne N a t ' l Lab. 202 6 708 77.50 631 6-2 Well No. 36 37N11E-10.8f Argonne N a t ' l Lab. 150 690 52.10 638 6-2 WellNo. 34 37N11E-11.7d Argonne N a t ' l Lab. 185 4 715 123.65 591 6-2 Well No. 18 37N11E-17.3e Argonne N a t ' l Lab. 150 6 722 124.40 598 6-2 Well No. 25 37N11E-17.4d Argonne N a t ' l Lab. 127 4 690 84.44 606 6-2 WellNo. 32
38N9E-1.5g G. O. Hoelle 225 6 750 66.47 684 6-28 38N9E-2.1h Elmhurst-Chicago Stone Co. 265 16 690 8.60 681 6-28 Well No. 1 38N9E-2.7h W. Stokes 103 5 696 6.24 690 6-28 38N9E-3.1e E. Engel 4 700 17.01 683 6-29 38N9E-4.2h E. Watts 90 4.5 720 20.48 700 6-20 38N9E-6.7f B. Benke 96 6 730 24.90 705 6-30 38N9E-7.4g W. Dicke 100 6 730 30.83 699 6-30 38N9E-8.8d A. M. Harris 180 6 740 37.08 703 6-22 38N9E-9.2e Westview Utilities 205 12 707 25.00 682 9-28 Scots Plains Subdiv.,
Well No. 1 38N9E-9.7h Laura Mattes 160 6 715 31.86 683 6-22 38N9E-13.5e C. Manes 60 4 700 16.77 683 6-20 38N9E-14.2g Kahn 67 5 688 12.28 676 6-20 38N9E-14.3h Ehrhart 38 5 690 9.34 681 6-20 38N9E-16.1h Crosier School 103 5 705 18.22 687 6-20 38N9E-17.8e2 . Warren Petroleum Co. 282 8 712 24.0 688 6-22 Well No. 2. 38N9E-17.8d Eeber Preserving Co. 200 8 712 25.5 687 6-22 Well No: 2 38N9E-23.3g Lawn Meadow Water Co. 210 10 695 5.5 690 7-1 Well No. 1 38N9E-24.8b Hartmeyer 5 706 13.75 692 6-23 38N9E-27.1e K. Davis 175 5 702 12.91 689 8-18 38N9E-28.1d L. Brummel 225 7 710 18.76 691 8-18 38N9E-29.7b2 P. Hinz 130 4.5 712 41.22 671 8-18 38N9E-30.2a E. Frieders 142 4 710 37.70 672 8-18 38N9E-35.3e E. Sucher 5 677 19.76 657 8-18 38N9E-36.8g Peterold 5 673 19.82 653 8-18
38N10E-l.lg Univ. of Ill. Experiment Station 250 6 720 55.0 665 8-18 38N10E-2.3d E. Donda 117 6 732 78.93 653 8-19
38N10E-3.8a Ill. Municipal Water Co. 233 12 723 67.0 658 8-18 Village of Lisle, Well No. 2
38N10E-4.5g W. H. Geolitz 5 745 36.00 709 8-18 38N10E-5.4e Ill. Toll Hwy. Comm. 420 12 760 57.0 703 7-8 Well M-8 38N10E-5.6f A. L. Tholin 165 5 765 64.5 701 7-8 38N10E-10.2gl Ill. Municipal Water Co. 231 671 43.0 628 6-1-59 Village of Lisle,
Well No. 1 38N10E-10.7al Sacred Heart Academy 53 4 670 11.0 659 10-19 Well No. 1 38N10E-10.7a2 Sacred Heart Academy 152 6 670 16.30 654 6-21 Farm Well No. 2 38N10E-11.7c DuPage Utilities Co. 200 8 740 91.0 649 6-16 Oakview Subdiv.,
Well No. 1 38N10E-12.2b Belmont-Highwood
Water District 295 10 740 92.0 648 7-8 Well No. 2 38N10E-12.2d Belmont-Highwood
Water District 148 5 698 43.0 655 7-8 Well No. 1
[ 9 9 ]
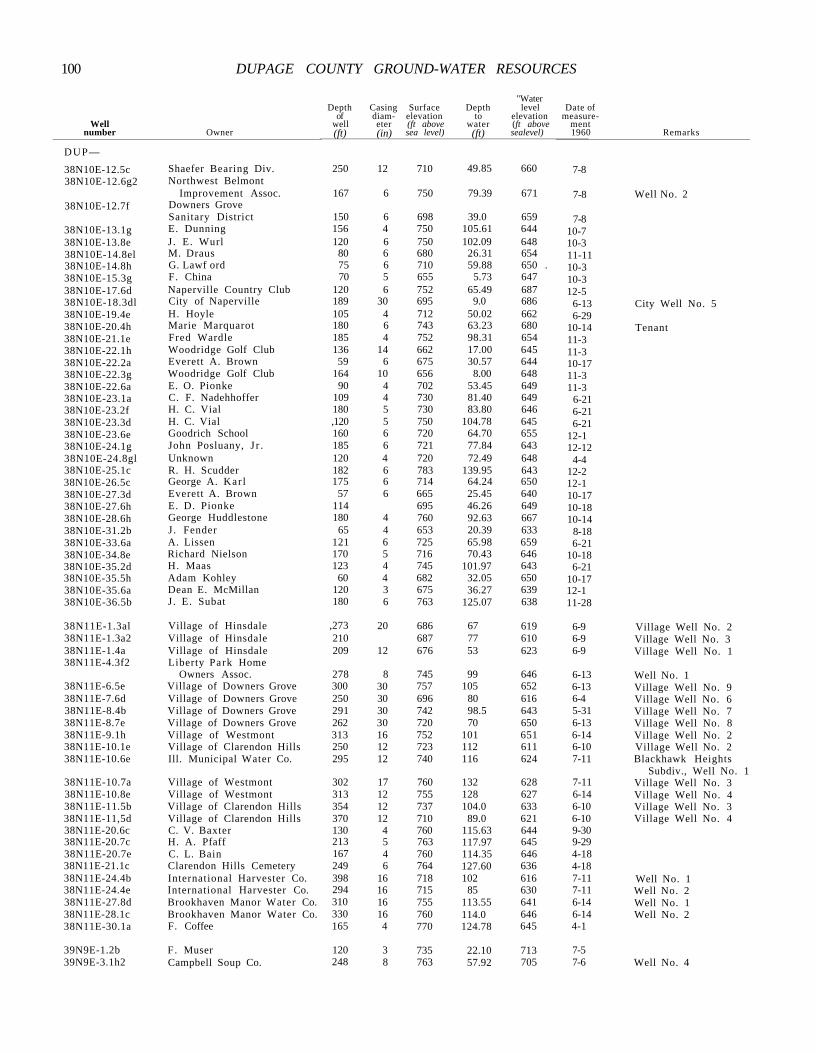
100 DUPAGE COUNTY GROUND-WATER RESOURCES
"Water Depth Casing Surface Depth level Date of
of diam elevation to elevation measureWell well eter (ft above water (ft above ment
number Owner (ft) (in) sea level) (ft) sealevel) 1960 Remarks
DUP—
38N10E-12.5c Shaefer Bearing Div. 250 12 710 49.85 660 7-8 38N10E-12.6g2 Northwest Belmont
Improvement Assoc. 167 6 750 79.39 671 7-8 Well No. 2 38N10E-12.7f Downers Grove
Sanitary District 150 6 698 39.0 659 7-8 38N10E-13.1g E. Dunning 156 4 750 105.61 644 10-7 38N10E-13.8e J. E. Wurl 120 6 750 102.09 648 10-3 38N10E-14.8el M. Draus 80 6 680 26.31 654 11-11 38N10E-14.8h G. Lawf ord 75 6 710 59.88 650 . 10-3 38N10E-15.3g F. China 70 5 655 5.73 647 10-3 38N10E-17.6d Naperville Country Club 120 6 752 65.49 687 12-5 38N10E-18.3dl City of Naperville 189 30 695 9.0 686 6-13 City Well No. 5 38N10E-19.4e H. Hoyle 105 4 712 50.02 662 6-29 38N10E-20.4h Marie Marquarot 180 6 743 63.23 680 10-14 Tenant 38N10E-21.1e Fred Wardle 185 4 752 98.31 654 11-3 38N10E-22.1h Woodridge Golf Club 136 14 662 17.00 645 11-3 38N10E-22.2a Everett A. Brown 59 6 675 30.57 644 10-17 38N10E-22.3g Woodridge Golf Club 164 10 656 8.00 648 11-3 38N10E-22.6a E. O. Pionke 90 4 702 53.45 649 11-3 38N10E-23.1a C. F. Nadehhoffer 109 4 730 81.40 649 6-21 38N10E-23.2f H. C. Vial 180 5 730 83.80 646 6-21 38N10E-23.3d H. C. Vial ,120 5 750 104.78 645 6-21 38N10E-23.6e Goodrich School 160 6 720 64.70 655 12-1 38N10E-24.1g John Posluany, J r . 185 6 721 77.84 643 12-12 38N10E-24.8gl Unknown 120 4 720 72.49 648 4-4 38N10E-25.1c R. H. Scudder 182 6 783 139.95 643 12-2 38N10E-26.5c George A. Kar l 175 6 714 64.24 650 12-1 38N10E-27.3d Everett A. Brown 57 6 665 25.45 640 10-17 38N10E-27.6h E. D. Pionke 114 695 46.26 649 10-18 38N10E-28.6h George Huddlestone 180 4 760 92.63 667 10-14 38N10E-31.2b J . Fender 65 4 653 20.39 633 8-18 38N10E-33.6a A. Lissen 121 6 725 65.98 659 6-21 38N10E-34.8e Richard Nielson 170 5 716 70.43 646 10-18 38N10E-35.2d H. Maas 123 4 745 101.97 643 6-21 38N10E-35.5h Adam Kohley 60 4 682 32.05 650 10-17 38N10E-35.6a Dean E. McMillan 120 3 675 36.27 639 12-1 38N10E-36.5b J . E. Subat 180 6 763 125.07 638 11-28
38N11E-1.3al Village of Hinsdale ,273 20 686 67 619 6-9 Village Well No. 2 38N11E-1.3a2 Village of Hinsdale 210 687 77 610 6-9 Village Well No. 3 38N11E-1.4a Village of Hinsdale 209 12 676 53 623 6-9 Village Well No. 1 38N11E-4.3f2 Liberty Park Home
Owners Assoc. 278 8 745 99 646 6-13 Well No. 1 38N11E-6.5e Village of Downers Grove 300 30 757 105 652 6-13 Village Well No. 9 38N11E-7.6d Village of Downers Grove 250 30 696 80 616 6-4 Village Well No. 6 38N11E-8.4b Village of Downers Grove 291 30 742 98.5 643 5-31 Village Well No. 7 38N11E-8.7e Village of Downers Grove 262 30 720 70 650 6-13 Village Well No. 8 38N11E-9.1h Village of Westmont 313 16 752 101 651 6-14 Village Well No. 2 38N11E-10.1e Village of Clarendon Hills 250 12 723 112 611 6-10 Village Well No. 2 38N11E-10.6e Ill. Municipal Water Co. 295 12 740 116 624 7-11 Blackhawk Heights
Subdiv., Well No. 1 38N11E-10.7a Village of Westmont 302 17 760 132 628 7-11 Village Well No. 3 38N11E-10.8e Village of Westmont 313 12 755 128 627 6-14 Village Well No. 4 38N11E-11.5b Village of Clarendon Hills 354 12 737 104.0 633 6-10 Village Well No. 3 38N11E-11,5d Village of Clarendon Hills 370 12 710 89.0 621 6-10 Village Well No. 4 38N11E-20.6c C. V. Baxter 130 4 760 115.63 644 9-30 38N11E-20.7c H. A. Pfaff 213 5 763 117.97 645 9-29 38N11E-20.7e C. L. Bain 167 4 760 114.35 646 4-18 38N11E-21.1c Clarendon Hills Cemetery 249 6 764 127.60 636 4-18 38N11E-24.4b International Harvester Co. 398 16 718 102 616 7-11 Well No. 1 38N11E-24.4e International Harvester Co. 294 16 715 85 630 7-11 Well No. 2 38N11E-27.8d Brookhaven Manor Water Co. 310 16 755 113.55 641 6-14 Well No. 1 38N11E-28.1c Brookhaven Manor Water Co. 330 16 760 114.0 646 6-14 Well No. 2 38N11E-30.1a F. Coffee 165 4 770 124.78 645 4-1
39N9E-1.2b F. Muser 120 3 735 22.10 713 7-5 39N9E-3.1h2 Campbell Soup Co. 248 8 763 57.92 705 7-6 Well No. 4
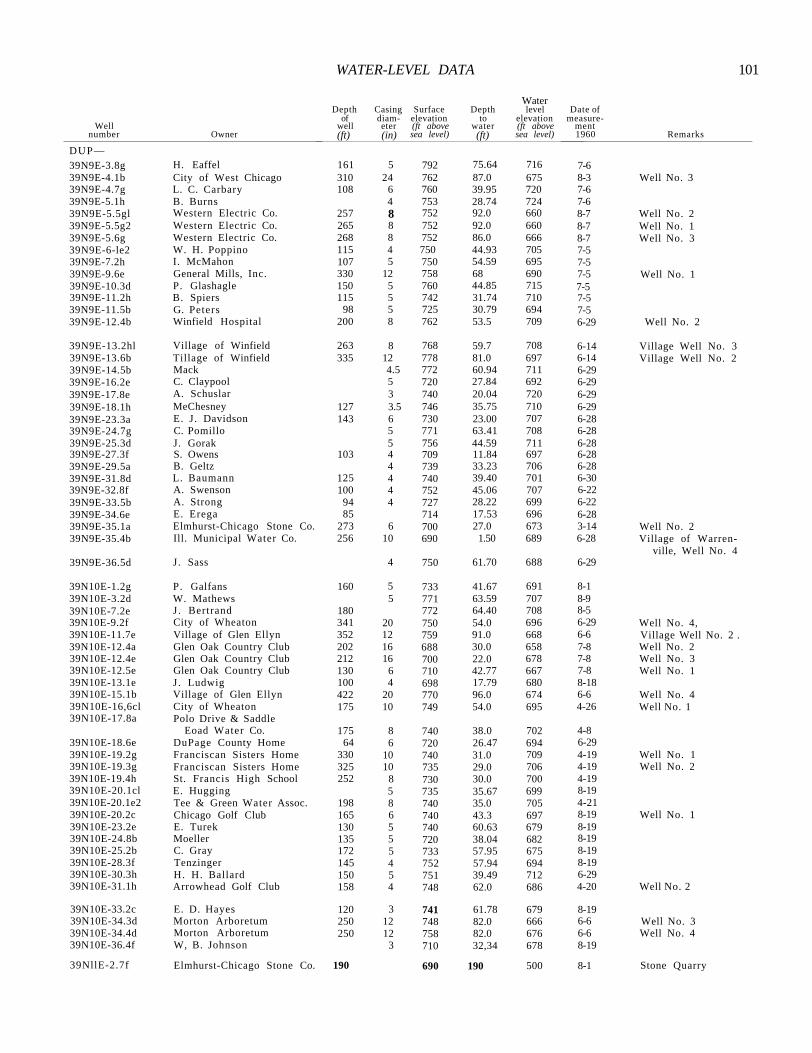
WATER-LEVEL DATA 101
Water Depth Casing Surface Depth level Date of
of diam elevation to elevation measureWell well eter (ft above water (ft above ment
number Owner (ft) (in) sea level) (ft) sea level) 1960 Remarks
DUP— 39N9E-3.8g H. Eaffel 161 5 792 75.64 716 7-6 39N9E-4.1b City of West Chicago 310 24 762 87.0 675 8-3 Well No. 3 39N9E-4.7g L. C. Carbary 108 6 760 39.95 720 7-6 39N9E-5.1h B. Burns 4 753 28.74 724 7-6 39N9E-5.5gl Western Electric Co. 257 8 752 92.0 660 8-7 Well No. 2 39N9E-5.5g2 Western Electric Co. 265 8 752 92.0 660 8-7 Well No. 1 39N9E-5.6g Western Electric Co. 268 8 752 86.0 666 8-7 Well No. 3 39N9E-6-le2 W. H. Poppino 115 4 750 44.93 705 7-5 39N9E-7.2h I. McMahon 107 5 750 54.59 695 7-5 39N9E-9.6e General Mills, Inc. 330 12 758 68 690 7-5 Well No. 1 39N9E-10.3d P. Glashagle 150 5 760 44.85 715 7-5 39N9E-11.2h B. Spiers 115 5 742 31.74 710 7-5 39N9E-11.5b G. Peters 98 5 725 30.79 694 7-5 39N9E-12.4b Winfield Hospital 200 8 762 53.5 709 6-29 Well No. 2
39N9E-13.2hl Village of Winfield 263 8 768 59.7 708 6-14 Village Well No. 3 39N9E-13.6b Tillage of Winfield 335 12 778 81.0 697 6-14 Village Well No. 2 39N9E-14.5b Mack 4.5 772 60.94 711 6-29 39N9E-16.2e C. Claypool 5 720 27.84 692 6-29 39N9E-17.8e A. Schuslar 3 740 20.04 720 6-29 39N9E-18.1h MeChesney 127 3.5 746 35.75 710 6-29 39N9E-23.3a E. J. Davidson 143 6 730 23.00 707 6-28 39N9E-24.7g C. Pomillo 5 771 63.41 708 6-28 39N9E-25.3d J. Gorak 5 756 44.59 711 6-28 39N9E-27.3f S. Owens 103 4 709 11.84 697 6-28 39N9E-29.5a B. Geltz 4 739 33.23 706 6-28 39N9E-31.8d L. Baumann 125 4 740 39.40 701 6-30 39N9E-32.8f A. Swenson 100 4 752 45.06 707 6-22 39N9E-33.5b A. Strong 94 4 727 28.22 699 6-22 39N9E-34.6e E. Erega 85 714 17.53 696 6-28 39N9E-35.1a Elmhurst-Chicago Stone Co. 273 6 700 27.0 673 3-14 Well No. 2 39N9E-35.4b Ill. Municipal Water Co. 256 10 690 1.50 689 6-28 Village of Warren-
ville, Well No. 4 39N9E-36.5d J. Sass 4 750 61.70 688 6-29
39N10E-1.2g P. Galfans 160 5 733 41.67 691 8-1 39N10E-3.2d W. Mathews 5 771 63.59 707 8-9 39N10E-7.2e J . Bertrand 180 772 64.40 708 8-5 39N10E-9.2f City of Wheaton 341 20 750 54.0 696 6-29 Well No. 4, 39N10E-11.7e Village of Glen Ellyn 352 12 759 91.0 668 6-6 Village Well No. 2 . 39N10E-12.4a Glen Oak Country Club 202 16 688 30.0 658 7-8 Well No. 2 39N10E-12.4e Glen Oak Country Club 212 16 700 22.0 678 7-8 Well No. 3 39N10E-12.5e Glen Oak Country Club 130 6 710 42.77 667 7-8 Well No. 1 39N10E-13.1e J . Ludwig 100 4 698 17.79 680 8-18 39N10E-15.1b Village of Glen Ellyn 422 20 770 96.0 674 6-6 Well No. 4 39N10E-16,6cl City of Wheaton 175 10 749 54.0 695 4-26 Well No. 1 39N10E-17.8a Polo Drive & Saddle
Eoad Water Co. 175 8 740 38.0 702 4-8 39N10E-18.6e DuPage County Home 64 6 720 26.47 694 6-29 39N10E-19.2g Franciscan Sisters Home 330 10 740 31.0 709 4-19 Well No. 1 39N10E-19.3g Franciscan Sisters Home 325 10 735 29.0 706 4-19 Well No. 2 39N10E-19.4h St. Francis High School 252 8 730 30.0 700 4-19 39N10E-20.1cl E. Hugging 5 735 35.67 699 8-19 39N10E-20.1e2 Tee & Green Water Assoc. 198 8 740 35.0 705 4-21 39N10E-20.2c Chicago Golf Club 165 6 740 43.3 697 8-19 Well No. 1 39N10E-23.2e E. Turek 130 5 740 60.63 679 8-19 39N10E-24.8b Moeller 135 5 720 38.04 682 8-19 39N10E-25.2b C. Gray 172 5 733 57.95 675 8-19 39N10E-28.3f Tenzinger 145 4 752 57.94 694 8-19 39N10E-30.3h H. H. Ballard 150 5 751 39.49 712 6-29 39N10E-31.1h Arrowhead Golf Club 158 4 748 62.0 686 4-20 Well No. 2
39N10E-33.2c E. D. Hayes 120 3 741 61.78 679 8-19 39N10E-34.3d Morton Arboretum 250 12 748 82.0 666 6-6 Well No. 3 39N10E-34.4d Morton Arboretum 250 12 758 82.0 676 6-6 Well No. 4 39N10E-36.4f W, B. Johnson 3 710 32,34 678 8-19
39NllE-2.7f Elmhurst-Chicago Stone Co. 190 690 190 500 8-1 Stone Quarry
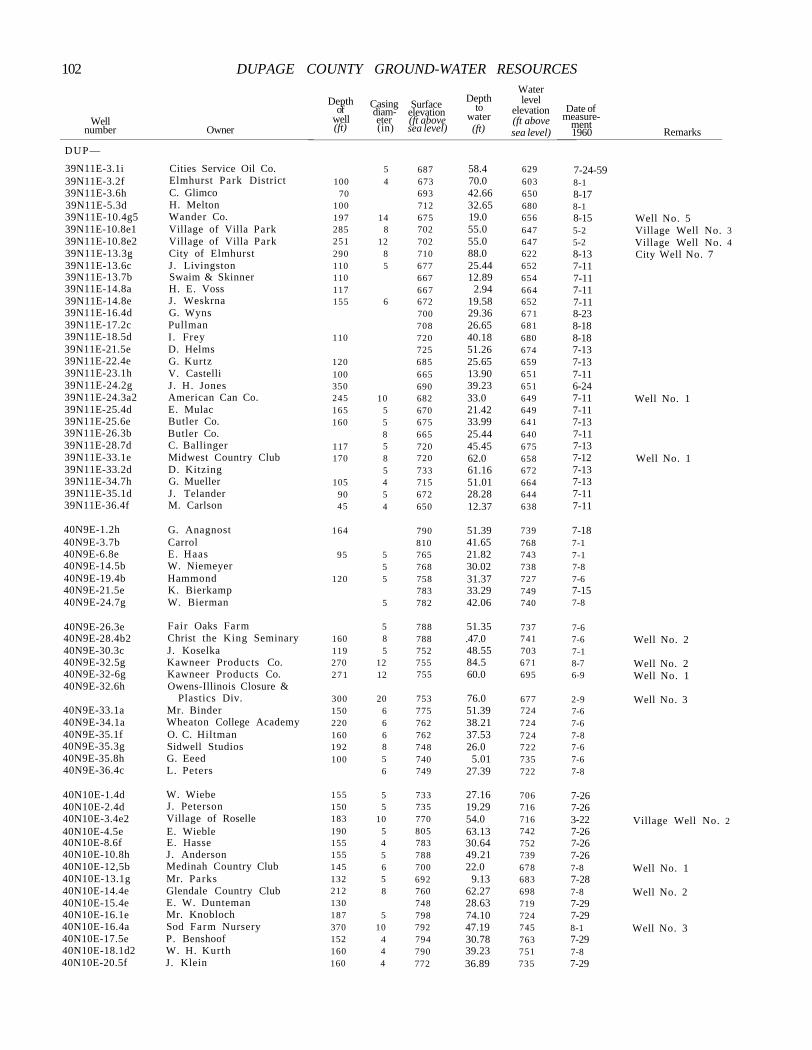
102 DUPAGE COUNTY GROUND-WATER RESOURCES
Well number Owner
Depth of
well (ft)
Casing diameter (in)
Surface elevation (ft above sea level)
Depth to
water (ft)
Water level
elevation (ft above sea level)
Date of measure
ment 1960 Remarks
DUP—
39N11E-3.1i Cities Service Oil Co. 5 687 58.4 629 7-24-59 39N11E-3.2f Elmhurst Park District 100 4 673 70.0 603 8-1 39N11E-3.6h C. Glimco 70 693 42.66 650 8-17 39N11E-5.3d H. Melton 100 712 32.65 680 8-1 39N11E-10.4g5 Wander Co. 197 14 675 19.0 656 8-15 Well No. 5 39N11E-10.8e1 Village of Villa Park 285 8 702 55.0 647 5-2 Village Well No. 3 39N11E-10.8e2 Village of Villa Park 251 12 702 55.0 647 5-2 Village Well No. 4 39N11E-13.3g City of Elmhurst 290 8 710 88.0 622 8-13 City Well No. 7 39N11E-13.6c J. Livingston 110 5 677 25.44 652 7-11 39N11E-13.7b Swaim & Skinner 110 667 12.89 654 7-11 39N11E-14.8a H. E. Voss 117 667 2.94 664 7-11 39N11E-14.8e J. Weskrna 155 6 672 19.58 652 7-11 39N11E-16.4d G. Wyns 700 29.36 671 8-23 39N11E-17.2c Pullman 708 26.65 681 8-18 39N11E-18.5d I. Frey 110 720 40.18 680 8-18 39N11E-21.5e D. Helms 725 51.26 674 7-13 39N11E-22.4e G. Kurtz 120 685 25.65 659 7-13 39N11E-23.1h V. Castelli 100 665 13.90 651 7-11 39N11E-24.2g J. H. Jones 350 690 39.23 651 6-24 39N11E-24.3a2 American Can Co. 245 10 682 33.0 649 7-11 Well No. 1 39N11E-25.4d E. Mulac 165 5 670 21.42 649 7-11 39N11E-25.6e Butler Co. 160 5 675 33.99 641 7-13 39N11E-26.3b Butler Co. 8 665 25.44 640 7-11 39N11E-28.7d C. Ballinger 117 5 720 45.45 675 7-13 39N11E-33.1e Midwest Country Club 170 8 720 62.0 658 7-12 Well No. 1 39N11E-33.2d D. Kitzing 5 733 61.16 672 7-13 39N11E-34.7h G. Mueller 105 4 715 51.01 664 7-13 39N11E-35.1d J. Telander 90 5 672 28.28 644 7-11 39N11E-36.4f M. Carlson 45 4 650 12.37 638 7-11
40N9E-1.2h G. Anagnost 164 790 51.39 739 7-18 40N9E-3.7b Carrol 810 41.65 768 7-1 40N9E-6.8e E. Haas 95 5 765 21.82 743 7-1 40N9E-14.5b W. Niemeyer 5 768 30.02 738 7-8 40N9E-19.4b Hammond 120 5 758 31.37 727 7-6 40N9E-21.5e K. Bierkamp 783 33.29 749 7-15 40N9E-24.7g W. Bierman 5 782 42.06 740 7-8
40N9E-26.3e Fair Oaks Farm 5 788 51.35 737 7-6 40N9E-28.4b2 Christ the King Seminary 160 8 788 .47.0 741 7-6 Well No. 2 40N9E-30.3c J. Koselka 119 5 752 48.55 703 7-1 40N9E-32.5g Kawneer Products Co. 270 12 755 84.5 671 8-7 Well No. 2 40N9E-32-6g Kawneer Products Co. 271 12 755 60.0 695 6-9 Well No. 1 40N9E-32.6h Owens-Illinois Closure &
Plastics Div. 300 20 753 76.0 677 2-9 Well No. 3 40N9E-33.1a Mr. Binder 150 6 775 51.39 724 7-6 40N9E-34.1a Wheaton College Academy 220 6 762 38.21 724 7-6 40N9E-35.1f O. C. Hiltman 160 6 762 37.53 724 7-8 40N9E-35.3g Sidwell Studios 192 8 748 26.0 722 7-6 40N9E-35.8h G. Eeed 100 5 740 5.01 735 7-6 40N9E-36.4c L. Peters 6 749 27.39 722 7-8
40N10E-1.4d W. Wiebe 155 5 733 27.16 706 7-26 40N10E-2.4d J. Peterson 150 5 735 19.29 716 7-26 40N10E-3.4e2 Village of Roselle 183 10 770 54.0 716 3-22 Village Well No. 2 40N10E-4.5e E. Wieble 190 5 805 63.13 742 7-26 40N10E-8.6f E. Hasse 155 4 783 30.64 752 7-26 40N10E-10.8h J. Anderson 155 5 788 49.21 739 7-26 40N10E-12,5b Medinah Country Club 145 6 700 22.0 678 7-8 Well No. 1 40N10E-13.1g Mr. Parks 132 5 692 9.13 683 7-28 40N10E-14.4e Glendale Country Club 212 8 760 62.27 698 7-8 Well No. 2 40N10E-15.4e E. W. Dunteman 130 748 28.63 719 7-29 40N10E-16.1e Mr. Knobloch 187 5 798 74.10 724 7-29 40N10E-16.4a Sod Farm Nursery 370 10 792 47.19 745 8-1 Well No. 3 40N10E-17.5e P. Benshoof 152 4 794 30.78 763 7-29 40N10E-18.1d2 W. H. Kurth 160 4 790 39.23 751 7-8 40N10E-20.5f J . Klein 160 4 772 36.89 735 7-29
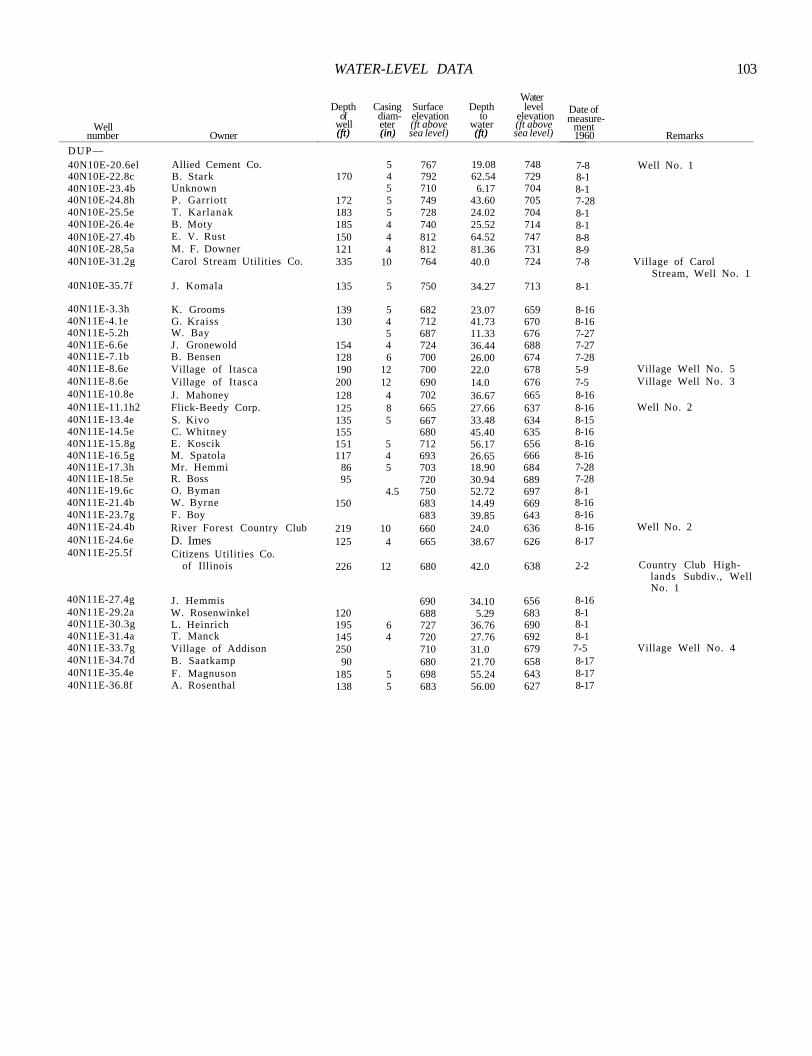
WATER-LEVEL DATA 103
Water Depth Casing Surface Depth level Date of of diam elevation to elevation measure
Well well eter (ft above water (ft above ment number Owner (ft) (in) sea level) (ft) sea level) 1960 Remarks
DUP—
(ft) (in) (ft)
40N10E-20.6el Allied Cement Co. 5 767 19.08 748 7-8 Well No. 1 40N10E-22.8c B. Stark 170 4 792 62.54 729 8-1 40N10E-23.4b Unknown 5 710 6.17 704 8-1 40N10E-24.8h P. Garriott 172 5 749 43.60 705 7-28 40N10E-25.5e T. Karlanak 183 5 728 24.02 704 8-1 40N10E-26.4e B. Moty 185 4 740 25.52 714 8-1 40N10E-27.4b E. V. Rust 150 4 812 64.52 747 8-8 40N10E-28,5a M. F. Downer 121 4 812 81.36 731 8-9 40N10E-31.2g Carol Stream Utilities Co. 335 10 764 40.0 724 7-8 Village of Carol
Stream, Well No. 1 40N10E-35.7f J . Komala 135 5 750 34.27 713 8-1
40N11E-3.3h K. Grooms 139 5 682 23.07 659 8-16 40N11E-4.1e G. Kraiss 130 4 712 41.73 670 8-16 40N11E-5.2h W. Bay 5 687 11.33 676 7-27 40N11E-6.6e J. Gronewold 154 4 724 36.44 688 7-27 40N11E-7.1b B. Bensen 128 6 700 26.00 674 7-28 40N11E-8.6e Village of Itasca 190 12 700 22.0 678 5-9 Village Well No. 5 40N11E-8.6e Village of Itasca 200 12 690 14.0 676 7-5 Village Well No. 3 40N11E-10.8e J. Mahoney 128 4 702 36.67 665 8-16 40N11E-11.1h2 Flick-Beedy Corp. 125 8 665 27.66 637 8-16 Well No. 2 40N11E-13.4e S. Kivo 135 5 667 33.48 634 8-15 40N11E-14.5e C. Whitney 155 680 45.40 635 8-16 40N11E-15.8g E. Koscik 151 5 712 56.17 656 8-16 40N11E-16.5g M. Spatola 117 4 693 26.65 666 8-16 40N11E-17.3h Mr. Hemmi 86 5 703 18.90 684 7-28 40N11E-18.5e R. Boss 95 720 30.94 689 7-28 40N11E-19.6c O. Byman 4.5 750 52.72 697 8-1 40N11E-21.4b W. Byrne 150 683 14.49 669 8-16 40N11E-23.7g F . Boy 683 39.85 643 8-16 40N11E-24.4b River Forest Country Club 219 10 660 24.0 636 8-16 Well No. 2 40N11E-24.6e D. Imes 125 4 665 38.67 626 8-17 40N11E-25.5f Citizens Utilities Co.
of Illinois 226 12 680 42.0 638 2-2 Country Club Highlands Subdiv., Well No. 1
40N11E-27.4g J. Hemmis 690 34.10 656 8-16 40N11E-29.2a W. Rosenwinkel 120 688 5.29 683 8-1 40N11E-30.3g L. Heinrich 195 6 727 36.76 690 8-1 40N11E-31.4a T. Manck 145 4 720 27.76 692 8-1 40N11E-33.7g Village of Addison 250 710 31.0 679 7-5 Village Well No. 4 40N11E-34.7d B. Saatkamp 90 680 21.70 658 8-17 40N11E-35.4e F. Magnuson 185 5 698 55.24 643 8-17 40N11E-36.8f A. Rosenthal 138 5 683 56.00 627 8-17