ground vibration attenuation analysis of huntley quarry
TRANSCRIPT

March 5, 2014
WEST OTTAWA LAND HOLDINGS LTD.
Ground Vibration Attenuation Analysis of Huntley Quarry Blasting
RE
PO
RT
Report Number: 13-1127-0133
Distribution:
1 Copy - West Ottawa Land Holdings Ltd. - Ottawa 1 Copy - Golder Associates Ltd. - Ottawa 1 Copy - Golder Associates Ltd. - Toronto 1 Copy - Golder Associates Ltd. - Sudbury
Submitted to:
West Ottawa Land Holdings Ltd. 225 Metcalfe Street Ottawa, Ontario K2P 1P9 Attn.: Jeff Parkes V.P. Planning & Development

GROUND VIBRATION ANALYSIS - HUNTLEY QUARRY
March 5, 2014 Report No. 13-1127-0133 i
Table of Contents
1.0 INTRODUCTION ............................................................................................................................................................... 1
2.0 CRITERIA – GROUND AND AIR VIBRATION LIMITS .................................................................................................... 1
3.0 METHODS ........................................................................................................................................................................ 2
3.1 Existing Blast Monitoring ..................................................................................................................................... 2
3.2 Ground Vibration Modelling ................................................................................................................................. 3
3.3 Air Vibration Modelling ......................................................................................................................................... 3
4.0 RESULTS ......................................................................................................................................................................... 4
4.1 Monitored Ground Vibration Levels ..................................................................................................................... 4
4.2 Monitored Air Vibration Levels ............................................................................................................................. 6
4.3 Predicted Ground Vibration Levels ...................................................................................................................... 7
4.4 Predicted Air Vibration Levels ............................................................................................................................ 10
5.0 DISCUSSION .................................................................................................................................................................. 10
6.0 CLOSURE ....................................................................................................................................................................... 12
TABLES
Table 1: OPSS – Maximum Peak Particle Velocity Values ........................................................................................................ 1
Table 2: Vibration Limits for Various Infrastructure Types .......................................................................................................... 2
FIGURES
Figure 1: Ground Vibration Monitoring for the Huntley Quarry Blasts ........................................................................................ 4
Figure 2: Estimated Ground Vibration Attenuation from the Vibration Monitoring for the Huntley Quarry .................................. 5
Figure 3: Air Vibration Monitoring for the Huntley Quarry Blasts ................................................................................................ 6
Figure 5: Estimated PPV at a Given Distance for All Monitoring and Monitoring Behind the Blast ............................................ 8
Figure 6: Estimated Ground Vibration Contours from the Huntley Quarry ................................................................................. 9
Figure 7: Estimated PSPL at a Given Distance for Monitoring Behind the Blast ...................................................................... 10
APPENDICES
APPENDIX A IP – Business Park Industrial Zone Provisions

GROUND VIBRATION ANALYSIS - HUNTLEY QUARRY
March 5, 2014 Report No. 13-1127-0133 1
1.0 INTRODUCTION
West Ottawa Land Holdings Ltd. (WOLHL) intends to develop property near Karson Aggregates’ (Karson)
Huntley Quarry located north of Stittsville, Ontario. WOLHL retained Golder Associates Ltd. (Golder) to assess
the potential blast-induced ground and air vibration from the nearby rock quarry on the proposed development
(the development). The purpose of this report is to provide a summary of the existing blast monitoring data,
review the applicable ground and air vibration limits and estimate appropriate standoff distances from the quarry
and the development. The analysis and results presented in this document are intended to provide sufficient
information to the City of Ottawa to allow for appropriate planning and zoning for the proposed commercial and
light industrial development.
2.0 CRITERIA – GROUND AND AIR VIBRATION LIMITS
The ground and air vibration effects produced at Points of Reception (PORs) as defined by the Ontario Ministry
of the Environment (MOE) (i.e., dwellings, hotels, schools etc.) adjacent to mines and quarries are subject to
guidelines contained in Noise Pollution Control (NPC) publication 119 of the Model Municipal Noise Control
Bylaw, dated August 1978, published by the MOE. Under conditions where monitoring of the blasting operations
is routinely carried out, NPC 119 stipulates that the ground and air vibration limits at the nearest POR to the
quarry will be 12.5 mm/s and 128 dBL, respectively.
However, it is Golder’s understanding that many of the structures to be developed by WOLHL are not PORs.
Specifically, proposed structures nearest to the existing quarry will not meet the definition of a POR in
accordance with MOE guidelines. The Ontario Provincial Standard Specification (OPSS) 120, General
Specification Use of Explosives, covers the requirements for the use of explosives and has been developed for
use in provincial- and municipal-oriented contracts. Where blasts are not covered by NPC 119, the OPSS is
often used in blasting contracts. The Peak Particle Velocity (PPV) limits specified by OPSS 120 are shown in
Table 1.
Table 1: OPSS – Maximum Peak Particle Velocity Values
Element Frequency (Hz) PPV (mm/s)
Structures and Pipelines ≤ 40 20
> 40 50
Concrete and Grout < 72 hours from placement
N/A 10
Generally, empirical observations related to cracking in structures have been with single component peaks. The
use of the Peak Vector Sum (PVS) (i.e., vector resultant of all components combined) provides a large factor of
safety. Standard practice is to apply vibration limits to the PPV of the largest single component on the
seismograph record rather than the PVS. Additionally, MOE publications NPC 119 and NPC 103 adopt the use
of PPV rather than PVS. In our review of the vibration monitoring data, the PPV of the largest single component
(i.e., transverse, vertical, longitudinal) of the monitoring record was used.
The OPSS 120 does not provide limits for air vibration limits. As a result, many contracts will use the NPC119
limit of 128 dBL or 134 dBL as recommended in United States Bureau of Mines (USBM) RI8485 (Siskind et al.,

GROUND VIBRATION ANALYSIS - HUNTLEY QUARRY
March 5, 2014 Report No. 13-1127-0133 2
1980) for large scale surface mining operations. The cracking of windows has been found to be the first
indication of air vibration damage from blasts (Siskind, 2005). Most studies discussed within the USBM RI8485
report suggest that 140 dBL is a reasonable threshold for glass and plaster damage. It is suggested in that
study that 134 dBL was a worst-case safe- level for blast induced air vibration. An air vibration limit of 134 dBL
is used within this document.
Ground vibration guidelines are typically established for blasting sites to prevent damage to adjacent facilities or
infrastructure. Exceeding these levels does not in itself imply that damage has occurred but only increases the
potential that damage might occur. Siskind and Stagg (1993) suggested a PPV limit for Class B or better steel
pipelines (or Class 6 or better PVC pipelines) at 127 mm/s. However, many pipeline companies in Canada
(including TransCanada Pipelines and Union Gas) impose a more conservative limit of 50 mm/s. Ground
vibration limits for stronger materials, such as concrete, may be set as high as 150 to 200 mm/s, while peak
ground vibration levels of 300 to 600 mm/s are required to create micro-cracks or open existing discontinuities in
bedrock (Keil et al., 1977). Richards and Moore (2007) provided a review of the damage potential from blast-
induced vibrations from open pit coal mines. Table 2 provides a summary of PPV limits proposed for a variety of
infrastructure types.
Table 2: Vibration Limits for Various Infrastructure Types
Infrastructure Type PPV Limit (mm/s) Comments
Power Transmission Towers * 100 Concrete footings
Wooden Hydro Poles * 240
Electrical Sub-stations * 10 – 30 Depending on switch type. Manufacturer should be consulted.
Railway Tracks * 100
Buried Pipelines ** 127
Underground Fibre Optics Line * 100
Concrete and grout <72 hours from placement ***
10
Mine Plant and Industrial Buildings *
100 Unoccupied structures of reinforced concrete or steel construction
* Suggested by Richards and Moore (2007)
** Siskind and Stagg (1993)
** OPSS 120
3.0 METHODS
3.1 Existing Blast Monitoring
Austin Powder Limited (Austin) monitors the blast vibrations from the Huntley Quarry in order to ensure that the
blasts remain within the NPC 119 Guidelines. Austin also conducted an attenuation study behind the blasts in
order to establish the potential blast vibration at the proposed development. Austin provided Golder with the
monitoring results from 17 blasts conducted from April 25, 2013, to September 10, 2013, which were recorded
by Austin staff. The vibration monitoring records consisted of 2 sets of data:
Compliance monitoring at locations in front of the blasting; and

GROUND VIBRATION ANALYSIS - HUNTLEY QUARRY
March 5, 2014 Report No. 13-1127-0133 3
Monitoring locations behind or beside the closed end of the blasts which would most likely represent those
to be recorded at the WOLHL development.
The data provided by Austin has been reprocessed and assessed for the purposes of this assessment.
Specifically, the data has been presented as PPV in accordance with standard practice in Ontario.
3.2 Ground Vibration Modelling
The rate at which ground vibrations attenuate or decrease with increased distance from a blast source depends
on a variety of conditions, including the type and condition of the bedrock being blasted, depth and composition
of the earth covering deposits (soil), and the general topography.
The impact of blast vibrations on structures is related to both the amplitude and dominant frequency of the
vibration as well as the type and configuration of the structure. The PPV is the most commonly used measure of
the intensity of the ground vibration due to blasts. Two of the most important variables that affect a blast PPV
are the distance from the source (seismic waves attenuate with distance) and the maximum explosive charge
weight per delay period. The most common method of normalizing these two factors is by means of plotting the
scaled distance (SD) against the PPV and is given by the following:
( )
Where SD = scaled distance (m/kg 0.5
) between the blast and receptor; and,
K, e = are site specific constants.
The scaled distance is given by:
√
Where D = distance (m) between the blast and receptor; and,
W = maximum weight of explosive (kg) detonated per delay period.
3.3 Air Vibration Modelling
Blasting for the quarry will result in air vibrations. Air vibrations attenuate from a blast site at a slower rate than
ground vibrations. The distribution of air vibration energy from a blast is strongly influenced by the prevailing
weather conditions during the blast. For example, wind can increase downwind levels by 10 to 15 dBL above
what would otherwise be measured (Dowding 1985). Low cloud ceilings and temperature inversions also
contribute to air vibrations propagating further than would typically be the case. Other factors influencing air
vibration distribution from a blast include the local topography and vegetation, length of collar and type of
stemming material, differences in explosive types and variations in burden distance.
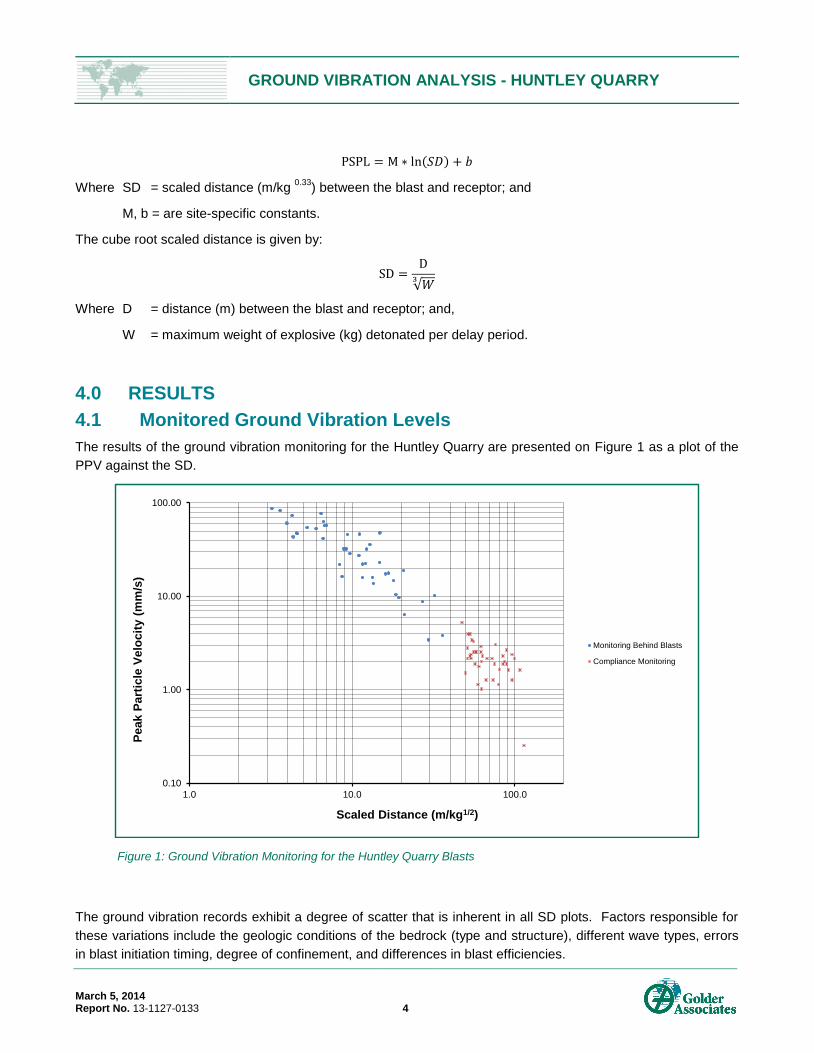
Because the Peak Sound Pressure Level (PSPL) is given by the following:
GROUND VIBRATION ANALYSIS - HUNTLEY QUARRY
March 5, 2014 Report No. 13-1127-0133 4
( )
Where SD = scaled distance (m/kg 0.33
) between the blast and receptor; and
M, b = are site-specific constants.
The cube root scaled distance is given by:
√
Where D = distance (m) between the blast and receptor; and,
W = maximum weight of explosive (kg) detonated per delay period.
4.0 RESULTS
4.1 Monitored Ground Vibration Levels
The results of the ground vibration monitoring for the Huntley Quarry are presented on Figure 1 as a plot of the
PPV against the SD.
Figure 1: Ground Vibration Monitoring for the Huntley Quarry Blasts
The ground vibration records exhibit a degree of scatter that is inherent in all SD plots. Factors responsible for
these variations include the geologic conditions of the bedrock (type and structure), different wave types, errors
in blast initiation timing, degree of confinement, and differences in blast efficiencies.
0.10
1.00
10.00
100.00
1.0 10.0 100.0
Pe
ak P
art
icle
Ve
locit
y (
mm
/s)
Scaled Distance (m/kg1/2)
Monitoring Behind Blasts
Compliance Monitoring

GROUND VIBRATION ANALYSIS - HUNTLEY QUARRY
March 5, 2014 Report No. 13-1127-0133 5
It must be noted that Golder did not observe the blast vibration monitoring conducted by Austin. As such, we are
unable to verify the equipment or methodology used to carry out the monitoring.
The ground vibration attenuation characteristics for the entire data set as well as that for the monitoring behind
the blasts are summarized in Figure 2. These represent the estimated 95% confidence lines, which provide a
means to predict the maximum vibration for a given explosive charge weight per delay and given distance from
the source to the target location. The purpose of the equations is not so much to predict what a given vibration
level would be at a particular location for a given blast, but to indicate the probability that the peak vibration
would fall below the level indicated by the equation for a given distance and maximum explosive weight. The
equations are therefore a useful blast design tool in establishing maximum explosive charge weights per delay
for various distances from a blast site for a given maximum ground vibration level.
Figure 2: Estimated Ground Vibration Attenuation from the Vibration Monitoring for the Huntley Quarry
The equations for estimating the PPV using the 95% confidence lines shown in Figure 2 can be expressed as:
(
√ )
for all the vibration monitoring data received; and
(
√ )
for the vibration monitoring conducted behind the blasts.
1.00
10.00
100.00
1000.00
10000.00
1 10 100
Peak P
art
icle
Velo
cit
y (
mm
/s)
Scaled Distance (m/kg1/2)
95% Regression Lines From Vibration Monitoring
All Blast Monitoring
Monitoring Behind Blasts
All Blast MonitoringPPV = 1243*(SD)-1.32
Coeff. of Det. = 0.920St. Dev. = 0.178
Monitoring Behind BlastsPPV = 814*(SD)-1.14
Coeff. of Det. = 0.770St. Dev. = 0.165

GROUND VIBRATION ANALYSIS - HUNTLEY QUARRY
March 5, 2014 Report No. 13-1127-0133 6
4.2 Monitored Air Vibration Levels
The results of the air vibration monitoring for the Huntley Quarry are presented on Figure 3 as a plot of the Peak
PSPL against the SD.
Figure 3: Air Vibration Monitoring for the Huntley Quarry Blasts
The equations for estimating the PSPL using the 95% confidence lines shown in Figure 4 can be expressed as:
( )
for the vibration monitoring conducted behind the blasts.
100
110
120
130
140
150
1.0 10.0 100.0
Peak S
ou
nd
Pre
ssu
re L
ev
el (d
BL
)
Scaled Distance (m/kg1/3)
Monitoring Behind Blasts
Compliance Monitoring

GROUND VIBRATION ANALYSIS - HUNTLEY QUARRY
March 5, 2014 Report No. 13-1127-0133 7
Figure 4: Estimated Air Vibration Attenuation from the Vibration Monitoring for the Huntley Quarry
4.3 Predicted Ground Vibration Levels
Information from Karson indicates that the current permissible explosive charge weight per delay is 126 kg.
Figure 5 shows the estimated ground vibration amplitudes for blasts carried out over a range of distances (from
the blasts to the nearest receptor) and assuming a maximum explosives charge weight per delay of 126 kg. It
also displays the various ground vibration limits discussed.
The ground vibration monitoring results and an assumed maximum explosive charge weight per delay of 126 kg
suggest that the following standoff distances behind the blasts would be required to remain below the OPSS 120
limits:
OPSS 120 (≤ 40 Hz) – 290 m; and
OPSS 120 (> 40 Hz) – 130 m.
100
110
120
130
140
150
160
1.0 10.0 100.0
Pe
ak
So
un
d P
ress
ure
Le
ve
l (d
BL
)
Scaled Distance (m/kg1/3)
Monitoring Behind Blasts
95% Confidence Line
Monitoring Behind BlastsPSPL = -8.963*ln(SD)+167.5

GROUND VIBRATION ANALYSIS - HUNTLEY QUARRY
March 5, 2014 Report No. 13-1127-0133 8
Figure 5: Estimated PPV at a Given Distance for All Monitoring and Monitoring Behind the Blast
As discussed above, the two key parameters that will affect the PPV at nearby structures are distance and
explosives charge weight per delay. Changes to the latter will require discussions between WOLHL and Karson.
Figure 6 shows the estimated 12.5 mm/s and 20 mm/s ground vibration contours for blasts at the Huntley Quarry
assuming a maximum explosives charge weight per delay of 126 kg recorded behind the blast. The contours
are based on blasts at the eastern limit of extraction (i.e., closest distance between the quarry limit of extraction
the proposed WOLHL development). This illustrates that at standoff distances of less that 290 m the ground
vibration levels may exceed 20 mm/s and at standoff distances less than 438 m they may exceed 12.5 mm/s.
0
5
10
15
20
25
30
35
40
45
50
55
Pe
ak P
arti
cle
Vel
oci
ty (
mm
/s)
Distance from Blast to Monitor (m)
NPC 119 Limit
OPSS 120 (≤ 40 Hz)
OPSS 120 (> 40 Hz)
All Blast Monitoring
Monitoring Behind Blasts
Assuming: 126 kg/delay

PART 1 4R - 25852
N O R T H H A L F L O T 3
C O
N C
E S
S I
O N
1
PART 2
4R - 2
5852
HWY 417 (Queensway)PART 2 , 5R-181 (P-6092-6)
PART 4 , 5R - 12156
PART 2 , 5R - 12156
S O U T H H A L F L O T 4
ROAD
ALLO
WANC
E BET
WEE
N TO
WNSH
IPS O
F HUN
TLEY
AND
MARC
HHU
NTMA
R R
OAD
DIVISION LINE BETWEEN LOTS 3 AND 4
ROAD
ALLO
WANC
E BET
WEE
N CO
NCES
SION
S 1 AN
D 2
(NOT
TRAV
ELLE
D)
P I N 0 4 5 0 8 - 0 0 2 7
PIN 04508 - 0026
P I N 0 4 5 0 8 - 0 0 2 5
PIN 0
4508
-003
0
P I N
0
4 5
0 8
-
0 0
3 5
P I N
0
4 5
0 8
-
0 0
3 3
HIGHWAY No. 417
OFF RAMP
AUTOPARK PRIV.
PART 7 4R-10222
PART 8 4R-10222
PART 104R-10222
PART 3
4R-25852
CAMPEAU DRIVE
PALLAD
IUM
DRIVE
CYCLONE TAYLOR BV (EXISTING)
FEEDMILL
CREEK
FEEDMILL CREEK
DIVISION LINE BETWEEN NORTH HALF AND SOUTH HALF LOT 3
S O U T H H A L F L O T 3
Canadian TireCenter
PALL
ADIUM
DRIVE
TOP OFSLOPE
TOP OFSLOPE
TOP OF
SLOPE
TOP OFSLOPE
TOP OFSLOPE
VACANT
P I N 0 4 5 0 8 - 0 0 3 2
PLAN
5R-
281
PART
2
P.I.N
. 045
10 -
003
4
PART
3
CAMPEAU DRIVEEXTENSION)
(PROPOSED
DATE
Oct 30/07 Compile base from office records, Prep Draft Plan per JP/DAS meeting, pdf for review
Nov 27/07 Insert "corridor" line-work from recvd-dwg, revise to new "Buffer" lines, print for review
Nov 30/07 revisions per JP/DA meeting, use "corridor" lines per TSH dwg file, prints for review
Dec 5/07 update/revisions per JP review, pdf & dwg to JP
Jan 14/08 approx. total center-line of roads distances, pdf to JP (01-16-08) for review
Jan 17/08 revise approx. total center-line of roads distances/schedule, pdf to JP for review
March 27/09 revisions at Streets 2, 3 and Blks 7 & 8, pdf & dwg to BW for review
March 31/09 shift Street 2 north, maximize block size, update areas, pdf & dwg to BW for review
revisions per JP/BW pdf mark-up, Street 2 & Blks 1 to 11, pdf/dwg to BW for review
April 17/09revised street alignmentJune 24/10added blocks 31 to 36
July 8/10added blocks 37 to 39July 14/10revised blocks 13, 21, 22 and 24
Dec 15/10revised blocks 13 and 14Dec 16/10revised blocks 12 and 14, and alignment of Palladium and Campeau drive
May 30/11
(EXISTING)
NORMALH.W.M.
DVIEW ROTATION -40d45'19"
MATCH LINE
N O R T H H A L F L O T 4
PART 35R-12156
PART 55R-12156
TOPSLOPE
TOPSLOPE
COMBINED15M & 30MOFFSET LINE
COMBINED15M & 30MOFFSET LINE
COMBINED15M & 30MOFFSET LINE
NORMALH.W.M.
NORMALH.W.M.
NORMALH.W.M.
NORMALH.W.M.
73.5±
82.1±
76.1±
104.8±
PART 44R-25852
295.82R=270.00
A=127.52C=126.34
N64°48'56"E
N47°38'35"E 108.10N48°40'05"E
40.88
N21°
39'30
"W44
.50
15.015
.0
15 .0
15.0
15 .0
15.0
BLOCK 308795.63 m²2.17 Acres
COMBINED15M & 30MOFFSET LINE
BLOCK 2
BLOCK 1
BLOCK 6
BLOCK 5
BLOCK 4
BLOCK 3 BLOCK 16
BLOCK 13
BLOCK 12
BLOCK 7 BLOCK 8
BLOCK 11
BLOCK 9
BLOCK 14 BLOCK 15
BLOCK 17
BLOCK 33
BLOCK 32
BLOCK 31
BLOCK 27
BLOCK 22
BLOCK 34
BLOCK 19
BLOCK 20 BLOCK 21
BLOCK 23
BLOCK 24
BLOCK 25
BLOCK 29
BLOC
K 26
STRE
ET
NO. 1
STRE
ET
NO. 1
STRE
ET
NO. 2
STRE
ET
NO. 3
STRE
ET W
IDEN
ING
N48°07'05"E
770.82 m²0.19 Acres 1778.94 m²
0.44 Acres
11965.28 m²2.96 Acres
39546.54 m²9.77 Acres
32455.06 m²8.02 Acres
42987.12m²10.62 Acres
26306.64 m²6.50 Acres
26432.47 m²6.53 Acres
10123.69 m²2.50 Acres
26798.51 m²6.62 Acres 36238.22 m²
8.95 Acres
13295.14 m²3.28 Acres
10543.59 m²2.60 Acres
30641.93 m²7.57 Acres
7049.55 m²1.74 Acres
15536.83 m²3.84 Acres
14310.44 m²3.54 Acres
14133.29 m²3.49 Acres
36508.95 m²9.02 Acres
15327.86 m²3.79 Acres
12279.60 m²3.03 Acres
29345.97 m²7.25 Acres 16354.00 m²
4.04 Acres
26310.11 m²6.50 Acres
32382.735 m²8.00 Acres
20285.26 m²5.01 Acres
34621.843 m²8.55 Acres
4197.94 m²1.04 Acres
12418.32 m²3.07 Acres
N42°
20'00"W
273.61
N48°
09'45"E
45.71
N42°
20'00"W
30.48
N48°09'45"E41.01
N48°17'40"E 212.94N48°20'05"E 299.18
N48°13'40"E 299.38N48°04'15"E 299.34
N48°04'15"E 141.25
N41°
39'45"W
303.79
N42°
01'00"W
308.69
N42°
01'00"W
205.66
N47°37'30"E 647.77
N42°
46'20"W
98.39
N30°
37'10
"W51.76
N38°
28'15
"W122.06
R=150.00A=51.55C=51.30N27°30'35"W
N16°
27'05
"W37.02
R=27
0.00
A=25
.48
C=25
.47
N13°
08'05"W
N41°
24'25"W
105.78
N65°
47'15
"W18.72
OTHER OWNERFUTURE DEVELOPMENT
N48°07'05"E 100.23N48°40'05"E63.37
R=150.00A=39.04C=38.93N41°10'40"W
R=230.00A=76.61C=76.25N06°56'21"W
R=230.00A=180.88C=176.26N25°08'00"E
40.00
25925.42 m²6.41 Acres
8.69
N48°40'05"E63.71
PHASE 1ENTRANCE
148.32
155.66
159.82
PART 1
PART 2 4R-27297
PART 3 4R-27297
PART
4 4
R-27
297
PART 5
PART 6
4R-27297
4R-27297
4R-27297
BLOCK 1012971.76 m²3.20 Acres
BLOCK 1810128.21 m²2.50 Acres
ACCESS
ROAD
ACCESS ROAD
BLOCK 2819393.85 m²4.79 Acres
BLOCK 3517170.65 m²4.24 Acres
STORMWATERMANAGEMENTPOND AREA
CAMPEAU DRIVE CAMPEAU DRIVE
10.00
10.00
10.00
COMBINED15M & 30MOFFSET LINE
30 m SETBACK
30 m SETBACK
15 m SETBACK
15 m SETBACK
15 m SETBACK
15 m SETBACK
KARSONHUNTLEY QUARRYLICENSE No. 4079
KARSONWILSON FARM PIT & QUARRY
LICENSE No. 4106
LIMIT OF EXTRACTION
LICENSED BOUNDARY
HWY 417
CARP
ROA
D
234m
382m
34600034
6000
34650034
6500
34700034
7000
34750034
7500
348000
348000 348500
3485
00
349000
3490
00
349500
3495
00
5015
500
5015500
5016
000
5016000
5016
500
5016500
5017
000
5017500
5017
500
5018000
5018
000
5018500
5018
500
5019000
REV. 0DESIGN
ESTIMATED GROUND VIBRATION CONTOURSFROM THE HUNTLEY QUARRY
FIGURE 6PROJECT No. 13-1127-0133 SCALE AS SHOWN
PROJECT
TITLE
GIS
REVIEW
KAM 2014-01-24
CHECK
OTTAWA LAND HOLDINGS PROPERTY ADJACENT TO KARSON SPRATT QUARRY, OTTAWA, ONTARIO
Path:
Z:\Pr
ojects
\2013
\13-11
27-01
33\G
IS\MX
Ds\W
orking
\Air_N
oise\F
ig6_G
round
Vibrat
ion.m
xd
³
RRD 2014-02-06
LEGEND
0 125 250 375 500Metres
NOTE THIS FIGURE IS TO BE READ IN CONJUNCTION WITH THE ACCOMPANYING GOLDER ASSOCIATES LTD.REPORT No. 13-1127-0133REFERENCE SITE PLANS FROM WEST OTTAWA LAND HOLDINGS LTD. AND KARSON GROUP LTD.LAND INFORMATION ONTARIO (LIO) DATA PRODUCED BY GOLDERASSOCIATES LTD. UNDER LICENCE FROM ONTARIO MINISTRY OFNATURAL RESOURCES, © QUEENS PRINTER 2014DATUM: NAD 83, COORDINATE SYSTEM: MTM ZONE 9
SCALE 1:5,000
LICENSED BOUNDARY
LIMIT OF EXTRACTIONEstimated Ground Vibration Contours for Locations Behind the Blasts
12.5 mm/s (438 m)
30.0 mm/s (290 m)
LIMIT WEST OTTAWA LAND HOLDINGS LTD. PROPERTY
PROPERTY FABRIC
LOT AND CONCESSION

GROUND VIBRATION ANALYSIS - HUNTLEY QUARRY
March 5, 2014 Report No. 13-1127-0133 10
4.4 Predicted Air Vibration Levels
Figure 7 shows the estimated air vibration amplitudes for blasts carried out over a range of distance (from the
blasts to the nearest receptor) and assuming a maximum explosives charge weight per delay of 126 kg. It also
displays the various air vibration limit discussed.
The air vibration monitoring results and an assumed maximum explosive charge weight per delay of 126 kg
suggest that the standoff distances behind the blasts would be required to remain to at least:
410 m for the 128 dBL limit; and
210 m for the 134 dBL limit.
Figure 7: Estimated PSPL at a Given Distance for Monitoring Behind the Blast
5.0 DISCUSSION
Based on the vibration monitoring data provided to Golder behind the blasts at the Huntley Quarry and the
current blasting operations, the recommended standoff distances from the blasts are as follows:
For ground vibrations to meet OPSS 120 ground vibrations limits:
≤ 40 Hz – 290 m; and
> 40 Hz – 130 m.
For air vibrations to meet air vibration limit of 134 dBL – 210 m.
100
105
110
115
120
125
130
135
140
145
150
Pe
ak P
arti
cle
Vel
oci
ty (
dB
L)
Distance from Blast to Monitor (m)
128 dBL Limit
134 dBL Limit
Monitoring Behind Blasts
Assuming: 126 kg/delay

GROUND VIBRATION ANALYSIS - HUNTLEY QUARRY
March 5, 2014 Report No. 13-1127-0133 11
These results are based on the understanding that the development will primarily include commercial and light
industrial type facilities. Based on discussion with WOLHL, the potential for sensitive locations, as defined by
the MOE are possible, however, these locations will be no closer than approximately 500 m. At this distance,
the predictions provided in this report suggest that the limits specified in NPC 119 will be met as a minimum set
back distance of less than 438 m will be required to ensure compliance with the MOE guideline.
In addition, consideration must be given to the allowable zoning of the development. Appendix A includes the
IP - Business Park Industrial Zone provisions. At a distance of approximately 438 m, vibration levels associated
with blasts from the quarry will comply with MOE limits (i.e., < 12.5 mm/s and < 128 dBL). Therefore, no
restrictions related to PORs as defined by the MOE are required. At distances less than 438 m, PORs should
not be allowed unless changes to the blasting operations at the quarry are employed. This may include lower
charge weight per delay or other modified blasting practices to lower off-site vibration levels. These levels
should be verified through monitoring of the modified blasting practices. Examples of restricted uses as defined
by the MOE include:
Daycares;
Hotels;
Places of assembly; and
Medical facilities.
At distances between 290 m and 438 m, the predicted ground vibration levels will vary between 20 mm/s and
12.5 mm/s. If we assume a 30 m quarry blasting setback, which has been confirmed within the quarry operator’s
licence, and the 26 m Right of Way between properties, there is a total of 56 m natural setback from the WOLHL
site boundary. Thus, at distances between 234 m and 382 m onto the WOLHL property, the predicted ground
vibration levels will vary between 20 mm/s and 12.5 mm/s. Vibration levels within this setback are predicted to
meet OPSS 120 criteria, but may exceed MOE limits. Based on these results, additional zoning restrictions
should be considered. These restrictions must include any POR as identified above and the following:
Printing plant;
Technology industry;
Research and development centre; and
Production studio.
The restrictions listed above should be reviewed on an individual case-by-case basis, as sensitivity to vibration
varies significantly and restricting all uses that may fall into the above categories may not be appropriate.
Understanding the type of vibration sensitivity that is required by various pieces of equipment is imperative to
understanding the potential affects that blast vibrations may cause.
For distances less than 290 m from a blast, one additional restriction should be considered in addition to all of
the above. The potential for office use within a setback of 290 m should be reviewed to establish whether or not
the proposed office type is suitable.

GROUND VIBRATION ANALYSIS - HUNTLEY QUARRY
March 5, 2014 Report No. 13-1127-0133 12
As is typical practice for quarry operators in Ontario, notification of blasting operations will be critical to mitigating
potential complaints from the blasting ground and air vibrations within the development. In addition to these
notifications, a warning clause is recommended to be included in all development agreements,
offers/agreements of purchase, sale or lease agreement. Sample wording is given below, which can be modified
as needed.
“Purchasers / tenants are advised that due to the proximity of the adjacent Karson Huntley Quarry, ground and
air vibration levels associated with the blasting operation of the quarry may at times be perceptible.”
Lastly, Golder also recommends that the results of this report be provided to all future builders and architects to
ensure that ground and air vibration levels have been considered in the design of all structures. The
consideration of ground and air vibration levels early in the design of any future structure will allow for building
elements to reduce vibration effects.
6.0 CLOSURE
Golder Associates Ltd. was retained by West Ottawa Land Holdings Ltd. to assess the potential blast-induced
ground and air vibration from the nearby rock quarry on the proposed commercial and light industrial
development. Based on the results presented in this report and restricting some of the approved uses within
specific setback distances as identified in Section 5.0 of this report and shown on Figure 6, the proposed
development can meet ground and air vibration limits specified in OPSS 120, United States Bureau of Mines
RI8485 and MOE publication NPC 119.
If you have any further questions or concerns, please feel free to contact the undersigned.

GROUND VIBRATION ANALYSIS - HUNTLEY QUARRY
March 5, 2014 Report No. 13-1127-0133
Report Signature Page
GOLDER ASSOCIATES LTD.
Daniel Corkery, B.Sc. Danny da Silva, P.Eng.
Senior Blasting Consultant Associate / Acoustics, Noise & Vibration Engineer
DJC/KAM/Dd/kp
Golder, Golder Associates and the GA globe design are trademarks of Golder Associates Corporation.
\\golder.gds\gal\sudbury\data\active\2013\other offices\13-1127-0133 taggart huntley quarry blasting\reporting\report\final\13-1127-0133 rpt-001 14mar5 huntley quarry vibrations.docx

GROUND VIBRATION ANALYSIS - HUNTLEY QUARRY
March 5, 2014 Report No. 13-1127-0133
APPENDIX A IP – Business Park Industrial Zone Provisions

IP - Business Park Industrial Zone (Sec. 205-206)
Purpose of the Zone
The purpose of the IP – Business Park Industrial Zone is to:
(1) accommodate mixed office, office-type uses and low impact, light industrial uses in a
business park setting, in accordance with the Enterprise Area designations of the Official Plan or, theEmployment Area or the General Urban Area designation where applicable;
(2) allow in certain Enterprise or General Urban Areas, a variety of complementary uses such
as recreational, health and fitness uses and service commercial (e.g. convenience store, personal service business, restaurant, automobile service station and gas bar), occupying small sites as individual occupancies or in groupings as part of a small plaza, to serve the employees of theEnterprise, Employment or General Urban Area, the general public in the immediate vicinity, and passing traffic;
(3) prohibit retail uses in areas designated as Enterprise Area but allow limited sample and
showroom space that is secondary and subordinate to the primary use of buildings for the manufacturing or warehousing of the product;
(4) prohibit uses which are likely to generate noise, fumes, odours, or other similar obnoxious
impacts, or are hazardous; and
5) provide development standards that would ensure compatibility between uses and would
minimize the negative impact of the uses on adjacent non-industrial areas.
205. In the IP Zone:
Permitted Uses
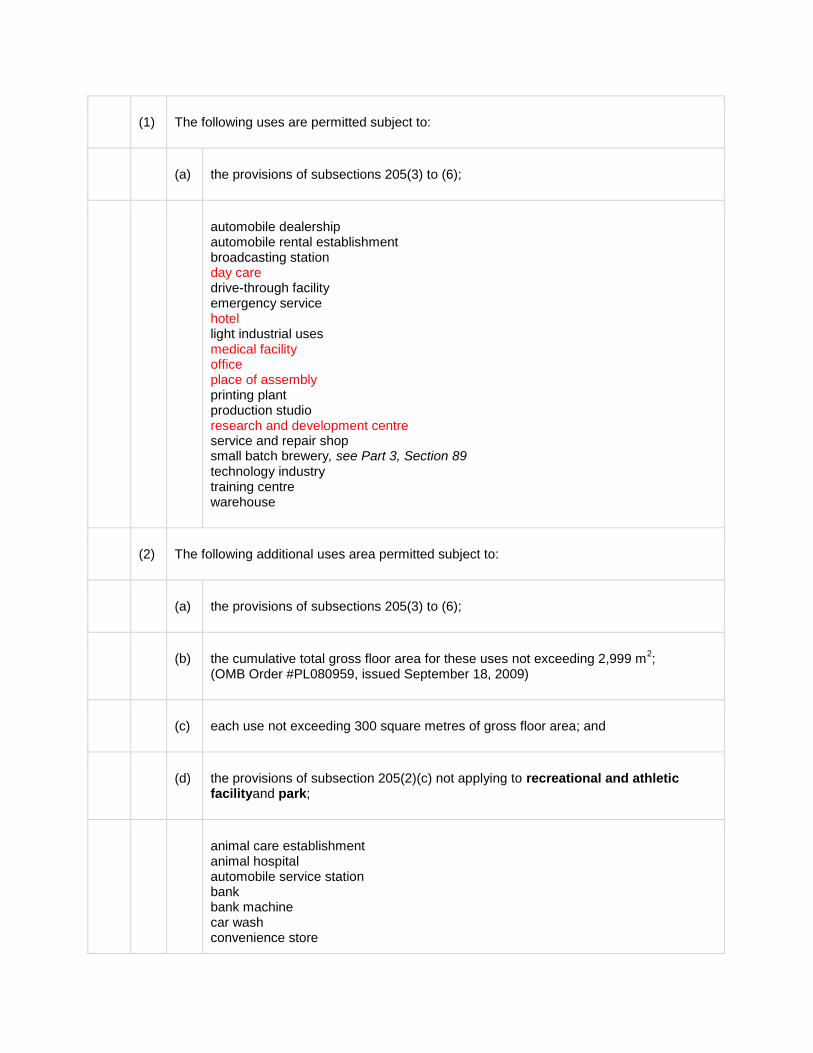
(1) The following uses are permitted subject to:
(a) the provisions of subsections 205(3) to (6);
automobile dealership automobile rental establishment broadcasting station day care drive-through facility emergency service hotel light industrial uses medical facility office place of assembly printing plant production studio research and development centre service and repair shop small batch brewery, see Part 3, Section 89 technology industry training centre warehouse
(2) The following additional uses area permitted subject to:
(a) the provisions of subsections 205(3) to (6);
(b) the cumulative total gross floor area for these uses not exceeding 2,999 m
2;
(OMB Order #PL080959, issued September 18, 2009)
(c) each use not exceeding 300 square metres of gross floor area; and
(d) the provisions of subsection 205(2)(c) not applying to recreational and athletic
facilityand park;
animal care establishment animal hospital automobile service station bank bank machine car wash convenience store

gas bar instructional facility park personal service business post office recreational and athletic facility restaurant
(3) The zone provisions are set out in Table 205 below.
TABLE 205 - IP ZONE PROVISIONS
I ZONING MECHANISMS
II PROVISIONS
(a) Minimum lot area 750 m2
(b) Minimum lot width No minimum
(c) Maximum lot coverage 55%
(d) Minimum front yard and corner side yard 6 m
(e) Minimum interior side yard
(i) abutting a residential or institutional zone
6 m
(ii) all other cases 3 m
(f) Minimum rear yard 6 m
(g) Maximum floor space index 2, unless otherwise shown on the zoning maps

(h) Maximum building height
(i) within 20 m from a residential or institutional zone
11 m
(ii) in all other cases 22 m, or as shown otherwise by a suffix or on a schedule
(i) Minimum width of landscaping
(i) abutting a residential or institutional zone
3 m; may be reduced to one metre if a 1.4 metre high opaque screen is provided
(ii) abutting a street 3 m
(iii) in all other cases No minimum
(4) Accessory display and sales area must be within the same building as the use to which it is accessory and must not exceed 25% of gross floor area.
(5) Outdoor storage is prohibited.
(6) For other applicable provisions, see Part 2 – General Provisions, Part 3 – Special Use
provisions, and Part 4 – Parking and Loading Provisions.
Medical facility means a place where a medical doctor, dentist or other legally qualified health care
practitioner has his or her practice, and includes a medical or dental laboratory. (clinique)
Office means a place used by an agency, business or organization for:
1. the transaction of administrative, clerical, data processing or management business;
2. the practice of a profession other than a medical facility; or
3. the provision of government or social services and other similar services. (bureau)
Place of assembly means a place designed and used to accommodate gatherings of people such as
clubs, reception halls, conference centres, legion halls, assembly halls and lodges, and for events such
as trade shows, banquets, and political or other conventions. (lieu de rassemblement)

Research and development centre means a place used for systematic research, data collection and
manipulation, or technical or scientific development of information or new products, and may include a
research laboratory; but excludes industrial and manufacturing operations other than those required as
part of the research. (centre de recherche-développement)

Golder Associates Ltd.
141 Adelaide Street West, Suite 910
Toronto, Ontario M5H 3L5
Canada
T: +1 (416) 366 6999
Caption Text