greg solomon chairman - eden innovations...• extreme air pollution –govt push to reduce...
TRANSCRIPT

AN EMERGING GLOBAL CLEAN ENERGY COMPANYAN EMERGING GLOBAL CLEAN ENERGY COMPANY
Roadshow Presentation
January 2011
Greg SolomonChairman

Corporate Structure
Eden Energy Ltd (AUSTRALIA)
Eden Innovations Ltd(Ireland) Energy Assets
January 2011January 11 2
Eden Energy
India Pvt Ltd
(India)
100%
Pyrolysis
and Gas to
Liquids
Technology
100%
(Ireland)
100%
Energy Assets
Coal Bed
Methane/Shale
Gas
(Wales, UK)
50%
(IPO planned)
Natural Gas
South Australia
(AUS)
100%
(Suspended)
Terratherma
(Geothermal)
South Australia
(AUS)
100%
(Suspended)
Hythane
Company
LLC
(USA)
100%

Current Clean Energy ProductsCurrent Clean Energy Products
• Pyrolysis Project - Solid Carbon and Hydrogen Production
without CO2
- Single Walled Carbon Nanotubes (SWCNT) and Multi Walled
Carbon Nanotubes (MWCNT) and Carbon Nanofibres (CNF)
January 2011
Carbon Nanotubes (MWCNT) and Carbon Nanofibres (CNF)
• Hythane®- India and US
• OptiBlend® Dual Fuel - India and US

Current Energy Projects Current Energy Projects UK- CBM - Coal Bed Methane JV-50% (1400km2)
- Coal Bed Methane JV-5% (400km2)- Centrica
UK- Shale/ - Shale Gas/Conventional Gas JV-50% (1800km2)
Conventional
January 2011
SA Natural Gas - Untested natural gas target (100km x 10km)
- 100% -Obligations suspended for 12 months
SA Geothermal - 100% -Obligations suspended 12 months

Pyrolysis Project – Eden 100%Low Cost Production of Carbon Fibres/Nanotubes and H2 from CH4
• Eden 100% - New process developed with UQ
• Patent applications lodged -over 50 countries
• No CO2 – H2 becomes a high value byproduct
• Produces hydrogen and single /multi-walled
January 2011
• Produces hydrogen and single /multi-walled
carbon nanotubes and carbon fibres
- tensile strength up to 200-300 times steel
- approx 17% the weight of steel
- structural and electrical qualities – large
market potential to replace steel/ aluminium
• Scale -up by Eden in US - encouraging results
• Commercial prototype targeted for completion by end 2011

Eden Energy CNT Production
Hydrogen
Natural Gas Supply
Catalyst Feed
Reactor
Hydrogen Product
Carbon
Inert Gas
CNT’s
Carbon Product
CH4

Production of H2 and Carbon Nanotubes from CH4
January 11
TEM image of MWCNT produced at Hythane Co in Denver
January 2011

Production of H2 and Carbon Nanotubes from CH4
January 11
TEM image of MWCNT produced at Hythane Co in Denver
January 2011

• New Cost Competitive Technology being developed in US
- Catalyst Formulae and production capability for MWCNT and
CNF
- Reactor designs and know-how
Pyrolysis Project Summary
- Testing capability to be developed
- Provisional patent application being prepared
• Products – (from natural gas with catalyst)
- MWCNT > 200-300 times tensile strength of steel
- CNF – compressive strength/ electrical qualities
- Hydrogen
January 2011

• Current- estimated at approx 2000 tpa
- Largest producer- 500tpa
- 3 producers – 200 tpa each
- One US producer plans 1000tpa
CNT Market Projected Growth
- One US producer plans 1000tpa
• Many new emerging applications
- Structural (composite materials/ concrete/ tyres)
- Electrical ( conduction and storage)
• Compounding growth estimated at more than 11%pa
January 2011

• To build 25-100 tpa commercial production unit to
produce MWCNT for following target markets:
• Concrete
- 1% MWCNT increases compressive strength up to 50% and may
Eden's Targets for 2011
- 1% MWCNT increases compressive strength up to 50% and may
provide conductivity
• Composite plastic materials
- for strength and electrical qualities
• Tyre manufacturing
- to extend life of tyres
January 2011

MWNT Current US Market Prices(20-30nm diameter, >85% wt. purity)
Prices are anticipated to drop with increasing order size and increasing supply
January 2011

Eden MWNT Catalyst Yield(Shown in grams carbon per grams catalyst)
January 2011

25-50 Metric Tonne/Year MWCNT Scale-Up Schedule
January 2011

Hythane ® - the transitional fuel
• Premium blend of Natural Gas - complies with natural gas standards
- 5-7% H2 (by energy); 20% H2 (by volume)
H2 + CH4 ����
HythaneSignificantly lower pollution / Higher efficiency
January 2011
• Ultra-low emissions – 50% NOx /CO - meets Euro V emission standards
• High efficiency - 10-15% increase in efficiency with suitable engines
• Low engine cost -only software changes to suitable engines
• Anticipated Hythane® sale price ≈ 10% more than natural gas
• Tested over 15 years – adopted in Indian Hydrogen Roadmap
January 11 15

Denver Hythane® Emissions Results
2
2.5
3
HOT 505 EMISSIONS, GRAMS/MI.
January 2011January 11 16
THC CO NOx
0
0.5
1
1.5
NG HY NG HYNG HYHOT 505 EMISSIONS, GRAMS/MI.
Output of pollutants (grams per mile) of Natural Gas versus Hythane®. Source: Colorado Department of Health

• Extreme air pollution – Govt push to reduce pollution
• 2006 Indian hydrogen roadmap - proposes HCNG as transitional fuel
• Cost of natural gas – <60% cheaper (per GGE) than diesel
History of Hythane® in India
January 2011
• Cost of natural gas – <60% cheaper (per GGE) than diesel
Increasing supply – 5Mtpa to 25Mtpa over 5 years
National rollout of pipelines and Gas distribution networks
• 2009 First Public Hythane® station – Delhi - built by Eden
January 11 17

First Public Indian Hythane® Station
Delhi January 2009
January 2011January 11 18

LNG
JAGDISHPUR
PHOOLPUR
BHATINDA
BAREILLY
DISPUR
DELHI
AGARTALA
LUCKNOW
PATNA
KOTA
MATHANIA
GWALIOR
UJJAIN
AGRA
GAYAVARANASI
JHANSI
DAHEJ I & II
10 mmtpa*
AURAIYA
VIJAYPUR
KANPUR
NANGAL
GURGAUN
BARMER
INDIAN GAS INFRASTRUCTURE
CURRENT & FUTURE
Courtesy of Gas Authority of India
January 2011
LNG
Existing
Transmission Pipelines
Existing
Upcoming
GAIL’s Planned Pipeline
RIL’s East West Pipeline
RIL’s Planned Pipeline
GSPC’s Planned Pipeline
City Gas/ CNG
Existing
Planned
LNG Terminal
INTEGRATED GRID TO LINK ANY SOURCE TO ANY MARKET
BARODA
AHMEDABAD
RAJKOTUJJAIN
KOLKATA
BOKARO
HAZIRA
2.5 mmtpa
COIMBTORE
MANGLORE
MUMBAIBHUBANESHWAR
KRISHNAPATNAM
NELLORE
CHENNAI
TUTICORIN
TIRUCHCHIRAPALLI
HASANBANGLORE
KOLHAPUR
SOLAPURKAKINADA
VIJAYAWADA
DAMRA
DABHOL
5 mmtpa
KANJIKKOD
GOA
CUTTACK
VIJAYPUR
PUNE
BHARUCH
SURAT
HYDERABAD
RAJAMUNDRY
BHOPAL
KOCHI
5 mmtpa
ENNORE
2.5 mmtpaMANGALORE
2.5 mmtpa

• 2011 Hythane® demonstration planned – Mumbai or Gujarat
- some delay but project still looks likely
• Objective- to establish economics of a commercial Hythane®
Future of Hythane® in India
January 2011
• Agreements signed with GSPC and GAIL, MGL
• Initially 2 buses planned and expanding to 70-90 buses
• Duration- 18-24 months – then planned commercial rollout
• Potential - up to 500,000 buses over 5-10 years
• Total Market - Buses, trucks, cars, auto rickshaws, locomotives
January 11 20
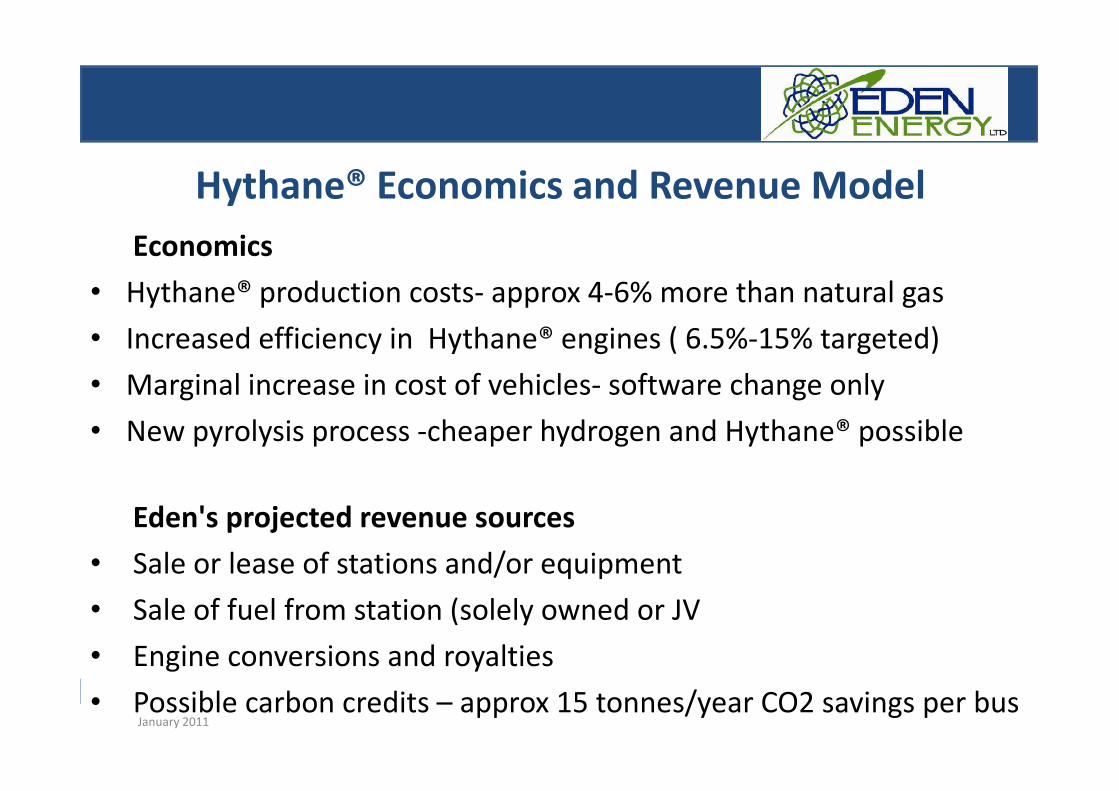
Hythane® Economics and Revenue Model
Economics
• Hythane® production costs- approx 4-6% more than natural gas
• Increased efficiency in Hythane® engines ( 6.5%-15% targeted)
• Marginal increase in cost of vehicles- software change only• Marginal increase in cost of vehicles- software change only
• New pyrolysis process -cheaper hydrogen and Hythane® possible
Eden's projected revenue sources
• Sale or lease of stations and/or equipment
• Sale of fuel from station (solely owned or JV
• Engine conversions and royalties
• Possible carbon credits – approx 15 tonnes/year CO2 savings per busJanuary 2011

Hydrogen / Hythane® at San Francisco Airport
• Alternative Fuel Station – 2011
Hydrogen fueling (by Linde)
Hythane® fueling by Eden
• Hythane® Vehicle Fleet
27 Ford E450 parking lot shuttles
Vehicles certified by California Air Resources Board
Some delay to date in finance but approvals now in place
January 2011
Hythane Vehicle
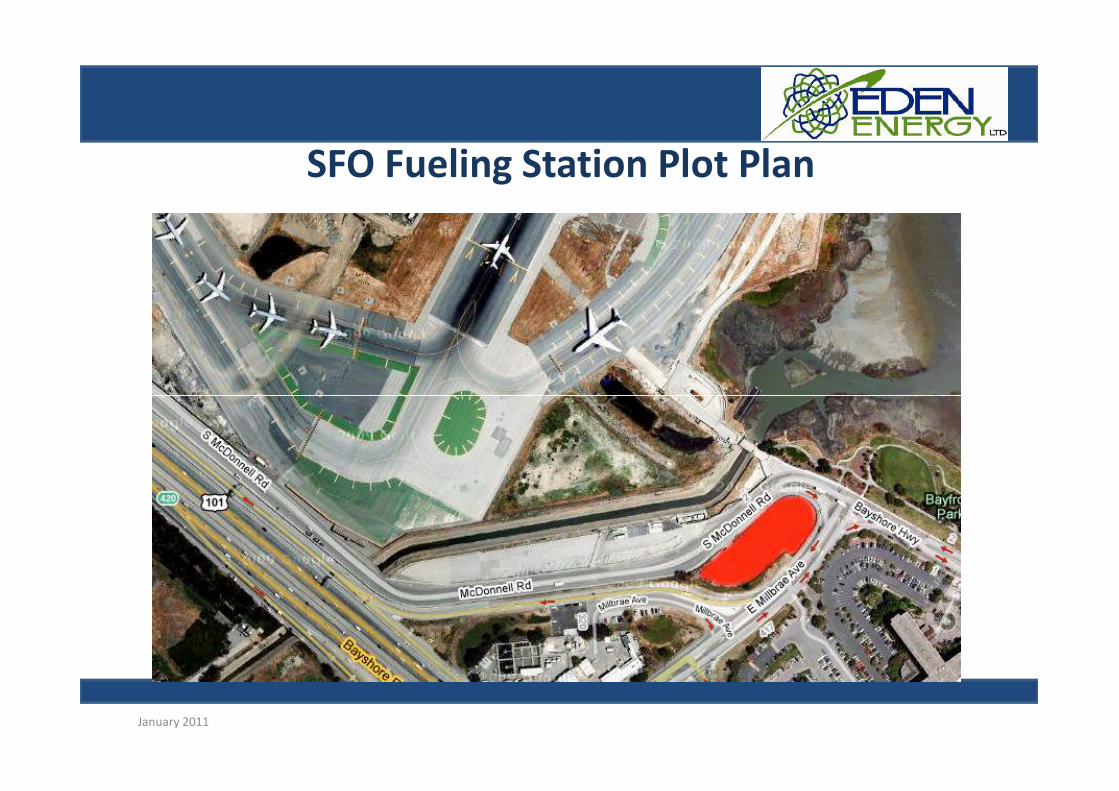
SFO Fueling Station Plot Plan
January 2011

OptiBlend Dual Fuel System
• Displaces up to 70% of diesel with natural gas in diesel engines
• Indian market – hundreds of thousands of gensets / locomotives
• Huge cost savings• Huge cost savings
• Dramatic cost savings in full and part time applications
• Payback period less than 12 months for larger gensets
• First sales of Indian and US kits – expanding with gas supplies
• Target- make Eden cash flow positive within 18-24 months
January 11January 2011

OptiBlend-Typical Power Production Costs
Assumptions: Diesel = $1.25/liter, Natural Gas = $10 mmbtu, Cummins K19 Genset
January 11January 2011

Energy Assets
• Eden - 50% Joint venture (with Coastal Oil and Gas) -11 Licences
- 5% Joint venture (with Coastal Oil and Gas / Centrica)- 4 CSM licences
- 50% Joint venture/Farm-in (with Coastal Oil and Gas ) -4 NG Licences
• 18 Petroleum Exploration and Development Blocks in Wales, SW England and Kent
• Coal Bed Methane (1-4 tcf estimated potential)
COAL BED METHANE/ CONVENTIONAL/ SHALE GAS (WALES, UK)
January 2011
• Coal Bed Methane (1-4 tcf estimated potential)
5 production test wells planned over 2-3 years
• Conventional Natural Gas- Untested
• Shale Gas –Untested
• Total area 1800km2 (500,000 acres)
• Digitised Welsh coal mine data
• High UK Gas Prices
• New joint venture company planned for 2011
January 11 26

Capital Structure 21 January 2011Capital Structure 21 January 2011
ASX Code: EDE
Total Shares: 214m
Share Price: $0.105
January 11 27
Market Capitalisation $22.5m
Cash / Receivables $2m

Eden Energy CNT Production
Hydrogen
Natural Gas Supply
Catalyst Feed
Reactor
Hydrogen Product
Carbon
Inert Gas
CNT’s
Carbon Product
CH4

Greg SolomonGreg SolomonExecutive Chairman
Level 40, Exchange Plaza,2 The Esplanade,
Perth, Western Australia,Australia. 6000
Telephone +618 9282 5889Mobile +614 0206 0000Fax +618 9282 5866
Email [email protected]: www.edenenergy.com.au

Disclaimer – Forward-looking Statements and Projections
Whilst reasonable care has been taken in compiling the forward projections in this presentation, they
necessarily are based on many assumptions and factors that are beyond the control of the company and
accordingly there is no representation or warranty given that these projections will be achieved. There are
many uncertain market and exploration risk factors on all the projects, particularly related to the energy
projects including the coal bed methane, shale gas, natural gas and geothermal projects, all of which are at
very early stages of development. On the technology projects, the risks are varied, including risk that
patent applications will not be granted, or another party may claim priority. In the Indian market, there are
many risks which are beyond the control of the company and which could significantly impact on both the
prices that are achieved , the sales turnover and the production and operating costs. These risks include
January 2011
prices that are achieved , the sales turnover and the production and operating costs. These risks include
delays in the rollout of the Natural Gas pipeline system and the accessibility of Natural Gas in India,
limitations in the available quantities of Natural Gas, increases in the price of Natural Gas, reduction in the
price of alternate fuels such as diesel, changes in Indian Government or Indian Supreme Court policies and
rulings, market competition, shortages in raw materials and labour, increases in cost of labour and
materials, national or international political or economic instability, problems with reliability of equipment
produced and sold, warranty claims, currency fluctuations, restrictions on foreign investment, disputes
with potential joint venturers, market resistance to the products or services offered, lack of available
capital or finance, restrictions on international travel and similar factors beyond the control of the
company. For these reasons, all potential investors and others must satisfy themselves on the reliability of
these forward looking projections before acting upon any information provided to them in relation to
forward looking projections, and neither the company nor any of its officers make any representations,
warranties or commitments that these or any other forward projections will necessarily be achieved.
January 11 30