greenhouse gas emissions analysis - san diego · 2.1 the greenhouse effect ... 5.2 common project...
TRANSCRIPT

APPENDIX E Greenhouse Gas Emissions Analysis


Greenhouse Gas Emissions Analysis
for the
North City Project
City of San Diego, California
PTS#499621
Prepared for:
City of San Diego – Public Utilities Department 9192 Topaz Way
San Diego, California 92123
Contact: Ms. Keli Balo
Prepared by:
605 Third Street
Encinitas, California 92024
Contact: Adam Poll, LEED AP BD+C, QEP
SEPTEMBER 2017

Printed on 30% post-consumer recycled material.

Greenhouse Gas Emissions Analysis for the North City Project
9420-04 i September 2017
TABLE OF CONTENTS
Section Page No.
ACRONYMS AND ABBREVIATIONS ..................................................................................... V
SUMMARY ................................................................................................................................VII
1 INTRODUCTION..............................................................................................................1
1.1 Purpose .................................................................................................................... 1
1.2 Project Location ...................................................................................................... 1
1.3 Project Description.................................................................................................. 2
1.3.1 Miramar Reservoir Alternative ................................................................... 3
1.3.2 San Vicente Reservoir Alternative............................................................ 18
2 EXISTING CONDITIONS .............................................................................................23
2.1 The Greenhouse Effect ......................................................................................... 23
2.2 Greenhouse Gases ................................................................................................. 23
2.2.1 Global Warming Potential ........................................................................ 25
2.3 Contributions to Greenhouse Gas Emissions ........................................................ 26
2.4 Potential Effects of Human Activity on Climate Change ..................................... 27
3 REGULATORY SETTING ............................................................................................33
3.1 Federal Activities .................................................................................................. 33
3.2 State of California ................................................................................................. 37
4 THRESHOLDS OF SIGNIFICANCE ...........................................................................55
4.1 State of California ................................................................................................. 55
4.2 City of San Diego.................................................................................................. 55
4.3 NEPA Considerations ........................................................................................... 58
5 IMPACTS .........................................................................................................................59
5.1 Generate Greenhouse Gas Emissions, Either Directly or Indirectly,
That May Have a Significant Impact on the Environment .................................. 59
5.1.1 Construction Impacts ................................................................................ 59
5.2 Common Project Components .............................................................................. 62
5.2.1 North City Water Reclamation Plant Expansion ...................................... 62
5.2.2 North City Pure Water Facility Influent Pump Station ............................. 63
5.2.3 Morena Pump Station and Pipelines ......................................................... 64
5.2.4 Metro Biosolids Center Improvements ..................................................... 66
5.2.5 North City Pump Station ........................................................................... 67
5.2.6 North City Renewable Energy Facility and Landfill Gas Pipeline ........... 68
5.2.7 North City Pure Water Facility ................................................................. 69

Greenhouse Gas Emissions Analysis for the North City Project
TABLE OF CONTENTS (CONTINUED)
Section Page No.
9420-04 ii September 2017
5.3 Miramar Reservoir Alternative Construction Emissions ...................................... 71
5.3.1 North City Pure Water Pipeline ................................................................ 71
5.3.2 Pure Water Dechlorination Facility .......................................................... 73
5.3.3 Miramar Water Treatment Plant Improvements ....................................... 74
5.3.4 Miramar Reservoir Alternative Construction Emissions .......................... 74
5.4 San Vicente Reservoir Alternative Construction Emissions ................................ 76
5.4.1 San Vicente Pure Water Pipeline .............................................................. 76
5.4.2 Mission Trails Booster Station.................................................................. 77
5.4.3 San Vicente Reservoir Alternative Construction Emissions .................... 78
5.5 Operational Impacts .............................................................................................. 79
5.5.1 Miramar Reservoir Alternative ................................................................. 79
5.5.2 San Vicente Reservoir Alternative............................................................ 85
5.6 Conflict with an Applicable Plan, Policy, or Regulation Adopted for the
Purpose of Reducing the Emissions of Greenhouse Gases .................................. 90
5.7 NEPA Considerations ........................................................................................... 96
6 REFERENCES .................................................................................................................97
APPENDICES
A CalEEMod Outputs and Estimated Emissions for the Miramar Reservoir Alternative
B CalEEMod Outputs and Estimated Emissions for the San Vicente Reservoir Alternative
C North City Renewable Energy Facility Air Modelling Analysis and Health Risk
Assessment Report
D City of San Diego Climate Action Plan Consistency Checklist Submittal Application
FIGURES
1 Regional Map .......................................................................................................................5
2 Vicinity Map ........................................................................................................................7
3 Miramar Reservoir Alternative ............................................................................................9
4 San Vicente Reservoir Alternative.....................................................................................11

Greenhouse Gas Emissions Analysis for the North City Project
TABLE OF CONTENTS (CONTINUED)
Page No.
9420-04 iii September 2017
TABLES
1.3-1 North City Project Components ...........................................................................................2
2.3-1 GHG Emissions Sources in California ..............................................................................26
5.1-1 North City Construction Phasing Assumptions .................................................................59
5.2-1 Construction Scenario Assumptions – NCWRP Expansion ..............................................62
5.2-2 Construction Scenario Assumptions – NCPWF Influent Pump Station ............................63
5.2-3 Construction Scenario Assumptions – Morena Pump Station ...........................................64
5.2-4 Morena Pipeline Alignment Summary ..............................................................................65
5.2-5 Construction Scenario Assumptions – Morena Pipelines Trenched Sections ...................65
5.2-6 Construction Scenario Assumptions – Morena Pipelines Trenchless Sections .................65
5.2-7 Construction Scenario Assumptions – MBC Improvements .............................................66
5.2-8 Construction Scenario Assumptions – North City Pump Station ......................................67
5.2-9 Construction Scenario Assumptions – North City Renewable Energy Facility ................68
5.2-10 Construction Scenario Assumptions – LFG Pipeline Trenched Sections ..........................68
5.2-11 Construction Scenario Assumptions – LFG Pipeline Trenchless Sections .......................69
5.2-12 NCPWF Building Components..........................................................................................70
5.2-13 Construction Scenario Assumptions – NCPWF ................................................................70
5.3-1 North City Pure Water Pipeline Alignment Summary ......................................................71
5.3-2 Construction Scenario Assumptions – North City Pipeline Open Trench .........................72
5.3-3 Construction Scenario Assumptions – North City Pipeline Trenchless ............................73
5.3-4 Construction Scenario Assumptions – Dechlorination Facility .........................................73
5.3-5 Construction Scenario Assumptions – Miramar WTP Improvements ..............................74
5.3-6 Estimated Construction GHG Emissions ...........................................................................75
5.4-1 San Vicente Pipeline Segment Construction Summary .....................................................76
5.4-2 Construction Scenario Assumptions – San Vicente Pipeline Open Trench ......................76
5.4-3 Construction Scenario Assumptions – San Vicente Pipeline Trenchless ..........................77
5.4-4 Construction Scenario Assumptions – MTBS ...................................................................77
5.4-5 Estimated Construction GHG Emissions ...........................................................................78
5.5-1 Estimated Annual Mobile Source GHG Emissions ...........................................................80
5.5-2 Estimated Annual Electricity Consumption GHG Emissions ...........................................81
5.5-3 Estimated Annual Wastewater Process and Discharge GHG Emissions ...........................84
5.5-4 Estimated Annual Diesel Generators GHG Emissions ......................................................85
5.5-5 Summary of Estimated Annual GHG Emissions ...............................................................85
5.5-6 Estimated Annual Motor Vehicle GHG Emissions ...........................................................86

Greenhouse Gas Emissions Analysis for the North City Project
TABLE OF CONTENTS (CONTINUED)
Page No.
9420-04 iv September 2017
5.5-7 Estimated Annual Electricity Consumption GHG Emissions ...........................................87
5.5-8 Estimated Annual Wastewater Process and Discharge GHG Emissions ...........................88
5.5-9 Estimated Annual Diesel Generators GHG Emissions ......................................................89
5.5-10 Summary of Estimated Annual GHG Emissions ...............................................................89

Greenhouse Gas Emissions Analysis for the North City Project
9420-04 v September 2017
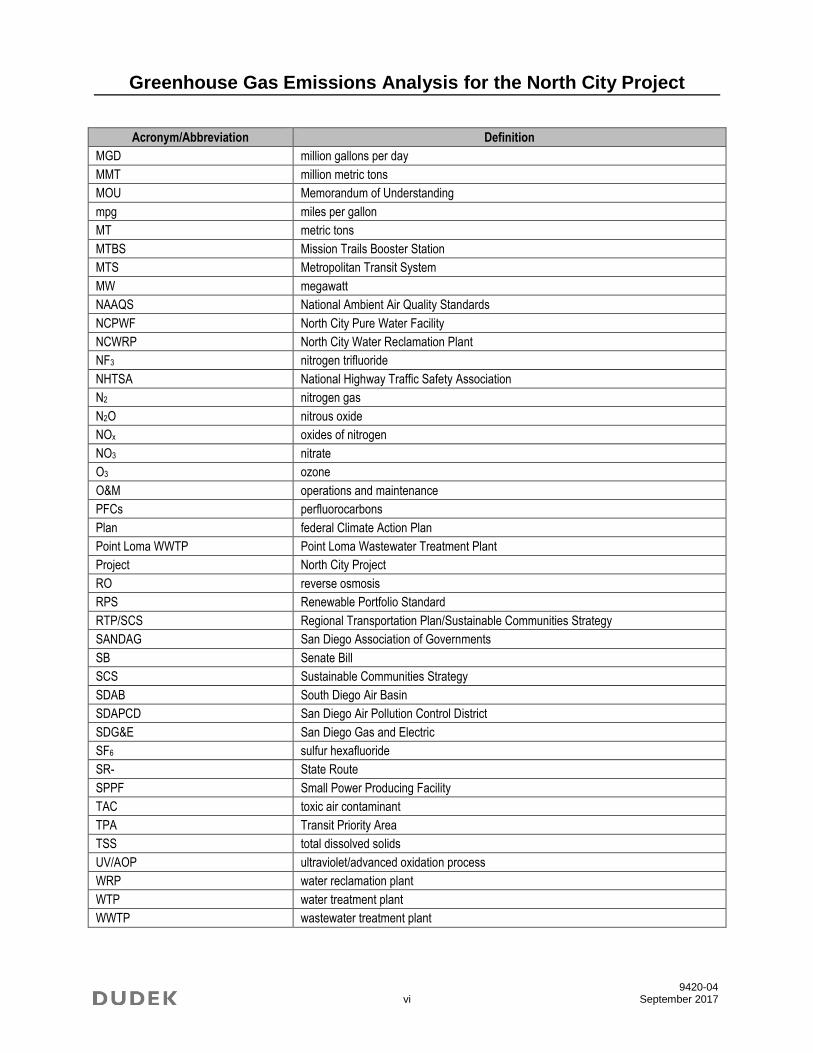
ACRONYMS AND ABBREVIATIONS
Acronym/Abbreviation Definition AADF annual average daily flow
AB Assembly Bill
BAC biological activated carbon
BAU business-as-usual
CAA Clean Air Act
CAAQS California Ambient Air Quality Standards
CAFE Corporate Average Fuel Economy
CalEEMod California Emissions Estimator Model
CALGreen California’s Green Building Standards
CalRecycle California Department of Resources Recycling and Recovery
CAP Climate Action Plan (California)
CARB California Air Resources Board
CAT Climate Action Team
CEQA California Environmental Quality Act
CH4 methane
City City of San Diego
CO2 carbon dioxide
CO2E carbon dioxide equivalent
CFCs chlorofluorocarbons
CPUC California Public Utilities Commission
EIR Environmental Impact Report
EIS Environmental Impact Statement
EO Executive Order
EPA United States Environmental Protection Agency
GHG greenhouse gas emissions
GWP global warming potential
HCFCs hydrochlorofluorocarbons
HDPE high-density polyethylene
HFCs hydrofluorocarbons
I- Interstate
ICE internal combustion engine
IPCC Intergovernmental Panel on Climate Change
kWh kilowatt-hour
lb pound
LEED Leadership in Energy and Environmental Design
LFG landfill gas
LFG Pipeline Landfill Gas Pipeline
MBC Metro Biosolids Center
MCAS Miramar Marine Corps Air Station Miramar
MF membrane filtration
MG million gallons
Greenhouse Gas Emissions Analysis for the North City Project
9420-04 vi September 2017
Acronym/Abbreviation Definition MGD million gallons per day
MMT million metric tons
MOU Memorandum of Understanding
mpg miles per gallon
MT metric tons
MTBS Mission Trails Booster Station
MTS Metropolitan Transit System
MW megawatt
NAAQS National Ambient Air Quality Standards
NCPWF North City Pure Water Facility
NCWRP North City Water Reclamation Plant
NF3 nitrogen trifluoride
NHTSA National Highway Traffic Safety Association
N2 nitrogen gas
N2O nitrous oxide
NOx oxides of nitrogen
NO3 nitrate
O3 ozone
O&M operations and maintenance
PFCs perfluorocarbons
Plan federal Climate Action Plan
Point Loma WWTP Point Loma Wastewater Treatment Plant
Project North City Project
RO reverse osmosis
RPS Renewable Portfolio Standard
RTP/SCS Regional Transportation Plan/Sustainable Communities Strategy
SANDAG San Diego Association of Governments
SB Senate Bill
SCS Sustainable Communities Strategy
SDAB South Diego Air Basin
SDAPCD San Diego Air Pollution Control District
SDG&E San Diego Gas and Electric
SF6 sulfur hexafluoride
SR- State Route
SPPF Small Power Producing Facility
TAC toxic air contaminant
TPA Transit Priority Area
TSS total dissolved solids
UV/AOP ultraviolet/advanced oxidation process
WRP water reclamation plant
WTP water treatment plant
WWTP wastewater treatment plant

Greenhouse Gas Emissions Analysis for the North City Project
9420-04 vii September 2017
SUMMARY
The North City Project (Project) is a City of San Diego Public Utilities Department plan to
produce 30 million gallons per day (MGD) of potable recycled water. The North City Project
will expand the existing North City Water Reclamation Plant (NCWRP) and construct an
adjacent North City Pure Water Facility (NCPWF). Two alternative purified water pipelines are
considered: one to Miramar Reservoir and one to San Vicente Reservoir. Other Project
components include a new pump station and wastewater forcemain to deliver additional
wastewater to the NCWRP; a brine/centrate discharge pipeline; upgrades to the existing Metro
Biosolids Center (MBC); a new renewable energy facility at the NCWRP (North City Renewable
Energy Facility); and a new Landfill Gas (LFG) Pipeline between the Miramar Landfill gas
collection system and the NCWRP.
There are two Project Alternatives proposed. The Miramar Reservoir Alternative would construct the
NCPWF – Miramar Reservoir and would pipe purified water to Miramar Reservoir. The San Vicente
Reservoir Alternative would construct the NCPWF – San Vicente Reservoir at the same location as
the NCPWF, but would include fewer treatment processes and would pipe purified water to the San
Vicente Reservoir rather than the Miramar Reservoir. The San Vicente Reservoir Alternative would
also include an additional pump station, the Mission Trails Booster Station (MTBS), along the San
Vicente Pure Water Pipeline (San Vicente Pipeline). The Miramar Reservoir Alternative would
include improvements at the Miramar Water Treatment Plant (WTP).
The Project’s potential effect on global climate change was evaluated, and emissions of
greenhouse gases (GHGs) were estimated based on the use of construction equipment and
vehicle trips associated with construction activities, as well as operational emissions once
construction phases are complete. The annual Project-generated GHG emissions were estimated
to result in a net reduction of approximately 32,367 metric tons of carbon dioxide equivalent
(MT CO2E) per year as a result of Project operations for the Miramar Reservoir Alternative and
34,930 MT CO2E for the San Vicente Reservoir Alternative. The North City Project was deemed
to be consistent with the City of San Diego’s Climate Action Plan (CAP) Measures. The Project
did not have a cumulative impact on the environment when evaluated against the City of San
Diego’s CAP Checklist. Therefore, GHG impacts would be considered less than significant.

Greenhouse Gas Emissions Analysis for the North City Project
9420-04 viii September 2017
INTENTIONALLY LEFT BLANK

Greenhouse Gas Emissions Analysis for the North City Project
9420-04 1 September 2017
1 INTRODUCTION
The North City Project would use advanced water purification technology to produce potable water
from recycled water and provide a safe, reliable, and cost-effective drinking water supply for San
Diego. The North City Project consists of the design and construction of a new North City Pure
Water Facility (NCPWF), upgrades to existing water reclamation facilities, and design and
construction of new pump stations and pipelines. The North City Project would construct the
NCPWF adjacent to the existing North City Water Reclamation Plant (NCWRP). Upgrades would
occur at the existing NCWRP in order to provide sufficient tertiary influent for the NCPWF as well
as to connect the existing centrate line with the proposed brine/centrate line. Pump station and
pipeline facilities would convey different types of flows to and from the treatment facilities for: (1)
diverting wastewater flows to NCWRP, (2) conveying recycled water to the NCPWF, (3)
conveying purified water from the NCPWF to a reservoir, and (4) transporting waste flows (brine
and sludge) from treatment processes to solids handling facilities or back into the Metro Sewer
System. Upgrades would also occur at the Metro Biosolids Center (MBC) to handle the additional
brine and sludge produced by the NCWRP expansion and advanced water purification process. A
new renewable energy facility would be constructed at NCWRP, which would receive landfill gas
(LFG) from the City’s Miramar Landfill gas collection system via a new gas pipeline.
From the NCPWF, purified water would be piped to either the Miramar Reservoir or San Vicente
Reservoir via a purified water pipeline.
The North City Project would create up to 30 million gallons per day (MGD) of locally controlled
potable water and reduce flows to the Point Loma Wastewater Treatment Plant (Point Loma
WWTP), which in turn would reduce total suspended solids (TSS) discharged to the ocean.
1.1 Purpose
The purpose of this report is to estimate and evaluate the potential greenhouse gas (GHG)
impacts associated with implementation of the North City Project (Project) relative to the City’s
Significance Determination Thresholds for GHGs (City of San Diego 2016a). The report
includes a quantitative analysis of Project-related greenhouse gas emissions.
1.2 Project Location
The Project includes a variety of facilities located throughout the central coastal areas of San
Diego County. An overview of the overall Project system is shown on Figures 1 and 2. Figures 3
and 4 show the location of proposed facilities and pipelines for the Miramar Reservoir
Alternative and San Vicente Reservoir Alternative. A new pure water facility and three pump
stations would be located within the corporate boundaries of the City of San Diego (City).
Pipelines would traverse a number of local jurisdictions, including the cities of San Diego and

Greenhouse Gas Emissions Analysis for the North City Project
9420-04 2 September 2017
Santee, and the community of Lakeside and other areas of unincorporated San Diego County, in
addition to federal lands within Marine Corps Air Station (MCAS) Miramar.
1.3 Project Description
The North City Project would use advanced water purification technology to produce purified
water from recycled water. From the NCPWF, purified water would be piped to a reservoir, where
it would blend with impounded water and imported supplies. The water would then receive further
treatment at a potable water treatment plant before being distributed as potable water.
The North City Project would create up to 30 MGD of locally controlled potable water and
reduce flows to the Point Loma WWTP, which in turn would reduce TSS discharged to the
ocean. The North City Project would construct facilities that have the ability to produce at least
30 MGD by 2021.
There are two North City Project Alternatives (Project Alternatives) proposed. The Miramar
Reservoir Alternative would construct the NCPWF – Miramar Reservoir and would convey
purified water to the Miramar Reservoir. The San Vicente Reservoir Alternative would also
construct the NCPWF – San Vicente Reservoir at the same location as the NCPWF, but would
include fewer treatment processes and would pipe purified water to the San Vicente Reservoir
rather than the Miramar Reservoir. The San Vicente Reservoir Alternative would also include an
additional pump station, the Mission Trails Booster Station (MTBS), along the San Vicente Pure
Water Pipeline (San Vicente Pipeline). The Miramar Reservoir Alternative would include
improvements at the Miramar Water Treatment Plant (WTP) (see Figure 3 for a map of facilities
proposed by the Miramar Reservoir Alternative and Figure 4 for a map of facilities proposed by the
San Vicente Reservoir Alternative). Table 1.3-1 shows a comprehensive list of all components
associated with the North City Project and which components are associated with each Project
Alternative. The two Project Alternatives are discussed in more detail below.
Table 1.3-1
North City Project Components
Segment Miramar Reservoir
Alternative San Vicente Reservoir
Alternative Morena Pump Station, Wastewater Force Main, and Brine/Centrate Line (Morena Pump Station and Pipelines)
X X
North City Water Reclamation Plant (NCWRP) Expansion X X
North City Pure Water Facility (NCPWF) Influent Pump Station X X
North City Pure Water Facility (NCPWF) X X
North City Pump Station X X
North City Pure Water Pipeline (North City Pipeline) X
San Vicente Pure Water Pipeline (San Vicente Pipeline) X

Greenhouse Gas Emissions Analysis for the North City Project
9420-04 3 September 2017
Table 1.3-1
North City Project Components
Segment Miramar Reservoir
Alternative San Vicente Reservoir
Alternative Mission Trails Booster Station (MTBS) X
Metro Biosolids Center (MBC) Improvements X X
Miramar Water Treatment Plant (WTP) Improvements X
North City Renewable Energy Facility X X
Landfill Gas (LFG) Pipeline X X
Pure Water Dechlorination Facility (Dechlorination Facility) X
1.3.1 Miramar Reservoir Alternative
The Miramar Reservoir Alternative includes (1) a new pump station at Morena Boulevard, a
wastewater forcemain, and brine/centrate pipeline (Morena Pump Station and Pipelines); (2)
expansion of the existing NCWRP; (3) construction of a new influent pump station at NCWRP
and conveyance pipeline between NCWRP and the NCPWF; (4) construction of the new
NCPWF; (5) construction of a new North City Pump Station; (6) construction of a new North
City Pure Water Pipeline (North City Pipeline); (7) construction of a new renewable energy
facility at NCWRP (North City Renewable Energy Facility); (8) a new landfill gas pipeline
between the Miramar Landfill gas collection system and the NCWRP; (9) upgrades at the MBC;
and (10) improvements at the Miramar WTP).
Figure 3 provides an overview of the Miramar Reservoir Alternative. The Miramar Reservoir
Alternative project facilities and components are described in detail below.
Morena Pump Station and Pipelines
In order to utilize the proposed expanded capacity of the NCWRP, approximately 32 MGD
annual average daily flow (AADF) of additional wastewater flows that would normally be
conveyed to the Point Loma WWTP would need to be diverted to the NCWRP. The Morena
Pump Station and Wastewater Forcemain are proposed to deliver maximum flow of 37.7 MGD
of raw wastewater to the NCWRP, expanding the NCWRP’s production capacity from 30 MGD
to 52 MGD in dry weather conditions. Wastewater will be conveyed to the Morena Pump Station
by connections with four existing sanitary sewer trunk sewers: the 78-inch North Mission Valley
Interceptor, the 72-inch Morena Boulevard Interceptor No. 14, the 33-inch Morena Boulevard
Trunk Sewer No. 11, and the 60-inch East Mission Bay Trunk Sewer No. 4.
The proposed Morena Pump Station is to be located on a parcel currently owed by the San Diego
Humane Society and the Society for the Prevention of Cruelty to Animals. The site is

Greenhouse Gas Emissions Analysis for the North City Project
9420-04 4 September 2017
approximately 1 acre and is near the intersection of Sherman Street and Custer Street. The
proposed Morena Pump Station would consist of (1) a junction structure and intake screening
facility – flow separator and screening structures, (2) a pump station building, (3) odor control
and chemical storage, (4) an energy dissipater for the 30-inch brine/centrate line, (5) a
transformer, (6) an electrical and motor control center building, and (7) a diversion structure.
The pump station will be an approximately 92-foot-long x 66-foot-wide, reinforced, cast-in-place
concrete structure. The finished floor of the pump room and wet well will be approximately 52
feet below finished grade. Due to the location of the pump station, and additional depth of 6 to
10 feet may be required for sub-grade stabilization below the groundwater level. The top slab
will extend above finish grade approximately 1 foot, 6 inches at the ridge and taper down to 1
foot, 3 inches at the edges. It is anticipated that the cast-in-place walls will be approximately 4
feet thick and include external buttresses for lateral soil support.
Off-site infrastructure of the pump station facility, excluding the Morena Wastewater Forcemain
and Brine/Centrate Line (Morena Pipelines), consists of a storm drainage line, pump station inflow
piping, overflow piping, and associated subgrade diversion structures. Diversion structure No. 1
will be approximately 14 feet long by 12 feet wide; diversion structure No. 2 will be approximately
18 feet long by 10 feet wide. Flow control gates will be installed at each diversion structure for
flow management into the pump station.
The Morena Pump Station would convey new wastewater approximately 11 miles through a new
48-inch-diameter wastewater forcemain to the existing NCWRP. The wastewater forcemain will
connect to the existing 60-inch-diameter reinforced steel (RS) line prior to entering the existing
headworks building at NCWRP.
Approximately 6 MGD AADF of brine (produced as a by-product of the advanced water purification
treatment process) and 6 MGD AADF of centrate (product remaining after centrifugation at MBC)
will be conveyed via a new 30-inch-diameter gravity flow line from the new NCPWF back to
Morena Pump Station, and then to a sanitary sewer located in Friars Road where it will ultimately
flow to the Point Loma WWTP. The brine/centrate line will combine with the 60-inch-diameter
overflow sewer and would discharge downstream of the diversion structures back to the Mission
Valley Interceptor with sufficient distance as to not recirculate brine flows into the screening
facility of the pump station.

Imperial County
O
San Diego
County San Diego CountySan Diego County
Riverside County
CampoImperialBeach
ChulaVista
NationalCity Bonita
Coronado
LemonGrove
Poway
Encinitas
San Diego
Carlsbad
SanMarcos Escondido
VistaValleyCenter
Camp PendletonSouth Hidden
MeadowsOceanside
Bonsall
CampPendleton
North
Fallbrook
Rainbow
Jamul
Rancho SanDiego
SpringValley
AlpineHarbisonCanyon
LakesidePine
Valley
El Cajon
Santee
Ramona San DiegoCountryEstates
Julian
BorregoSprings
SanClemente
DanaPoint
San JuanCapistrano
gNiguel
Temecula
Jacumba
Boulevard
Santa Ysabel
S a l t o nS e a
P a c i f i c
O c e a n
75
188
125
905
195
98
274
209
371
163
56
52
86
67
76
79
94
78
8
5
805
15
Regional MapPure Water San Diego Program North City Project Greenhouse Gas Technical Report
SOURCE: City San Diego 2016; ESRI 2016
0 105Miles
FIGURE 1
Project Alternatives,Facilities, and Pipelines
Project Alternatives,Facilities, and Pipelines

Greenhouse Gas Emissions Analysis for the North City Project
9420-04 6 September 2017
INTENTIONALLY LEFT BLANK

North City Pure Water Pipeline
Landfill GasPipeline
San VicentePure Water Pipeline
Morena Wastewater Forecemainand Brine/Centrate Line
San VicentePure Water Pipeline
56
20994
125
54
274
163
67
52
15
5
805
8
FIGURE 2
Vicinity MapPure Water San Diego Program North City Project Greenhouse Gas Technical Report
SOURCE: USGS 7.5-Minute Series Del Mar, Poway, San Vicente Reservoir, La Jolla, La Mesa, El Cajon Quadrangles; City of San Diego 2016; CA Coastal Commission
0 21Miles
North City Pure Water Pipeline
San Vicente Pure Water Pipeline
North City Pure Water Pipeline and San Vicente Pure WaterPipeline
Morena Wastewater Forcemain and Brine/Centrate Line
Landfill Gas Pipeline
Repurposed Existing 36" Pipeline
Project Facilities
City of San Diego
City of Santee
MCAS Miramar
Coastal Zone Boundary

Greenhouse Gas Emissions Analysis for the North City Project
9420-04 8 September 2017
INTENTIONALLY LEFT BLANK

North CityPure Water Facility
North City WaterReclamation Plant Expansion
Metro BiosolidsCenter Improvements
North CityPure Water Pump Station
North CityPure Water Pipeline
North City Pure Water FacilityInfluent Pump Station
Miramar Water TreatmentPlant Improvements
Pure WaterDechlorination Facility
Morena Wastewater Forcemainand Brine/Centrate Line
Landfill GasCompressor Station
Renewable Energy Facility
Landfill GasPipeline
Morena PumpStation Overflow Pipe
Subaqueous Pipeline
209
274
163
52
15
5
805
8
Miramar Reservoir
FIGURE 3
Miramar Reservoir AlternativePure Water San Diego Program North City Project Greenhouse Gas Technical Report
SOURCE: City of San Diego, 2015, 2016; SanGIS 2016
0 21Miles
Project PipelinesNorth City Pure Water Pipeline
Morena Wastewater Forcemain and Brine/Centrate Line
Landfill Gas Pipeline
North City Pure Water - Subaqueous Pipeline
Morena Wastewater Forcemain and Brine/Centrate Line - Overflow Pipes
North City Pure Water Facility
North City Pure Water Pump Station
North City Water Reclamation Plant Expansion
Miramar Water Treatment Plant Improvements
Pure Water Dechlorination Facility
Metro Biosolids Center Improvements
Morena Pump Station
LFG Compressor Station
City of San Diego

Greenhouse Gas Emissions Analysis for the North City Project
9420-04 10 September 2017
INTENTIONALLY LEFT BLANK

North CityPure Water Facility
North City WaterReclamation Plant Expansion
Mission TrailBooster Station
Metro BiosolidsCenter Improvements
North CityPure Water Pump Station
San VicentePure Water Pipeline -
Marina Alternative Terminus
San VicentePure Water Pipeline
San VicentePure Water Pipeline
North City Pure Water FacilityInfluent Pump Station
Morena Wastewater Forcemainand Brine/Centrate Line
Landfill GasCompressor Station
Renewable Energy Facility
Landfill GasPipeline
San VicentePure Water Pipeline -
In-Reservoir Alternative Terminus
San VicentePure Water Pipeline -
Tunnel Alternative Terminus
Morena PumpStation Overflow Pipe
56
125
209 94
54
274
163
67
52
8
15
5
805
San Vicente Reservoir
Miramar Reservoir
FIGURE 4
San Vicente Reservoir AlternativePure Water San Diego Program North City Project Greenhouse Gas Technical Report
SOURCE: City of San Diego, 2015, 2016; SanGIS 2016
0 21Miles
Project Facilities
North City Pure Water Facility
North City Pure Water Pump Station
North City Water Reclamation Plant Expansion
North City Pure Water Facility Influent Pump Station
Metro Biosolids Center Improvements
Mission Trails Booster Station
Morena Pump Station
LFG Compressor Station
Project Pipelines
San Vicente Pure Water Pipeline
San Vicente Pure Water Pipeline - Marina Alternative Terminus
San Vicente Pure Water Pipeline - In-Reservoir Alternative Terminus
San Vicente Pure Water Pipeline - Tunnel Alternative Terminus
Morena Wastewater Forcemain and Brine/Centrate Line
Landfill Gas Pipeline
Repurposed Existing 36" Pipeline
City of San Diego
City of Santee
LAKESIDE

Greenhouse Gas Emissions Analysis for the North City Project
9420-04 12 September 2017
INTENTIONALLY LEFT BLANK

Greenhouse Gas Emissions Analysis for the North City Project
9420-04 13 September 2017
The Morena Pipelines will follow the same alignment as depicted in Figure 2. The alignment
would begin in an open-cut section near the north corner of the Morena Pump Station site,
entering the public street right-of-way on Custer Street. The alignment would generally head
north along Sherman Street, Morena Boulevard, and West Morena Boulevard. The alignment
would cross Tecolote Road bridge and Tecolote Creek, then continue generally heading north
and east along Ingulf Street, Denver Street, Clairemont Drive, Clairemont Mesa Boulevard, and
Genesee Avenue. It would cross under the bridge at San Clemente Canyon near the State Route
52 (SR-52) on-ramp. Following the bridge, the alignment would continue along Genesee
Avenue, crossing SR-52 and the Metropolitan Transit System (MTS) railroad tracks. After the
railroad tracks, the alignment would head east on Nobel Drive and then continue heading north
on Towne Centre Drive. The alignment would turn east on Executive Drive and cross Interstate
805 (I-805). The alignment would end at NCWRP. Two trenchless installations are proposed
along the Morena Pipelines alignment and included the following: (1) the railroad tracks owned
by the MTS at Rose Canyon north of University City High School and (2) the I-805 at the
terminus of Executive Drive to the NCWRP. An additional trenchless installation would occur
where the overflow pipeline crosses MTS right-of-way near the Morena Pump Station.
North City Water Reclamation Plant Expansion
To ensure the 30 MGD of purified water can be produced at the NCPWF, the NCWRP will
undergo an expansion of the primary, secondary, and tertiary treatment processes, as well as the
corresponding support systems.
To increase capacity at the NCWRP, a number of new process units and tankage would be required.
Process units requiring expansion include influent screening, primary sedimentation, flow equalization,
aeration basins, secondary clarification, and tertiary filtration. The expanded NCWRP facilities are
expected to include an additional bar screen, grit pumps, primary sedimentation with chemically
enhanced primary treatment, a primary equalization basin, aeration basins using biological nutrient
removal, secondary clarifiers, tertiary filters, and additional ancillary and support systems.
A brine-centrate valve vault will be constructed on the NCWRP site adjacent to the tunnel that
conveys the brine/centrate and wastewater force mains on the western edge of the NCWRP next
to the existing aeration basins. The brine-centrate valve vault would be approximately 22 feet by
14 feet, within which the centrate pipeline would connect into the brine/centrate pipeline. The
vault would allow for personnel access to check valves and perform routine maintenance.
North City Pure Water Facility Influent Pump Station
The NCPWF Influent Pump Station will be constructed at the NCWRP and will convey tertiary
effluent from the NCWRP to the NCPWF. The NCPWF Influent Pump Station will have a

Greenhouse Gas Emissions Analysis for the North City Project
9420-04 14 September 2017
maximum capacity of 42.5 MGD to enable the NCPWF to produce a maximum of 34 MGD
AADF of purified water after accounting for recycle and other streams. The NCPWF Influent
Pump Station would be located on the west side of the NCWRP adjacent to the tertiary filters to
divert tertiary effluent from upstream of the chlorination facilities and pump it to the NCPWF.
The NCPWF Influent Pump Station would consist of a single enclosed 6,700-square-foot
building approximately 45 feet high and would contain three separate rooms: a pump room,
HVAC equipment room, and electrical room.
A pump station and associated pipes and appurtenances are currently located within the site.
These components will be removed prior to construction of the NCPWF Influent Pump Station.
The site is partly covered with grass and is relatively flat.
North City Pure Water Facility
The new NCPWF would be located on the vacant 10-acre City-owned lot across Eastgate Mall to the
north of the NCWRP. The NCPWF would produce 30 MGD AADF of purified water. A portion of
the purified water would be returned to the NCWRP to reduce the TSS concentration of the
disinfected tertiary treated effluent to 1,000 milligrams per liter (mg/L), a level suitable for irrigation.
Approximately 30 MGD AADF of purified water will be pumped to Miramar Reservoir.
The treatment process includes an ozone system, biological activated carbon filtration (BAC),
membrane filtration (MF), reverse osmosis (RO), and ultraviolet/advanced oxidation process
(UV/AOP), before it is stabilized and chlorinated prior to pumping out to the reservoir (note
under the San Vicente Reservoir Alternative the NCPWF would not include the ozone system or
BAC). In addition to process areas for each stage of treatment at the NCPWF, the facility would
include chemical feed systems and post-treatment chemical storage.
Access to the site will be from Eastgate Mall, and the entrance will be coordinated with the
entrance to the NCWRP to be at the same traffic signal along Eastgate Mall. An approximately
15,000-square-foot operations and maintenance (O&M) building with three above-grade stories
will be built as part of the NCPWF. The third level of the O&M building will be dedicated for a
water quality testing laboratory.
North City Pure Water Pump Station
The North City Pump Station would be located on the southeast corner of the NCPWF. The
North City Pump Station will have three duty pumps and one standby pump, all of which are
1,000 horsepower (HP) motor pumps and vertical-turbine. Each pump will be design to deliver a
flow rate of 7,593 gallons per minute. The North City Pump Station will serve as the NCPWF’s
only effluent pump station and will convey purified water from the NCPWF Product Water
Storage Tank to a reservoir.

Greenhouse Gas Emissions Analysis for the North City Project
9420-04 15 September 2017
North City Pure Water Pipeline
The North City Pipeline will transmit purified water approximately 8 miles from the NCPWF to
Miramar Reservoir where it will be blended with the imported raw water in the Miramar
Reservoir and receive additional treatment at the Miramar WTP.
The North City Pipeline will be designed for an average daily flow of 30 MGD with a minimum
daily flow of 23 MGD and a maximum daily flow of 33 MGD. A 48-inch-diameter welded steel
pipe is the recommended width and material for the North City Pipeline as the most suitable for
the design conditions.
The North City Pipeline alignment is shown on Figure 2. Detailed cross sections of the North
City Pipeline are included on Sheets C1 through C51 in the Basis of Design Report for the North
City Conveyance System (Brown and Caldwell 2016). The North City Pipeline is proposed to
travel through the University, Mira Mesa, and Scripps Miramar Ranch communities (City of
San Diego). The North City Pipeline would also cross federal lands in MCAS Miramar along
segments of Miramar Road and would cross an unincorporated area of the County of San
Diego immediately after the I-15 crossing.
The North City Pipeline alignment would begin in an open trench in Eastgate Mall and would head
southeast, with a short trenchless section just before Eastgate Court. At Miramar Road, the North
City Pipeline would continue east for approximately 4.5 miles, with a bridge over the MTS
Railway crossing and a short trenchless section under the BNSF Railway crossing. The North City
Pipeline would turn north on Kearny Villa Road and then turn east on Candida Street. The North
City Pipeline would head north on Via Pasar via a trenchless segment, and then continue east on
Via Excelencia in an open-cut section. A trenchless segment would cross I-15 then would return to
an open-cut section across private property then turn north on Businesspark Avenue. The North
City Pipeline would continue north on Carroll Canyon Road then head east on Hoyt Park Drive
and Meanley Drive, continuing east/northeast before crossing Evans Pond in a trenchless segment.
The final segment of the North City Pipeline will consist of a subaqueous pipeline within
Miramar Reservoir. The segment of pipeline will begin at the Miramar WTP site and continue to
the far east bank of Miramar Reservoir. The pipeline would be a submerged, 4,800-foot-long
HDPE pipe ranging in diameter from 8 inches to 54 inches with 94 outlets and 188 subaqueous
diffusers along the bottom of Miramar Reservoir.
North City Renewable Energy Facility
The Project requires new renewable energy facilities in order to provide power to the expanded
NCWRP facilities as well as the NCPWF and North City Pump Station. The new facility

Greenhouse Gas Emissions Analysis for the North City Project
9420-04 16 September 2017
includes a total of 15.4 megawatts (MW) of new generation capacity combined with 5 MW of
existing power generation capacity at NCWRP.
The new North City Renewable Energy Facility consists of 6.3 MW of new capacity in a Small
Power Producing Facility (SPPF) that uses 100% LFG as fuel. The additional 9.1 MW of new
power generation capacity within the facility uses LFG supplemented with natural gas as fuels,
with 80% LFG and 20% natural gas.
The SPPF system requires a total of three new internal combustion engines (ICE) and generator
units, the 3.8 MW Caterpillar Model CG260-16 IC or equivalent. The remaining power
generation capacity requires a total of three new ICE and generator units, the same model as the
SPPF. One additional 3.8 MW Caterpillar Model CG260-16 IC or equivalent ICE will serve as
backup to the SPPF engines or the mixed-gas power generation engines.
The engines will be placed inside a building located immediately south of the new circular
secondary clarifiers and north of the existing emergency power generation facility at NCWRP.
The estimated stack height of the engines’ exhaust stacks is 55 feet measured from the finished
ground elevation immediately adjacent to the renewable energy building (at approximate
elevation 354 feet) which is approximately 30 feet above the top of the building.
A skid-mounted equipment package consisting of a natural gas compressor system, air receivers,
and oil storage will be located on the site adjacent to the renewable energy building. Two
additional buildings will be included on the site for controls equipment and storage. The facility
will also include a gas cleaning and cooling equipment skid and an electrical switchyard. An area
chemical storage, containment, and feed facility will be provided for emissions control.
The facility layout includes relocation of the City’s existing 1.6 MW SPPF engine to a new
location on the site near the existing emergency power generation equipment at NCWRP in order
to accommodate the layout of the new renewable energy facility.
The expanded renewable energy facility covers an area of approximately 1 acre and is fully
contained within the existing NCWRP property. Approximately half of that area is existing
impervious paved surface, and the entire area will be impervious once the facility is constructed.
The site topography for the new renewable energy facility at NCWRP will necessitate a perimeter
retaining wall approximately 300 feet in length with a maximum height of 22 feet. The retaining
wall will be either a mechanically stabilized earth wall or reinforced concrete. The Project will
include earthwork and other site preparation activities for construction of the retaining wall. The
renewable energy facility will include utility relocations, new utilities, equipment, earthwork,
retaining wall, paving, and other site-preparation activities.

Greenhouse Gas Emissions Analysis for the North City Project
9420-04 17 September 2017
Landfill Gas Pipeline
The new North City Renewable Energy Facility will receive LFG from the City’s Miramar
Landfill gas collection system via a new 12-inch diameter gas line. The new gas line will parallel
an existing 10-inch gas line that conveys LFG from the landfill to fuel the existing emergency
power generation units at NCWRP. Approximately 3,627 linear feet of the new gas pipeline will
be constructed within the limits of the City’s existing 40-foot utility easement where it crosses
the Veteran’s Administration (VA) Miramar National Cemetery. An expanded additional 10-foot
easement is planned along the remainder of the alignment outside of the VA to facilitate
construction and future maintenance activities. The approximately 15,885 linear feet alignment
runs from the existing Miramar Landfill north along the western end of the MCAS Miramar
property to the NCWRP site.
A new 5,000-square-foot gas compressor station will be sited immediately adjacent to an existing
gas compressor station at the Miramar Landfill in order to pressurize and convey the LFG gas from
the landfill to NCWRP.
Metro Biosolids Center Improvements
The MBC is located north of SR-52, adjacent to the Miramar Landfill. Projected flows of raw
solids from the NCWRP will increase, while projected flows of digested solids from Point Loma
WWTP will remain roughly constant such that MBC will be required to provide on-site anaerobic
digestion for a greater percentage of the system’s biosolids output. In addition to changes in
quantity, changes in treatment processes at the NCWRP and Point Loma WWTP may change the
quality, and hence treatability, of the two biosolids streams. Raw solids flows are expected to
increase by a factor of 7 from a current maximum operating flow of 0.89 MGD to a projected flow
of 6.55 MGD at maximum conditions; solids in pounds per day (lb/d) are expected to increase by a
factor of 5:1 from 56,000 lb/d (current) to 294,000 lb/d (maximum conditions).
Improvements at MBC would include expanding the existing closed-loop grit removal system;
replacing the existing thickening centrifuges (a total of six new centrifuges will be installed);
upgrading digesters, including replacing the existing digester gas laterals with larger lines and
larger gas handling appurtenances, installing one additional flare, and replacing existing biogas
booster blowers with three new blowers and increasing the size of the biogas feed line from the
blowers to the cogeneration facility; installing new thickened sludge supply line; upgrading the
sludge feed pumps and polymer feed pumps; installing three new centrate pumps and variable
frequency drives; adding a fourth off-the-shelf replacement peristaltic pump; and expansion of
existing piping systems. The current centrate pump station at MBC would require pumps to be
upgraded to be capable of higher flows and pressure. In addition, the centrate forcemain would
need regular maintenance to clean the pipe and restore capacity to its full potential. As part of the

Greenhouse Gas Emissions Analysis for the North City Project
9420-04 18 September 2017
pipe cleaning, existing plug valves would need to be replaced with full port valves. Launching
and receiving pits may need to be constructed.
Miramar Water Treatment Plant Improvements
Under the Miramar Reservoir Alternative, purified water discharged into the Miramar Reservoir
will be pumped via the existing Miramar Reservoir Pump Station to the Miramar WTP for
treatment and eventual distribution. Currently, the majority of the water treated at the Miramar
WTP is fed directly to the plant, and the Miramar Reservoir is primarily used for balancing flows
and emergency storage. Under the Miramar Reservoir Alternative, the Miramar Reservoir will
receive approximately 30 MGD AADF of purified water on a more or less continuous basis,
meaning that the Miramar Reservoir Pump Station must operate at roughly 30 MGD AADF to
maintain the inflow/outflow balance in the reservoir.
This increased use calls for rehabilitation of the Miramar Reservoir Pump Station, which
includes upgrading the existing pumps with variable frequency drives along with various
mechanical upgrades to the valves and piping. The additional pumping will result in an
additional annual power demand of 586,000 kilowatt-hours (kWh). However, an on-site 1 MW
solar photovoltaic system will be installed to completely cover the power needs of the facility.
Pure Water Dechlorination Facility
The Dechlorination Facility will be located at the end of Meanley Drive off the cul-de-sac on the
City’s property for the Miramar Recycled Water Storage Tank. The facility will include an
approximately 768-square-foot above-grade building to house chemical storage tanks, dosing pumps,
analyzers, and associated piping valves and appurtenances. The NCPWF purified water will be
chlorinated to maintain chlorine residual and prevent regrowth within the North City Pipeline. Prior
to blending the purified water with the raw water at Miramar Reservoir, the remaining free chlorine
residual will be removed from the purified water to protect the aquatic life in the lake. The
Dechlorination Facility would reduce the residual chlorine concentration to below the required limit.
1.3.2 San Vicente Reservoir Alternative
The San Vicente Reservoir Alternative shares most of the same components with the Miramar
Reservoir Alternative. Project components described above under the Miramar Reservoir
Alternative that are also common to the San Vicente Reservoir Alternative include (1) the
Morena Pump Station and Pipelines, (2) expansion of the existing NCWRP, (3) construction of a
new influent pump station at NCWRP and conveyance pipeline between NCWRP and the
NCPWF, (4) a new renewable energy facility at the NCWRP, (5) a new gas pipeline between the
Miramar Landfill gas collection system and the NCWRP, and (6) upgrades at the MBC.

Greenhouse Gas Emissions Analysis for the North City Project
9420-04 19 September 2017
Because of the different sizes of the Miramar Reservoir and San Vicente Reservoir, the design of
the NCPWF for each will be slightly different. However, for the purposes of the noise analysis, the
facilities would be similar enough that no additional discussion is provided under this alternative,
and the reader is referred to the discussion under the Miramar Reservoir Alternative. Project
components which are applicable only to the San Vicente Reservoir Alternative are discussed
separately below and include (1) San Vicente Purified Water Pipeline (San Vicente Pipeline)
including the three alternative reservoir inlet options: Tunnel Alternative Terminus, In-Reservoir
Alternative Terminus, and Marina Alternative Terminus; and (2) Mission Trails Booster Station
(MTBS). Figure 4 provides an overview of the San Vicente Reservoir Alternative.
San Vicente Pipeline
The San Vicente Pipeline will be designed for an average daily flow of 30 MGD with a
minimum daily flow of 27 MGD and a maximum daily flow of 35 MGD. The San Vicente
Pipeline includes a segment (approximately 21,300 linear feet) of existing recycled water pipe
that will be repurposed for purified water conveyance. That segment currently serves non-
potable reuse customers. Under the San Vicente Reservoir Alternative, the San Vicente Pipeline
will continue to supply those non-potable reuse customers with purified water. Approximately
1.4 MGD AADF will be provided as non-potable reuse to existing customers.
The remaining 133,475 linear feet of the San Vicente Pipeline would be newly constructed
using a combination of open-cut trench and trenchless construction methods to deliver 30
MGD AADF to the San Vicente Reservoir. A 48-inch-diameter and 60-inch-diameter welded
steel pipe is the recommended width and material for the San Vicente Pipeline as the most
suitable for the design conditions.
The general alignment of the San Vicente Pipeline is shown on Figure 4. Detailed cross sections of
the San Vicente Pipeline are included on Sheets 7 through 89 in Appendix K of the 10%
Engineering Design Report North City Plant to San Vicente Pipeline (Brown and Caldwell 2015).
The pipeline is proposed to travel through the University, Kearny Mesa, Navajo, and Tierrasanta,
and East Elliot communities of the City of San Diego; the City of Santee; and the incorporated
community of Lakeside in the County of San Diego.
The first approximately 5,500 linear feet of the San Vicente Pipeline would follow the same
alignment as the North City Pipeline along Eastgate Mall. At Miramar Road, purified water
would be conveyed via an existing 36-inch-diameter recycled water pipeline for approximately
21,300 linear feet as described above. This repurposed 36-inch-diameter pipeline traverses
federal lands, including the Miramar National Cemetery and MCAS Miramar. The new 48-inch-
diameter San Vicente Pipeline would begin again in an open-cut segment on Copley Drive and
would continue southeast until heading due east on Copley Park Place, then south on Convoy

Greenhouse Gas Emissions Analysis for the North City Project
9420-04 20 September 2017
Street, then east again on Convoy Court. The San Vicente Pipeline would continue east on
Mercury Court, passing through various business park and industrial uses before heading south
on Industrial Park Driveway.
A trenchless segment would cross Clairemont Mesa Boulevard, and the San Vicente Pipeline
would continue south on Ronson Court before heading east on Ronson Road. A trenchless
segment would cross SR-163, and then the San Vicente Pipeline would continue again in an
open-cut segment east along Lightwave Avenue. The alignment would continue north on Ruffin
Road, east on Clairemont Mesa Boulevard and then south on Murphy Canyon Road. At Elanus
Canyon, the alignment would head east across a parking lot before crossing I-15 in a trenchless
segment and traversing the canyon until rejoining Clairemont Mesa Boulevard. At Santo Road
the alignment would head south then east along Tierrasanta Boulevard. A trenchless segment
would continue south across the San Diego River and then the alignment would turn east on
Mission Gorge Road, traversing the Mission Trails Regional Park. A trenchless segment would
cross the SR-52 at West Hills Parkway before continuing east on Carlton Oaks Drive. The
alignment would leave the roadway right-of-way for a short segment and then cross Sycamore
Canyon via a trenchless crossing before continuing east again within Carlton Oaks Drive.
The San Vicente Pipeline would continue north on Halberns Boulevard, then east on Mast
Boulevard with another trenchless segment between two disconnected portions of Mast
Boulevard. The alignment would continue east on Riverside Drive and Lakeside Avenue before
connecting with Willow Road. From Willow Road the San Vicente Pipeline would turn north on
Moreno Avenue, continuing north to the shore of the San Vicente Reservoir.
San Vicente Reservoir Inlet Alignment Alternatives
The San Vicente Reservoir Alternative proposes three alternative reservoir inlet options: (1) a
Tunnel Alternative Terminus, (2) an In-Reservoir Alternative Terminus, and (3) a Marina
Alternative Terminus.
For the Tunnel Alternative Terminus, an approximately 5,400-linear-foot tunnel would be
located at the end of the San Vicente Pipeline. The Tunnel Alternative Terminus would
discharge 32 feet above the spillway elevation of the San Vicente Dam (elevation 766 feet) into a
reinforced concrete discharge structure and flow down a natural drainage way into the San
Vicente Reservoir. Prior to the structure itself, a dechlorination injection point is envisioned to be
incorporated to eliminate any residual chlorine in the purified water prior to discharge.
Monitoring and injection equipment could be located on an existing City property nearby or at
the structure itself, provided regular maintenance can be accommodated.

Greenhouse Gas Emissions Analysis for the North City Project
9420-04 21 September 2017
The In-Reservoir Alternative Terminus would continue via open trench from Moreno Avenue
approximately 6,900 linear feet up the existing Marina access road to the San Vicente
Reservoir’s western side near the newly constructed Marina. An approximately 10,000-linear-
foot subaqueous pipeline constructed of HDPE would then convey water across the San Vicente
Reservoir, existing up the far bank where it would connect to the same discharge structure as
proposed for the Tunnel Alternative Terminus. The subaqueous pipeline would be weighted to
ensure it remains on the San Vicente Reservoir bottom in its final position.
The Marina Alternative Terminus would follow the same alignment as the In-Reservoir
Alternative Terminus from the intersection of Vigilante Road and Moreno Avenue along the
Marina access road. At the road’s high point, near the saddle dam, the pipeline would continue in
the access road to the Marina parking area rather than transition to a subaqueous pipeline. The
pipeline would continue in the access road that runs along the shoreline and would discharge at
the western shore of the San Vicente Reservoir. The Marina Alternative Terminus pipeline
would be approximately 8,625 linear feet.
Mission Trails Booster Station
The MTBS will receive purified water pumped from the North City Pump Station via the San
Vicente Pipeline. The purified water will be pumped from the MTBS to the San Vicente
Reservoir via the San Vicente Pipeline. The MTBS will be located along Mission Gorge Road
across two privately owned parcels. The MTBS will have three duty pumps and one standby
pump, all of which are 1,000 HP vertical-turbine motor pumps.

Greenhouse Gas Emissions Analysis for the North City Project
9420-04 22 September 2017
INTENTIONALLY LEFT BLANK

Greenhouse Gas Emissions Analysis for the North City Project
9420-04 23 September 2017
2 EXISTING CONDITIONS
2.1 The Greenhouse Effect
Climate change refers to any significant change in measures of climate, such as temperature,
precipitation, or wind, lasting for an extended period (decades or longer). Gases that trap heat in
the atmosphere are often called GHGs. The greenhouse effect traps heat in the troposphere
through a threefold process: short-wave radiation emitted by the Sun is absorbed by the Earth;
the Earth emits a portion of this energy in the form of long-wave radiation; and GHGs in the
upper atmosphere absorb this long-wave radiation and emit it into space and back toward the
Earth. This “trapping” of the long-wave (thermal) radiation emitted back toward the Earth is the
underlying process of the greenhouse effect.
The greenhouse effect is a natural process that contributes to regulating the Earth’s temperature.
Without it, the temperature of the Earth would be about 0° Fahrenheit (°F; −18° Celsius (°C))
instead of its current 57°F (15°C) (Qiancheng 1998). Global climate change concerns are
focused on whether human activities are leading to an enhancement of the greenhouse effect.
2.2 Greenhouse Gases
GHGs include, but are not limited to, carbon dioxide (CO2), methane (CH4), nitrous oxide (N2O),
O3, water vapor, fluorinated gases (hydrofluorocarbons (HFCs), perfluorocarbons (PFCs), sulfur
hexafluoride (SF6) and nitrogen trifluoride (NF3)), chlorofluorocarbons (CFCs), and
hydrochlorofluorocarbons (HCFCs). Some GHGs, such as CO2, CH4, and N2O, occur naturally and
are emitted to the atmosphere through natural processes and human activities. Of these gases, CO2
and CH4 are emitted in the greatest quantities from human activities. Manufactured GHGs, which
have a much greater heat-absorption potential than CO2, include fluorinated gases, such as HFCs,
PFCs, and SF6, which are associated with certain industrial products and processes. A summary of
the most common GHGs and their sources is included in the following text.1
Carbon Dioxide. CO2 is a naturally occurring gas and a by-product of human activities and is
the principal anthropogenic GHG that affects the Earth’s radiative balance. Natural sources of
CO2 include respiration of bacteria, plants, animals, and fungus; evaporation from oceans,
volcanic out-gassing; and decomposition of dead organic matter. Human activities that generate
CO2 are from the combustion of coal, oil, natural gas, and wood.
1 The descriptions of GHGs are summarized from the Intergovernmental Panel on Climate Change (IPCC)
Second Assessment Report (1995), IPCC Fourth Assessment Report (2007), the California Air Resources
Board’s (CARB’s) Glossary of Terms Used in GHG Inventories (2015), and the U.S. Environmental Protection
Agency’s (EPA’s) Glossary of Climate Change Terms (2016).

Greenhouse Gas Emissions Analysis for the North City Project
9420-04 24 September 2017
Methane. CH4 is a flammable gas and is the main component of natural gas. Methane is
produced through anaerobic (without oxygen) decomposition of waste in landfills, flooded rice
fields, animal digestion, decomposition of animal wastes, production and distribution of natural
gas and petroleum, coal production, and incomplete fossil fuel combustion.
Nitrous Oxide. Sources of N2O include soil cultivation practices (microbial processes in soil
and water), especially the use of commercial and organic fertilizers, manure management,
industrial processes (such as in nitric acid production, nylon production, and fossil -fuel-fired
power plants), vehicle emissions, and the use of N2O as a propellant (such as in rockets,
racecars, aerosol sprays).
Fluorinated Gases. Fluorinated gases (also referred to as F-gases) are synthetic, powerful GHGs
that are emitted from a variety of industrial processes. Fluorinated gases are commonly used as
substitutes for stratospheric ozone-depleting substances (e.g., CFCs, HCFCs, and halons). The
most prevalent fluorinated gases include the following:
Hydrofluorocarbons: HFCs are compounds containing only hydrogen, fluorine, and
carbon atoms. HFCs are synthetic chemicals that are used as alternatives to ozone-
depleting substances in serving many industrial, commercial, and personal needs. HFCs
are emitted as by-products of industrial processes and are used in manufacturing.
Perfluorocarbons: PFCs are a group of human-made chemicals composed of carbon and
fluorine only. These chemicals were introduced as alternatives, along with HFCs, to the
ozone depleting substances. The two main sources of PFCs are primarily aluminum
production and semiconductor manufacturing. Since PFCs have stable molecular structures
and do not break down through the chemical processes in the lower atmosphere, these
chemicals have long lifetimes, ranging between 10,000 and 50,000 years.
Sulfur Hexafluoride: SF6 is a colorless gas that is soluble in alcohol and ether and
slightly soluble in water. SF6 is used for insulation in electric power transmission and
distribution equipment, semiconductor manufacturing, the magnesium industry, and as a
tracer gas for leak detection.
Nitrogen trifluoride: NF3 is used in the manufacture of a variety of electronics, including
semiconductors and flat panel displays.
Chlorofluorocarbons. CFCs are synthetic chemicals that have been used as cleaning solvents,
refrigerants, and aerosol propellants. CFCs are chemically unreactive in the lower atmosphere
(troposphere) and the production of CFCs was prohibited in 1987 due to the chemical destruction
of stratospheric O3.

Greenhouse Gas Emissions Analysis for the North City Project
9420-04 25 September 2017
Hydrochlorofluorocarbons. HCFCs are a large group of compounds, whose structure is very
close to that of CFCs—containing hydrogen, fluorine, chlorine, and carbon atoms—but including
one or more hydrogen atoms. Like HFCs, HCFCs are used in refrigerants and propellants.
HCFCs were also used in place of CFCs for some applications; however, their use in general is
being phased out.
Black Carbon. Black carbon is a component of fine particulate matter, which has been identified
as a leading environmental risk factor for premature death. It is produced from the incomplete
combustion of fossil fuels and biomass burning, particularly from older diesel engines and forest
fires. Black carbon warms the atmosphere by absorbing solar radiation, influences cloud
formation, and darkens the surface of snow and ice, which accelerates heat absorption and
melting. Black carbon is a short-lived species that varies spatially, which makes it difficult to
quantify the global warming potential (GWP). Diesel particulate matter emissions are a major
source of black carbon and are also toxic air contaminants (TACs) that have been regulated and
controlled in California for several decades to protect public health. In relation to declining
diesel particulate matter from the California Air Resources Board’s (CARB’s) regulations
pertaining to diesel engines, diesel fuels, and burning activities, CARB estimates that annual
black carbon emissions in California have reduced by 70% between 1990 and 2010, with 95%
control expected by 2020 (CARB 2014a).
Water Vapor. The primary source of water vapor is evaporation from the ocean, with additional
vapor generated by sublimation (change from solid to gas) from ice and snow, evaporation from
other water bodies, and transpiration from plant leaves. Water vapor is the most important,
abundant, and variable GHG in the atmosphere and maintains a climate necessary for life.
Ozone. Tropospheric O3, which is created by photochemical reactions involving gases from both
natural sources and human activities, acts as a GHG. Stratospheric O3, which is created by the
interaction between solar ultraviolet radiation and molecular oxygen (O2), plays a decisive role in the
stratospheric radiative balance. Depletion of stratospheric O3, due to chemical reactions that may be
enhanced by climate change, results in an increased ground-level flux of ultraviolet-B radiation.
Aerosols. Aerosols are suspensions of particulate matter in a gas emitted into the air through
burning biomass (plant material) and fossil fuels. Aerosols can warm the atmosphere by
absorbing and emitting heat and can cool the atmosphere by reflecting light.
2.2.1 Global Warming Potential
Gases in the atmosphere can contribute to climate change both directly and indirectly. Direct
effects occur when the gas itself absorbs radiation. Indirect radiative forcing occurs when
chemical transformations of the substance produce other GHGs, when a gas influences the

Greenhouse Gas Emissions Analysis for the North City Project
9420-04 26 September 2017
atmospheric lifetimes of other gases, and/or when a gas affects atmospheric processes that alter
the radiative balance of the Earth (e.g., affect cloud formation or albedo) (EPA 2015).
The Intergovernmental Panel on Climate Change (IPCC) developed the GWP concept to
compare the ability of each GHG to trap heat in the atmosphere relative to another gas. The
GWP of a GHG is defined as the ratio of the time-integrated radiative forcing from the
instantaneous release of 1 kilogram of a trace substance relative to that of 1 kilogram of a
reference gas (IPCC 2014). The reference gas used is CO2; therefore, GWP-weighted emissions
are measured in metric tons of CO2 equivalent (MT CO2E).
The current version of the California Emissions Estimator Model (CalEEMod) (version
2016.3.1) assumes that the GWP for CH4 is 25 (which means that emissions of 1 MT of CH4
are equivalent to emissions of 25 MT of CO2), and the GWP for N2O is 298, based on the
IPCC Fourth Assessment Report (IPCC 2007). The GWP values identified in CalEEMod were
applied to the Project.
2.3 Contributions to Greenhouse Gas Emissions
Per the EPA’s Inventory of U.S. Greenhouse Gas Emissions and Sinks: 1990–2013 (EPA 2015),
total U.S. GHG emissions were approximately 6,870.5 million metric tons (MMT) CO2E in 2014.
The primary GHG emitted by human activities in the United States was CO2, which represented
approximately 80.9% of total GHG emissions (5,556.0 MMT CO2E). The largest source of CO2,
and of overall GHG emissions, was fossil-fuel combustion, which accounted for approximately
93.7% of CO2 emissions in 2014 (5,208.2 MMT CO2E). Total U.S. GHG emissions have increased
by 7.4% from 1990 to 2014, and emissions increased from 2013 to 2014 by 1.0% (70.5 MMT
CO2E). Since 1990, U.S. GHG emissions have increased at an average annual rate of 0.3%;
however, overall, net emissions in 2014 were 8.6% below 2005 levels (EPA 2015).
According to California’s 2000–2014 GHG emissions inventory (2016 edition), California emitted
441.5 MMT CO2E in 2014, including emissions resulting from out-of-state electrical generation
(CARB 2016). The sources of GHG emissions in California include transportation, industry, electric
power production from both in-state and out-of-state sources, residential and commercial activities,
agriculture, high GWP substances, and recycling and waste. The California GHG emission source
categories and their relative contributions in 2014 are presented in Table 2.3-1.
Table 2.3-1
GHG Emissions Sources in California
Source Category Annual GHG Emissions (MMT CO2E) Percent of Totala Transportation 159.53 36%
Industrial uses 93.32 21%

Greenhouse Gas Emissions Analysis for the North City Project
9420-04 27 September 2017
Table 2.3-1
GHG Emissions Sources in California
Source Category Annual GHG Emissions (MMT CO2E) Percent of Totala Electricity generationb 88.24 20%
Residential and commercial uses 38.34 9%
Agriculture 36.11 8%
High global warming potential substances 17.15 4%
Recycling and waste 8.85 2%
Totals 441.54 100% Source: CARB 2016. Notes: Emissions reflect the 2014 California GHG inventory. MMT CO2E = million metric tons of CO2 equivalent per year
a Percentage of total has been rounded, and total may not sum due to rounding. b Includes emissions associated with imported electricity, which account for 36.51 MMT CO2E annually.
During the 2000 to 2014 period, per-capita GHG emissions in California have continued to drop
from a peak in 2001 of 13.9 metric tons (MT) per person to 11.4 MT per person in 2014,
representing an 18% decrease. In addition, total GHG emissions in 2014 were 2.8 MMT CO2E
less than 2013 emissions. The declining trend in GHG emissions, coupled with programs that
will continue to provide additional GHG reductions going forward, demonstrates that California
is on track to meet the statewide 2020 target of 431 MMT CO2E established by Assembly Bill
(AB) 32, discussed in the following text (CARB 2016).
2.4 Potential Effects of Human Activity on Climate Change
Globally, climate change has the potential to affect numerous environmental resources through
uncertain impacts related to future air temperatures and precipitation patterns. The 2014 IPCC
Synthesis Report indicated that warming of the climate system is unequivocal and since the
1950s, many of the observed changes are unprecedented over decades to millennia. Signs that
global climate change has occurred include warming of the atmosphere and ocean, diminished
amounts of snow and ice, and rising sea levels (IPCC 2014).
In California, climate change impacts have the potential to affect sea level rise, agriculture,
snowpack and water supply, forestry, wildfire risk, public health, and electricity demand and
supply. The primary effect of global climate change has been a 0.2°C rise in average global
tropospheric temperature per decade, determined from meteorological measurements worldwide
between 1990 and 2005. Scientific modeling predicts that continued emissions of GHGs at or
above current rates would induce more extreme climate changes during the twenty-first century
than were observed during the twentieth century. A warming of about 0.2°C (0.36°F) per decade
is projected, and there are identifiable signs that global warming could be taking place.

Greenhouse Gas Emissions Analysis for the North City Project
9420-04 28 September 2017
Although climate change is driven by global atmospheric conditions, climate change impacts are
felt locally. A scientific consensus confirms that climate change is already affecting California.
The average temperatures in California have increased, leading to more extreme hot days and
fewer cold nights; shifts in the water cycle have been observed, with less winter precipitation
falling as snow, and both snowmelt and rainwater running off earlier in the year; sea levels have
risen; and wildland fires are becoming more frequent and intense due to dry seasons that start
earlier and end later (CAT 2010a).
An increase in annual average temperature is a reasonably foreseeable effect of climate change.
Observed changes over the last several decades across the western United States reveal clear
signals of climate change. Statewide average temperatures increased by about 1.7°F from 1895 to
2011, and warming has been greatest in the Sierra Nevada. By 2050, California is projected to
warm by approximately 2.7°F above 2000 averages, a threefold increase in the rate of warming
over the last century. By 2100, average temperatures could increase by 4.1°F to 8.6°F, depending
on emissions levels. Springtime warming—a critical influence on snowmelt—will be particularly
pronounced. Summer temperatures will rise more than winter temperatures, and the increases will
be greater in inland California, compared to the coast. Heat waves will be more frequent, hotter,
and longer. There will be fewer extremely cold nights. A decline of Sierra snowpack, which
accounts for approximately half of the surface water storage in California and much of the state’s
water supply, by 30% to as much as 90% is predicted over the next 100 years (CAT 2010a).
Model projections for precipitation over California continue to show the Mediterranean pattern
of wet winters and dry summers with seasonal, year-to-year, and decade-to-decade variability.
For the first time, however, several of the improved climate models shift toward drier conditions
by the mid-to-late 21st century in central and, most notably, Southern California. By late-
century, all projections show drying, and half of them suggest 30-year average precipitation will
decline by more than 10% below the historical average (CAT 2010a).
A summary of current and future climate change impacts to resource areas in California, as
discussed in Safeguarding California: Reducing Climate Risk (NRA 2014), is provided in the
following text.
Agriculture. The impacts of climate change on the agricultural sector are far more severe than the
typical variability in weather and precipitation patterns that occur year to year. Some of the specific
challenges faced by the agricultural sector and farmers include more drastic and unpredictable
precipitation and weather patterns; extreme weather events that range from severe flooding to
extreme drought, to destructive storm events; significant shifts in water availably and water
quality; changes in pollinator lifecycles; temperature fluctuations, including extreme heat stress
and decreased chill hours; increased risks from invasive species and weeds, agricultural pests, and
plant diseases; and disruptions to the transportation and energy infrastructure supporting

Greenhouse Gas Emissions Analysis for the North City Project
9420-04 29 September 2017
agricultural production. These challenges and associated short-term and long-term impacts can
have both positive and negative effects on agricultural production. Nonetheless, it is predicted that
current crop and livestock production will suffer long-term negative effects resulting in a
substantial decrease in the agricultural sector if not managed or mitigated (NRA 2014).
Biodiversity and Habitat. The state’s extensive biodiversity stems from its varied climate and
assorted landscapes, which have resulted in numerous habitats where species have evolved and
adapted over time. Specific climate change challenges to biodiversity and habitat include species
migration in response to climatic changes, range shift, and novel combinations of species;
pathogens, parasites and disease; invasive species; extinction risks; changes in the timing of
seasonal life-cycle events; food web disruptions; and threshold effects (i.e., a change in the
ecosystem that results in a “tipping point” beyond which irreversible damage or loss has
occurred). Habitat restoration, conservation, and resource management across California and
through collaborative efforts among public, private, and nonprofit agencies has assisted in the
effort to fight climate change impacts on biodiversity and habitat. One of the key measures in
these efforts is ensuring species’ ability to relocate as temperature and water availability
fluctuate as a result of climate change, based on geographic region.
Energy. The energy sector provides California residents with a supply of reliable and affordable
energy through a complex integrated system. Specific climate change challenges for the energy
sector include temperature, fluctuating precipitation patterns, increasing extreme weather events
and sea level rise. Increasing temperatures and reduced snowpack negatively impact the
availability of a steady flow of snowmelt to hydroelectric reservoirs. Higher temperatures also
reduce the capacity of thermal power plants since power plant cooling is less efficient at higher
ambient temperatures. Natural gas infrastructure in coastal California is threatened by sea level
rise and extreme storm events (NRA 2014).
Forestry. Forests occupy approximately 33% of California’s 100 million acres and provide key
benefits such as wildlife habitat, absorption of CO2, renewable energy and building materials.
The most significant climate change related risk to forests is accelerated risk of wildfire and
more frequent and severe droughts. Droughts have resulted in more large scale mortalities and
combined with increasing temperatures have led to an overall increase in wildfire risks.
Increased wildfire intensity subsequently increases public safety risks, property damage, fire
suppression and emergency response costs, watershed and water quality impacts and vegetation
conversions. These factors contribute to decreased forest growth, geographic shifts in tree
distribution, loss of fish and wildlife habitat and decreased carbon absorption. Climate change
may result in increased establishment of non-native species, particularly in rangelands where
invasive species are already a problem. Invasive species may be able to exploit temperature or
precipitation changes, or quickly occupy areas denuded by fire, insect mortality or other climate
change effects on vegetation (NRA 2014).

Greenhouse Gas Emissions Analysis for the North City Project
9420-04 30 September 2017
Ocean and Coastal Ecosystems and Resources. Sea level rise, changing ocean conditions and
other climate change stressors are likely to exacerbate long-standing challenges related to ocean
and coastal ecosystems in addition to threatening people and infrastructure located along the
California coastline and in coastal communities. Sea level rise in addition to more frequent and
severe coastal storms and erosion are threatening vital infrastructure such as roads, bridges,
power plants, ports and airports, gasoline pipes, and emergency facilities, as well as negatively
impacting the coastal recreational assets such as beaches and tidal wetlands. Water quality and
ocean acidification threaten the abundance of seafood and other plant and wildlife habitats
throughout California and globally (NRA 2014).
Public Health. Climate change can impact public health through various environmental changes
and is the largest threat to human health in the twenty-first century. Changes in precipitation
patterns affect public health primarily through potential for altered water supplies, and extreme
events such as heat, floods, droughts, and wildfires. Increased frequency, intensity and duration
of extreme heat and heat waves is likely to increase the risk of mortality due to heat related
illness as well as exacerbate existing chronic health conditions. Other extreme weather events are
likely to negatively impact air quality and increase or intensify respiratory illness such as asthma
and allergies. Additional health impacts that may be impacted by climate change include
cardiovascular disease, vector-borne diseases, mental health impacts, and malnutrition injuries.
Increased frequency of these ailments is likely to subsequently increase the direct risk of injury
and/or mortality (NRA 2014).
Transportation. Residents of California rely on airports, seaports, public transportation and an
extensive roadway network to gain access to destinations, goods and services. While the
transportation industry is a source of GHG emissions it is also vulnerable to climate change risks.
Particularly, sea level rise and erosion threaten many coastal California roadways, airports,
seaports, transit systems, bridge supports, and energy and fueling infrastructure. Increasing
temperatures and extended periods of extreme heat threaten the integrity of the roadways and rail
lines. High temperatures cause the road surfaces to expand which leads to increased pressure and
pavement buckling. High temperatures can also cause rail breakages, which could lead to train
derailment. Other forms of extreme weather events, such as extreme storm events, can negatively
impact infrastructure which can impair movement of peoples and goods, or potentially block
evacuation routes and emergency access roads. Increased wildfires, flooding, erosion risks,
landslides, mudslides, and rockslides can all profoundly impact the transportation system and
pose a serious risk to public safety (NRA 2014).
Water. Water resources in California support residences, plants, wildlife, farmland, landscapes,
and ecosystems and bring trillions of dollars in economic activity. Climate change could
seriously impact the timing, form, amount of precipitation, runoff patterns, and frequency and
severity of precipitation events. Higher temperatures reduce the amount of snowpack and lead to

Greenhouse Gas Emissions Analysis for the North City Project
9420-04 31 September 2017
earlier snowmelt, which can impact water supply availability, natural ecosystems, and winter
recreation. Water supply availability during the intense dry summer months is heavily dependent
on the snowpack accumulated during the winter time. Increased risk of flooding has a variety of
public health concerns including water quality, public safety, property damage, displacement,
and post-disaster mental health problems. Prolonged and intensified droughts can also negatively
impact groundwater reserves and result in increased overdraft and subsidence. Droughts can also
negatively impact agriculture and farmland throughout the state. The higher risk of wildfires can
lead to increased erosion, which can negatively impact watersheds and result in poor water
quality. Water temperatures are also prone to increase, which can negatively impact wildlife that
rely on a specific range of temperatures for suitable habitat (NRA 2014).

Greenhouse Gas Emissions Analysis for the North City Project
9420-04 32 September 2017
INTENTIONALLY LEFT BLANK

Greenhouse Gas Emissions Analysis for the North City Project
9420-04 33 September 2017
3 REGULATORY SETTING
3.1 Federal Activities
Massachusetts v. EPA. On April 2, 2007, in Massachusetts v. EPA, the Supreme Court directed
the U.S. Environmental Protection Agency (EPA) Administrator to determine whether GHG
emissions from new motor vehicles cause or contribute to air pollution that may reasonably be
anticipated to endanger public health or welfare, or whether the science is too uncertain to make
a reasoned decision. In making these decisions, the EPA Administrator is required to follow the
language of Section 202(a) of the Clean Air Act (CAA). On December 7, 2009, the
Administrator signed a final rule with two distinct findings regarding GHGs under Section
202(a) of the CAA:
The Administrator found that elevated concentrations of GHGs—CO2, CH4, N2O, HFCs,
PFCs, and SF6—in the atmosphere threaten the public health and welfare of current and
future generations. This is referred to as the “endangerment finding.”
The Administrator further found the combined emissions of GHGs—CO2, CH4, N2O, and
HFCs—from new motor vehicles and new motor vehicle engines contribute to the GHG
air pollution that endangers public health and welfare. This is referred to as the “cause or
contribute finding.”
These two findings were necessary to establish the foundation for regulation of GHGs from new
motor vehicles as air pollutants under the CAA.
Energy Independence and Security Act. On December 19, 2007, President Bush signed the
Energy Independence and Security Act of 2007. Among other key measures, the Act would do
the following, which would aid in the reduction of national GHG emissions:
1. Increase the supply of alternative fuel sources by setting a mandatory Renewable Fuel
Standard requiring fuel producers to use at least 36 billion gallons of biofuel in 2022.
2. Set a target of 35 miles per gallon (mpg) for the combined fleet of cars and light trucks by
model year 2020 and direct the National Highway Traffic Safety Administration
(NHTSA) to establish a fuel economy standard for medium- and heavy-duty trucks and
create a separate fuel economy standard for work trucks.
3. Prescribe or revise standards affecting regional efficiency for heating and cooling
products and procedures for new or amended standards, energy conservation, energy
efficiency labeling for consumer electronic products, residential boiler efficiency, electric
motor efficiency, and home appliances.

Greenhouse Gas Emissions Analysis for the North City Project
9420-04 34 September 2017
EPA and NHTSA Joint Final Rule for Vehicle Standards. On April 1, 2010, the EPA and
NHTSA announced a joint final rule to establish a national project consisting of new standards for
light-duty vehicles model years 2012 through 2016. The joint rule is intended to reduce GHG
emissions and improve fuel economy. The EPA is finalizing the first-ever national GHG emissions
standards under the CAA, and NHTSA is finalizing Corporate Average Fuel Economy (CAFE)
standards under the Energy Policy and Conservation Act (EPA 2010). This final rule follows the
EPA and Department of Transportation’s joint proposal on September 15, 2009, and is the result of
President Obama’s May 2009 announcement of a national project to reduce GHG and improve fuel
economy (EPA 2011). The final rule became effective on July 6, 2010 (75 FR 25324–25728).
The EPA GHG standards require new passenger cars, light-duty trucks, and medium-duty
passenger vehicles to meet an estimated combined average emissions level of 250 grams of CO2
per mile in model year 2016, equivalent to 35.5 mpg if the automotive industry were to meet this
CO2 level through fuel economy improvements alone. The CAFE standards for passenger cars
and light trucks will be phased in between 2012 and 2016, with the final standards equivalent to
37.8 mpg for passenger cars and 28.8 mpg for light trucks, resulting in an estimated combined
average of 34.1 mpg. Together, these standards will cut GHG emissions by an estimated 960
MMT and 1.8 billion barrels of oil over the lifetime of the vehicles sold under the project. The
rules will simultaneously reduce GHG emissions, improve energy security, increase fuel savings,
and provide clarity and predictability for manufacturers (EPA 2011).
In August 2012, the EPA and NHTSA approved a second round of GHG and CAFE standards for
model years 2017 and beyond (77 FR 62623–63200). These standards will reduce motor vehicle
GHG emissions to 163 grams of CO2 per mile, which is equivalent to 54.5 mpg if this level were
achieved solely through improvements in fuel efficiency, for cars and light-duty trucks by model year
2025. A portion of these improvements, however, will likely be made through improvements in air
conditioning leakage and through use of alternative refrigerants, which would not contribute to fuel
economy. The first phase of the CAFE standards, for model year 2017 to 2021, are projected to
require, on an average industry fleet-wide basis, a range from 40.3 to 41.0 mpg in model year 2021.
The second phase of the CAFE project, for model years 2022 to 2025, are projected to require, on an
average industry fleet-wide basis, a range from 48.7 to 49.7 mpg in model year 2025. The second
phase of standards have not been finalized due to the statutory requirement that NHTSA set average
fuel economy standards not more than five model years at a time. The regulations also include
targeted incentives to encourage early adoption and introduction into the marketplace of advanced
technologies to dramatically improve vehicle performance, including:
Incentives for electric vehicles, plug-in hybrid electric vehicles, and fuel cells vehicles.
Incentives for hybrid technologies for large pickups and for other technologies that
achieve high fuel economy levels on large pickups.

Greenhouse Gas Emissions Analysis for the North City Project
9420-04 35 September 2017
Incentives for natural gas vehicles.
Credits for technologies with potential to achieve real-world GHG reductions and fuel
economy improvements that are not captured by the standards test procedures.
Climate Action Plan. In June 2013, President Obama issued a national Climate Action Plan
(Plan) that consisted of a wide variety of executive actions and had three pillars: (1) cut carbon in
America, (2) prepare the United States for impacts of climate change, and (3) lead international
efforts to combat global climate change and prepare for its impacts (EOP 2013).
The Plan outlines 75 goals within the three main pillars.
1. Cut Carbon in America. The Plan consists of actions to help cut carbon by deploying
clean energy, such as cutting carbon from power plants, promoting renewable energy,
and unlocking long-term investment in clean energy innovation. In addition, the Plan
includes actions designed to help build a twenty-first century transportation sector; cut
energy waste in homes, businesses, and factories; and reduce other GHG emissions, such
as HFCs and methane. The Plan commits to lead in clean energy and energy efficiency at
the federal level.
2. Prepare the United States for Impacts of Climate Change. The Plan consists of actions
to help prepare for the impacts of climate change through building stronger and safer
communities and infrastructure, supporting climate resilient investments, supporting
communities and tribal areas as they prepare for impacts, and boosting resilience of
building and infrastructure; protecting the economy and natural resources by identifying
vulnerabilities, promoting insurance leadership, conserving land and water resources,
managing drought, reducing wildfire risks, and preparing for future floods; and using
sound science to manage climate impacts.
3. Lead International Efforts. The Plan consists of actions to help the United States lead
international efforts through working with other countries to take action by enhancing
multilateral engagements with major economies, expanding bilateral cooperation with
major emerging economies, combating short-lived climate pollutants, reducing
deforestation and degradation, expanding clean energy use and cutting energy waste,
global free trade in environmental goods and services, and phasing out subsidies that
encourage wasteful use of fossil fuels and by leading efforts to address climate change
through international negotiations.
In June 2014, the Center for Climate and Energy Solutions (C2ES) published a 1-year review
of progress in implementation of the Plan (C2ES 2014). C2ES found that the administration
had made marked progress in its initial implementation. The administration made at least some
progress on most of the Plan’s 75 goals, and many of the specific tasks outlined had been

Greenhouse Gas Emissions Analysis for the North City Project
9420-04 36 September 2017
completed. Notable areas of progress included steps to limit carbon pollution from power
plants; improve energy efficiency; reduce CH4 and HFC emissions; help communities and
industry become more resilient to climate change impacts; and end U.S. lending for coal-fired
power plants overseas.
U.N. Framework Convention on Climate Change Pledge. On March 31, 2015, the State
Department submitted to the United Nations Framework Convention on Climate Change the
U.S. target to cut net GHG emissions. The submission, referred to as an Intended Nationally
Determined Contribution, is a formal statement of the U.S. target, announced in China, to
reduce emissions by 26%–28% below 2005 levels by 2025, and to make best efforts to reduce
by 28% (C2ES 2016).
The target reflects a planning process that examined opportunities under existing regulatory
authorities to reduce emissions in 2025 of all GHGs from all sources in every economic sector.
Several U.S. laws, as well as existing and proposed regulations thereunder, are relevant to the
implementation of the U.S. target, including the CAA (42 U.S.C. 7401 et seq.), the Energy
Policy Act (42 U.S.C. 13201 et seq.), and the Energy Independence and Security Act (42
U.S.C. 17001 et seq.).
Clean Power Plan and New Source Performance Standards for Electric Generating Units.
On October 23, 2015, EPA published a final rule (effective December 22, 2015) establishing the
Carbon Pollution Emission Guidelines for Existing Stationary Sources: Electric Utility
Generating Units (80 FR 64510–64660), also known as the Clean Power Plan. These guidelines
prescribe how states must develop plans to reduce GHG emissions from existing fossil-fuel-fired
electric generating units. The guidelines establish CO2 emission performance rates representing
the best system of emission reduction for two subcategories of existing fossil-fuel-fired electric
generating units: (1) fossil-fuel-fired electric utility steam-generating units and (2) stationary
combustion turbines. Concurrently, EPA published a final rule (effective October 23, 2015)
establishing Standards of Performance for Greenhouse Gas Emissions from New, Modified, and
Reconstructed Stationary Sources: Electric Utility Generating Units (80 FR 64661–65120). The
rule prescribes CO2 emission standards for newly constructed, modified, and reconstructed
affected fossil-fuel-fired electric utility generating units. Implementation of the Clean Power
Plan has been stayed by the U.S. Supreme Court pending resolution of several lawsuits.
Mandatory Greenhouse Gas Reporting Rule. On September 22, 2009, EPA published the
Final Mandatory Greenhouse Gas Reporting Rule (Reporting Rule) in the Federal Register (74
FR 56260–56373). The Reporting Rule requires reporting of GHG data and other relevant
information from fossil fuel and industrial GHG suppliers, vehicle and engine manufacturers,
and all facilities that would emit 25,000 MT CO2E or more per year. Facility owners are required
to submit an annual report with detailed calculations of facility GHG emissions on March 31 for

Greenhouse Gas Emissions Analysis for the North City Project
9420-04 37 September 2017
emissions from the previous calendar year. The Reporting Rule also mandates recordkeeping and
administrative requirements to enable EPA to verify the annual GHG emissions reports.
Council on Environmental Quality Guidance. On August 1, 2016, the Council on
Environmental Quality (CEQ) released final guidance for federal agencies on considering the
impacts of GHG emissions in NEPA reviews (CEQ 2016). This guidance supersedes the draft
GHG and climate change guidance released by CEQ in 2010 and 2014. The final guidance
applies to all proposed federal agency actions, including land and resource management
actions. This guidance explains that agencies should consider both the potential effects of a
proposed action on climate change, as indicated by its estimated GHG emissions, and the
implications of climate change for the environmental effects of a proposed action. The
guidance recommends that agencies quantify a proposed agency action’s projected direct and
indirect GHG emissions, taking into account available data and GHG quantification tools that
are suitable for the proposed agency action.
3.2 State of California
State Climate Change Targets
Executive Order (EO) S-3-05. EO S-3-05 (June 2005) established the following goals: GHG
emissions should be reduced to 2000 levels by 2010; GHG emissions should be reduced to 1990
levels by 2020; and GHG emissions should be reduced to 80% below 1990 levels by 2050.
Under EO S-3-05, the California Environmental Protection Agency is directed to report
biannually on progress made toward meeting the GHG targets and the impacts to California due
to global warming, including impacts to water supply, public health, agriculture, the coastline,
and forestry. The Climate Action Team was formed, which subsequently issued the 2006
Climate Action Team Report to Governor Schwarzenegger and the Legislature (CAT 2006).
The 2009 Climate Action Team Biennial Report (CAT 2010b) expands on the policy outlined in
the 2006 assessment. The 2009 report identifies the need for additional research in several
different aspects that affect climate change to support effective climate change strategies.
Subsequently, the 2010 Climate Action Team Report to Governor Schwarzenegger and the
California Legislature (CAT 2010a) reviews past climate action milestones including voluntary
reporting programs, GHG standards for passenger vehicles, the Low Carbon Fuel Standard, a
statewide renewable energy standard, and the cap-and-trade program.
AB 32. In furtherance of the goals established in EO S-3-05, the Legislature enacted AB 32 (Núñez
and Pavley), the California Global Warming Solutions Act of 2006 (September 27, 2006). AB 32
requires California to reduce its GHG emissions to 1990 levels by 2020, representing a reduction of
approximately 15% below emissions expected under a “business-as-usual” (BAU) scenario.

Greenhouse Gas Emissions Analysis for the North City Project
9420-04 38 September 2017
CARB has been assigned responsibility for carrying out and developing the programs and
requirements necessary to achieve the goals of AB 32. Under AB 32, CARB must adopt
regulations requiring the reporting and verification of statewide GHG emissions. This program
will be used to monitor and enforce compliance with the established standards. CARB is also
required to adopt rules and regulations to achieve the maximum technologically feasible and
cost-effective GHG emission reductions. AB 32 also authorized CARB to adopt market-based
compliance mechanisms to meet the specified requirements. Finally, CARB is ultimately
responsible for monitoring compliance and enforcing any rule, regulation, order, emission
limitation, emission reduction measure, or market-based compliance mechanism adopted. These
efforts target GHG emission reductions from cars and trucks, electricity production, fuels, and
other sources. The full implementation of AB 32 will help mitigate risks associated with climate
change while improving energy efficiency, expanding the use of renewable energy resources and
cleaner transportation, and reducing waste.
Of relevance to this analysis, in 2007, CARB approved a statewide limit on the GHG emissions
level for year 2020 consistent with the determined 1990 baseline (427 MMT CO2E). CARB’s
adoption of this limit is in accordance with Health and Safety Code Section 38550. In addition to
the 1990 emissions inventory, CARB also adopted regulations requiring mandatory reporting of
GHGs for the large facilities that account for 94% of GHG emissions from industrial and
commercial stationary sources in California.
Further, in 2008, CARB adopted the Climate Change Scoping Plan: A Framework for Change
(Scoping Plan) in accordance with Health and Safety Code, Section 38561. The Scoping Plan
establishes an overall framework for the measures that will be adopted to reduce California’s GHG
emissions for various emission sources/sectors to 1990 levels by 2020. The 2020 emissions limit
was set at 427 MMT of CO2E (CARB 2008). The Scoping Plan establishes an overall framework
for a suite of measures that will be adopted to sharply reduce California’s GHG emissions. The
Scoping Plan evaluates opportunities for sector-specific reductions, integrates all CARB and
Climate Action Team early actions and additional GHG reduction features by both entities,
identifies additional measures to be pursued as regulations, and outlines the role of a cap-and-trade
program. The key elements of the Scoping Plan include the following (CARB 2008):
1. Expanding and strengthening existing energy efficiency programs as well as building and
appliance standards.
2. Achieving a statewide renewable energy mix of 33%.
3. Developing a California cap-and-trade program that links with other Western Climate
Initiative partner programs to create a regional market system and caps sources
contributing 85% of California’s GHG emissions.

Greenhouse Gas Emissions Analysis for the North City Project
9420-04 39 September 2017
4. Establishing targets for transportation-related GHG emissions for regions throughout
California, and pursuing policies and incentives to achieve those targets.
5. Adopting and implementing measures pursuant to existing state laws and policies,
including California’s clean car standards, goods movement measures, and the Low
Carbon Fuel Standard.
6. Creating targeted fees, including a public goods charge on water use, fees on high GWP
gases, and a fee to fund the administrative costs of the State of California’s long-term
commitment to AB 32 implementation.
In the Scoping Plan, CARB determined that achieving the 1990 emissions level in 2020 would
require a reduction in GHG emissions of approximately 28.5% from the otherwise projected
2020 emissions level; i.e., those emissions that would occur in 2020, absent GHG-reducing laws
and regulations (referred to as “Business-As-Usual” (BAU)). For example, in further explaining
CARB’s BAU methodology, CARB assumed that all new electricity generation would be
supplied by natural gas plants; no further regulatory action would impact vehicle fuel efficiency;
and building energy efficiency codes would be held at 2005 standards.
In the 2011 Final Supplement to the Scoping Plan’s Functional Equivalent Document, CARB revised
its estimates of the projected 2020 emissions level in light of the economic recession and the
availability of updated information about GHG reduction regulations. Based on the new economic
data, CARB determined that achieving the 1990 emissions level by 2020 would require a reduction
in GHG emissions of 21.7% (down from 28.5%) from the BAU conditions (CARB 2011a). When
the 2020 emissions level projection also was updated to account for newly implemented regulatory
measures, including Pavley I (model years 2009–2016) and the Renewable Portfolio Standard (12%
to 20%), CARB determined that achieving the 1990 emissions level in 2020 would require a
reduction in GHG emissions of 16% (down from 28.5%) from the BAU conditions.
Most recently, in 2014, CARB adopted the First Update to the Climate Change Scoping Plan:
Building on the Framework (First Update; CARB 2014b). The stated purpose of the First Update
is to “highlight California’s success to date in reducing its GHG emissions and lay the
foundation for establishing a broad framework for continued emission reductions beyond 2020,
on the path to 80% below 1990 levels by 2050.” The First Update found that California is on
track to meet the 2020 emissions reduction mandate established by AB 32, and noted that
California could reduce emissions further by 2030 to levels squarely in line with those needed to
stay on track to reduce emissions to 80% below 1990 levels by 2050 if the state realizes the
expected benefits of existing policy goals.
In the First Update, CARB identified “six key focus areas comprising major components of the
state’s economy to evaluate and describe the larger transformative actions that will be needed to

Greenhouse Gas Emissions Analysis for the North City Project
9420-04 40 September 2017
meet the state’s more expansive emission reduction needs by 2050” (CARB 2014b). Those six
areas are: (1) energy, (2) transportation (vehicles/equipment, sustainable communities, housing,
fuels, and infrastructure), (3) agriculture, (4) water, (5) waste management, and (6) natural and
working lands. The First Update identifies key recommended actions for each sector that will
facilitate achievement of Executive Order S-3-05’s 2050 reduction goal.
Based on CARB’s research efforts presented in the First Update, CARB has a “strong sense of
the mix of technologies needed to reduce emissions through 2050.” Those technologies include
energy demand reduction through efficiency and activity changes; large-scale electrification of
on-road vehicles, buildings, and industrial machinery; decarbonizing electricity and fuel
supplies; and, the rapid market penetration of efficient and clean energy technologies.
As part of the First Update, CARB recalculated the state’s 1990 emissions level using more
recent GWPs identified by the IPCC. Using the recalculated 1990 emissions level (431 MMT
CO2E) and the revised 2020 emissions level projection identified in the 2011 Final
Supplement, CARB determined that achieving the 1990 emissions level by 2020 would require
a reduction in GHG emissions of approximately 15% (instead of 28.5% or 16%) from the BAU
conditions. The update also recommends that a statewide mid-term target and mid-term and
long-term sector targets be established toward meeting the 2050 goal established by EO S-3-05
(i.e., reduce California’s GHG emissions to 80% below 1990 levels), although no specific
recommendations are made.
On January 20, 2017, CARB released The 2017 Climate Change Scoping Plan Update (Second
Update) for public review and comment (CARB 2017). This update to the Scoping Plan proposes
CARB’s strategy for achieving the states 2030 GHG target, including continuing the Cap-and-
Trade Program through 2030, and includes a new approach to reduce GHGs from refineries by
20%. The Second Update incorporates approaches to cutting super pollutants from the Short
Lived Climate Pollutants Strategy, acknowledges the need for reducing emissions in agriculture,
and highlights the work underway to ensure that California’s natural and working lands
increasingly sequester carbon. During development of the Second Update, CARB held a number
of public workshops in the Natural and Working Lands, Agriculture, Energy and Transportation
sectors to inform development of the 2030 Scoping Plan Update. When discussing project-level
GHG emissions reduction actions and thresholds, the Second Update states “achieving no net
increase in GHG emissions is the correct overall objective, but it may not be appropriate or
feasible for every development project. And the inability to mitigate a project’s GHG emissions
to zero does not necessarily imply a substantial contribution to the cumulatively significant
environmental impact of climate change under CEQA.” The deadline to submit comments on the
Second Update was March 6, 2017. It is expected that the Second Update will be heard by
CARB at the April 27 and 28, 2017 CARB meeting.

Greenhouse Gas Emissions Analysis for the North City Project
9420-04 41 September 2017
EO B-30-15. EO B-30-15 (April 2015) identified an interim GHG reduction target in support of
targets previously identified under S-3-05 and AB 32. EO B-30-15 set an interim target goal of
reducing GHG emissions to 40% below 1990 levels by 2030 to keep California on its trajectory
toward meeting or exceeding the long-term goal of reducing GHG emissions to 80% below 1990
levels by 2050 as set forth in S-3-05. To facilitate achievement of this goal, EO B-30-15 calls for
an update to CARB’s Scoping Plan to express the 2030 target in terms of MMT CO2E. The EO
also calls for state agencies to continue to develop and implement GHG emission reduction
programs in support of the reduction targets. Sector-specific agencies in transportation, energy,
water, and forestry were required to prepare GHG reduction plans by September 2015, followed
by a report on action taken in relation to these plans in June 2016. EO B-30-15 does not require
local agencies to take any action to meet the new interim GHG reduction threshold. It is
important to note that EO B-30-15 was not adopted by a public agency through a public review
process that requires analysis pursuant to the California Environmental Quality Act (CEQA)
Guidelines, Section 15064.4, and that it has not been subsequently validated by a statute as an
official GHG reduction target of California. EO B-30-15 itself states it is “not intended to create,
and does not create, any rights of benefits, whether substantive or procedural, enforceable at law
or in equity, against the State of California, its agencies, departments, entities, officers,
employees, or any other person.”
Senate Bill (SB) 32 and AB 197. SB 32 and AB 197 (enacted in 2016) are companion bills that
set a new statewide GHG reduction targets; make changes to CARB’s membership, and increase
legislative oversight of CARB’s climate change-based activities; and expand dissemination of
GHG and other air quality-related emissions data to enhance transparency and accountability. SB
32 codified the 2030 emissions reduction goal of EO B-30-15 by requiring CARB to ensure that
statewide GHG emissions are reduced to 40% below 1990 levels by 2030. AB 197 established
the Joint Legislative Committee on Climate Change Policies, consisting of at least three
members of the Senate and three members of the Assembly, in order to provide ongoing
oversight over implementation of the state’s climate policies. AB 197 also added two members
of the Legislature to CARB as nonvoting members; requires CARB to make available and update
(at least annually via its website) emissions data for GHGs, criteria air pollutants, and TACs
from reporting facilities; and, requires CARB to identify specific information for GHG emissions
reduction measures when updating the scoping plan.
EO B-18-12. EO B-18-12 (April 2012) directs state agencies, departments, and other entities under
the governor’s executive authority to take action to reduce entity-wide GHG emissions by at least
10% by 2015 and 20% by 2020, as measured against a 2010 baseline. EO B-18-12 also established
goals for existing state buildings for reducing grid-based energy purchases and water use.
SB 605. SB 605 (September 2014) requires CARB to complete a comprehensive strategy to
reduce emissions of short-lived climate pollutants in the state no later than January 1, 2016. As

Greenhouse Gas Emissions Analysis for the North City Project
9420-04 42 September 2017
defined in the statute, short-lived climate pollutant means “an agent that has a relatively short
lifetime in the atmosphere, from a few days to a few decades, and a warming influence on the
climate that is more potent than that of carbon dioxide” (SB 605). SB 605, however, does not
prescribe specific compounds as short-lived climate pollutants or add to the list of GHGs
regulated under AB 32. In developing the strategy, CARB must complete an inventory of sources
and emissions of short-lived climate pollutants in the state based on available data, identify
research needs to address any data gaps, identify existing and potential new control measures to
reduce emissions, and prioritize the development of new measures for short-lived climate
pollutants that offer co-benefits by improving water quality or reducing other criteria air
pollutants that impact community health and benefit disadvantaged communities. The Proposed
Short-Lived Climate Pollution Reduction Strategy released by CARB in April 2016 focuses on
CH4, black carbon, and fluorinated gases, particularly HFCs, as important short-lived climate
pollutants. The strategy recognizes emission reduction efforts implemented under AB 32 (e.g.,
refrigerant management programs) and other regulatory programs (e.g., in-use diesel engines,
solid waste diversion) along with additional measures to be developed.
Building Energy
Title 24, Part 6. Title 24 of the California Code of Regulations was established in 1978 and
serves to enhance and regulate California’s building standards. While not initially promulgated
to reduce GHG emissions, Part 6 of Title 24 specifically establishes Building Energy Efficiency
Standards that are designed to ensure new and existing buildings in California achieve energy
efficiency and preserve outdoor and indoor environmental quality. The California Energy
Commission (CEC) is required by law to adopt standards every 3 years that are cost effective for
homeowners over the 30-year lifespan of a building. These standards are updated to consider and
incorporate new energy efficient technologies and construction methods. As a result, these
standards save energy, increase electricity supply reliability, increase indoor comfort, avoid the
need to construct new power plants, and help preserve the environment.
The current Title 24 standards are the 2013 standards, which became effective on July 1, 2014.
Buildings constructed in accordance with the 2013 standards will use 25% less energy for
lighting, heating, cooling, ventilation, and water heating than the 2008 standards (CEC 2014).
The 2016 Title 24 building energy efficiency standards, which became effective January 1, 2017,
will further reduce energy used and associated GHG emissions. In general, single-family homes
built to the 2016 standards are anticipated to use about 28% less energy for lighting, heating,
cooling, ventilation, and water heating than those built to the 2013 standards, and nonresidential
buildings built to the 2016 standards will use an estimated 5% less energy than those built to the
2013 standards (CEC 2015). Although the North City Project would be required to comply with
2016 Title 24 standards because its building construction phase would commence after January

Greenhouse Gas Emissions Analysis for the North City Project
9420-04 43 September 2017
1, 2017, this analysis conservatively does not quantify the increase energy efficiency associated
with the more stringent 2016 Title 24 standards.
Title 24, Part 11. In addition to the CEC’s efforts, in 2008, the California Building Standards
Commission adopted the nation’s first green building standards. The California Green Building
Standards Code (Part 11 of Title 24), commonly referred to as CALGreen, establishes minimum
mandatory standards as well as voluntary standards pertaining to the planning and design of
sustainable site development, energy efficiency (in excess of the California Energy Code
requirements), water conservation, material conservation, and interior air quality. The CALGreen
standards took effect in January 2011 and instituted mandatory minimum environmental
performance standards for all ground-up, new construction of commercial, low-rise residential and
state-owned buildings and schools and hospitals. The CALGreen 2016 standards became effective
January 1, 2017. The mandatory standards require the following (24 CCR Part 11):
Mandatory reduction in indoor water use through compliance with specified flow rates
for plumbing fixtures and fittings.
Mandatory reduction in outdoor water use through compliance with a local water
efficient landscaping ordinance or the California Department of Water Resources’ Model
Water Efficient Landscape Ordinance.
65% of construction and demolition waste must be diverted from landfills.
Mandatory inspections of energy systems to ensure optimal working efficiency.
Inclusion of electric vehicle charging stations or designated spaces capable of supporting
future charging stations.
Low-pollutant emitting exterior and interior finish materials, such as paints, carpets, vinyl
flooring, and particle boards.
The CALGreen standards also include voluntary efficiency measures that are provided at two
separate tiers and implemented at the discretion of local agencies and applicants. CALGreen’s
Tier 1 standards call for a 15% improvement in energy requirements, stricter water conservation,
65% diversion of construction and demolition waste, 10% recycled content in building materials,
20% permeable paving, 20% cement reduction, and cool/solar-reflective roofs. CALGreen’s more
rigorous Tier 2 standards call for a 30% improvement in energy requirements, stricter water
conservation, 75% diversion of construction and demolition waste, 15% recycled content in
building materials, 30% permeable paving, 25% cement reduction, and cool/solar-reflective roofs.
The California Public Utilities Commission (CPUC), CEC, and CARB also have a shared,
established goal of achieving zero net energy for new construction in California. The key policy

Greenhouse Gas Emissions Analysis for the North City Project
9420-04 44 September 2017
timelines include: (1) all new residential construction in California will be zero net energy by
2020, and (2) all new commercial construction in California will be zero net energy by 2030.2
Title 20. Title 20 of the California Code of Regulations requires manufacturers of appliances to
meet state and federal standards for energy and water efficiency. Performance of appliances must
be certified through the CEC to demonstrate compliance with standards. New appliances regulated
under Title 20 include refrigerators, refrigerator-freezers, and freezers; room air conditioners and
room air-conditioning heat pumps; central air conditioners; spot air conditioners; vented gas space
heaters; gas pool heaters; plumbing fittings and plumbing fixtures; fluorescent lamp ballasts;
lamps; emergency lighting; traffic signal modules; dishwaters; clothes washers and dryers; cooking
products; electric motors; low voltage dry-type distribution transformers; power supplies;
televisions and consumer audio and video equipment; and battery charger systems. Title 20
presents protocols for testing for each type of appliance covered under the regulations and
appliances must meet the standards for energy performance, energy design, water performance,
and water design. Title 20 contains the following three types of standards for appliances: federal
and state standards for federally regulated appliances, state standards for federally regulated
appliances, and state standards for non-federally regulated appliances.
Mobile Sources
AB 1493. In a response to the transportation sector accounting for more than half of California’s
CO2 emissions, AB 1493 (Pavley) was enacted in July 2002. AB 1493 required CARB to set
GHG emission standards for passenger vehicles, light-duty trucks, and other vehicles determined
by the state board to be vehicles that are primarily used for noncommercial personal
transportation in the state. The bill required that CARB set GHG emission standards for motor
vehicles manufactured in 2009 and all subsequent model years. CARB adopted the standards in
September 2004. When fully phased in, the near-term (2009–2012) standards will result in a
reduction of about 22% in GHG emissions compared to the emissions from the 2002 fleet, while
the mid-term (2013–2016) standards will result in a reduction of about 30%.
EO S-1-07. Issued on January 18, 2007, EO S-1-07 sets a declining Low Carbon Fuel Standard
for GHG emissions measured in CO2E grams per unit of fuel energy sold in California. The
target of the Low Carbon Fuel Standard is to reduce the carbon intensity of California passenger
vehicle fuels by at least 10% by 2020. The carbon intensity measures the amount of GHG
emissions in the lifecycle of a fuel, including extraction/feedstock production, processing,
transportation, and final consumption, per unit of energy delivered. CARB adopted the
implementing regulation in April 2009. The regulation is expected to increase the production of
2 See CPUC’s California’s Zero Net Energy Policies and Initiatives (CPUC 2013). It is expected that
achievement of the zero net energy goal will occur via revisions to the Title 24 standards.

Greenhouse Gas Emissions Analysis for the North City Project
9420-04 45 September 2017
biofuels, including those from alternative sources, such as algae, wood, and agricultural waste. In
addition, the Low Carbon Fuel Standard would drive the availability of plug-in hybrid, battery
electric, and fuel-cell power motor vehicles. The Low Carbon Fuel Standard is anticipated to
lead to the replacement of 20% of the fuel used in motor vehicles with alternative fuels by 2020.
SB 375. SB 375 (Steinberg) (September 2008) addresses GHG emissions associated with the
transportation sector through regional transportation and sustainability plans. SB 375 required
CARB to adopt regional GHG reduction targets for the automobile and light-truck sector for
2020 and 2035. Regional metropolitan planning organizations are then responsible for preparing
a Sustainable Communities Strategy (SCS) within their Regional Transportation Plan (RTP). The
goal of the SCS is to establish a forecasted development pattern for the region that, after
considering transportation measures and policies, will achieve, if feasible, the GHG reduction
targets. If an SCS is unable to achieve the GHG reduction target, a metropolitan planning
organization must prepare an Alternative Planning Strategy demonstrating how the GHG
reduction target would be achieved through alternative development patterns, infrastructure, or
additional transportation measures or policies.
Pursuant to Government Code Section 65080(b)(2)(K), a sustainable communities strategy does
not: (i) regulate the use of land; (ii) supersede the land use authority of cities and counties; or (iii)
require that a city’s or county’s land use policies and regulations, including those in a general
plan, be consistent with it. Nonetheless, SB 375 makes regional and local planning agencies
responsible for developing those strategies as part of the federally required metropolitan
transportation planning process and the state-mandated housing element process.
In 2010, CARB adopted the SB 375 targets for the regional metropolitan planning organizations.
The targets for the San Diego Association of Governments (SANDAG) are a 7% reduction in
emissions per capita by 2020 and a 13% reduction by 2035.
SANDAG completed and adopted its 2050 Regional Transportation Plan/Sustainable
Communities Strategy (RTP/SCS) in October 2011 (SANDAG 2011). In November 2011,
CARB, by resolution, accepted SANDAG’s GHG emissions quantification analysis and
determination that, if implemented, the SCS would achieve CARB’s 2020 and 2035 GHG
emissions reduction targets for the region.
After SANDAG’s 2050 RTP/SCS was adopted, a lawsuit was filed by the Cleveland National
Forest Foundation and others. In November 2014, Division One of the Fourth District Court of
Appeal issued its decision in Cleveland National Forest Foundation v. SANDAG, Case No.
D063288. In its decision, the Fourth District held that SANDAG abused its discretion when it
certified the environmental impact report (EIR) for the 2050 RTP/SCS because it did not
adequately analyze and mitigate GHG emission levels after year 2020. The 2050 RTP/SCS

Greenhouse Gas Emissions Analysis for the North City Project
9420-04 46 September 2017
EIR complied with CARB’s AB 32–related GHG reduction target through 2020, but the EIR
found that plan-related emissions would substantially increase after 2020 and through 2050.
The majority of the Fourth District in the Cleveland National decision found SANDAG’s EIR
deficient because, although the EIR used three significance thresholds authorized by CEQA
Guidelines, Section 15064.4(b), it did not assess the 2050 RTP/SCS’s consistency with the
2050 GHG emissions goal identified in EO S-03-05, which the majority construed as “state
climate policy.” The Fourth District did not require the set aside of SANDAG’s 2050
RTP/SCS itself. In March 2015, the California Supreme Court granted SANDAG’s petition for
review of the Fourth District’s decision (Case No. S223603), and the matter currently is
pending before the state’s highest court.
Although the EIR for SANDAG’s 2050 RTP/SCS is still pending before the California Supreme
Court, SANDAG recently adopted the next iteration of its RTP/SCS in accordance with
statutorily mandated timelines. More specifically, in October 2015, SANDAG adopted San
Diego Forward: The Regional Plan. Like the 2050 RTP/SCS, this planning document meets
CARB’s 2020 and 2035 reduction targets for the region (SANDAG 2015).
Advanced Clean Cars Program. In January 2012, CARB approved the Advanced Clean Cars
program, a new emissions-control program for model years 2015 through 2025. The program
combines the control of smog- and soot-causing pollutants and GHG emissions into a single
coordinated package. The package includes elements to reduce smog-forming pollution, reduce
GHG emissions, promote clean cars, and provide the fuels for clean cars (CARB 2012). To
improve air quality, CARB has implemented new emission standards to reduce smog-forming
emissions beginning with 2015 model year vehicles. It is estimated that in 2025, cars will emit
75% less smog-forming pollution than the average new car sold today. To reduce GHG
emissions, CARB, in conjunction with the EPA and the NHTSA, has adopted new GHG
standards for model year 2017 to 2025 vehicles; the new standards are estimated to reduce GHG
emissions by 34% in 2025. The zero-emission vehicle program will act as the focused
technology of the Advanced Clean Cars program by requiring manufacturers to produce
increasing numbers of zero-emission vehicles and plug-in hybrid electric vehicles in the 2018 to
2025 model years. The Clean Fuels Outlet regulation will ensure that fuels such as electricity and
hydrogen are available to meet the fueling needs of the new advanced technology vehicles as
they come to the market.
EO B-16-12. EO B-16-12 (March 2012) directs state entities under the Governor’s direction and
control to support and facilitate development and distribution of zero-emission vehicles. This EO
also sets a long-term target of reaching 1.5 million zero-emission vehicles on California’s
roadways by 2025. On a statewide basis, EO B-16-12 also establishes a GHG emissions
reduction target from the transportation sector equaling 80% less than 1990 levels by 2050.

Greenhouse Gas Emissions Analysis for the North City Project
9420-04 47 September 2017
Renewable Energy and Energy Procurement
SB 1078. SB 1078 (Sher) (September 2002) established the Renewable Portfolio Standard (RPS)
program, which requires an annual increase in renewable generation by the utilities equivalent to
at least 1% of sales, with an aggregate goal of 20% by 2017. This goal was subsequently
accelerated, requiring utilities to obtain 20% of their power from renewable sources by 2010 (see
SB 107, EOs S-14-08, and S-21-09.)
SB 1368. In September 2006, Governor Schwarzenegger signed SB 1368, which requires the
CEC to develop and adopt regulations for GHG emission performance standards for the long-
term procurement of electricity by local publicly owned utilities. These standards must be
consistent with the standards adopted by the CPUC. This effort will help protect energy
customers from financial risks associated with investments in carbon-intensive generation by
allowing new capital investments in power plants whose GHG emissions are as low as or lower
than new combined-cycle natural gas plants by requiring imported electricity to meet GHG
performance standards in California and by requiring that the standards be developed and
adopted in a public process.
EO S-14-08. EO S-14-08 (November 2008) focuses on the contribution of renewable energy
sources to meet the electrical needs of California while reducing the GHG emissions from the
electrical sector. This EO requires that all retail suppliers of electricity in California serve 33% of
their load with renewable energy by 2020. Furthermore, the EO directs state agencies to take
appropriate actions to facilitate reaching this target. The California Natural Resources Agency,
through collaboration with the CEC and California Department of Fish and Wildlife (formerly
the California Department of Fish and Game), is directed to lead this effort. Pursuant to a
Memorandum of Understanding between the CEC and California Department of Fish and
Wildlife regarding creating the Renewable Energy Action Team, these agencies will create a
“one-stop” process for permitting renewable energy power plants.
EO S-21-09. EO S-21-09 (September 2009) directed CARB to adopt a regulation consistent with
the goal of EO S-14-08 by July 31, 2010. CARB is further directed to work with the CPUC and
CEC to ensure that the regulation builds upon the RPS program and is applicable to investor-
owned utilities, publicly owned utilities, direct access providers, and community choice
providers. Under this order, CARB is to give the highest priority to those renewable resources
that provide the greatest environmental benefits with the least environmental costs and impacts
on public health and can be developed the most quickly in support of reliable, efficient, cost-
effective electricity system operations. On September 23, 2010, CARB adopted regulations to
implement a Renewable Electricity Standard, which would achieve the goal of the EO with the
following intermediate and final goals: 20% for 2012–2014, 24% for 2015–2017, 28% for 2018–
2019, and 33% for 2020 and beyond. Under the regulation, wind; solar; geothermal; small

Greenhouse Gas Emissions Analysis for the North City Project
9420-04 48 September 2017
hydroelectric; biomass; ocean wave, thermal, and tidal; landfill and digester gas; and biodiesel
would be considered sources of renewable energy. The regulation would apply to investor-
owned utilities and public (municipal) utilities. The Renewable Electricity Standard did not go
into effect as SB X1 2 superseded it as discussed below.
SB X1 2. SB X1 2 (April 2011) expanded the RPS by establishing a goal of 20% of the total
electricity sold to retail customers in California per year by December 31, 2013, and 33% by
December 31, 2020, and in subsequent years. Under the bill, a renewable electrical generation
facility is one that uses biomass, solar thermal, photovoltaic, wind, geothermal, fuel cells using
renewable fuels, small hydroelectric generation of 30 megawatts or less, digester gas, municipal
solid waste conversion, landfill gas, ocean wave, ocean thermal, or tidal current, and that meets
other specified requirements with respect to its location. In addition to the retail sellers covered
by SB 107, SB X1 2 adds local, publicly owned electric utilities to the RPS. By January 1, 2012,
the CPUC is required to establish the quantity of electricity products from eligible renewable
energy resources to be procured by retail sellers to achieve targets of 20% by December 31,
2013; 25% by December 31, 2016; and 33% by December 31, 2020. The statute also requires
that the governing boards for local, publicly owned electric utilities establish the same targets,
and the governing boards would be responsible for ensuring compliance with these targets. The
CPUC will be responsible for enforcement of the RPS for retail sellers, while the CEC and
CARB will enforce the requirements for local publicly owned electric utilities.
SB 350. SB 350 (October 2015) expands the RPS by establishing a goal of 50% of the total
electricity sold to retail customers in California per year by December 31, 2030. In addition, SB
350 includes the goal to double the energy efficiency savings in electricity and natural gas final
end uses (such as heating, cooling, lighting, or class of energy uses on which an energy-
efficiency program is focused) of retail customers through energy conservation and efficiency.
The bill also requires the CPUC, in consultation with the CEC, to establish efficiency targets for
electrical and gas corporations consistent with this goal. SB 350 also provides for the
transformation of the California Independent System Operator into a regional organization to
promote the development of regional electricity transmission markets in the western states and to
improve the access of consumers served by the California Independent System Operator to those
markets, pursuant to a specified process.
Water
EO B-29-15. In response to the ongoing drought in California, EO B-29-15 (April 2015) set a
goal of achieving a statewide reduction in potable urban water usage of 25% relative to water use
in 2013. The term of the EO extended through February 28, 2016, although many of the
directives have become permanent water-efficiency standards and requirements. The EO
includes specific directives that set strict limits on water usage in the state. In response to EO B-

Greenhouse Gas Emissions Analysis for the North City Project
9420-04 49 September 2017
29-15, the California Department of Water Resources has modified and adopted a revised
version of the Model Water Efficient Landscape Ordinance that, among other changes,
significantly increases the requirements for landscape water use efficiency and broadens its
applicability to include new development projects with smaller landscape areas.
Solid Waste
AB 939 and AB 341. In 1989, AB 939, known as the Integrated Waste Management Act
(California Public Resources Code Section 40000 et seq.), was passed because of the increase in
waste stream and the decrease in landfill capacity. The statute established the California
Integrated Waste Management Board, which oversees a disposal reporting system. AB 939
mandated a reduction of waste being disposed where jurisdictions were required to meet
diversion goals of all solid waste through source reduction, recycling, and composting activities
of 25% by 1995 and 50% by the year 2000.
AB 341 (Chapter 476, Statutes of 2011 (Chesbro)) amended the California Integrated Waste
Management Act of 1989 to include a provision declaring that it is the policy goal of the state
that not less than 75% of solid waste generated be source-reduced, recycled, or composted by the
year 2020, and annually thereafter. In addition, AB 341 required the California Department of
Resources Recycling and Recovery (CalRecycle) to develop strategies to achieve the state’s
policy goal. CalRecycle conducted several general stakeholder workshops and several focused
workshops and in August 2015 published a discussion document titled AB 341 Report to the
Legislature, which identifies five priority strategies that CalRecycle believes would assist the
state in reaching the 75% goal by 2020, legislative and regulatory recommendations, and an
evaluation of program effectiveness.
Increasing the amount of commercial solid waste that is recycled, reused, or composted will
reduce GHG emissions primarily by (1) reducing the energy requirements associated with the
extraction, harvest, and processing of raw materials; and (2) using recyclable materials that
require less energy than raw materials to manufacture finished products (CalRecycle 2015).
Increased diversion of organic materials (green and food waste) will also reduce GHG emissions
(CO2 and CH4) resulting from decomposition in landfills by redirecting this material to processes
that use the solid waste material to produce vehicle fuels, heat, electricity, or compost.
Other State Regulations and Goals
EO S-13-08. EO Order S-13-08 (November 2008) is intended to hasten California’s response to
the impacts of global climate change, particularly sea-level rise. It directs state agencies to take
specified actions to assess and plan for such impacts. It directed the California Natural Resources
Agency, in cooperation with the California Department of Water Resources, CEC, California’s
Greenhouse Gas Emissions Analysis for the North City Project
9420-04 50 September 2017
coastal management agencies, and the Ocean Protection Council, to request that the National
Academy of Sciences prepare a Sea Level Rise Assessment Report by December 1, 2010. The
Ocean Protection Council, California Department of Water Resources, and CEC, in cooperation
with other state agencies, were required to conduct a public workshop to gather information
relevant to the Sea Level Rise Assessment Report. The Business, Transportation, and Housing
Agency was ordered to assess within 90 days of issuance of the EO the vulnerability of the
state’s transportation systems to sea-level rise. The Governor’s Office of Planning and Research
and the California Natural Resources Agency are required to provide land use planning guidance
related to sea-level rise and other climate change impacts. The EO also required the other state
agencies to develop adaptation strategies by June 9, 2009, to respond to the impacts of global
climate change that are predicted to occur over the next 50 to 100 years. A discussion draft
adaptation strategies report was released in August 2009, and the final 2009 California Climate
Adaptation Strategy report was issued in December 2009 (NRA 2009). An update to the 2009
report, Safeguarding California: Reducing Climate Risk, was issued in July 2014 (NRA 2014).
To assess the state’s vulnerability, the report summarizes key climate change impacts to the state
for the following areas: agriculture, biodiversity and habitat, emergency management, energy,
forestry, ocean and coastal ecosystems and resources, public health, transportation, and water.
2015 State of the State Address. In January 2015, Governor Brown in his inaugural address and
annual report to the Legislature established supplementary goals which would further reduce
GHG emissions over the next 15 years. These goals include an increase in California’s
renewable energy portfolio from 33% to 50%, a reduction in vehicle petroleum use for cars and
trucks by up to 50%, measures to double the efficiency of existing buildings, and decreasing
emissions associated with heating fuels.
2016 State of the State Address. In his January 2016 address, Governor Brown established a
statewide goal to bring per-capita GHG emissions down to 2 tons per person, which reflects the goal
of the Global Climate Leadership Memorandum of Understanding (Under 2 MOU; OPR 2016) to
limit global warming to less than 2°C by 2050. The Under 2 MOU agreement pursues emission
reductions of 80% to 95% below 1990 levels by 2050 and/or reach a per-capita annual emissions
goal of less than 2 MT by 2050. A total of 135 jurisdictions representing 32 countries and 6
continents, including California, have signed or endorsed the Under 2 MOU (OPR 2016).
Local Plans
City of San Diego General Plan
The State of California requires cities and counties to prepare and adopt a general plan to set
out a long-range vision and comprehensive policy framework for its future. The state also
mandates that the plan be updated periodically to ensure relevance and utility. The City of San

Greenhouse Gas Emissions Analysis for the North City Project
9420-04 51 September 2017
Diego General Plan 2008 (General Plan) was unanimously adopted by the City Council on
March 10, 2008, with additional amendments approved in December 2010, January 2012, and
June 2015. The General Plan builds upon many of the goals and strategies of the former 1979
General Plan, in addition to offering new policy direction in the areas of urban form,
neighborhood character, historic preservation, public facilities, recreation, conservation,
mobility, housing affordability, economic prosperity, and equitable development. It recognizes
and explains the critical role of the community planning project as the vehicle to tailor the City
of Villages strategy for each neighborhood. It also outlines the plan amendment process, and
other implementation strategies, and considers the continued growth of the City beyond the
year 2020 (City of San Diego 2015a).
Conservation Element. The Conservation Element contains policies to guide the conservation
of resources that are fundamental components of San Diego’s environment, that help define the
City’s identity, and that are relied upon for continued economic prosperity. The purpose of this
element is to help the City become an international model of sustainable development and
conservation and to provide for the long-term conservation and sustainable management of the
rich natural resources that help define the City’s identity, contribute to its economy, and improve
its quality of life.
The City has also adopted the following General Plan Conservation Element policies (City of
San Diego 2008) related to climate change:
CE-A.2. Reduce the City’s carbon footprint. Develop and adopt new or amended
regulations, projects, and incentives as appropriate to implement the goals and policies
set forth in the General Plan to:
o Create sustainable and efficient land use patterns to reduce vehicular trips and
preserve open space;
o Reduce fuel emission levels by encouraging alternative modes of transportation and
increasing fuel efficiency;
o Improve energy efficiency, especially in the transportation sector and buildings
and appliances;
o Reduce the Urban Heat Island effect through sustainable design and building practices, as
well as planting trees (consistent with habitat and water conservation policies) for their
many environmental benefits, including natural carbon sequestration;
o Reduce waste by improving management and recycling projects;
o Plan for water supply and emergency reserves.

Greenhouse Gas Emissions Analysis for the North City Project
9420-04 52 September 2017
CE-A.8. Reduce construction and demolition waste in accordance with Public Facilities
Element, Policy PF-1.2, or by renovating or adding on to existing buildings, rather than
constructing new buildings.
CE-A.9. Reuse building materials, use materials that have recycled content, or use
materials that are derived from sustainable or rapidly renewable sources to the extent
possible, through factors including:
o Scheduling time for deconstruction and recycling activities to take place during
project demolition and construction phases;
o Using life cycle costing in decision-making for materials and construction techniques.
Life cycle costing analyzes the costs and benefits over the life of a particular product,
technology, or system.
CE-F.3. Continue to use methane as an energy source from inactive and closed landfills.
CE-I.4. Maintain and promote water conservation and waste diversion projects to
conserve energy.
CE-I.5. Support the installation of photovoltaic panels, and other forms of renewable
energy production.
o Seek funding to incorporate renewable energy alternatives in public buildings.
o Promote the use and installation of renewable energy alternatives in new and
existing development.
CE-I.10. Use renewable energy sources to generate energy to the extent feasible.
City of San Diego Climate Action Plan
On January 29, 2002, the San Diego City Council unanimously approved the San Diego
Sustainable Community Program. Actions identified include:
1. Participation in the Cities for Climate Protection program coordinated through the
International Council of Local Environmental Initiatives;
2. Establishment of a 15% GHG reduction goal set for 2010, using 1990 as a baseline; and
3. Direction to use the recommendations of a scientific Ad Hoc Advisory Committee as a
means to improve the GHG Emission Reduction Action Plan within the City organization
and to identify additional community actions.
In 2005, the City released a Climate Protection Action Plan. This report includes many of the
recommendations provided by the Ad Hoc Advisory Committee and City staff. By
implementing these recommendations, the City could directly address the challenges relating to

Greenhouse Gas Emissions Analysis for the North City Project
9420-04 53 September 2017
mitigation for state and federal ozone standards nonattainment (with associated health benefits)
and enhanced economic prosperity, specifically related to the tourism and agricultural sectors.
The Climate Protection Action Plan evaluated citywide GHG emissions, particularly three
contentions: (1) the GHG projection in 2010 resulting from no action taken to curb emissions;
(2) the GHG emission reductions due to City of San Diego actions implemented between 1990
and 2003; and, (3) the GHG reductions needed by 2010 to achieve 15% reduction. The Climate
Protection Action Plan does not recommend or require specific strategies or measures for
projects within the City to reduce emissions.
In December 2015, the City adopted its final Climate Action Plan (CAP) (City of San Diego
2015b). A Program EIR was prepared for the City’s Draft CAP, which was certified in
December 2015. With implementation of the CAP, the City aims to reduce emissions 15% below
the baseline to approximately 11.1 MMT CO2E by 2020, 40% below the baseline to
approximately 7.8 MMT CO2E by 2030, and 50% below the baseline to approximately 6.5 MMT
CO2E by 2035. It is anticipated that the City would exceed its reduction target by 1.3 MMT
CO2E in 2020, 176,528 MT CO2E in 2030, and 127,135 MT CO2E in 2035 with implementation
of the CAP. The CAP relies on significant City and regional actions, continued implementation
of federal and state mandates, and five local strategies with associated action steps for target
attainment. The City has identified the following five strategies to reduce GHG emissions to
achieve the 2020 and 2035 targets:
1. Energy and water efficient buildings;
2. Clean and renewable energy;
3. Bicycling, walking, transit, and land use;
4. Zero waste (gas and waste management); and
5. Climate resiliency.
Implementation of the CAP is divided into three actions:
Early Actions (Adoption of the CAP–December 31, 2017)
Mid-Term Actions (January 1, 2018–December 31, 2020)
Longer-Term Actions (2021–2035)
The CAP contains five chapters: Background, Reducing Emissions, Implementation and
Monitoring, Social Equity and Job Creation, and Adaptation. The 2015 CAP demonstrates to San
Diego businesses and residents that the City acknowledges the existing and potential impacts of a
changing climate and is committed to keeping it in the forefront of decision-making. Successful

Greenhouse Gas Emissions Analysis for the North City Project
9420-04 54 September 2017
implementation of the CAP will: (1) prepare for anticipated climate change impacts in the
coming decades, (2) help the State of California achieve its reduction target by contributing the
City’s fair share of GHG reductions, and (3) have a positive impact on the regional economy.
Through 2020, the CAP meets the requirements set forth in CEQA Guidelines Section 15183.5,
whereby a lead agency (e.g., the City of San Diego) may analyze and mitigate the significant
effects of GHG emissions at a programmatic level, such as in a general plan, a long-range
development plan, or a separate plan to reduce GHG emissions.
On July 12, 2016, The City amended the CAP to include a Consistency Review Checklist,
which is intends to provide a streamlined review process for the GHG emissions analysis of
proposed new development projects that are subject to discretionary review and trigger
environmental review pursuant to CEQA. The checklist is part of the CAP and contains
measures that are required to be implemented on a project-by-project basis to ensure that the
specified emissions targets identified in the CAP are achieved. Implementation of these
measures would ensure that new development is consistent with the CAP’s assumptions for
relevant CAP strategies toward achieving the identified GHG reduction targets. Projects that
are consistent with the CAP as determined through the use of this checklist may rely on the
CAP for the cumulative impacts analysis of GHG emissions. Projects that are not consistent
with the CAP must prepare a comprehensive project-specific analysis of GHG emissions,
including quantification of existing and projected GHG emissions and incorporation of the
measures in this checklist to the extent feasible. Cumulative GHG impacts would be significant
for any project that is not consistent with the CAP.

Greenhouse Gas Emissions Analysis for the North City Project
9420-04 55 September 2017
4 THRESHOLDS OF SIGNIFICANCE
The California Natural Resources Agency, through its December 2009 amendments to the
CEQA Guidelines (14 CCR 15000 et seq.), and the City of San Diego, through its interim
guidance for assessment of GHG emissions, provide a framework for the evaluation of the GHG
emissions associated with construction and operation of the Project components. The state’s and
City’s guidance are discussed in the following sections.
4.1 State of California
The State of California has developed guidelines to address the significance of climate change
impacts based on Appendix G of the CEQA Guidelines, which provides guidance that a project
would have a significant environmental impact if it would:
1. Generate greenhouse gas emissions, either directly or indirectly, that may have a
significant impact on the environment
2. Conflict with an applicable plan, policy, or regulation adopted for the purpose of
reducing the emissions of greenhouse gases.
Neither the State of California nor the San Diego Air Pollution Control District (SDAPCD) has
adopted emission-based thresholds for GHG emissions under CEQA. The Office of Planning
and Research’s (OPR’s) Technical Advisory titled CEQA and Climate Change: Addressing
Climate Change through California Environmental Quality Act (CEQA) Review states that
“public agencies are encouraged but not required to adopt thresholds of significance for
environmental impacts. Even in the absence of clearly defined thresholds for GHG emissions,
the law requires that such emissions from CEQA projects must be disclosed and mitigated to
the extent feasible whenever the lead agency determines that the project contributes to a
significant, cumulative climate change impact” (OPR 2008). Furthermore, the advisory
document indicates in the third bullet item on page 6 that “in the absence of regulatory
standards for GHG emissions or other scientific data to clearly define what constitutes a
‘significant impact,’ individual lead agencies may undertake a project-by-project analysis,
consistent with available guidance and current CEQA practice.”
4.2 City of San Diego
The City of San Diego’s latest update to the CEQA Significance Determination Thresholds
document in July 2016 added a GHG emissions threshold section. Pursuant to CEQA Guidelines
Sections 15183.5(b), 15064(h)(3), and 15130(d), the City may determine that a project’s
incremental contribution to a cumulative GHG effect is not cumulatively considerable if the
project complies with the requirements of a previously adopted GHG emission reduction plan.

Greenhouse Gas Emissions Analysis for the North City Project
9420-04 56 September 2017
CEQA Guidelines Section 15183.5(b)(1)(A-F) specifically provides that a GHG emissions
reduction plan should:
A. Quantify greenhouse gas emissions, both existing and projected over a specified time
period, resulting from activities within a defined geographic area;
B. Establish a level, based on substantial evidence, below which the contribution to greenhouse
gas emissions from activities covered by the plan would not be cumulatively considerable;
C. Identify and analyze the greenhouse gas emissions resulting from specific actions or
categories of actions anticipated within the geographic area;
D. Specify measures or a group of measures, including performance standards, that
substantial evidence demonstrates, if implemented on a project-by-project basis, would
collectively achieve the specified emissions level;
E. Establish a mechanism to monitor the plan’s progress toward achieving the level and to
require amendment if the plan is not achieving specified levels; and
F. Be adopted in a public process following environmental review.
An environmental document that relies on a GHG emissions reduction plan for a cumulative impacts
analysis must identify those requirements specified in the plan that apply to the project, and if those
requirements are not otherwise binding and enforceable, incorporate those requirements as mitigation
measures applicable to the project (CEQA Guidelines Section 15183.5(b)(2)).
The City’s CAP was adopted by the City Council on December 15, 2015. The CAP quantifies
existing GHG emissions as well as projected emissions for the years 2020, 2030, and 2035
resulting from activities within the City’s jurisdiction. The CAP also identifies City target
emissions levels, below which the citywide GHG impacts would be less than significant. The CAP
and the accompanying certified Final EIR also identify and analyze the GHG emissions that would
result from the bBAU scenario for the years 2020, 2030, and 2035. The CAP includes a monitoring
and reporting program to ensure its progress toward achieving the specified GHG emissions
reductions, and specifies 17 actions that if implemented, would achieve the specified GHG
emissions reductions targets. The CAP was adopted in a public process following certification of
the Final EIR. Subsequent to the adoption of the CAP, the City has also established additional
specific measures that if implemented on a project-by-project basis, would further ensure that the
City as a whole achieves the specified GHG emissions reduction targets in the CAP.
The CAP has been developed in response to state legislation and policies that are aimed at
reducing California’s GHG emissions. Consistent with AB 32 and the CARB Scoping Plan, the
CAP sets a GHG target for 2020 equivalent to 15% below the City’s 2010 baseline emissions
to ensure that it meets its proportional share of the 2020 AB 32 reductions. For 2035, the CAP

Greenhouse Gas Emissions Analysis for the North City Project
9420-04 57 September 2017
sets a GHG target equivalent to a 50% reduction from baseline emissions to ensure it is on the
trajectory toward achieving its proportional share of the 2050 state target identified in EO S-3-
05. The 2035 target also ensures that the City would be consistent with the 2030 state target
identified in EO B-30-15. Since CARB has not provided guidance on a specific reduction
target for local governments to use for 2030 and 2050, it was determined that a 50% reduction
from baseline emissions by 2035 would ensure that the City achieved a proportional share of
the statewide GHG reductions. In terms of consistency with EOs S-3-05 and B-30-15, the
CAP’s 2035 target provides a conservative target toward achieving the statewide reductions. If
CARB provides new guidance on how cities should address the 2030 targets, the City will
adjust the CAP accordingly.
Under the City’s CEQA Thresholds, the method for determining significance for project-level
environmental documents is through the CAP Consistency Checklist (City of San Diego 2015b).
The CAP Consistency Checklist, adopted July 12, 2016, is the primary document used by the City
of San Diego to ensure project-by-project consistency with the underlying assumptions in the CAP
and that the City would achieve its emissions reduction targets identified in the CAP. The CAP
Checklist includes a three-step process to determine project consistency (City of San Diego
2015b). Step 1 consists of an evaluation to determine the project’s consistency with existing
General Plan, Community Plan, and zoning designations for the site. If the project is able to answer
“yes” to Step 1 and demonstrate the project would be consistent with existing General Plan,
Community Plan, and zoning designations for the site, or the project can demonstrate consistency
with existing land uses by comparing the North City Project’s GHG emissions with those that
would be generated under existing land uses, then the project may proceed to Step 2. If the project
must answer “no” to Step 1, then the project would be deemed inconsistent with the CAP, and
GHG impacts as identified under CEQA would be considered significant and unavoidable.
Step 2 includes the list of measures each project would be required to implement. Regardless of
whether the project would answer “yes” or “no” to Step 1, implementation of the measures listed
in Step 2 would be required for all projects, if applicable.
Step 3 would only be applicable for projects that would not be consistent with existing land use
designations and would not be consistent with planned site land use GHG emissions, but that
would be located in a Transit Priority Area (TPA) as defined by the City’s Development Services
Department. In accordance with SB 743, a TPA is defined as “an area within one-half mile of a
major transit stop that is existing or planned, if the planned stop is scheduled to be completed
within the planning horizon included in a Transportation Improvement Program adopted
pursuant to Section 450.216 or 450.322 of Title 23 of the Code of Federal Regulations (City of
San Diego 2016b). Appendix B, “Transit Priority Areas per SB 743,” of the CAP includes a map
of TPAs as designated by the City. The TPAs map is based on the adopted SANDAG San Diego
Forward Regional Plan.

Greenhouse Gas Emissions Analysis for the North City Project
9420-04 58 September 2017
4.3 NEPA Considerations
The Bureau of Reclamation considers the consistency of a proposed project with federal
guidance concerning the evaluation and reduction of GHG emissions. There are no federal
significance criteria established for GHG emissions; however, CEQ recommends evaluating an
action in several contexts and the severity of the impact (CEQ 2016). Additionally, based on
CEQ recommendation, a project would result in a significant impact if it would exacerbate the
adverse effects of climate change or result in a substantial increase in exposure to these effects.
Accordingly, the Mandatory Greenhouse Gas Reporting Rule threshold of 25,000 MT CO2E per
year is used as a level at which potentially adverse effects would occur.

Greenhouse Gas Emissions Analysis for the North City Project
9420-04 59 September 2017
5 IMPACTS
5.1 Generate Greenhouse Gas Emissions, Either Directly or Indirectly, That May Have a Significant Impact on the Environment
5.1.1 Construction Impacts
5.1.1.1 General Approach and Methodology
GHG emissions would be associated with the construction phase of the North City Project
components through use of construction equipment and vehicle trips. Emissions of CO2 were
estimated using CalEEMod, Version 2016.3.1, available online (www.caleemod.com). For the
purposes of modeling, it was assumed that construction of Project components would commence
in November 2018 and final facilities may come online as late as 2021. It is anticipated that the
30 MGD “buildout” of the Project would be completed during this time.
Table 5.1-1 provides the construction timeline and potential phasing of the components that
would come online to achieve the target milestones. The construction schedule has been
developed based on available information provided by the City, typical construction practices,
and best engineering judgment. Construction phasing is intended to represent a schedule of
anticipated activities for use in estimating potential Project-generated construction emissions.
Table 5.1-1
North City Construction Phasing Assumptions
Project Component Construction Start Date Construction End Date Project Components Common to Alternatives
NCWRP Expansion 10/1/2018 12/6/2021
NCPWF Influent Pump Station 1/7/2019 10/21/2021
Morena Pump Station and Pipelines 4/2/2019 10/7/2021
MBC Improvements 4/24/2019 10/20/2021
North City Pump Station 5/21/2019 11/22/2021
NCPWF 10/1/2018 11/4/2021
North City Renewable Energy Facility 3/2/2020 12/5/2021
Landfill Gas Pipeline 3/2/2020 10/5/2021
Miramar Reservoir Alternative
North City Pipeline 11/14/2018 10/22/2021
Dechlorination Facility 1/7/2019 10/22/2021
Miramar WTP Improvements 7/24/2020 9/21/2021
San Vicente Reservoir Alternative
San Vicente Pipeline 12/3/2018 5/18/2021
Mission Trails Booster Station 5/9/2019 9/13/2021

Greenhouse Gas Emissions Analysis for the North City Project
9420-04 60 September 2017
Equipment mix for construction of the North City Project was provided by the Project applicant. The
equipment mix assumptions were based on Project design documents, review of related projects
conducted in the Southern California area, and CalEEMod default equipment, where appropriate.
The equipment mix is meant to represent a reasonably conservative estimate of construction activity.
For the analysis, it is generally assumed that heavy construction equipment would be operating at the
site for approximately 8 hours per day, 5 days per week. Default assumptions provided in CalEEMod
were utilized to determine worker trips for each potential construction phase during pipeline, pump
station, and facility construction. Generally, one worker per piece of construction equipment, a
foreman, and several additional workers would be anticipated on a daily basis. Additionally, it was
assumed that approximately two vendor trucks per day would be required for general material
deliveries, and approximately five haul trucks per day would be required for backfill/slurry deliveries
and soil export. The default CalEEMod trip distance for construction vehicles was assumed, which
was a one-way distance of 10.8 miles for worker trips, 7.3 miles for vendor trips, and 20 miles for
haul trips. To conservatively estimate potential daily emissions, it was assumed pipelines and force
main facilities would be constructed simultaneously with other construction components including
pump stations and treatment facilities.
Pipelines
Pipeline construction would require both open-trench construction and trenchless tunneling
depending on the location of the pipeline to be installed. A description of construction activities
and equipment associated with each of these methods is provided.
Open Trench
Open-trench construction would involve an open trench to be dug for the direct installation of
pipeline. The sequence of activities for open-trench pipeline construction would typically
commence with trenching and excavation, followed by pipe installation and covering of the
installed pipe, and concluding with paving the pipeline corridor area of disturbance. For the
purposes of quantifying emissions from daily construction activity associated with pipeline
construction, it was assumed that each contractor would complete construction of approximately
75 linear feet of pipeline per day; however, daily activity and linear feet installed would vary
depending on field conditions, site/easement access, and other factors associated with continual
site location changes. Assuming concurrent construction by two contractors, approximately 200
to 150 linear feet of pipeline installation could occur each day depending on the component
under construction and total linear feet of pipeline or conveyance infrastructure to be constructed
over a given period.3 For the purposes of modeling, it was assumed that paving activities would
3 Linear feet per day assumptions based on typical construction practices for pipeline construction, and review of
related projects.

Greenhouse Gas Emissions Analysis for the North City Project
9420-04 61 September 2017
occur for approximately 2 weeks every 6 months over a given construction period throughout the
pipeline installation phases. It was also assumed that after pipe installation is completed, a
portion of the paved roads would require light grading and reapplication of pavement, which was
assumed to occur during the last month of pipeline construction for each Project component. In
addition, for the purposes of estimating emissions, it was assumed that typical open trench
construction phasing would occur as follows:
Trenching and excavation would be ongoing throughout pipeline construction phase.
Pipe installation would occur intermittently as trenching and excavation activities occur
throughout the pipeline construction phase.
Paving, intermittent, would occur for approximately 2 weeks every 6 months for duration
of pipeline construction.
Final paving would occur for 1 month at the end of the construction phase.
Due to the length of the alignment, it was assumed that two contractors would potentially be
required for construction of the North City Project.
Trenchless Tunneling
Trenchless tunneling would involve the excavation of a portal at either end of the pipeline
segment to be installed, where the pipeline would be fed through and connected. The sequence of
activities for trenchless tunneling construction would typically commence with site preparation
of the first portal location followed by excavation of the portal. Excavation of the tunnel would
occur following portal excavation. It is assumed all excavated material would be hauled off site.
The second portal location would then be prepped and excavated. Installation of pipeline would
occur once the tunnel has been fully excavated and portals are clear. The pipeline would then be
connected, and the portal sites would be restored to their pre-construction condition. Trenchless
tunneling practices would be employed for the specific segments of other pipeline alignments
such as freeway or waterway crossings or within avoidance areas where ground disturbance (i.e.,
an open trench) is not permitted such as wetlands or other environmentally sensitive locations.
For the purposes of estimating emissions, it was assumed that typical construction phasing would
occur as follows during tunneling:
Site preparation at first portal site
Excavation of first portal site
Tunnel excavation
Site preparation at second portal site

Greenhouse Gas Emissions Analysis for the North City Project
9420-04 62 September 2017
Excavation of second portal site
Pipeline installation
Pipeline connection
Site restoration
Pump Stations and Treatment Facilities
For the purposes of estimating emissions, construction timelines vary based on the type of
feature and are summarized in the following tables.
5.2 Common Project Components
5.2.1 North City Water Reclamation Plant Expansion
To ensure the 30 MGD of pure water can be produced at the NCPWF, the NCWRP will undergo
an expansion of the primary, secondary, and tertiary treatment processes, as well as the
corresponding support systems. The proposed construction equipment for the NCWRP
Expansion is shown in Table 5.2-1.
Table 5.2-1
Construction Scenario Assumptions – NCWRP Expansion
Construction Phase (Duration)
One-way Vehicle Trips Equipment Average Daily Worker Trips
Average Daily Vendor Truck Trips
Total Haul Truck Trips Equipment Type Quantity
Usage Hours
Demolition (107 days)
16 0 0 Saws 1 8
Dumpers/Tenders 1 8
Excavators 1 8
Rubber-Tired Dozers 1 8
Grading/trenching (150 days)
16 0 1,009 Dumpers/Tenders 2 8
Excavators 2 8
Plate Compactors 2 8
Building construction (428 days)
102 40 0 Cement and Mortar Mixers 1 8
Cranes 1 8
Pumps 1 8
Tractors/loaders/backhoes 1 8
Welders 1 8
Paving (107 days) 16 0 0 Dumpers/Tenders 1 8
Pavers 1 8
Rollers 1 8

Greenhouse Gas Emissions Analysis for the North City Project
9420-04 63 September 2017
Table 5.2-1
Construction Scenario Assumptions – NCWRP Expansion
Construction Phase (Duration)
One-way Vehicle Trips Equipment Average Daily Worker Trips
Average Daily Vendor Truck Trips
Total Haul Truck Trips Equipment Type Quantity
Usage Hours
Architectural coating (107 days)
20 0 0 Air compressors 1 8
Cranes 1 8
Source: See Appendix A for details.
5.2.2 North City Pure Water Facility Influent Pump Station
The NCPWF Influent Pump Station will be constructed at the NCWRP and will convey tertiary
effluent from the NCWRP to the NCPWF. The NCPWF Influent Pump Station will have a
maximum capacity of 42.5 MGD to enable the NCPWF to produce 30 MGD of purified water
after accounting for recycle and other streams. The proposed construction equipment for the
NCPWF Influent Pump Station and pipelines are shown in Table 5.2-2.
Table 5.2-2
Construction Scenario Assumptions – NCPWF Influent Pump Station
Construction Phase (Duration)
One-Way Vehicle Trips Equipment Average Daily Worker Trips
Average Daily Vendor Truck Trips
Total Haul Truck Trips Equipment Type Quantity
Usage Hours
Demolition (21 days)
10 0 0 Saws 1 8
Dumpers/Tenders 2 8
Excavators 1 8
Rubber-Tired Dozers 1 8
Grading (97 days) 10 0 63 Dumpers/Tenders 2 8
Excavators 2 8
Plate Compactors 2 8
Building construction (260 days)
100 6 0 Cement and Mortar Mixers
1 8
Cranes 1 8
Pumps 1 8
Tractors/loaders/backhoes 1 8
Welders 1 8
Paving (80 days) 18 0 0 Dumpers/Tenders 1 8
Pavers 1 8
Rollers 1 8
Architectural coating (14 days)
6 0 0 Air compressors 1 8
Cranes 2 8
Source: See Appendix A for details.

Greenhouse Gas Emissions Analysis for the North City Project
9420-04 64 September 2017
5.2.3 Morena Pump Station and Pipelines
Morena Pump Station
The Morena Pump Station and Wastewater Forcemain are proposed to deliver maximum flow of
37.7 MGD of raw wastewater to the NCWRP, expanding the NCWRP’s production capacity
from 30 MGD to 54 MGD in dry weather conditions. The assumed construction equipment for
the Morena Pump Station is shown in Table 5.2-3.
Table 5.2-3
Construction Scenario Assumptions – Morena Pump Station
Construction Phase (Duration)
One-Way Vehicle Trips Equipment Average Daily Worker Trips
Average Daily Vendor Truck Trips
Total Haul Truck Trips Equipment Type Quantity
Usage Hours
Demolition (45 days)
14 0 0 Saws 1 8
Dumpers/Tenders 2 8
Excavators 1 8
Rubber-Tired Dozers 1 8
Grading/trenching (90 days)
16 0 400 Dumpers/Tenders 2 8
Excavators 2 8
Plate Compactors 2 8
Building construction (180 days)
16 2 0 Cement and Mortar Mixers 1 8
Cranes 1 8
Pumps 1 8
Tractors/loaders/backhoes 1 8
Welders 1 8
Paving (14 days) 16 0 0 Paving Equipment 1 8
Pavers 1 8
Rollers 1 8
Architectural coating (7 days)
8 0 0 Air compressors 1 8
Cranes 1 8
Source: See Appendix A for details.
Morena Pipelines
Off-site infrastructure of the pump station facility, excluding the Wastewater Forcemain and
Brine/Centrate Line, consists of a storm drainage line, pump station inflow piping, overflow
piping, and associated subgrade diversion structures. The proposed Morena Pipelines alignment
and type of construction is shown in Table 5.2-4. The proposed construction equipment for the
trenched portion of the Morena Pipelines is shown in Table 5.2-5, and the construction equipment
for the tunneling sections of the Morena Pipelines is shown in Table 5.2-6.

Greenhouse Gas Emissions Analysis for the North City Project
9420-04 65 September 2017
Table 5.2-4
Morena Pipeline Alignment Summary
Segment Horizontal Distance (LF) Open Cut
(LF) Trenchless or Other Method (LF) 48-in forcemain and 24-in brine/centrate line 50,890 50,890 —-
Tecolote Road Bridge and Creek 395 — 395
San Clemente Canyon Bridge 510 — 510
SR-52 1,510 — 1,510
MTS Railroad Tracks 300 — 300
Judicial Drive Intersection 290 — 290
I-805 1,100 — 1,100
Trenchless Subtotal 4,105 — 4,105
Total 54,995 (10.4 miles) 50,890 4,105 Notes: LF = linear feet; in = inch
Table 5.2-5
Construction Scenario Assumptions – Morena Pipelines Trenched Sections
Construction Phase (Duration)
One-Way Vehicle Trips Equipment Average Daily Worker Trips
Average Daily Vendor Truck Trips
Total Haul Truck Trips Equipment Type Quantity
Usage Hours
Trenching (200 days)
26 0 5,154 Excavators 2 8
Rubber-Tired Dozers 2 8
Tractors/Loaders/Backhoes 4 8
Trenchers 2 8
Building construction (200 days)
16 2 0 Forklifts 2 8
Cranes 2 8
Tractors/Loaders/Backhoes 2 8
Paving (200 days) 16 0 0 Paving Equipment 2 8
Pavers 2 8
Rollers 2 8
Source: See Appendix A for details.
Table 5.2-6
Construction Scenario Assumptions – Morena Pipelines Trenchless Sections
Construction Phase (Duration)
One-Way Vehicle Trips Equipment Average Daily Worker Trips
Average Daily Vendor Truck Trips
Total Haul Truck Trips Equipment Type Quantity
Usage Hours
Site Preparation at Portal Sites (25 days)
8 0 0 Graders 1 8
Scrapers 1 8
Tractors/Loaders/Backhoes 1 8

Greenhouse Gas Emissions Analysis for the North City Project
9420-04 66 September 2017
Table 5.2-6
Construction Scenario Assumptions – Morena Pipelines Trenchless Sections
Construction Phase (Duration)
One-Way Vehicle Trips Equipment Average Daily Worker Trips
Average Daily Vendor Truck Trips
Total Haul Truck Trips Equipment Type Quantity
Usage Hours
Portal Excavation (150 days)
16 0 0 Crushing Equipment 1 8
Excavators 1 8
Rubber-Tired Dozers 1 8
Tractors/Loaders/Backhoes 1 8
Trenchers 1 8
Tunnel Excavation (190 days)
26 2 0 Crushing Equipment 1 8
Excavators 1 8
Rubber-Tired Dozers 1 8
Tractors/Loaders/Backhoes 1 8
Trenchers 1 8
Site Restoration (150 days)
4 0 0 Tractors/Loaders/Backhoes 1 8
Source: See Appendix A for details.
5.2.4 Metro Biosolids Center Improvements
Diverting additional wastewater flows to the NCWRP ultimately changes the relative
contribution of biosolids received at the MBC from the NCWRP and the Point Loma WWTP.
The anticipated construction details for the MBC improvements are shown in Table 5.2-7.
Table 5.2-7
Construction Scenario Assumptions – MBC Improvements
Construction Phase (Duration)
One-Way Vehicle Trips Equipment Average Daily Worker Trips
Average Daily Vendor Truck Trips
Total Haul Truck Trips Equipment Type Quantity
Usage Hours
Demolition (15 days)
10 0 0 Concrete/Industrial Saws 1 8
Dumpers/Tenders 2 8
Excavators 1 8
Rubber-Tired Dozers 1 8
Grading (30 days) 10 0 0 Dumpers/Tenders 2 8
Excavators 2 8
Plate Compactors 2 8
Construction (200 days)
16 2 0 Cement and Mortar Mixers 1 8
Cranes 1 8
Pumps 1 8
Tractors/Loaders/Backhoes 1 8
Welders 1 8

Greenhouse Gas Emissions Analysis for the North City Project
9420-04 67 September 2017
Table 5.2-7
Construction Scenario Assumptions – MBC Improvements
Construction Phase (Duration)
One-Way Vehicle Trips Equipment Average Daily Worker Trips
Average Daily Vendor Truck Trips
Total Haul Truck Trips Equipment Type Quantity
Usage Hours
Paving (7 days) 18 2 0 Pavers 1 8
Paving Equipment 1 8
Rollers 1 8
Source: See Appendix A for details.
5.2.5 North City Pump Station
The North City Pump Station will be constructed on the same site as the NCPWF. Any grading
associated with the NCPWF will be captured in that phase. The anticipated construction
equipment for the North City Pump Station is shown in Table 5.2-8.
Table 5.2-8
Construction Scenario Assumptions – North City Pump Station
Construction Phase (Duration)
One-Way Vehicle Trips Equipment Average Daily Worker Trips
Average Daily Vendor Truck Trips
Total Haul Truck Trips Equipment Type Quantity
Usage Hours
Grading (15 days) 14 0 0 Excavators 1 8
Rubber-Tired Dozers 2 8
Tractors/Loaders/Backhoes 2 8
Trenching (50 days)
26 0 0 Concrete/Industrial Saws 1 8
Excavators 2 8
Off-Highway Trucks 1 8
Rollers 2 8
Tractors/Loaders/Backhoes 2 8
Welders 2 8
Building construction (230 days)
26 2 0 Aerial Lifts 2 8
Cranes 1 8
Forklifts 2 8
Rollers 1 8
Tractors/Loaders/Backhoes 1 8
Welders 2 8
Paving (5 days) 18 0 0 Crushing/Proc. Equipment 1 8
Off-Highway Trucks 1 8
Pavers 1 8
Rollers 2 8
Tractors/Loaders/Backhoes 2 8
Source: See Appendix A for details.

Greenhouse Gas Emissions Analysis for the North City Project
9420-04 68 September 2017
5.2.6 North City Renewable Energy Facility and Landfill Gas Pipeline
The proposed renewable energy facility will require construction of a main building for the six
ICEs, a control equipment building, and storage building. The Project would also require the
installation of a new 12-inch-diameter gas line from the City’s Miramar Landfill to the NCWRP.
The proposed construction equipment for the new renewable energy facility phase of the Project
is shown in Table 5.2-9, and the construction scenario assumptions for the LFG Pipeline
trenched and trenchless segments are provided in Tables 5.2-10 and 5.2-11.
Table 5.2-9
Construction Scenario Assumptions – North City Renewable Energy Facility
Construction Phase (Duration)
One-Way Vehicle Trips Equipment Average Daily Worker Trips
Average Daily Vendor Truck Trips
Total Haul Truck Trips Equipment Type Quantity
Usage Hours
Demolition (10 days)
10 0 14 Concrete/Industrial Saws 1 8
Rubber-Tired Dozers 1 8
Tractors/Loaders/Backhoes 2 8
Grading (10 days) 10 0 0 Concrete/Industrial Saws 1 8
Rubber-Tired Dozers 1 8
Tractors/Loaders/Backhoes 2 8
Building Construction (300 days)
8 4 0 Cranes 1 8
Forklifts 2 8
Tractors/Loaders/Backhoes 2 8
Paving (10 days) 18 0 0 Cement and Mortar Mixers 4 8
Pavers 1 8
Rollers 1 8
Tractors/Loaders/Backhoes 1 8
Source: See Appendix A for details.
Table 5.2-10
Construction Scenario Assumptions – LFG Pipeline Trenched Sections
Construction Phase (Duration)
One-Way Vehicle Trips Equipment Average Daily Worker Trips
Average Daily Vendor Truck Trips
Total Haul Truck Trips Equipment Type Quantity
Usage Hours
Trenching (135 days)
26 0 50 Excavators 2 8
Rubber-Tired Dozers 2 8
Tractors/Loaders/Backhoes 4 8
Trenchers 2 8
Pipeline Installation (135 days)
64 2 0 Cranes 2 8
Forklifts 2 8
Tractors/Loaders/Backhoes 2 8

Greenhouse Gas Emissions Analysis for the North City Project
9420-04 69 September 2017
Table 5.2-10
Construction Scenario Assumptions – LFG Pipeline Trenched Sections
Construction Phase (Duration)
One-Way Vehicle Trips Equipment Average Daily Worker Trips
Average Daily Vendor Truck Trips
Total Haul Truck Trips Equipment Type Quantity
Usage Hours
Paving (134 days) 16 0 0 Pavers 2 8
Paving Equipment 2 8
Rollers 2 8
Source: See Appendix A for details.
Table 5.2-11
Construction Scenario Assumptions – LFG Pipeline Trenchless Sections
Construction Phase (Duration)
One-Way Vehicle Trips Equipment Average Daily Worker Trips
Average Daily Vendor Truck Trips
Total Haul Truck Trips Equipment Type Quantity
Usage Hours
Site Preparation at Portal Sites (20 days)
8 0 0 Graders 1 8
Scrapers 1 8
Tractors/Loaders/Backhoes 1 8
Portal Excavation (120 days)
16 0 0 Crushing Equipment 1 8
Excavators 1 8
Rubber-Tired Dozers 1 8
Tractors/Loaders/Backhoes 1 8
Trenchers 1 8
Tunnel Excavation (157 days)
26 2 0 Crushing Equipment 1 8
Excavators 1 8
Rubber-Tired Dozers 1 8
Tractors/Loaders/Backhoes 1 8
Trenchers 1 8
Site Restoration (120 days)
4 0 0 Tractors/Loaders/Backhoes 1 8
Source: See Appendix A for details.
5.2.7 North City Pure Water Facility
The new NCPWF would be located on the vacant 8.7-acre City-owned lot across Eastgate Mall
to the north of the NCWRP. Table 5.2-12 provides an overview of the various structures
associated with the NCPWF, and Table 5.2-13 shows the proposed construction equipment
associated with the Project phase.

Greenhouse Gas Emissions Analysis for the North City Project
9420-04 70 September 2017
Table 5.2-12
NCPWF Building Components
Building Name Footprint (Square Feet) O&M 15,500
Ozone Generating Building 5,795
Ozone Contactor 5,408.5
BAC Building 10,823
Process Building (includes MF, RO, UV/AOP) 112,500
Main Electrical Building 3,545
Liquid Oxygen Facility 1,680
RO Feed Tank 4,961
Product Water Tank 5,850
CO2 System 795.6
Lime System 1,668.24
Chemical Systems 10,942.08
Total 322,468.42
Table 5.2-13
Construction Scenario Assumptions – NCPWF
Construction Phase (Duration)
One-Way Vehicle Trips Equipment Average Daily Worker Trips
Average Daily Vendor Truck Trips
Total Haul Truck Trips Equipment Type Quantity
Usage Hours
Mass grading (60 days)
36 0 1,125 Excavators 1 8
Graders 2 8
Off-Highway Trucks 1 8
Plate Compactors 2 8
Rubber-Tired Dozers 2 8
Scrapers 4 8
Tractors/Loaders/Backhoes 2 8
Finish grading (141 days)
18 0 1,125 Graders 1 8
Off-Highway Trucks 1 8
Plate Compactors 2 8
Scrapers 1 8
Tractors/Loaders/Backhoes 2 8
Building construction (563 days)
136 54 0 Aerial Lifts 2 8
Cranes 2 8
Forklifts 2 8
Rollers 2 8
Tractors/Loaders/Backhoes 2 8
Welders 2 8

Greenhouse Gas Emissions Analysis for the North City Project
9420-04 71 September 2017
Table 5.2-13
Construction Scenario Assumptions – NCPWF
Construction Phase (Duration)
One-Way Vehicle Trips Equipment Average Daily Worker Trips
Average Daily Vendor Truck Trips
Total Haul Truck Trips Equipment Type Quantity
Usage Hours
Paving (10 days) 24 0 0 Crushing/Proc. Equipment 1 8
Off-Highway Trucks 1 8
Pavers 2 8
Paving Equipment 1 8
Rollers 2 8
Tractors/Loaders/Backhoes 2 8
Architectural coating (141 days)
28 0 0 Aerial Lifts 1 8
Source: See Appendix A for details.
5.3 Miramar Reservoir Alternative Construction Emissions
The Miramar Reservoir Alternative includes (1) a new pump station at Morena Boulevard, a
Wastewater Forcemain, and Brine/Centrate Line (Morena Pump Station and Pipelines); (2)
expansion of the existing NCWRP; (3) construction of a new influent pump station at NCWRP
and conveyance pipeline between NCWRP and the NCPWF (NCPWF Influent Pump Station);
(4) construction of the new NCPWF–Miramar Reservoir; (5) construction of a new North City
Pump Station; (6) construction of a North City Pipeline; (7) construction of a renewable energy
facility and LFG Pipeline; (8) upgrades at the MBC; and (9) improvements at the Miramar WTP.
5.3.1 North City Pure Water Pipeline
The North City Pipeline will be designed for an average daily flow of 30 MGD with a minimum
daily flow of 23 MGD and a maximum daily flow of 33 MGD. Table 5.3-1 provides a summary of
each segment, the length, the anticipated construction method, location of the pipeline in the right-
of-way, and easement or City property as a percentage of the segment length. The proposed
construction equipment for the North City Pipeline is shown in Tables 5.3-2 and 5.3-3.
Table 5.3-1
North City Pure Water Pipeline Alignment Summary
Segment Horizontal Distance (LF) Open Cut (LF) Trenchless or Other
Method (LF) A West Alignment: Miramar Road 25,700 25,186 514
B West Alignment: Black Mountain Road 4,100 2,911 1,189
C I-15 Crossing 1,340 925 415
D East Alignment: Carroll Canyon Road 4,285 4,242 43

Greenhouse Gas Emissions Analysis for the North City Project
9420-04 72 September 2017
Table 5.3-1
North City Pure Water Pipeline Alignment Summary
Segment Horizontal Distance (LF) Open Cut (LF) Trenchless or Other
Method (LF) E East Alignment: Approach to Miramar 4,300 3,354 946
Subtotal 39,725 36,618 3,107
F Subaqueous Discharge 4,800 — —
Total 44,525 (8.4 miles) — — Note: LF = linear feet
Table 5.3-2
Construction Scenario Assumptions – North City Pipeline Open Trench
Construction Phase (Duration)
One-Way Vehicle Trips Equipment Average Daily Worker Trips
Average Daily Vendor Truck Trips
Total Haul Truck Trips Equipment Type Quantity
Usage Hours
Trenching (200 days)
26 0 2,537 Concrete/Industrial Saws 1 8
Excavators 2 8
Off-Highway Trucks 1 8
Rollers 2 8
Tractors/Loaders/Backhoes 2 8
Welders 2 8
Tunneling (200 days)
24 0 0 Bore/Drill Rigs 1 8
Cranes 1 8
Crushing/Proc. Equipment 1 8
Generator Sets 1 8
Off-Highway Trucks 1 8
Tractors/Loaders/Backhoes 2 8
Welders 2 8
Subaqueous Pipeline (200 days)
18 0 0 Forklifts 1 8
Generator Sets 1 8
Other Construction Equipment
4 8
Tractors/Loaders/Backhoes 1 8
Paving (200 days) 18 0 0 Crushing/Proc. Equipment 1 8
Off-Highway Trucks 1 8
Pavers 1 8
Rollers 2 8
Tractors/Loaders/Backhoes 2 8
Source: See Appendix A for details.

Greenhouse Gas Emissions Analysis for the North City Project
9420-04 73 September 2017
Table 5.3-3
Construction Scenario Assumptions – North City Pipeline Trenchless
Construction Phase (Duration)
One-Way Vehicle Trips Equipment Average Daily Worker Trips
Average Daily Vendor Truck Trips
Total Haul Truck Trips Equipment Type Quantity
Usage Hours
Site Preparation at Portal Sites (100 days)
8 0 0 Graders 1 8
Scrapers 1 8
Tractors/Loaders/Backhoes 1 8
Portal Excavation (100 days)
14 0 0 Crushing/Proc. Equipment 1 8
Excavators 1 8
Rubber-Tired Dozers 1 8
Tractors/Loaders/Backhoes 1 8
Trenchers 1 8
Pipe Installation (100 days)
2 2 0 Cranes 1 8
Tractors/Loaders/Backhoes 1 8
Welders 2 8
Pipe Connection (100 days)
2 0 0 Other General Industrial Equipment
1 8
Site Restoration (100 days)
4 0 0 Tractors/Loaders/Backhoes
1 8
Source: See Appendix A for details.
5.3.2 Pure Water Dechlorination Facility
A Dechlorination Facility will be located at the end of Meanley Drive off the cul-de-sac on the
City’s property for the Miramar Recycled Water Storage Tank. The proposed construction
equipment for the Dechlorination Facility is shown in Table 5.3-4.
Table 5.3-4
Construction Scenario Assumptions – Dechlorination Facility
Construction Phase (Duration)
One-Way Vehicle Trips Equipment Average Daily Worker Trips
Average Daily Vendor Truck Trips
Total Haul Truck Trips Equipment Type Quantity
Usage Hours
Grading (60 days) 16 0 0 Dumpers/Tenders 2 8
Excavators 2 8
Plate Compactors 2 8
Building construction (90 days)
100 10 0 Cement and Mortar Mixers 1 8
Cranes 1 8
Pumps 1 8
Tractors/Loaders/Backhoes 1 8
Welders 1 8

Greenhouse Gas Emissions Analysis for the North City Project
9420-04 74 September 2017
Table 5.3-4
Construction Scenario Assumptions – Dechlorination Facility
Construction Phase (Duration)
One-Way Vehicle Trips Equipment Average Daily Worker Trips
Average Daily Vendor Truck Trips
Total Haul Truck Trips Equipment Type Quantity
Usage Hours
Paving (7 days) 16 0 0 Dumpers/Tenders 1 8
Pavers 1 8
Rollers 1 8
Source: See Appendix A for details.
5.3.3 Miramar Water Treatment Plant Improvements
Under the Miramar Reservoir Alternative, purified water discharged into the Miramar Reservoir
will be pumped to the existing Miramar Reservoir Pump Station to the Miramar WTP for
treatment and eventual distribution. The construction assumptions for the Miramar WTP is
shown in Table 5.3-5.
Table 5.3-5
Construction Scenario Assumptions – Miramar WTP Improvements
Construction Phase (Duration)
One-Way Vehicle Trips Equipment Average Daily Worker Trips
Average Daily Vendor Truck Trips
Total Haul Truck Trips Equipment Type Quantity
Usage Hours
Demolition (10 days)
10 0 0 Concrete/Industrial Saws 1 8
Rubber-Tired Dozers 1 8
Tractors/Loaders/Backhoes 2 8
Building construction (60 days)
50 10 0 Aerial Lifts 1 8
Cranes 1 8
Forklifts 1 8
Rollers 1 8
Tractors/Loaders/Backhoes 1 8
Welders 1 8
Source: See Appendix A for details.
5.3.4 Miramar Reservoir Alternative Construction Emissions
Table 5.3-6, Estimated Annual Construction GHG Emissions, shows the estimated annual GHG
construction emissions associated with Project components, as well as the annualized
construction emissions over a 30-year “Project life.” Complete details of the emissions
calculations are provided in Appendix A of this document.

Greenhouse Gas Emissions Analysis for the North City Project
9420-04 75 September 2017
Table 5.3-6
Estimated Construction GHG Emissions
Project Component MT CO2 MT CH4 MT N2O MT CO2E Miramar Reservoir Alternative – 2018
North City Pipeline 132.39 0.03 0.00 133.21
Miramar Reservoir Alternative – 2019
Morena Pump Station and Pipelines 1,032.70 0.24 0.00 1,038.73
NCWRP Expansion 383.55 0.07 0.00 385.20
NCPWF Influent Pump Station 283.64 0.05 0.00 284.79
MBC Improvements 147.43 0.03 0.00 148.18
North City Pump Station 233.43 0.06 0.00 234.97
NCPWF 559.52 0.15 0.00 563.18
North City Pipeline 898.73 0.21 0.00 904.03
Pure Water Dechlorination Facility 157.14 0.03 0.00 157.81
Total 2019 3,696.14 0.83 0.00 3,716.90 Miramar Reservoir Alternative – 2020
North City Pump Station 155.12 0.04 0.00 156.14
Morena Pump Station and Pipelines 595.09 0.15 0.00 598.88
MBC Improvements 64.24 0.01 0.00 64.55
LFG Pipeline 577.08 0.16 0.00 581.07
NCPWS Influent Pump Station 217.84 0.03 0.00 218.67
NCWRP Expansion 483.65 0.06 0.00 485.05
NCPWF 703.64 0.14 0.00 707.01
North City Pipeline 591.84 0.15 0.00 595.51
North City Renewable Energy Facility 167.34 0.05 0.00 168.54
Miramar WTP Improvements 72.73 0.02 0.00 73.14
Total 2020 3,628.56 0.80 0.00 3,648.56 Miramar Reservoir Alternative — 2021
Morena Pipelines 231.53 0.06 0.00 233.13
LFG Pipeline 448.00 0.11 0.00 450.87
NCWRP Expansion 198.77 0.03 0.00 199.57
NCPWF 348.46 0.07 0.00 350.14
North City Pipeline 409.44 0.11 0.00 412.11
North City Renewable Energy Facility 80.97 0.02 0.00 81.56
Total 2021 1,717.17 0.41 0.00 1,727.39 Total Project construction GHG emissions 9,174.26 2.07 0.00 9,226.05
Amortized construction GHG emissions 307.54 Source: CalEEMod Version 2016.3.1. See Appendix A for complete results. Notes: MT CO2 = metric tons of carbon dioxide; MT CH4 = metric tons of methane; MT N2O = metric tons of nitrous oxide; MT CO2E = metric tons of carbon dioxide equivalent

Greenhouse Gas Emissions Analysis for the North City Project
9420-04 76 September 2017
5.4 San Vicente Reservoir Alternative Construction Emissions
The San Vicente Reservoir Alternative would include those elements in common with the Miramar
Reservoir Alternative, but with additional upgrades to meet the pipeline alignment increase compared
to the Miramar Reservoir Alternative. The following sections describe those components unique to the
San Vicente Reservoir Alternative and the construction emission assumptions associated with each.
5.4.1 San Vicente Pure Water Pipeline
The San Vicente Pipeline will be designed for an average daily flow of 31.4 MGD with a
minimum daily flow of 27 MGD and a maximum daily flow of 35 MGD. Table 5.4-1 provides a
summary of the anticipated construction method and length of each type of construction. The
proposed construction equipment for the San Vicente Pipeline is shown in Tables 5.4-2 and 5.4-3.
Table 5.4-1
San Vicente Pipeline Segment Construction Summary
Construction Method Segment Length (LF) Diameter Open Cut and Trenchless 39,232 48-inch
Open Cut and Trenchless 14,555 60-inch
Repurposed 20,583 48-inch
Open Cut 61,936 48-inch
Trenchless 2,801 48-inch
Trenchless (Microtunnel) 1,985 48-inch
Hard Rock Tunnel 5,446 60-inch
Note: LF = linear feet
Table 5.4-2
Construction Scenario Assumptions – San Vicente Pipeline Open Trench
Construction Phase (Duration)
One-Way Vehicle Trips Equipment Average Daily Worker Trips
Average Daily Vendor Truck Trips
Total Haul Truck Trips Equipment Type Quantity
Usage Hours
Trenching (200 days)
26 0 13,073 Excavators 2 8
Rubber-Tired Dozers 2 8
Tractors/Loaders/Backhoes 4 8
Trenchers 2 8
Pipeline Installation (200 days)
16 0 0 Tractors/Loaders/Backhoes 1 8
Paving (200 days) 16 0 0 Pavers 2 8
Paving Equipment 2 8
Rollers 2 8
Source: See Appendix A for details.

Greenhouse Gas Emissions Analysis for the North City Project
9420-04 77 September 2017
Table 5.4-3
Construction Scenario Assumptions – San Vicente Pipeline Trenchless
Construction Phase (Duration)
One-Way Vehicle Trips Equipment Average Daily Worker Trips
Average Daily Vendor Truck Trips
Total Haul Truck Trips Equipment Type Quantity
Usage Hours
Trenching (200 days)
26 0 0 Excavators 2 8
Rubber-Tired Dozers 2 8
Tractors/Loaders/Backhoes 4 8
Trenchers 2 8
Building Construction (200 days)
14 6 0 Cranes 1 8
Generator Sets 1 8
Rubber Tired Loaders 2 8
Welders 2 8
Source: See Appendix A for details.
5.4.2 Mission Trails Booster Station
The MTBS would be located along Mission Gorge Road spread across two privately owned
parcels. The proposed construction equipment for the MTBS is shown in Table 5.4-4.
Table 5.4-4
Construction Scenario Assumptions – MTBS
Construction Phase (Duration)
One-Way Vehicle Trips Equipment Average Daily Worker Trips
Average Daily Vendor Truck Trips
Total Haul Truck Trips Equipment Type Quantity
Usage Hours
Grading (30 days) 30 0 36,750 Graders 2 8
Off-Highway Trucks 1 8
Plate Compactors 1 8
Rubber-Tired Dozers 2 8
Scrapers 4 8
Tractors/Loaders/Backhoes 2 8
Underground install and trenching (50 days)
26 0 0 Concrete/Industrial Saws 1 8
Excavators 2 8
Off-Highway Trucks 1 8
Rollers 2 8
Tractors/Loaders/Backhoes 2 8
Welders 2 8
Building construction (230 days)
16 2 0 Aerial Lifts 2 8
Cranes 1 8
Forklifts 2 8
Rollers 1 8
Tractors/Loaders/Backhoes 1 8
Welders 2 8

Greenhouse Gas Emissions Analysis for the North City Project
9420-04 78 September 2017
Table 5.4-4
Construction Scenario Assumptions – MTBS
Construction Phase (Duration)
One-Way Vehicle Trips Equipment Average Daily Worker Trips
Average Daily Vendor Truck Trips
Total Haul Truck Trips Equipment Type Quantity
Usage Hours
Paving (5 days) 18 0 0 Crushing/Proc. Equipment 1 8
Off-Highway Trucks 1 8
Pavers 1 8
Rollers 2 8
Tractors/Loaders/Backhoes 2 8
Source: See Appendix B for details.
5.4.3 San Vicente Reservoir Alternative Construction Emissions
Table 5.4-5, Estimated Annual Construction GHG Emissions, shows the estimated annual GHG
construction emissions associated with Project components, as well as the annualized
construction emissions over a 30-year “Project life.”
Table 5.4-5
Estimated Construction GHG Emissions
Project Component MT CO2 MT CH4 MT N2O MT CO2E San Vicente Reservoir Alternative – 2018
North City Pipeline 149.92 0.03 0.00 150.74
San Vicente Reservoir Alternative - 2019
Morena Pump Station and Pipelines 1,032.70 0.24 0.00 1,038.73
NCWRP Expansion 383.55 0.07 0.00 385.20
NCPWF Influent Pump Station 283.64 0.05 0.00 284.79
MBC Improvements 147.43 0.03 0.00 148.18
North City Pump Station 233.43 0.06 0.00 234.97
NCPWF 559.52 0.15 0.00 563.18
San Vicente Pipeline 1,396.01 0.31 0.00 1,403.75
MTBS 1,794.52 0.23 0.00 1,800.28
Total 2019 5,830.81 1.13 0.00 5,859.09 San Vicente Reservoir Alternative – 2020
North City Pump Station 155.12 0.04 0.00 156.14
Morena Pump Station and Pipelines 595.09 0.15 0.00 598.88
MBC Improvements 64.24 0.01 0.00 64.55
Landfill Gas Pipeline 577.08 0.16 0.00 581.07
NCPWS Influent Pump Station 217.84 0.03 0.00 218.67
NCWRP Expansion 483.65 0.06 0.00 485.05
NCPWF 703.64 0.14 0.00 707.01
North City Renewable Energy Facility 167.34 0.05 0.00 168.54

Greenhouse Gas Emissions Analysis for the North City Project
9420-04 79 September 2017
Table 5.4-5
Estimated Construction GHG Emissions
Project Component MT CO2 MT CH4 MT N2O MT CO2E MTBS 161.98 0.04 0.00 163.05
San Vicente Pipeline 351.79 0.09 0.00 354.02
Total 2020 3,477.76 0.77 0.00 3,496.97 San Vicente Reservoir Alternative – 2021
Morena Pipelines 231.53 0.06 0.00 233.13
Landfill Gas Pipeline 448.00 0.11 0.00 450.87
NCWRP Expansion 198.77 0.03 0.00 199.57
NCPWF 348.46 0.07 0.00 350.14
San Vicente Pipeline 60.90 0.02 0.00 61.35
North City Renewable Energy Facility 80.97 0.02 0.00 81.56
Total 2021 1,368.62 0.32 0.00 1,376.63 Total Project construction GHG emissions 10,827.11 2.25 0.00 10,883.43
Amortized construction GHG emissions 362.78 Source: CalEEMod Version 2016.3.1. See Appendix B for complete results. Notes: Totals may not sum due to rounding. MT CO2 = metric tons of carbon dioxide; MT CH4 = metric tons of methane; MT N2O = metric tons of nitrous oxide; MT CO2E = metric tons of carbon dioxide equivalent
5.5 Operational Impacts
5.5.1 Miramar Reservoir Alternative
Operation of the Project would result in direct GHG emissions from vehicular traffic, testing and
maintenance of stationary diesel generators, and indirect GHG emissions from use of electricity.
Mobile Sources (Motor Vehicles)
The Project would result in 60 additional staff. It is expected that during normal operations, these
workers would generate in 120 one-way trips. Additionally, operational trips would be generated as a
result of routine maintenance, periodic inspections and repairs of system facilities, monitoring, brush
maintenance, and other operational procedures similar to those under the City’s current water and
wastewater treatment and distribution system. It was assumed only a minor increase in O&M trips
(in addition to the 60 new employees) would be required; therefore, it was assumed on a worst-case
day an additional 10 O&M-related trips would occur. In total, Project operations would be expected
to generate approximately 140 average daily trips across the entire Project area.
Annual CO2 emissions from motor vehicle trips for full Project buildout were quantified using
CalEEMod Version 2016.3.1 (refer to Appendix A for additional details and model
assumptions). Project-related traffic was assumed to include a mixture of vehicles in accordance

Greenhouse Gas Emissions Analysis for the North City Project
9420-04 80 September 2017
with the model outputs for traffic. Emission factors representing the vehicle mix and emissions
for 2022 were used to estimate emissions associated with the first phase of the Project. Table 5.5-
1 presents estimated annual mobile source GHG emissions resulting from Project-generated trips.
Table 5.5-1
Estimated Annual Mobile Source GHG Emissions
Emissions Source MT CO2 MT CH4 MT N2O MT CO2E Mobile Sources 217.37 0.01 0.00 217.64
Source: Appendix A. Notes: MT CO2 = metric tons of carbon dioxide; MT CH4 = metric tons of methane; MT N2O = metric tons of nitrous oxide; MT CO2E = metric tons of carbon dioxide equivalent
Electricity Production and Consumption
The generation of electricity through combustion of fossil fuels typically results in emissions of
CO2 and, to a smaller extent, CH4 and N2O. Electricity would be required to operate various
components of the Project. The Project components will be powered by an on-site renewable
energy facility. The City provided the electricity use for each Project component. The GHG emissions
from the renewable energy facility account for the emissions from power usage for the Miramar
Reservoir Alternative. The GHG emissions were calculated using a spreadsheet-based model and
emission factors provided by the engine manufacturer (Appendix C).
The LFG to be used in the Project is generated at the nearby Miramar Landfill and is currently
being emitted from the surface of the landfill or flared. This LFG is a biogenic source of GHGs,
i.e., GHG emissions related to nature’s carbon cycle from the biological decomposition of waste
in the landfill. Biogenic GHG emissions associated with the LFG already occur and can be
considered baseline conditions, and are not an impact generated by the Project. Therefore,
nonbiogenic GHG emissions from the combustion of natural gas generate the maximum Project-
related GHG emissions. The amount of supplemental natural gas combusted per engine will
fluctuate. Thus, these emissions are a conservative estimate. In actual practice, GHG emissions
are expected to be significantly lower. However, for the analysis it was assumed that up to three
of the engines would operate on 30% natural gas continuously.
The City’s current water supply includes importing one-third from the State Water Project and
two-thirds from the Colorado River. The North City Project would offset the energy needed to
pump, treat, and supply the imported water. The City provided annual electricity demand for the
North City Project components. For components that are expanded for the project and not
entirely new, only the net electricity demand was included. The total estimated energy use for the
Miramar Reservoir Alternative is 126,295,000 kWh per year, which would result in 11,534
kWh/MG, assuming 30 MGD.

Greenhouse Gas Emissions Analysis for the North City Project
9420-04 81 September 2017
The North City Renewable Energy Facility will power the NCWRP, NCPWF Influent Pump
Station, NCPWF, and North City Pump Station. The Miramar WTP would receive all of its
power from an on-site 1 MW solar photovoltaic system. The other components would receive
electricity from San Diego Gas & Electric (SDG&E). The North City Renewable Energy Facility
would export excess power to SDG&E as it will produce more energy than the Project
components will demand. Although on a daily basis there would be a net import and export of
electricity from the North City Renewable Energy Facility, over an entire year the Miramar
Reservoir Alternative would export more power than it would import. Because the Project would
offset the demand from electricity from SDG&E with power from the North City Renewable
Energy Facility, the avoided GHG emissions associated with energy not used is also included in
the analysis. The emissions were based on the energy demand from the Project, excess energy
supplied to the grid, and emission factors for SDG&E as found in CalEEMod. The estimated
GHG emissions associated with the North City Renewable Energy Facility are shown below.
Table 5.5-2 presents GHG emissions associated with the Miramar Reservoir Alternative’s
anticipated annual electricity consumption and the avoided emissions from grid electricity.
Table 5.5-2
Estimated Annual Electricity Consumption GHG Emissions
Emissions Source MT CO2 MT CH4 MT N2O MT CO2E Avoided Emissions
Grid Energy Use1 41,274.36 1.66 0.35 41,421.23
Project Emissions
Miramar Reservoir Alternative 2 30,880.22 2.85 0.06 30,968.58
Net Change in Emissions (10,394.14) 1.19 (0.29) (10,452.65) Sources: Appendices A and C. Notes: MT CO2 = metric tons of carbon dioxide; MT CH4 = metric tons of methane; MT N2O = metric tons of nitrous oxide; MT CO2E = metric tons of carbon dioxide equivalent 1 SDG&E GHG emission factors used. 2 GHG emissions calculated from North City Renewable Energy Facility.
As presented in Table 5.5-2, GHG emissions associated with avoided grid-purchased electricity
would be 41,421 MT CO2E. The purified water electrical demand and resulting GHG emissions
from the natural gas use from the renewable energy facility would be 30,969 MT CO2E per year.
Accordingly, the net change in GHG emissions from the Project would be a reduction of 10,453
MT CO2E per year. Refer to Appendices A and C for details.
Wastewater Process Emissions
Centralized wastewater treatment processes can result in CH4 and N2O emissions. CH4 emissions
can result under processes associated with anaerobic digestion of soluble organic material when
the captured biogas is not completely combusted. It is assumed that the majority of the generated

Greenhouse Gas Emissions Analysis for the North City Project
9420-04 82 September 2017
biogas would be combusted (e.g., cogeneration, boilers, flares) but a small amount (e.g., 1%)
would not be completely combusted. N2O emissions may be generated from the treatment of
municipal wastewater during both nitrification and denitrification of the nitrogen present, usually
in the form of urea, ammonia, and proteins. These compounds are converted to nitrate (NO3)
through the aerobic process of nitrification. Denitrification occurs under anoxic conditions
(without free oxygen), and involves the biological conversion of nitrate into nitrogen gas (N2).
N2O can be an intermediate product of both processes (CARB et al. 2010). Methodologies used
to estimate CH4 and N2O emissions from wastewater treatment processes were derived from the
Local Government Operations Protocol (CARB et al. 2010).
Stationary CH4 Emissions
Annual stationary CH4 (MT CO2E) emissions from incomplete combustion of digester gas were
calculated as follows:
(P × Digester Gas × F CH4 × D(CH4) × (1-DE) × 0.0283 × 365.25 × 10-6
) × GWP
Where:
P = population served by the WWTP with anaerobic digesters
Digester Gas = cubic feet of digester gas produced per person per day [ft3/person/day]
FCH4 = fraction of CH4 in biogas
D(CH4) = density of methane [g/m3]
DE = CH4 Destruction Efficiency
0.0283 = conversion from ft3 to m
3
365.25 = conversion factor [day/year]
10-6
= conversion from g to metric ton [metric ton/g]
GWP = Global Warming Potential
According to the City of San Diego’s Sewer Design Guide, daily per-capita wastewater flow is
approximately 80 gallons per capita per day (City of San Diego 2015c). The NCWRP, which
would generate the biosolids processed by the MBC, would have an AADF of 30 MGD after
expansion; therefore, for the purposes of estimating emissions, it is estimated that the MBC
facility would have a service population equivalent of 375,000. Stationary CH4 emissions from
incomplete combustion of biogas were estimated to be approximately 417 MT CO2E per year
(see Appendix A for details).

Greenhouse Gas Emissions Analysis for the North City Project
9420-04 83 September 2017
Process N2O Emissions
Process N2O emissions can occur in facilities with nitrification/denitrification processes, and to a
lesser extent in facilities without these processes. The NCWRP would increase capacity by 21
MGD during peak daily loads resulting in a service population equivalent of 262,500. Process
N2O emissions were estimated to be approximately 684 MT CO2E per year (see Appendix A for
details). Annual process N2O emissions (metric tons CO2E) were calculated as follows:
((Ptotal × Find-com) × EF nit/denit × 10-6) × GWP
Where:
Ptotal = total population that is served by the centralized WWTP adjusted for industrial discharge
Find-com = factor for industrial and commercial co-discharge of waste into the sewer system
EF nit/denit = emission factor for a WWTP with nitrification/denitrification
[g/N2O/person/year]
10-6 = conversion from g to metric ton [metric ton/g]
GWP = Global Warming Potential
N2O emissions can also be generated through discharge to surface waters such as the Miramar
Reservoir. Minimal N2O emissions could occur from advanced water purification facility
effluent discharge due to the removal of nitrogen compounds by reverse osmosis (RO). Annual
N2O emissions (MT CO2E) from discharge were calculated as follows:
(N Load × EF effluent × 365.25 × 10-3
× 44/28) × GWP
Where:
N Load = measured average total nitrogen discharged [kg N/day]
EF effluent = emission factor [kg N2O-N/kg sewage-N produced]
365.25 = conversion factor [day/year]
10-3
= conversion from kg to metric ton [metric ton/kg]
44/28 = molecular weight ratio of N2O to N2
GWP = Global Warming Potential
The Project would produce 30 MGD of purified water that could be discharged to a surface water
source resulting in minimal process emissions. Based on test results, the average total nitrogen in
purified water would be 0.5 mg/L (MWH et al. 2016). N2O emissions from discharge were estimated
to be approximately 49 MT CO2E per year (see Appendix A for details).

Greenhouse Gas Emissions Analysis for the North City Project
9420-04 84 September 2017
Table 5.5-3 provides a summary of process and discharge GHG emissions.
Table 5.5-3
Estimated Annual Wastewater Process and Discharge GHG Emissions
Source MT CH4 MT N2O MT CO2E Incomplete combustion of digester gas 16.68 — 416.98
WWTP with nitrification/denitrification — 2.30 684.47
Effluent discharge emissions — 0.16 48.53
Total Process Emissions 1,149.98 Source: Appendix A. Notes: MT CH4 = metric tons of methane; MT N2O = metric tons of nitrous oxide; MT CO2E = metric tons of carbon dioxide equivalent
Refrigerant Use
The air-cooled chillers in the North City Project will contain refrigerant. The 60-ton chiller will
have a total refrigerant charge of 131 pounds (lbs) of R-410A refrigerant. As discussed in
Section 2.2, refrigerants such as R-410A are high GWP HFCs that can have a large impact if
released into the atmosphere. The EPA-tolerated leak-rate for commercial HVAC equipment is
10% per year. Assuming that rate, it is estimated that up to 13.1 lbs of R-410A refrigerant would
be emitted per year. The GWP for R-410A is 2,088, meaning that one lb of R-410A is 2,088
times more potent than CO2 as a GHG (The Climate Registry 2016). Using the annual leak rate
and the GWP, it is estimated that 12 MT CO2E would be emitted per year from refrigerant use.
Diesel Generators
To conservatively estimate stationary source emissions related to generator use, it was assumed a
new diesel-powered emergency generator would be required for back-up power at the NCPWF.
For the purposes of a conservative analysis, it was assumed the generator would be
approximately 750 kilowatts (approximately 1,000 HP). It was assumed generators would only
be used for emergency back-up power in the event of power outages, as well as for routine
testing and maintenance. CARB’s Airborne Toxic Control Measure for stationary diesel engines
restricts diesel engine operation for testing and maintenance to 50 hours per year, unless a diesel
particulate filter is used to reduce PM10 emissions (CARB 2011b). Thus, it was assumed that the
engines would operate up to 50 hours per year (1 hour per week, 50 weeks per year) for testing
and maintenance. Emission factors for CO2 and CH4 were obtained from the CalEEMod User’s
Guide, Appendix D, for generators over 1,001 HP4 operating in 2022 (first year of Project
4 The CalEEMod User’s Guide does not provide emission factors for generator sets rated at 751 to 1,000 HP;
however, the CO2 emission factor for generator sets rated at 501–750 HP and greater than 1,000 HP are the
same and the CH4 factor for the larger HP range is slightly higher than that for the smaller HP range.

Greenhouse Gas Emissions Analysis for the North City Project
9420-04 85 September 2017
operation). Table 5.5-4 presents estimated annual GHG emissions associated with testing and
maintenance of emergency diesel generators.
Table 5.5-4
Estimated Annual Diesel Generators GHG Emissions
Emissions Source MT CO2 MT CH4 MT N2O MT CO2E Diesel Generators 19.04 0.00 0.00 19.11
Source: Appendix A Notes: MT CO2 = metric tons of carbon dioxide; MT CH4 = metric tons of methane; MT N2O = metric tons of nitrous oxide; MT CO2E = metric tons of carbon dioxide equivalent
Summary of GHG Emissions
Table 5.5-5 shows the total operational GHG emissions for the Miramar Reservoir Alternative
after accounting for amortized construction emissions.
Table 5.5-5
Summary of Estimated Annual GHG Emissions
Emissions Source MT CO2 MT CH4 MT N2O MT CO2E Avoided Emissions
Grid Energy Use 41,274.36 1.66 0.35 41,421.23
Miramar Reservoir Alternative
Mobile Sources 217.37 0.01 0.00 217.64
Electricity Production 30,880.22 2.85 0.06 30,968.58
Wastewater Process Emissions — 16.68 2.46 1,149.98
Refrigerant Use 12.41 0.00 0.00 12.41
Diesel Generators 19.04 0.00 0.00 19.11
Waste 10.53 0.62 0.00 26.10
Water 8.51 0.06 0.00 10.48
Amortized Construction Emissions 307.54
Total Project Emissions 32,711.84 Net Change in Emissions (8,709.39)
Source: See Appendice A and C for complete results. Notes: MT CO2 = metric tons of carbon dioxide; MT CH4 = metric tons of methane; MT N2O = metric tons of nitrous oxide; MT CO2E = metric tons of carbon dioxide equivalent
Implementation of the Project, as analyzed at the Project level of analysis, would result in a net
decrease of approximately 8,709 MT CO2E per year as a result of offsetting the need for
imported water sources and grid energy use.
5.5.2 San Vicente Reservoir Alternative
Operation of the Project would result in direct GHG emissions from vehicular traffic, testing and
maintenance of stationary diesel generators, and indirect GHG emissions from use of electricity.

Greenhouse Gas Emissions Analysis for the North City Project
9420-04 86 September 2017
Mobile Sources (Motor Vehicles)
The Project would result in 60 additional staff. It is expected that during normal operations, these
workers would generate in 120 one-way trips. Additionally, operational trips would be generated
as a result of routine maintenance, periodic inspections and repairs of system facilities,
monitoring, brush maintenance, and other operational procedures similar to those under the
City’s current water and wastewater treatment and distribution system. It was assumed only a
minor increase in O&M trips (in addition to the 60 new employees) would be required; therefore,
it was assumed on a worst-case day an additional O&M-related trips would occur. In total,
Project operations would be expected to generate approximately 140 average daily trips across
the entire Project area.
Annual CO2 emissions from motor vehicle trips for full project buildout were quantified using
CalEEMod Version 2016.3.1 (refer to Appendix B for additional details and model
assumptions). Project-related traffic was assumed to include a mixture of vehicles in accordance
with the model outputs for traffic. Emission factors representing the vehicle mix and emissions
for 2022 were used to estimate emissions associated with the first phase of the Project. Table 5.5-
6 presents estimated annual motor vehicle GHG emissions resulting from Project-generated trips.
Table 5.5-6
Estimated Annual Motor Vehicle GHG Emissions
Emissions Source MT CO2 MT CH4 MT N2O MT CO2E Mobile Sources 217.37 0.01 0.00 217.64
Source: Appendix B Notes: MT CO2 = metric tons of carbon dioxide; MT CH4 = metric tons of methane; MT N2O = metric tons of nitrous oxide; MT CO2E = metric tons of carbon dioxide equivalent
Electricity Consumption
The generation of electricity through combustion of fossil fuels typically results in emissions
of CO2 and, to a smaller extent, CH4 and N2O. Electricity would be required to operate various
components of the San Vicente Reservoir Alternative. The Project components will be
powered either by an existing on-site North City Renewable Energy Facility or through
SDG&E. The City provided electricity use for each Project component. A spreadsheet model
was used to calculate GHG emissions from the North City Renewable Energy Facility.
CalEEMod was used to calculate GHG emissions from power derived from SDG&E. The
purified water electricity usage was estimated to be approximately 144,904,000 kWh/year.
Because the Project would offset the demand from electricity from SDG&E, the avoided
emissions associated with energy not used is also included in the analysis. Table 5.5-7 presents

Greenhouse Gas Emissions Analysis for the North City Project
9420-04 87 September 2017
GHG emissions associated with the typical urban imported water use and the North City
Project’s anticipated annual electricity consumption.
Table 5.5-7
Estimated Annual Electricity Consumption GHG Emissions
Emissions Source MT CO2 MT CH4 MT N2O MT CO2E Avoided Emissions
Grid Energy Use1 44,087.86 1.77 0.38 44,244.70
Project Emissions
San Vicente Reservoir Alternative2 34,148.31 2.98 0.09 34,248.30
Net Change in Emissions (9,939.55) 1.21 (0.29) (9,996.40) Sources: Appendices B and C. Notes: MT CO2 = metric tons of carbon dioxide; MT CH4 = metric tons of methane; MT N2O = metric tons of nitrous oxide; MT CO2E = metric tons of carbon dioxide equivalent 1 SDG&E GHG emission factors used. 2 GHG emissions calculated from North City Renewable Energy Facility and SDG&E.
As presented in Table 5.5-7, GHG emissions associated with avoided grid-purchased electricity
would be 44,245 MT CO2E. The purified water electrical demand and resulting GHG emissions
from the natural gas use from the renewable energy facility and grid-purchased electricity would
be 34,248 MT CO2E per year. Accordingly, the net change in GHG emissions from the Project
would be a reduction of 9,996 MT CO2E per year. Refer to Appendices B and C for details.
Wastewater Process Emissions
Stationary CH4 Emissions
According to the City of San Diego’s Sewer Design Guide, daily per-capita wastewater flow is
approximately 80 gallons per capita per day (City of San Diego 2015c). The NCWRP, which
would generate the biosolids processed by the MBC, would have an AADF of 30 MGD after
expansion; therefore, for the purposes of estimating emissions, it is estimated that the MBC
facility would have a service population equivalent of 375,000. Stationary CH4 emissions from
incomplete combustion of biogas were estimated to be approximately 417 MT CO2E per year
(see Appendix B for details).
Process N2O Emissions
Process N2O emissions can occur in facilities with nitrification/denitrification processes, and to a
lesser extent in facilities without these processes. The NCWRP would increase capacity by 21 MGD
during peak daily loads resulting in a service population equivalent of 262,500. Process N2O
emissions were estimated to be approximately 684 MT CO2E per year (see Appendix B for details).

Greenhouse Gas Emissions Analysis for the North City Project
9420-04 88 September 2017
N2O emissions can also be generated through discharge to surface waters such as the Miramar
Reservoir. Minimal N2O emissions could occur from advanced water purification facility effluent
discharge due to the removal of nitrogen compounds by reverse osmosis (RO). The Project would
produce 30 MGD of purified water that could be discharged to a surface water source resulting in
minimal process emissions. Based on test results, the average total nitrogen in discharged effluent
would be 0.5 mg/L (MWH et al. 2016). N2O emissions from discharge were estimated to be
approximately 49 MT CO2E per year (see Appendix B for details).
Table 5.5-8 provides a summary of process and discharge GHG emissions.
Table 5.5-8
Estimated Annual Wastewater Process and Discharge GHG Emissions
Source MT CH4 MT N2O MT CO2E Incomplete combustion of digester gas 16.68 — 416.98
WWTP with nitrification/denitrification — 2.30 684.47
Effluent discharge emissions — 0.16 48.53
Total Process Emissions 1,149.98 Source: Appendix B Notes: MT CH4 = metric tons of methane; MT N2O = metric tons of nitrous oxide; MT CO2E = metric tons of carbon dioxide equivalent
Refrigerant Use
The air-cooled chillers in the North City Project will contain refrigerant. The 60-ton chiller will
have a total refrigerant charge of 131 lbs of R-410A refrigerant. As discussed in Section 2.2,
refrigerants such as R-410A are high GWP HFCs that can have a large impact if released into the
atmosphere. The EPA-tolerated leak-rate for commercial HVAC equipment is 10% per year.
Assuming that rate, it is estimated that up to 13.1 lbs of R-410A refrigerant would be emitted per
year. The GWP for R-410A is 2,088, meaning that 1 lb of R-410A is 2,088 times more potent
than CO2 (The Climate Registry 2016). Using the annual leak rate and the GWP, it is estimated
that 12 MT CO2E would be emitted per year from refrigerant use.
Diesel Generators
To conservatively estimate stationary source emissions related to generator use, it was assumed a
new diesel-powered emergency generator would be required for back-up power at the NCPWF.
For the purposes of a conservative analysis, it was assumed the generator would be
approximately 750 kilowatts (approximately 1,000 HP). It was assumed generators would only
be used for emergency back-up power in the event of power outages, as well as for routine
testing and maintenance. CARB’s Airborne Toxic Control Measure for stationary diesel engines
restricts diesel engine operation for testing and maintenance to 50 hours per year, unless a diesel
particulate filter is used to reduce PM10 emissions (CARB 2011b). Thus, it was assumed that the

Greenhouse Gas Emissions Analysis for the North City Project
9420-04 89 September 2017
engines would operate up to 50 hours per year (1 hour per week, 50 weeks per year) for testing
and maintenance. Emission factors for CO2 and CH4 were obtained from the CalEEMod User’s
Guide, Appendix D for generators over 1,001 HP5 operating in 2022 (first year of Project
operation). Table 5.5-9 presents estimated annual GHG emissions associated with testing and
maintenance of emergency diesel generators.
Table 5.5-9
Estimated Annual Diesel Generators GHG Emissions
Emissions Source MT CO2 MT CH4 MT N2O MT CO2E Diesel Generators 19.04 0.00 0.00 19.11
Source: Appendix B Notes: MT CO2 = metric tons of carbon dioxide; MT CH4 = metric tons of methane; MT N2O = metric tons of nitrous oxide; MT CO2E = metric tons of carbon dioxide equivalent
Summary of GHG Emissions
Table 5.5-10 shows the San Vicente Reservoir Alternative total operational GHG emissions after
accounting for amortized construction emissions.
Table 5.5-10
Summary of Estimated Annual GHG Emissions
Emissions Source MT CO2 MT CH4 MT N2O MT CO2E Avoided Emissions
Grid Energy Use 44,087.86 1.77 0.38 44,244.70
San Vicente Reservoir Alternative
Mobile Sources 217.37 0.01 0.00 217.64
Electricity Consumption 34,148.31 2.98 0.09 34,248.30
Wastewater Process Emissions - 16.68 2.46 1,149.98
Refrigerant Use 12.41 0.00 0.00 12.41
Diesel Generators 19.04 0.00 0.00 19.11
Waste 10.36 0.61 0.00 25.66
Water 8.37 0.06 0.00 10.31
Amortized Construction Emissions - - - 362.78
Total Project Emissions 36,046.19 Net Change in Emissions (8,198.51)
Source: See Appendices B and C for complete results. Notes: MT CO2 = metric tons of carbon dioxide; MT CH4 = metric tons of methane; MT N2O = metric tons of nitrous oxide; MT CO2E = metric tons of carbon dioxide equivalent
5 The CalEEMod User’s Guide does not provide emission factors for generator sets rated at 751 to 1,000 HP;
however, the CO2 emission factor for generator sets rated at 501–750 HP and greater than 1,000 HP are the
same and the CH4 factor for the larger HP range is slightly higher than that for the smaller HP range.

Greenhouse Gas Emissions Analysis for the North City Project
9420-04 90 September 2017
Implementation of the Project, as analyzed at the Project level of analysis, would result in a net
decrease of approximately 8,199 MT CO2E per year as a result of offsetting the need for
imported water sources and grid energy demand.
5.6 Conflict with an Applicable Plan, Policy, or Regulation Adopted for the Purpose of Reducing the Emissions of Greenhouse Gases
For the purposes of discussing significance of GHG impacts, because the two alternatives are
similar in how they apply to the City of San Diego’s GHG significance criteria, they are
discussed together in this section.
As discussed in Section 4.2, the City of San Diego evaluates GHG significance based on a
project’s consistency with the City’s CAP using the CAP Consistency Checklist (see Appendix
D). Step 1 of the checklist determines the project’s consistency with the land use assumptions
used in the CAP. As discussed in Section 6.1, Land Use, of the Draft EIR/Environmental
Impact Statement (EIR/EIS), the Miramar Reservoir and San Vicente Reservoir components
are anticipated to be in conformance with adopted land use designations of applicable
community or general plans. See Section 6.1 for a description of the zoning and land use
designations for the Project components. According to the SANDAG 2050 Regional
Transportation Plan (RTP), the City of San Diego is projected to have 838,909 civilian jobs in
2020, 916,990 jobs in 2035, and 1,006,880 jobs in 2050 (SANDAG 2011). The North City
Project is expected to add up to 60 jobs between several proposed facilities in 2022. The City
of San Diego is expected to add 78,081 jobs between 2020 and 2035, or about 2,231 per year.
As such, the additional 60 jobs the North City Project would create would be within
SANDAG’s growth projections for the City of San Diego within the specified time frame.
Therefore, the North City Project would be consistent with the 2050 RTP, and the Alternatives
would be consistent with Step 1 of the CAP Checklist.
Step 2 of the checklist is not applicable to development projects that would not require a
certificate of occupancy from the Building Official; rather public projects are required to
implement best management practices for construction activities as set forth in the
GREENBOOK (for public projects). The City has created the WHITEBOOK, a supplement
which takes precedence over the specification language contained in the GREENBOOK and
addresses the unique conditions in the City that are not addressed in the GREENBOOK.
Mitigation measure MM-PU-1, which can be found in Section 6.15, Public Utilities, of the Draft
EIR/EIS, requires the Project to adhere to the requirements of Section 702 of the City’s
WHITEBOOK during construction with regards to the reduction of construction and demolition
waste. Step 2 only applies to those parts of the Project that require a certificate of occupancy.
Section 10-1 of the City’s WHITEBOOK implements the City Council Green Building Policy

Greenhouse Gas Emissions Analysis for the North City Project
9420-04 91 September 2017
900-14, which requires new or significantly remodeled City facilities to be designed and
constructed to achieve energy consumption levels at least 15% below the then current Title 24
standards. Also, it requires new construction projects over 5,000 square feet to obtain Leadership
in Energy and Environmental Design (LEED) Silver Rating Certification from the U.S. Green
Building Council. The following discussion outlines the North City Project’s applicability to
Step 2 of the CAP Consistency Checklist.
Strategy 1: Energy & Water Efficient Buildings.
1. Cool/Green Roofs
The North City Project would include a green roof on the NCPWF O&M building to help reduce
energy consumption and stormwater runoff that would meet the minimum requirements of this
section, weighing at least 25 pounds per square inch. The Project would answer Yes to this
checklist question.
2. Plumbing Fixtures and Fittings
This item requires nonresidential buildings to have plumbing fixtures and fittings that meet the
requirements under the CalGreen standard, Section A5.303.3. As the North City Project is
committed to achieving the LEED Silver Certification, one of the main components to the
projects design is water efficiency. The Project is designed to exceed the minimum flow rates in
the CalGreen standard. The Project would comply with this standard and would answer Yes to
the checklist question.
Strategy 2: Clean & Renewable Energy
3. Energy Performance Standard/Renewable Energy
This checklist question requires nonresidential projects to have an energy budget that exceeds
Title 24 standards with indoor lighting, mechanical systems, or through on-site renewable energy
generation. The North City Project includes a renewable energy facility that is powered by 90%
renewable LFG and 10% natural gas. The Miramar WTP also includes a solar photovoltaic
system that would completely cover its energy needs. The energy consumption for the Miramar
Reservoir Alternative would be met completely by the renewable energy facility. The San
Vicente Reservoir Alternative would still require approximately 4.6% of its power from
SDG&E. The Project would exceed the minimum requirement for this checklist item and would
answer Yes to the checklist question.

Greenhouse Gas Emissions Analysis for the North City Project
9420-04 92 September 2017
Strategy 3: Bicycling, Walking, Transit & Land Use
4. Electric Vehicle Charging
This checklist item requires nonresidential projects of a minimum size to install electric vehicle
charging stations at the project site. According to Table 4 of Attachment A of the CAP
Consistency Checklist, for industrial, manufacturing, or process plants or industrial parks,
electric vehicle charging stations are required for projects with 1,000 or more employees, 40
acres or more of land, or 650,000 square feet or more of gross floor area. The North City Project
does not meet any of those three criteria, so the answer to the checklist question would be N/A.
5. Bicycle Parking Spaces
This checklist question asks if the project would provide more short- and long-term bicycle
parking spaces than is required in the City’s Municipal Code (Chapter 14, Article 2, Division 5).
The code requires nonresidential developments to have 5% of the required automobile parking
available for bicycle parking spaces. As the North City Project is committed to achieving the
LEED Silver Certification, one of the main components of the Project’s design is centered
around location and transportation. The Project is designed to include bike parking in excess of
the City’s Municipal Code and locker rooms with showers for employees. The Project would
comply with this standard and would answer Yes to the checklist question.
6. Shower Facilities
This checklist question asks if the proposed development has over 10 employees and if a
shower/changing facility is incorporated into the design. The North City Project includes 10
showers in the men’s locker room and 8 showers in the women’s locker room. For a project with
11–50 employees, it is required to have 1 shower stall and 2 lockers. The Project exceeds the
requirement and would answer Yes to the checklist question.
7. Designated Parking Spaces
This checklist question asks if the project within a TPA provides designated parking for a
combination of low-emitting, fuel-efficient, and carpool/vanpool vehicles. The North City
Project is not located within a TPA and thus this question does not apply to the Project.
Therefore, the Project would answer N/A to this checklist question.
8. Transportation Demand Management Program
This checklist question asks if the project, if it accommodates over 50 employees includes a
transportation demand management program. The North City Project would participate in the

Greenhouse Gas Emissions Analysis for the North City Project
9420-04 93 September 2017
City’s Transportation Alternatives Program, which subsidizes vanpool, trolley, carpool, and
coaster usage as a traffic demand management function. The Project would meet the
requirements of this question and thus would answer Yes.
Step 3 of the checklist is only applicable if Step 1 is answered in the affirmative under option
three, which is not the case for the Alternatives, which answered Step 1 in the affirmative under
option one. Therefore, Step 3 is not applicable to the Alternatives.
The North City Project would be consistent with the City of San Diego’s CAP Checklist Steps 1
and 2 as discussed above; Step 3 would not apply to the Project. Accordingly, the Project is
consistent with the City’s CAP. In addition, the Project would assist the City in achieving the
CAP’s GHG emissions reduction targets by reducing the City’s reliance on imported water
supplies through the provision of a locally produced water supply. The following discussion
outlines the CAP strategies and how the project is consistent with them.
The City approved the CAP on December 15, 2015 (City of San Diego 2015a). The CAP
includes the following five strategies developed to reduce citywide GHG emissions and to
achieve reduction targets for the years 2020 and 2035:
1. Energy and Water Efficient Buildings
2. Clean and Renewable Energy
3. Bicycling, Walking, Transit & Land Use
4. Zero Waste (Gas & Waste Management)
5. Climate Resiliency
Each of the City’s CAP strategies includes goals to identify ways to reduce GHG emissions. The
Project’s consistency with the applicable strategies is discussed below.
Strategy 1: Energy and Water Efficient Buildings
The CAP’s first strategy is aimed at energy and water efficient buildings. The City’s goals under
strategy 1 include reducing residential building and municipal energy consumption, and reducing
daily per-capita water consumption. Actions to reduce energy consumption include consideration
of a residential Energy Conservation and Disclosure Ordinance and a Municipal Energy Strategy
and Implementation Plan. Actions related to water efficiency include implementing new water
rates and billing structure, consideration of a Water Conservation and Disclosure Ordinance, and
implementation of an Outdoor Landscaping Ordinance requiring weather-based irrigation
controllers. Strategy 1 actions are directed at City staff and City Council to adopt ordinances,
plans, and supporting City requirements to achieve the City’s targets.

Greenhouse Gas Emissions Analysis for the North City Project
9420-04 94 September 2017
The Project would support achievement of Strategy 1 by providing a less energy-intensive, domestic
water supply source for the region. Electricity is consumed, and associated GHG emissions are
generated, as a result of water supply, treatment, and distribution and treatment of wastewater
generated. The Project’s provision of a locally produced water supply would substantially reduce
energy consumption currently required for the import, supply, and conveyance of traditional
(imported) water sources. In addition, the Project would not conflict with the City’s ability to
implement the actions identified in the CAP related to energy- and water-efficient buildings. The
Project would be consistent with the applicable CAP goals and actions identified in Strategy 1.
Strategy 2: Clean and Renewable Energy
Strategy 2 focuses on clean and renewable energy. Strategy 2 goals of transitioning to 100%
renewable energy on the citywide electrical grid by 2035, increasing municipal zero-emissions
vehicles, and converting existing diesel municipal solid waste collection trucks to compressed
natural gas or other alternative low-emissions fuels would be implemented by the City and would
not apply to implementation of the Project.
The Project would include a renewable energy facility that would use 90% renewable LFG and
10% natural gas. The Project would also include a solar photovoltaic system that would completely
power the Miramar WTP. The North City Renewable Energy Facility power would completely
offset the power consumption needs of the Miramar Reservoir Alternative and would cover 95.4%
of the San Vicente Reservoir Alternative’s power consumption needs. Therefore, the Project would
support the City’s goal to increase use of renewable energy. In addition, the Project would not
conflict with the City’s ability to implement the actions identified in the Strategy 2.
Strategy 3: Bicycling, Walking, Transit & Land Use
Strategy 3 outlines goals and actions related to bicycling, walking, transit, and land use. Strategy
3 goals include increasing the use of mass transit, increasing commuter walking and bicycling
opportunities, reducing vehicle fuel consumption, and promoting effective land use to reduce
vehicle miles traveled.
The North City Project would include bicycle parking, shower facilities, and locker rooms. The
Project would also participate in the City’s Transportation Alternatives Program, which
subsidizes vanpool, trolley, carpool and coaster usage as a traffic demand management function.
Therefore, the Project would support the City’s strategy to reduce vehicle miles traveled. In
addition, the Project would not conflict with the City’s ability to implement the actions identified
in the Strategy 3.

Greenhouse Gas Emissions Analysis for the North City Project
9420-04 95 September 2017
Strategy 4: Zero Waste (Gas & Waste Management)
Strategy 4, which focuses on zero waste, includes the goal of diverting solid waste, capturing
landfill CH4 gas emissions, and capturing CH4 gas from wastewater treatment.
Both Strategy 4 goals would be implemented by various City departments, and the Project
would not conflict with implementation of the actions required to meet the City’s targets. In
addition, the Project would capture CH4 gas during wastewater treatment. Furthermore, the
Project would comply with the goal of diverting 75% of the solid waste by 2020 consistent
with statewide goals. The Project would be consistent with the applicable CAP goals and
actions identified in Strategy 4.
Strategy 5: Climate Resiliency
The fifth and last strategy relates to climate resiliency and includes the goal of increasing tree
canopy coverage. The action under this goal includes consideration of a citywide Urban Tree
Planting Program, which would incorporate water conservation measures and prioritization of
drought-tolerant and native trees and plantings in areas with recycled water.
The intent of the Project is to avoid or minimize all potential impacts to trees and sensitive
vegetation communities where possible. However, minimal vegetation removal may occur
during construction of the Project components. As discussed in Section 6.4, Biological
Resources, of the Draft EIR/EIS, potential temporary and permanent impacts to sensitive upland
vegetation communities will be mitigated per the mitigation ratios outlined in Chapter 10 of the
Draft EIR/EIS. Based on the site plans, the Project does not include the specific removal of any
trees and would avoid or minimize disturbance of existing trees to the extent feasible. The
Project does include additional planting of canopy trees and other vegetation that would support
this strategy. Moreover, the Project would not conflict with the City’s actions to increase tree
canopy coverage through a planting program and supporting measures. Strategy 5 of the CAP is
not directly applicable to the Project; however, the Project would not conflict with the City’s
actions to implement Strategy 5.
The Project would not conflict with the CAP strategies applicable to the Project and would not
impede the City’s ability to implement the actions identified in the CAP to achieve the CAP’s
goals and targets and associated GHG emission reductions. As such, the Project would comply
with, and support the goals and policies of, the City’s CAP, as well as those of the General Plan
(CE-A.2, CE-A.8, CE-A.9, CE-F.3, CE-I.4, and CE-I.5). Therefore, the Project would not have a
significant impact.
The North City Project’s GHG emissions would not have a significant cumulative impact on
the environment.

Greenhouse Gas Emissions Analysis for the North City Project
9420-04 96 September 2017
5.7 NEPA Considerations
As shown in Tables 5.5-5 and 5.5-10, the estimated operational GHG emissions for the Miramar
Reservoir and San Vicente Reservoir Alternatives do exceed the 25,000 MT CO2E per year
threshold, mainly due to the North City Renewable Energy Facility. The projects would be
required to implement mitigation measures MM-AQ-1, MM-AQ-2, and MM-AQ-3 in addition to
following applicable SDAPCD Rules and Regulations. For these reasons, the Miramar Reservoir
and San Vicente Reservoir Alternative operational GHG emissions would result in a substantial
adverse effect related to the generation of GHG emissions.

Greenhouse Gas Emissions Analysis for the North City Project
9420-04 97 September 2017
6 REFERENCES
14 CCR 15000–15387 and Appendices A–L. Guidelines for Implementation of the California
Environmental Quality Act, as amended.
74 FR 56260–56373. Final rule: Mandatory Reporting of Greenhouse Gases. October 30, 2009.
75 FR 25324-25728.Final rule: “Light-Duty Vehicle Greenhouse Gas Emission Standards and
Corporate Average Fuel Economy Standards.” May 7, 2010.
77 FR 62623-63200. Final rule: “2017 and Later Model Year Light-Duty Vehicle Greenhouse
Gas Emissions and Corporate Average Fuel Economy Standards.” October 15, 2012.
80 FR 64510–64660. Final rule: “Carbon Pollution Emission Guidelines for Existing Stationary
Sources: Electric Utility Generating Units.” October 23, 2015.
80 FR 64661–65120. Final rule: Standards of Performance for Greenhouse Gas Emissions from
New, Modified, and Reconstructed Stationary Sources: Electric Utility Generating
Units.” October 23, 2015.
Brown and Caldwell. 2012. Recycled Water Study. Prepared for City of San Diego. July 2012.
Brown and Caldwell. 2015. 10% Engineering Design Report, North City Plant to San Vicente
Pipeline. June 2015.
Brown and Caldwell. 2016. Basis of Design Report North City Conveyance System. August 2016.
C2ES (Center for Climate and Energy Solutions). 2014. President Obama’s Climate Action
Plan: One Year Later. June. Accessed December 2016. http://www.c2es.org/
docUploads/climate-action-plan-one-year-later-7-15-14.pdf.
C2ES. 2016. Achieving the United States’ Intended Nationally Determined Contribution.
November. Accessed December 2016. http://www.c2es.org/docUploads/achieving-us-
indc-nov-2016.pdf.CalRecycle (California Department of Resources, Recycling and
Recovery). 2015. AB 341 Report to the Legislature. August 2015.
CARB (California Air Resources Board). 2008. Climate Change Proposed Scoping Plan: A
Framework for Change. October 2008; approved December 12, 2008.
http://www.arb.ca.gov/cc/scopingplan/document/psp.pdf.

Greenhouse Gas Emissions Analysis for the North City Project
9420-04 98 September 2017
CARB, California Climate Action Registry, ICLEI - Local Governments for Sustainability, and The
Climate Registry. 2010. “Local Government Operations Protocol – For the Quantification
and Reporting of Greenhouse Gas Emissions Inventories.” Version 1.1. May 2010.
http://www.arb.ca.gov/cc/protocols/localgov/pubs/lgo_protocol_v1_1_2010-05-03.pdf.
CARB. 2011a. Final Supplement to the AB 32 Scoping Plan Functional Equivalent Document. August
19, 2011. Accessed March 6, 2017. https://www.arb.ca.gov/cc/scopingplan/document/
final_supplement_to_sp_fed.pdf.
CARB. 2011b. Final Regulation Order – Amendments to the Airborne Toxic Control Measure for
Stationary Compression Ignition Engines. Accessed April 2015. http://www.arb.ca.gov/
diesel/documents/FinalReg2011.pdf.
CARB. 2012. “News Release: California Air Resources Board Approves Advanced Clean Car
Rules.” January 27, 2012. Accessed October 2016. https://www.arb.ca.gov/newsrel/
newsrelease.php?id=282.
CARB. 2014a. 2013 Building Energy Efficiency Standards for Residential and Nonresidential
Buildings. Revised July 1, 2014. Accessed October 2016. http://www.energy.ca.gov/
2012publications/CEC-400-2012-004/CEC-400-2012-004-CMF-REV2.pdf.
CARB. 2014b. First Update to the Climate Change Scoping Plan: Building on the Framework.
May 2014. http://www.arb.ca.gov/cc/scopingplan/2013_update/first_update_
climate_ change_scoping_plan.pdf.
CARB. 2015. “Glossary of Terms Used in Greenhouse Gas Inventories.” Last updated May 6,
2015. Accessed February 27, 2017. https://www.arb.ca.gov/cc/inventory/faq/
ghg_inventory_glossary.htm.
CARB. 2016. California Greenhouse Gas Emission Inventory – 2016 Edition. June. Accessed
November 2016. https://www.arb.ca.gov/cc/inventory/data/data.htm.
CARB. 2017. The 2017 Climate Change Scoping Plan Update—The Proposed Strategy for
Achieving California’s 2030 Greenhouse Gas Target. January 20, 2017. Accessed February
27, 2017. https://www.arb.ca.gov/cc/scopingplan/2030sp_pp_final.pdf.
CAT (California Climate Action Team). 2006. Final 2006 Climate Action Team Report to the
Governor and Legislature. Sacramento, California: CAT. March 2006.

Greenhouse Gas Emissions Analysis for the North City Project
9420-04 99 September 2017
CAT. 2010a. Climate Action Team Report to Governor Schwarzenegger and the California
Legislature. Sacramento, California: CAT. December 2010. Accessed February 2014.
http://www.energy.ca.gov/2010publications/CAT-1000-2010-005/CAT-1000-2010-005.PDF.
CAT. 2010b. Climate Action Team Biennial Report. California Environmental Protection Agency,
Climate Action Team. April 2010. Accessed October 2016. http://www.energy.ca.gov/
2010publications/CAT-1000-2010-004/CAT-1000-2010-004.PDF.
CEC (California Energy Commission). 2014. 2013 Building Energy Efficiency Standards for
Residential and Nonresidential Buildings. Revised July 1, 2014. Accessed October 2016.
http://www.energy.ca.gov/2012publications/CEC-400-2012-004/
CEC-400-2012-004-CMF-REV2.pdf.
CEC. 2015. 2016 Building Energy Efficiency Standards Frequently Asked Questions. Accessed
October 2016. http://www.energy.ca.gov/title24/2016standards/rulemaking/documents/
2016_Building_Energy_Efficiency_Standards_FAQ.pdf.
CEQ (Council on Environmental Quality). 2016. Final Guidance for Federal Departments and
Agencies on Consideration of Greenhouse Gas Emissions and the Effects of Climate
Change in National Environmental Policy Act Reviews. August 1. Accessed November
2016. https://www.whitehouse.gov/sites/whitehouse.gov/files/documents/
nepa_final_ ghg_guidance.pdf.
City of San Diego. 2008. “Conservation Element.” In City of General Plan 2008. March 10,
2008. Accessed November 2016. https://www.sandiego.gov/planning/genplan#genplan.
City of San Diego. 2015a. City of San Diego General Plan 2008. Adopted March 10, 2008.
Amended June 29, 2015. Accessed November 2016. https://www.sandiego.gov/
planning/genplan#genplan.
City of San Diego. 2015b. City of San Diego Climate Action Plan. Adopted December 2015.
http://www.sandiego.gov/planning/genplan/cap/pdf/sd_cap_032515_draft.pdf.
City of San Diego. 2015c. Sewer Design Guide. City of San Diego, Public Utilities
Department. May 2015.
City of San Diego. 2016a. California Environmental Quality Act, Significance Determination
Thresholds. Revised July 2016. San Diego, California: City of San Diego, Development
Services Department. Accessed November 2016. https://www.sandiego.gov/sites/default/
files/july_2016_ceqa_thresholds_final_0.pdf.

Greenhouse Gas Emissions Analysis for the North City Project
9420-04 100 September 2017
City of San Diego. 2016b. “Transit Priority Areas” [map].EOP (Executive Office of the
President). 2013. The President’s Climate Action Plan. June. Accessed December 2016.
https://www.whitehouse.gov/sites/default/files/image/ president27sclimateactionplan.pdf.
EPA (U.S. Environmental Protection Agency). 2010. EPA and NHTSA Finalize Historic
National Program to Reduce Greenhouse Gases and Improve Fuel Economy for Cars
and Trucks. Regulatory Announcement. Office of Transportation and Air Quality. EPA-
420-F-10-014. April. http://www.epa.gov/oms/ climate/regulations/420f10014.pdf.
EPA. 2011. Final Rulemaking: Light-Duty Vehicle Greenhouse Gas Emissions Standards and
Corporate Average Fuel Economy Standards. Regulations and Standards–Vehicles and
Engines. Last updated February 2011. http://www.epa.gov/otaq/climate/regulations.htm.
EPA.2015. “Inventory of U.S. Greenhouse Gas Emissions and Sinks: 1990–2013.” EPA 430-R-
15-004. April 15, 2015. Accessed March 8, 2017. https://www3.epa.gov/climatechange/
Downloads/ghgemissions/US-GHG-Inventory-2015-Main-Text.pdf.
EPA. 2016. “Glossary of Climate Change Terms.” Last Updated August 9, 2016. Accessed March 8,
2017. https://www3.epa.gov/climatechange/glossary.html#R.
IPCC (Intergovernmental Panel on Climate Change). 1995. Climate Change 1995: IPCC Second
Assessment Report. Accessed October 2016. http://www.ipcc.ch/pdf/climate-changes-
1995/ipcc-2nd-assessment/2nd-assessment-en.pdf.
IPCC. 2007. “Summary for Policymakers.” In Climate Change 2007: The Physical Science
Basis, edited by S. Solomon, D. Qin, M. Manning, Z. Chen, M. Marquis, K.B. Averyt, M.
Tignor, and H.L. Miller, 1–18. A report of Working Group I of the IPCC. New York,
New York: Cambridge University Press. Accessed October 2016. http://www.ipcc.ch/
pdf/assessment-report/ar4/wg1/ar4-wg1-spm.pdf.
IPCC. 2014. Climate Change 2014: Synthesis Report. Accessed October 2016.
http://www.ipcc.ch/pdf/assessment-report/ar5/syr/SYR_AR5_FINAL_full.pdf.
OPR (Governor’s Office of Planning and Research). 2008. Technical Advisory – CEQA and
Climate Change: Addressing Climate Change through California Environmental Quality
Act (CEQA) Review.
OPR. 2016. Global Climate Leadership Memorandum of Understanding (MOU). Accessed
October 2016. http://under2mou.org/wp-content/uploads/2015/04/
Under-2-MOU-English.pdf.

Greenhouse Gas Emissions Analysis for the North City Project
9420-04 101 September 2017
NRA (National Resources Agency). 2014. Safeguarding California: Reducing Climate Risk. July
31. Accessed December 2016. http://resources.ca.gov/docs/climate/
Final_Safeguarding_ CA_Plan_July_31_2014.pdf.
NRDC (Natural Resources Defense Council). 2004. Energy Down the Drain, The Hidden Costs
of California’s Water Supply. August. Accessed January 2017.
https://www.nrdc.org/sites/default/files/edrain.pdf.
Qiancheng, Ma. 1998. National Aeronautics and Space Administration Science Briefs –
Greenhouse Gases: Refining the Role of Carbon Dioxide. Available at:
http://www.giss.nasa.gov/research/briefs/ma_01/.
SANDAG (San Diego Association of Governments). 2011. 2050 Regional Transportation Plan.
October 2011. Accessed January 2017. http://www.sandag.org/uploads/2050RTP/
F2050rtp_all.pdf.
SANDAG. 2015. San Diego Forward: The Regional Plan. October 2015. Accessed October
2016. http://www.sandag.org/index.asp?projectid=349&fuseaction=projects.detail.
The Climate Registry. 2016. Default Emission Factors. April 19. Accessed January 2017.
https://www.theclimateregistry.org/wp-content/uploads/2014/11/2016-Climate-Registry-
Default-Emission-Factors.pdf.
MWH, Brown and Caldwell, and Trussell Technologies Inc. 2016. Task 3: North City Pure
Water Facility (MR) (NC03B) 30% Engineering Design Report, Appendix B-1: General
Plant Flow and Mass Balance. October 10, 2016.
Greenhouse Gas Emissions Analysis for the North City Project
9420-04 102 September 2017
INTENTIONALLY LEFT BLANK

APPENDIX A
CalEEMod Outputs and Estimated Emissions
for the Miramar Reservoir Alternative


APPENDIX B
CalEEMod Outputs and Estimated Emissions
for the San Vicente Reservoir Alternative

APPENDIX C
North City Renewable Energy
Facility Air Modelling Analysis
and Health Risk Assessment Report


APPENDIX D
City of San Diego Climate Action Plan
Consistency Checklist Submittal Application
