green star - multi unit residential v1 green house gas ... star – multi unit... · date issued:...
TRANSCRIPT

Green Star Multi unit reSidential v1 Green HouSe GaS eMiSSionS Guide July 2009
1Date Issued: July 2009
EXECUTIVE SUMMARYResidential and commercial buildings in Australia are responsible for 23 per cent of the nation’s greenhouse gas emissions. As buildings make such a significant contribution to greenhouse gas emissions, the energy category in the Green Star – Multi Unit Residential v1 tool has the highest weighting of 25%. The majority (20 of 26) of the points available in the energy category are awarded in the credit Ene-1 ‘Greenhouse Gas Emissions’. A calculator is used to determine the number of points awarded in this credit.
The calculator estimates the greenhouse gas emissions from the assessed building and compares these to the emissions from a benchmark building. Points are awarded when the greenhouse gas emissions from the assessed building are lower than those from the benchmark building. Up to 20 points are awarded for reductions; one point is awarded for every 5% reduction of greenhouse gas emissions. This means that 20 points are awarded when zero greenhouse gas emissions are during operation of the building.
The greenhouse gas emissions from the benchmark building represent the amount emitted from a building with a conventional design from an energy efficiency perspective – in other words, standard practice. The benchmark building complies with the legislated minimum energy efficiency performance in the Building Code of Australia 2008 (BCA) Section J. The efficiency of the building components not covered in the BCA is established to represent standard practice.
The greenhouse gas emissions from the operation of a building depend on the thermal performance of the building fabric, the efficiency and the fuel choices for the building services and amenities provided. All these aspects of the building are assessed in the calculator. Improvements in either of these areas will improve the score in the energy category.
This document provides comprehensive guidance on the following topics:
Instructions for how the calculator should be used;•Calculation requirements for inputs to the Calculator;•The characteristics of the benchmark building; and•The documentation required to demonstrate compliance.•

2Date Issued: July 2009
TABLE OF CONTENTS1.0 INTRODUCTION 5
2.0 HOW TO USE THE GREENHOUSE GAS EMISSIONS CALCULATOR 7
2.1 THE ‘BUILDING LOCATION AND GREENHOUSE GAS EMISSIONS FACTORS’ SECTION 8
2.2 THE ‘BUILDING DETAILS (USED TO ESTABLISH THE PROJECT SPECIFIC BENCHMARK)’ SECTION 9
2.3 THE ‘ENERGY CONSUMPTION AND ONSITE GENERATION’ SECTION 10
2.4 THE ‘RESULTS SUMMARY’ SECTION 16
2.5 THE ‘POINTS SCORE CALCULATION’ SECTION 17
3.0 GUIDELINES FOR CALCULATING THE INPUTS TO THE GREENHOUSE GAS EMISSIONS CALCULATOR 18
3.1 DWELLING THERMAL PERFORMANCE 18
3.2 HEATING VENTILATION AND AIR-CONDITIONING (HVAC) 19
3.3 LIGHTING 23
3.4 HOT WATER 24
3.5 MECHANICAL EXHAUST 27
3.6 LIFTS 30
3.7 POOLS, SPAS AND SAUNAS 32
3.8 COOKING 33
3.9 OTHER ENERGY CONSUMPTION 34
3.10 ON-SITE ELECTRICITY GENERATION 35
BIBLIOGRAPHY 36
APPENDIX A – SPACE TYPE DEFINITIONS 38
APPENDIX B –DYNAMIC SIMULATION GUIDELINES 40
APPENDIX C – HVAC INTERNAL LOADS, SETPOINTS AND APERTURE SCHEDULES 45
APPENDIX D - PROTOCOL FOR CALCULATING LIGHTING ENERGY REDUCTION DUE TO DAYLIGHT DIMMING 53
APPENDIX E – THE GREEN STAR – MULTI UNIT RESIDENTIAL V1 ENERGY BENCHMARKS 57
APPENDIX F – GREENHOUSE GAS EMISSIONS FACTORS 77
APPENDIX G – DOCUMENTATION REQUIREMENTS 79

3Date Issued: July 2009
LIST OF TABLESTable 1: Servicing strategy & modelling requirements 19Table 2: Percentage of cooling load met across Australia 22Table 3: Hours of operation per year to be assumed for each space type 23Table 4: Hours of operation per year to be assumed for each space type 24Table 5: Assumed occupancy for each apartment type 28Table 6: Car park ventilation profiles 29Table 7: Definition of parameters used to calculate the energy consumption of a lift 31
Table 8: Type of cooktops and ovens 33
Table 9: HVAC Modelling Parameters 41
Table 10: Building envelope parameter 42
Table 11: HVAC Internal Loads 42
Table 12: A/C Pumping parameter 43
Table 13: HVAC System Stimulation parameter 43
Table 14: HVAC Controls 44
Table 15: Internal heat loads, and heating and cooling setpoints - for living spaces, including kitchens (ABCB, 2006) 47
Table 16: Internal heat loads, and heating and cooling setpoints - for living spaces that do not include a kitchen
(ABCB, 2006) 48
Table 17: Internal heat loads, and heating and cooling setpoints - for bedrooms (ABCB, 2006) 49
Table 18: Internal heat loads, and heating and cooling setpoints - for foyers, lobbies, hallways and corridors areas
(not part of a private dwelling) 50
Table 19: Cooling setpoints for each NatHERS climate zone (ABCB, 2006) 51
Table 20: Diffuse horizontal Illuminance values for each climate zone 55
Table 21: Summary of Benchmarks 59
Table 22: Assumed occupancy for each apartment type 60
Table 23: Standard area for each apartment type 61
Table 24: Assumptions for standard areas of all space types apart from dwellings 61
Table 25: Ratio of heating to cooling loads for each NatHERS climate zone 63
Table 26: Parameters used to determine the lighting benchmarks 65
Table 27: Hot water benchmarks 67
Table 28: Calculation of annual hot water demand per person 68
Table 29: Fan flow variation with CO monitoring and VSD fans for car park ventilation 70
Table 30: Definition of parameters used to calculate the energy consumption of a lift 71
Table 31: Energy Consumption per cook top 75
Table 32: Summary of E(Standard) for each cooking system type 76
Table 33: Greenhouse Gas Emissions Factors for all states and territories in Australia 78

4Date Issued: July 2009
Tool Version Revision Date Issued
Green Star – Multi Unit Residential v1 Green House Gas Emissions Guide
– ReleaseA July 2009

5Date Issued: July 2009
1.0 – INTROdUCTIONThe Green Star – Multi Unit Residential v1 Ene-1: Greenhouse Gas Emissions credit awards building fabric thermal performance, building services, amenity provisions and fuel choices, that minimise the greenhouse gas emissions resulting from the operation of the proposed development.
The number of points that can be claimed under this credit is determined by the Green Star – Multi Unit Residential v1 Greenhouse Gas Calculator [“the calculator”]. The calculator does this by calculating, and then comparing, the greenhouse gas emissions from the proposed development with those from a ‘benchmark building’. For each 5% reduction on the benchmark emissions, one point is awarded, up to a maximum of 20 points for a 100% reduction.
The main attributes of the benchmark building are as follows:
• Thebenchmarkbuilding’sthermalperformance isequal tothatrequiredfortheGreenStar–MultiUnitResidentialv1EnergyConditional Requirement (10% improvement on the regulated thermal performance standard in the relevant jurisdiction);
• Wherepossibletheefficienciesofthebuildingserviceshavebeenbasedonthedeemed-to-satisfyprovisionsoftheBuildingCodeof Australia, current at the time of developing this tool (BCA 2008). Where no minimum standards are regulated, standard practice was established through consultation with industry;
• Thebenchmarkbuildinghasoneunheatedswimmingpoolandhaselectriccookingfacilitiesinstalledinalldwellings;and• Theareasofeachspacetypeinthebenchmarkbuildingarebasedontheareasandoccupancy(basedonnumberofbedrooms)of
the proposed development.
For a full description of the benchmark building, including its physical attributes and building services efficiencies, as well as the assumptions used to establish these figures, see Appendix E – The Green Star – Multi Unit Residential v1 Energy Benchmarks.
This methodology, and the attributes and services efficiencies of the ‘benchmark building’ were developed by the Green Star Tool Development team in conjunction with the Green Star – Multi Unit Residential v1 Technical Working group, with the advice of specialist service engineers where appropriate.
How the Multi Unit Residential v1 – Greenhouse Gas Emissions calculator works:
The calculator estimates the greenhouse gas emissions from the proposed development, by multiplying the energy consumption figures (gas/ electricity/bio-fuel etc), calculated by the design team, by the greenhouse gas emissions factors appropriate for the development’s location. The greenhouse gas emission factors used are from the Australian Government’s National Greenhouse Accounts (NGA) Factors workbook (DCC, 2008);, see Appendix F – Greenhouse Gas Emissions Factors for further details.
It also calculates the greenhouse emissions associated with the benchmark building. The benchmark building’s energy consumption is dependent on the size and occupancy of the proposed development. The energy consumption of this benchmark building is then multiplied by the appropriate emissions factors.
The calculator then compares the proposed development’s per capita emissions to the benchmark per capita emissions. For each 5% reduction on the benchmark emissions, one point is awarded, up to a maximum of 20 points for a 100% reduction.

6Date Issued: July 2009
How this guide is structured:
Chapter 2: How to use the Greenhouse Gas Emissions Calculator, explains:
• WhatinformationisrequiredtobeenteredintheGreenStar–MultiUnitResidentialv1GreenhouseGasEmissioncalculator;and
• HowtheGreenStar–MultiUnitResidentialv1GreenhouseGasCalculatorestablisheswhichpointscanbeclaimed.
Chapter 3: Guidelines for calculating , explains item by item (eg: lighting, HVAC, cooking etc.):
• HowtocalculatetherequiredinputsfortheGreenStar–MultiUnitResidentialv1GreenhouseGasEmissionscalculator;and• Whatbenchmarkfiguresthedevelopmentwillbecomparedagainstandhowthesebenchmarkswereestablished.
This document also contains a number of appendices which provide:
• Supplementaryinformationrequiredtocalculatethecalculatorinputs(theseappendicesarereferencedinChapter3).Theseappendices include guidance on how to undertake dynamic simulation (for the purposes of this credit), operational schedules, space type definitions etc.
• Detailsofhowthebenchmarkfigureswerederived;• Documentationrequirements;and• Thegreenhousegasemissionsfactorsusedinthecalculator.
Note:
It should be noted that the estimates of energy consumption and greenhouse gas emissions from the proposed and benchmark buildings are only applicable for determining number of points that can be claimed, under the Green Star – Multi Unit Residential v1 Ene-1 Greenhouse Gas Emissions credit. The estimates are not predictions of actual energy consumption or greenhouse gas emission. This is because:1. Project teams are required to use a number of standard assumptions when calculating energy use, such as standard occupancy
patterns and weather conditions, to allow for a level playing field when comparing against the benchmark building. In reality, occupancy patterns, weather conditions and the effectiveness of how the building is operated and maintained will vary. This will affect the energy consumed. A number of these issues, are, however considered in other credits.
2. There are additional energy uses which are not captured by this credit, such as the resident’s consumer goods. Therefore the actual energy consumed will differ from the estimations made for this credit. The energy consumption from a number of these items are, however, considered in other credits.
3. The Green Star – Multi Unit Residential v1 Greenhouse Gas Emissions calculator is a simplified approach to estimating greenhouse gas emissions.
Also, please note that benchmark figures presented have been rounded so discrepancies may occur between sums of the component items and totals.

7Date Issued: July 2009
2.0 – HOW TO USE THE GREENHOUSE
GAS EMISSIONS CALCULATOR
This chapter explains what needs to be entered where in the Green Star – Multi Unit Residential v1 Greenhouse Gas Emissions Calculator. It also explains how the calculator establishes which points can be claimed. For information on how each parameter is calculated, please refer to Chapter 3.0: Guidelines for calculating the inputs to the Greenhouse Gas Emissions Calculator.
The calculator is divided into five sections, as is this chapter:
1. Building location and greenhouse gas emissions factors;2. Building details (used to establish the project specific benchmark);3. Energy consumption and onsite generation;4. Results summary; and5. Points score calculation.
Data is required to be entered by the user into all white fields; all coloured cells are for information only as shown in the screen shot of the first few rows of the calculator. The correct score will only be displayed when all fields are complete.
All white cells are data entry cells. They either require a figure to be entered, or a selection to be made from a drop down list.
All turquoise cells report back information about the proposed development.
All black cells report back information about the benchmark development.
Figure 1: Number of Points Achieved

8Date Issued: July 2009
2.1 – THE ‘BUILdING LOCATION ANd GREENHOUSE GAS EMISSIONS FACTORS’ SECTION
This section presents the greenhouse gas emission factors used for the proposed and benchmark buildings for grid electricity, gas, liquefied petroleum gas (LPG), diesel, coal, solid biomass and liquid biofuel. The emissions factors used are from the Australian Government’s National Greenhouse Accounts (NGA) factors (DCC, 2008). Further details of the emissions factors used can be found in Appendix F – Greenhouse Gas Emissions Factors.
The emissions factors for electricity and gas vary depending on state/territory, hence the development’s location must be correctly entered in the ‘Building Input’ sheet
The greenhouse gas emissions factors for the proposed and benchmark developments are displayed here.
Figure 2: Building Location and Greenhouse Gas Emissions Factors

9Date Issued: July 2009
2.2 – THE ‘BUILdING dETAILS (USEd TO ESTABLISH THE PROJECT SPECIFIC BENCHMARK)’ SECTION
The data entered in this section is used to determine the dimensions and attributes of the benchmark development. This data define the benchmark energy consumption and resulting greenhouse gas emissions.
See the Summary of benchmarks section in Appendix E, for further details on how this information is used to determine the benchmark.
Enter number and type of dwellings. This is used to establish the occupancy which is presented on the right.
Enter number and maximum distance of travel for each type of lift in the development. If the development has no lifts, leave this section blank.
Up to three types of lift can be entered, if the development has more types, please contact the GBCA for a tailored spreadsheet.
Enter total area of each space type and linear length of external lit walkways. For further information refer to Appendix A – Space type definitions.
The thermal performance requirement and NatHERS climate zone are imported automatically from the Ene-Con Calculator.
These parameters are required for the calculation of the benchmark HVAC energy consumption. The Ene-Con Calculator must be therefore be completed before the GHG Emissions CalculatorFigure 3: Building details

10Date Issued: July 2009
2.3 – THE ‘ENERGY CONSUMPTION ANd ONSITE GENERATION’ SECTION
This section is where the energy consumed by all the systems in the building should be entered (electricity, gas and other fuels). In the cases of the HVAC and cooking systems, a description of the system can be entered, and the Excel tool will estimate the energy consumed. Finally, details of any onsite generation of electricity can also be entered.
With this information, the calculator estimates the greenhouse gas emissions associated with heating, ventilation and air-conditioning (HVAC); lighting; hot water; lifts; kitchen oven/cooktops; pool, spa and sauna; and any other energy uses that would reasonably be considered significant in an energy model, such as a water recycling treatment plant, or escalators and travelators.
This section is divided into seven sub-sections:
1. Dwelling thermal performance;2. Heating, ventilation and air conditioning;3. Lighting;4. Hot water;5. Mechanical ventilation, lifts and other amenities;6. Cooking; and7. Electricity generation
1. Dwelling thermal performance
There are no data entry cells in this part of the Excel tool. All values are imported automatically from the Ene-Con Calculator. The information is presented for information only.
Figure 4: Energy Consumption and Onsite GenerationThe benchmark heating and cooling loads presented here are derived from the total benchmark dwelling thermal performance (which is imported from the Ene-Con Calculator in the previous section of the Excel tool). The proportion of the total load that is assumed to be heating load and the proportion that is assumed to be cooling, depends on the development’s NatHERS climate zone.
For details on how the total load is apportioned into heating and cooling loads, see Appendix E, the HVAC Benchmark section.
The area-weighted heating, cooling and total dwelling thermal loads are imported automatically from the Ene-Con Calculator.
It is therefore important that the Ene-Con calculator is completed prior to the Ene-GHG Emissions Calculator.

11Date Issued: July 2009
2. Heating, ventilation and air conditioning (HVAC);
There are three ways in which the HVAC energy consumption for the development can be calculated. The method that should be used by a particular development will depend on the development’s HVAC servicing strategy; full details can be found in 3.2: Heating ventilation and air-conditioning (HVAC). In summary, the three options are:
1. Dynamic simulation is undertaken for all non-dwelling and dwelling areas;2. Dynamic simulation is undertaken for non-dwelling areas only along with dwelling the energy performance information is required
to be entered.3. No dynamic simulation is required to be undertaken, Dwelling HVAC energy performance information is required to be entered.
The project team must first select which of the three ways is being used for the development with the drop down box shown below:
Figure 5: Heating Ventilation and Air Conditioning
Select how the HVAC energy consumption has been established for the development.

12Date Issued: July 2009
Option 1: Dynamic simulation is undertaken for all non-dwelling and dwelling areas
Option 2: Dynamic simulation has been undertaken for non-dwelling areas only (no central HVAC system is provided to dwellings)
The HVAC energy consumed by the non-dwelling areas should be entered as follows.
Figure 6: Dynamic simulation has been undertaken for all non-dwelling and dwelling loads
Figure 7: Dynamic simulation has been undertaken for non-dwelling areas only
Projects must indicate the percentage of dwellings that have been providing with heating and cooling. Depending on the heating and cooling loads, the calculator will assign an additional energy load to account for individuals installing their own heating and cooling systems.
Greenhouse gas emissions will be calculated based on the HVAC energy consumption. If cogeneration and trigeneration systems are used in the project, the energy consumption must be included in this area.
Project must select the relevant fuel type used for this system
Depending on the heating and cooling loads, the calculator will assign an additional energy load to account for individuals installing their own heating and cooling systems.
Greenhouse gas emissions will be calculated based on the HVAC energy consumption. If cogeneration and trigeneration systems are used in the project, the energy consumption must be included in this area.

13Date Issued: July 2009
Option 3: No dynamic simulation has been undertaken for this project (no central HVAC system provided to dwellings and not conditioning).
Details of the dwelling HVAC systems can then be entered as described under Option 3. The Green Star – Multi Unit Residential v1 Greenhouse Gas Energy Calculator uses this information, along with the dwelling thermal performance information entered in the previous section, to estimate the energy consumed by these systems.
Where individual systems have been installed in each unit, the project must add this information on the calculator. It will then create the relevant benchmarks based on the entered data. Should the project require more lines, please contact the GBCA
Figure 8: No dynamic Simulation

14Date Issued: July 2009
3. LightingAnnual energy consumption is entered into this section of the calculator. The information must be provided in kWh/yr.
4. Hot waterBefore the energy calculator can complete the calculation of hot water consumption, the potable water calculator must be filled in. This is to account for the energy savings accrued by the use of water efficient showers and taps.
Figure 9: Lighting
Figure 10: Hot Water

15Date Issued: July 2009
5. Mechanical ventilation, lifts and other amenitiesThe electricity consumption of all amenities must be taken into account. Note that the benchmark development accounts for a pool to be included within. Sauna and Spa are not included within the benchmark.
7. Electricity generation.
6. Cooking; and
Figure 11: Mechanical Ventilation, lifts and other benchmarks
Figure 12: Cooking
Figure 13: Electricity generation
Project can input the electricity generation for renewables and co-generation systems. Please note that gas from co-gen systems is accounted for in the HVAC section

16Date Issued: July 2009
2.4 – THE ‘RESULTS SUMMARY’ SECTION
This section presents a summary of grid electricity, gas and other fuel consumption from the modelled and benchmarked buildings along with the associated greenhouse gas emissions.
The greenhouse gas savings are calculated as follows:GHG savings = TOTAL Benchmark GHG emissions – TOTAL Facility GHG emissions
The percentage reduction of GHG emissions compared to the Standard Practice Benchmark is calculated as follows:
% Reduction = (TOTAL Benchmark GHG emissions – TOTAL Facility GHG emissions) x 100
TOTAL Benchmark GHG emissions
Figure 14: Summary of Energy Consumption

17Date Issued: July 2009
2.5 – THE ‘POINTS SCORE CALCULATION’ SECTION
This table displays the maximum greenhouse gas emissions that can be emitted by the development to achieve the Green Star points. The percentage calculated in the previous section is used to determine the number of points achieved by the facility. The number of points is displayed below
Figure 15: Point score calculation

18Date Issued: July 2009
This chapter provides guidance on how to calculate the development’s energy consumption and on-site generation, for entry into the Green Star – Multi Unit Residential v1 Greenhouse Gas Emissions Calculator.
3.0 – GUIdELINES FOR CALCULATING THE INPUTS TO THE GREENHOUSE GAS EMISSIONS CALCULATOR
3.1 – dWELLING THERMAL PERFORMANCE
The area-weighted average heating load (MJ/m2/yr) and the area-weighted average cooling load (sensible + latent) (MJ/m2/yr) required by the calculator are linked to the outputs of the Ene-Con Calculator excel spreadsheet in the Green Star – Multi Unit Residential v1 Excel tool.
Therefore, the Ene-Con Calculator needs to be completed before the GHG Emissions Calculator is completed.
No further information is required on the thermal performance of the dwellings.
The area-weighted average heating load (MJ/m2/yr) and the area-weighted average cooling load (sensible + latent) (MJ/m2/yr) is calculated within the Ene-con calculator as follows:
Where:E• = ‘Area-adjusted’ energy requirement (MJ/m2.annum, from NatHERS certificate) (either heating or sum of sensible and latent cooling loads)A• = Conditioned floor area (m2, from NatHERS certificate
These figures can be found in the following table in the NatHERS certificate:
Area-weighted average thermal load (MJ/m2.annum) (either heating or cooling)
= SUM ((E(apt.1)xA(apt.1)) + (E(apt.2)xA(apt.2)) + and so on for all apts.) SUM (A(apt.1) + A(apt.2) + … and so on for all apts)
Area-Adjusted Energy Requirments
Heating Cooling (Sensible) Cooling (Latent) Total Energy Units
23.1 10.2 3.5 36.9 MJ/m2.annum
Conditional Floor Area 52.7m2
Figure 16: Excerpt from NatHERS certificate showing which figures should be used
19Date Issued: July 2009
Thermal performance benchmark details
The benchmark thermal performance is the thermal performance required for the Energy Conditional Requirement. The Energy Conditional Requirements Credit Criteria states:
‘To meet the conditional requirement, the average thermal performance of the dwellings must be improved by 10% compared to the regulated thermal performance standard in the relevant jurisdiction.’
For more information on how the design team needs to calculate the thermal performance requirement, see the Green Star – Multi Unit Residential v1 Technical Manual, Ene-Conditional credit; the additional guidance includes example calculations.
For details on how this benchmark total thermal load is apportioned into heating and cooling loads, refer to Appendix E, within the Benchmark thermal performance section, p62.
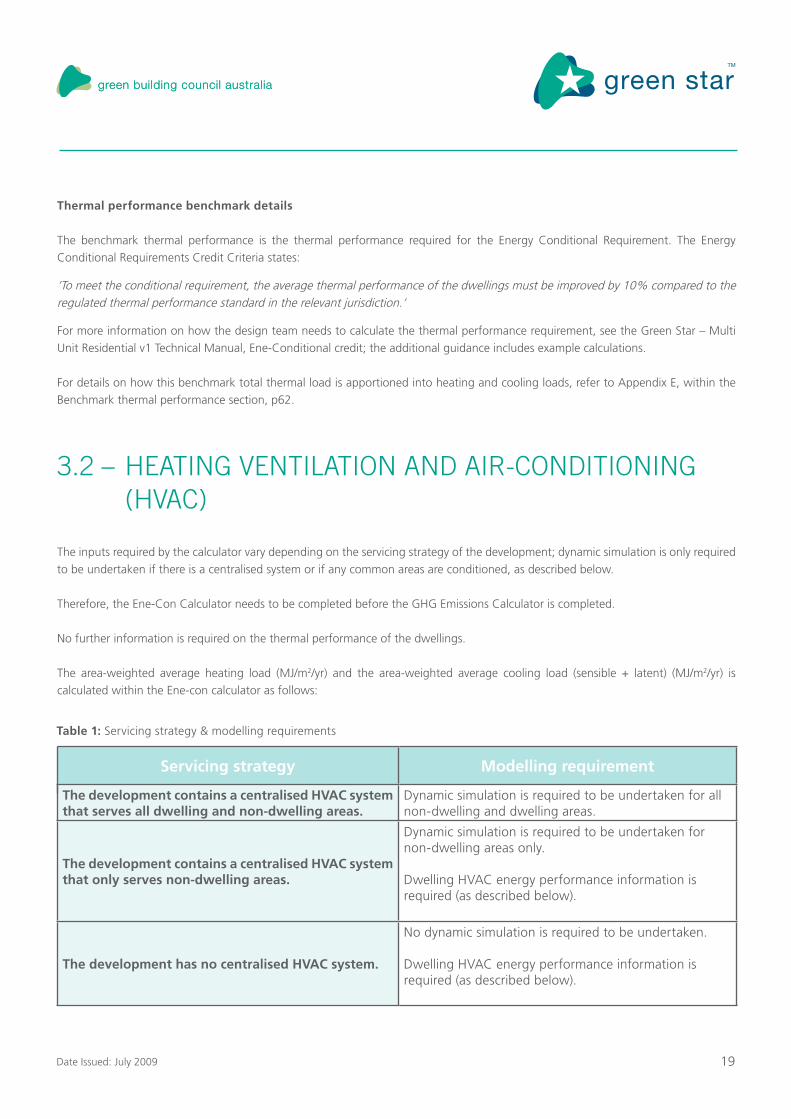
3.2 – HEATING VENTILATION ANd AIR-CONdITIONING (HVAC)
The inputs required by the calculator vary depending on the servicing strategy of the development; dynamic simulation is only required to be undertaken if there is a centralised system or if any common areas are conditioned, as described below.
Therefore, the Ene-Con Calculator needs to be completed before the GHG Emissions Calculator is completed.
No further information is required on the thermal performance of the dwellings.
The area-weighted average heating load (MJ/m2/yr) and the area-weighted average cooling load (sensible + latent) (MJ/m2/yr) is calculated within the Ene-con calculator as follows:
Servicing strategy Modelling requirement
The development contains a centralised HVAC system that serves all dwelling and non-dwelling areas.
Dynamic simulation is required to be undertaken for all non-dwelling and dwelling areas.
The development contains a centralised HVAC system that only serves non-dwelling areas.
Dynamic simulation is required to be undertaken for non-dwelling areas only.
Dwelling HVAC energy performance information is required (as described below).
The development has no centralised HVAC system.
No dynamic simulation is required to be undertaken.
Dwelling HVAC energy performance information is required (as described below).
Table 1: Servicing strategy & modelling requirements

20Date Issued: July 2009
Calculator inputs required where dynamic simulation is undertaken (servicing strategies 1 and 2):
The energy consumption in terms of kWh/year electricity or MJ/year gas or other fuels, as calculated by dynamic simulation is required for the following uses:
Heating (boilers, pumps etc)•Cooling (chillers and fans etc) •Co-generation and tri-generation •
Where dynamic simulation is required for dwelling areas, the percentage of dwelling served by the centralised HVAC system must also be entered in the calculator.
For guidance on how dynamic simulation must be undertaken for the Green Star – Multi Unit Residential v1 Energy Calculator, please see Appendix B: Dynamic simulation guidelines
Calculator inputs required to define dwelling HVAC energy performance (servicing strategies 2 and 3):
It is possible to enter up to three different types of heating and cooling system into the Green Star – Multi Unit Residential v1 Calculator. If the more than three types of HVAC system are installed, please contact the GBCA.
The following inputs are required for heating systems:• Thetotaldwellingareaservedbythisheatingsystem;• Fuelusedbytheheatingsystem;• TheefficiencyorCoefficientofPerformance(COP)oftheheatingsystem(seebelowfordefinition);and• Fan/pumpenergyrequirement,asapercentageoftheheatingenergyrequirement(seebelowfordetailsonhowthisshouldbe
calculated).
The following inputs are required for cooling systems:• Thetotaldwellingareaservedbythiscoolingsystem;• Thefuelusedbythecoolingsystem;• TheEnergyEfficiencyRatio(EER)ofthecoolingsystem(seebelowfordefinition);and• Fan/pumpenergyrequirement,asapercentageofthecoolingenergyrequirement(seebelowfordetailsonhowthisshouldbe
calculated).
The following inputs are required for ceiling fans:• Theestimatedyearlyenergyconsumptionoftheceilingfansinthedevelopment,ascalculatedbythedesignteam.Thehoursof
operation of the fan must be justified.
Definitions of terms
Coefficient of Performance (COP) and Energy Efficiency Ratio (EER)•
A COP is the ratio of the net heating capacity to the effective power input of the equipment at any given set of rating conditions, generally expressed in output-watts per input-watt.
An EER is the ratio of the net total cooling capacity to the effective power input at any given set of rating conditions, generally expressed in output-watts per input-watt.

21Date Issued: July 2009
The COPs and EERs entered into the calculator must have been calculated in accordance with the following Australian Standards (these standards are the test procedures for all energy labelling and Minimum Energy Performance Standards for air-conditioners in Australia):
Australian Standards 3823.1.1:1998 (ISO 5151:1994) (Incorporating Amendment Nos 1, 2 and 3) - Australian/New Zealand -Standard™: Performance of electrical appliances— Air-conditioners and heat pumps. Part 1.1: Non-ducted air conditioners and heat pumps—Testing and rating for performance.AS/NZS 3823.1.2:2001 (Incorporating Amendment Nos 1, 2, 3 and 4): Performance of electrical appliances—Air-conditioners -and heat pumps Part 1.2: Test methods—Ducted air-conditioners and air-to-air heat pumps—Testing and rating for performance (ISO 13253:1995, MOD).AS/NZS 3823.1.3:2005 Australian/New Zealand Standard™ Performance of electrical appliances—Air-conditioners and heat -pumps Part 1.3: Water-source heat pumps—Water-to-air and brine-to air heat pumps—Testing and rating of performance (ISO 13256-1, Ed. 01 (1998) MOD)
Verification of the EER and COP will be required in the submission.
• Fanandpumpenergyrequirements(forductedair-conditioners,air-to-airandwater-sourceheatpumps)
The EER and COP calculated for non-ducted air conditioners and heat pumps does include the energy consumed by fans and pumps (AS 3823, Part 1.1). However, the EER and COP calculated for ducted air-conditioners, air-to-air heat pumps and water-source heat pumps (AS 3823, Part 1.2 and AS 3823, Part 1.3) only includes the additional fan/pump energy required to overcome the internal pressure drop/internal resistance.
Therefore, for ducted air-conditioners, air-to-air and water-source heat pumps, the energy consumption from fans and pumps must be estimated by the design team. This is required to be entered as a percentage of the energy consumed by the chiller/heater itself.
Alternatively a figure of 30% can be used as a default (this is the figure used for the ducted system in the benchmark building).
For information only: Assumption made where the developer has not installed HVAC systems to all or any of the dwellings
If the developers choose to not install HVAC systems to all or any of the apartments, and if the thermal loads are high enough for it to be likely that a tenant would need to install an HVAC system of their own, the calculator makes assumptions as to what sort of HVAC system the tenants would later retrofit the apartment with.
• Assumptions for heating systems
Where the area-weighted average heating load is above 15 MJ/m2/year and where a gas connection has been provided so that the tenant can install their own gas heating system, the tenants are assumed to install a gas room heater which is 65% efficient, with 35W fan. If the tenant has not been provided with a gas connection, it will be assumed that the tenant will install an electric room heater, which is 100% efficient. It is not assumed that 100% of the heating load will be met by the system. Depending on location and on technology type, the percentage of heating load which is met will vary. See Table 1 for the percentages of heating load met for each type of heating system across Australia, and Box 1 for details of the assumptions behind these figures.
• Assumptionsforcoolingsystems
Where the area-weighted average cooling loads are above 15 MJ/m2/year, tenants are assumed to install non-ducted, cooling only air-conditioning system that have an EER of 3.03. (Note - as the system is a non-ducted air-conditioning system, the fan energy is assumed to be included in the calculation of the EER and therefore no additional energy is assumed to be consumed by the system). As for the heating systems, it is not assumed that the tenant installed cooling system will meet 100% of the cooling load (see Box 1 below). See Table 1 for the percentages of cooling load met across Australia, and Box 1 for details of the assumptions behind these figures.

22Date Issued: July 2009
Box 1: How the assumptions were established:
The system types were selected as common choices for residents of a multi-unit residential development.
The efficiencies (and fan power of the gas room heater) are assumed to be equal to the average efficiencies for these technology types in 2009, as estimated by the Department of the Environment, Water, Heritage and the Arts in the report ‘Energy use in the Australian residential sector, 1986-2020’ (DEWHA, 2008). See Table 71: Appliance Attributes for Electric Resistive Space Heaters, Table 74: Appliance Attributes for Gas Space Heaters and Table 68: Appliance Attributes for Cooling Only Room Air Conditioners for details.
The percentage of the heating and cooling load that is met by each technology type in each state is taken from the DEWHA report (DEWHA, 2008), Table 56: Zoning Factors by Space Conditioning Technologies and State of the EES report. The figures in this table have been adapted in the following ways for use in the Green Star - Multi Unit Residential v1 Greenhouse Gas Emission Calculator:
1. The zoning figures in the EES report have been reduced by up to 10% due to the use of areas which include external walls (ABS floor area figures). Therefore all zoning figures have been increased by the same factor (dividing by 90%) as the floor areas entered into the Green Star - Multi Unit Residential v1 Greenhouse Gas Calculator do not.
2. Our simplified model assumes that a centralised or ducted system will meet 100% of the heating and cooling demand. The zoning factors in the DEWHA report suggest that in reality it will meet only 78% of this load (22% reduction). To allow for a fair comparison, all figures are increase by the same amount (divided by 0.78).
HVAC benchmark details
The benchmark dwellings are served by a ducted reverse-cycle air conditioning system which meets 100% of the load. The system’s EER is 3.2 and COP is 3.5. As the systems is ducted, the energy consumption from the fan is not included in the EER or COP. Therefore, it is assumed that 30% additional energy will be consumed by the system to power the pumps and fans.
The energy consumption of the will depend on the thermal performance of the benchmark building, which depends on the conditional requirement for the project as described in the previous section and are calculated using the following equations.
Heating/cooling system type
NSW VIC QLD SA WA TAS NT ACT
Resistive Heating 36% 36% 28% 28% 28% 28% 28% 43%
Room Gas Heaters 36% 85% 36% 36% 36% 71% 36% 43%
Room Cooling Only 43% 43% 43% 43% 43% 43% 36% 43%
Table 2: Percentage of cooling load met across Australia
Heating energy benchmark (kWh/m2/yr)
=Heating load (kWh/m2)
x 130%3.5
Cooling energy benchmark (kWh/m2/yr)
=Cooling load (kWh/m2)
x 130%3.2
More information can be found in Appendix E, within the HVAC Benchmark section, p64

23Date Issued: July 2009
3.3 – LIGHTING
The energy consumed by lighting, for each space type, should be calculated as follows:
(N.B.: Dividing the right hand side of the equation by 1000 converts the result from Wh/yr into kWh/yr)
Where:The lighting power density is the lighting power density specified in the electrical specification and shown on the relevant lighting •plans; andThe hours of operation per year are those given in Table 3; and•The area of each space type is the area verified by relevant plans.•
For definitions of each space type, see Appendix A – Space type definitions
*The hours of operation for ‘foyers, hallways and corridors’ or any other transiently occupied common area can be reduced by the installation of lighting controls, in accordance with Specification J6 of the BCA, 2009 (ABCB, 2009)) by the following degrees:
Lighting energy consumption for space type (i) (kWh/year) =
Lighting power density for space type (i) (W/m2)
x Hours of operation per year for space type (i) (Hrs)
x Area of space type (i)(m2)
1000
Space typeHours of
operation per day (hours)
Days of operation per year
Hours of operation per year (hours)
DwellingsLiving areas 6.2 365 2,263
Sleeping areas 4 365 1,460
Foyers, hallways, corridors 24* 365 8,760
Amenities 12 365 4,380
Back of House 8 365 2,920
Indoor car park 24 365 8,760
Outdoor car park 12 365 4,380
External lighting 12 365 4,380
Table 3: Hours of operation per year to be assumed for each space type
Lighting control system Reduction applicable
Occupancy sensors - 40%
Timers - 40%
Daylight sensors and dynamic lighting control device
- 15% or as defined by the design team with a daylighting study (see Appendix D - Protocol for calculating lighting energy reduction due to daylight dimming, for further details).

24Date Issued: July 2009
The dwelling hours of operation are derived from the internal heat load schedules from the ABCB Protocol for House Energy Rating Software, version 2006.1 (ABCB, 2006), copies of which are included in Appendix C – HVAC internal loads, setpoints and aperture schedules. The hours of operation from the other areas were developed through industry consultation. These same hours of operation are used in the calculation of the lighting energy benchmarks.
Lighting benchmark details
The lighting benchmarks are the assumed yearly energy consumption from lighting, per square metre, for each space type. The only exception being the benchmark for external lighting; which is the assumed yearly energy consumption per linear metre of lit walkway.
Benchmark lighting densities for most space types are the BCA maximum lighting densities, with a few exceptions. Hours of operation are as for the actual building. The lighting benchmarks for each space type are presented below.
More information can be found in Appendix E, within the Lighting benchmark section, p64.
Space type Lighting Benchmark (annual energy consumption per square metre, kWh/m2/yr)
Dwellings 12.7
Foyers, hallways, corridors 36.8
Amenities 35.0
Back of House 17.5
Indoor car park Entry zone lighting 120.5
Standard car park lighting area 21.9
Outdoor car park 11.0
External lighting (per linear metre) 27.1(kWh/m/yr)
Table 4: Hours of operation per year to be assumed for each space type
3.4 – HOT WATER
The following methodology is for all hot water systems except for solar water and heat pump booster systems. Such systems should be evaluated using the ‘Green Star Solar Hot Water and Heat Pump Booster Energy Calculation Methodology’ which can be downloaded from the GBCA website, www.gbca.org.au
The energy consumption for the provision of hot water to taps and showers should be calculated for the Green Star – Multi Unit Residential v1 Greenhouse Gas Emissions calculator as follows:
Hot water energy consumption
=Energy required to heat the necessary water to meet demand (including sys-tem efficiencies)
+Storage system losses (for storage systems only)
+Distribution system losses (centralised systems only)

25Date Issued: July 2009
Guidance on how to calculate each of these parameters is described separately below.
N.B: Water pumping does not need to be included. The method for calculating each of the above parameters is detailed below.
3.4.1 – ENERGY REQUIREd TO HEAT THE NECESSARY WATER TO
MEET dEMANd (INCLUdING SYSTEM EFFICIENCIES)
N.B. The Green Star – Multi Unit Residential v1 Water calculator must be completed before this parameter can be calculated.
The energy required to meet the hot water demand of the development is calculated as follows:
Where:• TheannualhotwaterdemandisthefiguregivenintheGreenStar–MultiUnitResidentialv1GreenhouseGasEmissionscalculator
as shown in Figure 17. This figure depends on the water efficiency of the building’s taps and showers, which are entered into the Green Star – Multi Unit Residential v1 Water Calculator, along with the occupancy which is derived by the number of apartments of each type. For further information on how the assumed occupancy is calculated, see Appendix E, in the ‘Basic building attributes and occupancy’ section. It is therefore necessary to complete the water calculator accurately before beginning this calculation.
The water consumption is calculated with an assumed usage rate and with the water efficiency of taps and showers entered by the project team into the Green Star – Multi Unit Residential v1 Water Calculator. For more information, refer to the Green Star – Multi Unit Residential v1 Water Calculator Guide, available from www.gbca.org.au. It is assumed that 50% of the water consumption from showers and taps is hot water.
Energy required to meet hot water demand of the development (including system efficiencies)
=Energy required to heat the necessary water to meet demand (including system efficiencies)
+Storage system losses (for storage systems only)
Annual hot water demand
Figure 17: Occupancy and hot water demand figures to be used from the Greenhouse Gas Emissions calculator

26Date Issued: July 2009
• Theenergyrequiredtoheatonelitreofwatershouldbecalculatedusingtheappropriateformulaforelectricorgassystemsgivenbelow.
The specific heat capacity of water is 4.186kJ/kg°C. This means that it takes 4.186kJ of energy to raise the temperature of one kilogram of water by one degree. If the system used to heat the water is not 100% efficient, more energy will be required. The energy required to raise the temperature of one litre of water can be calculated by multiplying the specific heat capacity of water by the required change in temperature and then dividing by the efficiency of the water heating system.
The formula the design team should use to calculate this energy use has been simplified and is presented separately for gas and electric systems. This is due to the fact that the:o Specific heat capacity of water does not vary (4.186kJ/kg°C);o Required temperature change is set for the purposes of the Green Star – Multi Unit Residential v1 at 45°C (15°C to 60°C);
ando Greenhouse Gas Emissions calculator requires gas to be input in MJ and electricity in kWh.
For gas hot water systems:
The boiler efficiency or Coefficient of Performance used needs to be justified with reference to manufacturer’s specifications.
For electric hot water systems:
Energy required to raise the temperature of one litre of water, from 15°C to 60°C by a gas system(MJ/L)
= 0.1884MJ/LBoiler efficiency
Energy required to raise the temperature of one litre of water, from 15°C to 60°C by a gas system(MJ/L)
= 0.05233kWh/L
Boiler efficiency or Coefficient of Performance (for heat pumps)
3.4.2 – STORAGE SYSTEM LOSSES
The storage systems losses, per storage system, are calculated by multiplying the manufacturers declared heat loss (MJ/day) by 365 days by the number of storage systems in the development as follows:
If there is more than one type of storage system within the development, the above calculation needs to be done for each type and added together.
Storage system losses [MJ(gas)/year or kWh(electricity)/year]
=Declared heat loss (MJ(gas)/day or kWh(electricity)/day)
X 365days XNumber of storage systems of that type in the development

27Date Issued: July 2009
3.4.3 – dISTRIBUTION SYSTEM LOSSES
The distribution losses need to be calculated if the hot water is provided by a centralised system. The distribution losses from systems within a single apartment do not need to be calculated as they are assumed to be small in comparison with the energy required to heat the water as follows:
Hot water benchmark details
The hot water benchmarks have been developed based on the following assumptions; a standard practice hot water system is a non-centralised, 80% efficient gas storage system, with a declared heat loss of 6.8MJ/day; and that each dwelling has 4 Star WELS rated taps and 3 Star WELS rated showerheads installed.
A summary of the hot water benchmarks is presented below.
More information can be found in Appendix E, within the Hot water benchmark section, p67.
Distribution system losses[MJ(gas)/year or kWh(electricity)/year]
=Heat loss from pipe work (MJ(gas)/day per metre or kWh(electricity)/day per metre)
X 365days X Number of metres of pipe work
Energy required to heat the necessary water to meet demand (including system efficiencies)
= 4,077MJ(gas)/year per person
Storage system losses = 2,482MJ(gas)/year per apartment
Distribution system losses = 0Wh/m2/yr
3.5 – MECHANICAL EXHAUST
The energy consumption from all mechanical ventilation systems (such as those installed for toilets, kitchens, amenities and car parks) need to be included in the Greenhouse Gas Emissions calculator. The energy consumed by mechanical exhausts, should be calculated as follows:
The hours of operation which should be used in the above equation for the different types of mechanical exhaust, are as follows:
Mechanical exhaust energy consumption
=Number of exhausts of this type in the development
XPower consumption of exhaust (kW)
X Hours of operation per year

28Date Issued: July 2009
Type of exhaust
Hours of
operation per
year
Details
Domestic exhausts 182.5Domestic exhausts must be assumed to run for half an hour per day. Therefore, the hours of operation per year that must be used are 182.5 hours per year (0.5 hours x 365 days).
Back of house exhaustsDefined by
design team
For back of house and amenities areas, an appropriate figure for the design of the space can be used. The design team should justify the figure used in the documentation.
Car park
With carbon monoxide
monitoring and variable speed
drives
3212
Where carbon monoxide monitoring and variable speed drives have been installed, the assumed number of hours of operation is 8.8 hours. The number of hours of operation per year is therefore 3212 hours.
These figures have been derived from the schedule of fan operation given in Table 4.
Without carbon monoxide
monitoring and variable speed
drives
8760
Where carbon monoxide monitoring and variable speed drives have not been installed, exhaust fans are assumed to run 24 hours per day. The number of hours of operation per year is therefore 8760 hours.
These figures have been derived from the schedule of fan operation given in Table 6.
Table 5: Assumed occupancy for each apartment type

29Date Issued: July 2009
TimeFan Flow (with CO
monitoring)
Fan Flow (without CO monitoring)
12am – 1am 0% 100%
1am – 2am 0% 100%
2am – 3am 0% 100%
3am – 4am 0% 100%
4am – 5am 0% 100%
5am – 6am 5% 100%
6am – 7am 10% 100%
7am – 8am 60% 100%
8am – 9am 100% 100%
9am – 10am 100% 100%
10am – 11am 50% 100%
11am – 12pm 40% 100%
12pm – 1pm 40% 100%
1pm – 2pm 40% 100%
2pm – 3pm 40% 100%
3pm – 4pm 50% 100%
4pm – 5pm 100% 100%
5pm – 6pm 100% 100%
6pm – 7pm 75% 100%
7pm – 8pm 50% 100%
8pm – 9pm 20% 100%
9pm – 10pm 0% 100%
10pm – 11pm 0% 100%
11pm – 12am 0% 100%
SUM (HRS) 8.8 24
8.8 x 365 = 3212 24 x 365 = 8760
Table 6: Car park ventilation profiles
Mechanical exhaust benchmark details
The benchmark for dwelling exhaust systems assumes one 0.5kW bathroom exhaust and one 0.5kW kitchen exhaust, each operating for 30 minutes per day, for each apartment.
Domestic mechanical exhaust benchmark = 182.5kWh/yr per apartment

30Date Issued: July 2009
Back-of-house and amenities mechanical ventilation is considered non-standard equipment and is not included in the benchmark building and as such, has a benchmark energy consumption of zero.
The benchmark for car park ventilation is based on a mechanical supply and exhaust system controlled by carbon monoxide (CO) monitoring and variable speed drive (VSD) fans.
More information can be found in Appendix E, within the Mechanical ventilation benchmark section, p69.
Back-of-house and amenities mechanical ventilation benchmark
= 0kWh/yr
Car park ventilation benchmark = 42.33kWh/m2/yr
3.6 – LIFTS
The following formula is used to calculate the annual energy consumption from a lift (definitions for each are given in Table 5):
This formula has been adapted for Green Star from the Draft ISO standard ISO/DIS 25745-1: Energy performance of lifts and escalators - Part 1: Energy measurement and conformance.
There are a number of parameters that must be defined by design teams. These are: trip time, lift power rating, standby power, whether the lift has regenerative breaks, or a power off feature. All other parameters are standard for all developments and are given in Table 7.
Energy used by a lift per year (kWh):
=
(Number of trips
XAverage
trip time (s)X
Average power load (kW))
+
(Standby power(kW) x
Standby hours per
day x
Standby days per
year)
3600

31Date Issued: July 2009
Parameter Definition Modelling Requirements for Proposed Building
Number of
trips
(standard) The standard number of
trips per year that a lift in a
residential development is
assumed to perform.
110,000 trips per year
Average trip
time
(project defined) The time, in seconds, for
the lift to travel half the
possible travel distance
measured from doors
closed to doors opening.
Determined by the lift travel distance and rated
speed. The lift can be assumed to run at the rated
speed (m/s) over the whole trip.
Average
trip time (s)
= Average travel height
(half the maximum travel
distance) (m)
Speed (m/s)
Average
power load(project defined)
The average power load
is assumed to be the lift
motor power rating (kW)
From lift supplier specifications.
Note: This figure can be reduced by 20% if the lift
has regenerative breaks.
3600 (standard) The figure of 3600 converts the first half of the equation from kWs to kWh.
Standby
power(project defined)
Standby power from car
lights and lift control
system in kW
From lift supplier specifications.
Standby hours
per day
(standard) Number of hours per day
that the car lights and
lift control systems are
operating
24 hours (no power off); or•
12 hours (for lifts with power off feature)•
Standby days
per year(standard)
Number of days the
standby power is
applicable
365 days
Standby days
per year365 days
Table 7: Definition of parameters used to calculate the energy consumption of a lift
Lifts benchmark details
Due to the number of variables involved, the Green Star – Multi Unit Residential v1 energy calculator works out the benchmark lift energy consumption based on the height of the proposed building.
More information can be found in Appendix E, within the Lifts benchmark section, p.71.

32Date Issued: July 2009
3.7 – POOLS, SPAS ANd SAUNAS
3.7.1 – POOLS ANd SPA ENERGY CONSUMPTION
3.7.2 – SAUNA ENERGY CONSUMPTION
The storage systems losses, per storage system, are calculated by multiplying the manufacturers declared heat loss (MJ/day) by 365 days by the number of storage systems in the development as follows:
Energy required by saunas must be justified by the design team with reference to the sauna volume, heating system, ventilation system and hours of operation.
Pool benchmark details
The benchmark for pools is based on an outdoor un-heated 50,000 litre pool. This benchmark is independent of the size of the development – one development = one pool. The pool pump has a power rating of 1kW and is controlled by an intelligent pump controller. The pool has one halogen underwater pool light and is manually sanitised.
Spas and saunas are considered non-standard facilities; therefore the benchmark energy consumption for escalators and travelators is zero.
More information can be found in Appendix E, within the Pools, spas and saunas benchmark section, p.72.
• Inthecalculationofpumpingenergy,projectteamsmustjustifypumpruntimesusedincalculationswithspecificationsofpumpcontrollers.
• Inthecalculationoftheheatingenergy,theefficiencyoftheheatingsystemmustbejustifiedandthespecificationofthepoolcover must be provided if there is one.
• Allunderwaterpoollightsmustbeincludedinthissection.Notethat:o External pool area lighting must be included in the external lighting section of the Greenhouse Gas Emissions calculator; ando Internal pool area lighting must be included in Amenities lighting section of the Greenhouse Gas Emissions calculator.
• Theenergyconsumedbysanitisingequipment,suchaselectrolyticcells insaltwaterpools,ozonegeneratorsordispensersforchlorine compounds must be accounted for.
• Energyconsumptionforalltimersandcontrollersmustbeaccountedfor.
Energy consumption from a pool or spa (kWh/yr)
=
Pumping energy(kWh/yr)
+Heating energy(kWh/yr) +
In-water lighting energy (kWh/yr) +
Sanitising equipment energy(kWh/yr)
+
Timers and controls energy(kWh/yr)
Pools benchmark = 2061.4kWh/yr per development
Spas and saunas benchmark = 0kWh/yr

33Date Issued: July 2009
3.8 – COOKING
The storage systems losses, per storage system, are calculated by multiplying the manufacturers declared heat loss (MJ/day) by 365 days by the number of storage systems in the development as follows:
No calculations are required to be undertaken by the design team to assess the energy consumed from cooking. The design team has to:1) Select the appropriate cooking system technology from the drop down box in the Excel tool.
The technology types for cook tops are:• Gas• Electricsolidplate• Electriccoil• Electricceramic–standard• Electricceramic–halogen• Electricceramic–inductionThe technology types for ovens are:• Gas• Electric
2) Enter the percentage of dwellings being fitted with this type of cooking system.
It is possible to enter up to three different types of cooking system into the Excel tool. If cooking systems are not supplied to all apartments, it is assumed that the future tenant will install an electric solid plate cook top and electric oven (this information does not need to be entered into the Excel tool, as the tool contains the default system).
Assumed energy consumed by ovens and cook tops in the developmentThe energy consumption assumed for each type of oven and cook top is as follows:
For full details on how the formulas and figures given here have been derived, see Appendix E, within the Cooking benchmark section, p.74.
* The figure of four represents the occupancy of the average Australian household.
Energy consumed by ovens or cook tops in the development
=(50% x E(Standard)
XNumber of apartments)
+(50% x E(Standard)
4*x
Occupancy of development
Technology type E(Standard)
OvenGas oven 1.7 GJ/year
Electric oven 273 kWh/year
Cook top
Gas cook top 1.6 GJ/year
Ceramic - halogen cook top 317 kWh/year
Solid plate cook top 288 kWh/year
Ceramic - standard cook top 264 kWh/year
Coil cook top 244 kWh/year
Ceramic - Induction cook top 186 kWh/year
Table 8: Type of cooktops and ovens

34Date Issued: July 2009
Cooking benchmark details
The benchmark apartments are assumed to be fitted with an electric solid plate cook top and an electric oven.
The energy consumed by the benchmark cook tops and ovens depends on the number of apartments and occupancy in the same way as the proposed development.
Any other energy consumed on site for base building facilities, such as a water recycling treatment plant, or escalators and travelators, should be calculated by the design team and included in the calculator. All assumptions used in the calculation must be provided in the documentation and justified.
Other energy consumption benchmark
Other energy consuming facilities such as escalators and travelators are considered non-standard; therefore the benchmark energy consumption for ‘other energy consumption’ is zero.
More information can be found in Appendix E, within the Cooking benchmark section, p.74.
Energy consumed by benchmark electric ovens (kWh/year)
= (50% x 237 X Number of apartments) X Number of apartments) +(50% x 237
4X
Occupancy of development)
Energy consumed by benchmark electric ovens (kWh/year)
= (50% x 288 X Number of apartments) X Number of apartments) +(50% x 288
4X
Occupancy of development)
3.9 – OTHER ENERGY CONSUMPTION
Other energy consumption benchmark
= 0kWh/yr

35Date Issued: July 2009
The modelling methodology used to calculate the annual generation of electricity must be proposed by the design team in the form of a CIR.
The GBCA will be providing modelling guidance in the future for common on-site electricity generation systems.
Benchmark details
On-site electricity generation is not yet considered standard practice; therefore the benchmark development does not include any electricity generating equipment.
3.10 – ON-SITE ELECTRICITY GENERATION
On-site electricity generation benchmark
= 0kWh/yr

36Date Issued: July 2009
BIBLIOGRAPHYAustralian Building Codes Board (ABCB) (2008), • Volume One Class 2-9 Buildings, BCA 2008, Australian Building Codes Board,
Australia.
Australian Building Codes Board (ABCB) (2006), • Protocol for Energy Analysis Software 2006.1, http://www.abcb.gov.au/index.cfm?objectid=6928102C-F27E-4834-0B94E42A0568F11B, accessed June, 2009.
Australian Bureau of Statistics (ABS) (2007), • 4130.0.55.001 – ‘Housing Occupancy and Costs’,http://www.abs.gov.au/AUSSTATS/[email protected]/Latestproducts/4130.0.55.001Main%20Features22005-06?opendocument&tabname=Summary&prodno=4130.0.55.001&issue=2005-06&num=&view=, accessed June, 2009.
Australian Bureau of Statistics (ABS) (2008), • 4602.0.55.001 – Environmental Issues: Energy Use and Conservation, pp.43-45, http://www.abs.gov.au/AUSSTATS/[email protected]/Lookup/4602.0.55.001Main+Features1Mar%202008?OpenDocument, accessed June, 2009.
Australian Greenhouse Office (2004), • Australian Greenhouse Office Report no. 2004/12, ‘Minimum Energy Performance Standards – Swimming Pools and Spa Equipment’, http://www.energyrating.gov.au/library/pubs/200412-mepspools.pdf, accessed June, 2009.
Barney, G. (2007), • Energy efficiency of lifts – measurement, conformance, modelling, prediction and simulation (presentation), www.cibseliftsgroup.org/CIBSE/papers/Barney-on-energy%20efficiency%20of%20lifts.pdf, accessed June, 2009.
Department of Climate Change (DCC) (2008), • National Greenhouse Accounts (NGA) Factors, November 2008, http://www.climatechange.gov.au/workbook/index.html, accessed June, 2009.
Department of the Environment, Water, Heritage and the Arts (DEWHA) (2008), • Energy Use in the Australian Residential Sector 1986-2020, http://www.environment.gov.au/settlements/energyefficiency/buildings/publications/pubs/energyuse-part1.pdf, accessed June, 2009.
International Organization for Standardization (ISO) (2008), • Energy performance of lifts and escalators - Part 1: Energy measurement and conformance, ISO/DIS 25745-1: 2008 (Draft standard - currently under development), International Organization for Standardization, Geneva.
Ruck, N. (2001), • Skylight Availability in Australia: Data and their Application to Design, Illuminating Engineering Society of Australia (IESA).
Standards Australia (2005), • Electric water heaters - Minimum Energy Performance Standard (MEPS) requirements and energy labelling, AS/NZS 4692.2:2005, SAI Global, Australia(Summary of requirements can be found at: http://www.energyrating.gov.au/ewh2.html ).

37Date Issued: July 2009
Standards Australia (1994), Performance of electrical appliances— Air-conditioners and heat pumps Part 1.1: Non-ducted •air conditioners and heat pumps—Testing and rating for performance, AS 3823.1.1:1998 (ISO 5151:1994) (Incorporating Amendment Nos 1, 2 and 3), SAI Global, Australia.
Standards Australia (2001), • Performance of electrical appliances—Air-conditioners and heat pumps Part 1.2: Test methods—Ducted air-conditioners and air-to-air heat pumps—Testing and rating for performance, AS/NZS 3823.1.2:2001 (ISO 13253:1995, MOD) (Incorporating Amendment Nos 1, 2, 3 and 4), SAI Global, Australia.
Standards Australia (2005), • Performance of electrical appliances—Air-conditioners and heat pumps Part 1.3: Water-source heat pumps—Water-to-air and brine-to air heat pumps—Testing and rating of performance, AS/NZS 3823.1.3:2005 (ISO 13256-1, Ed. 01 (1998) MOD), SAI Global, Australia.
Western Australian Sustainable Energy Development Office,• Types of Cooktops, http://www.sedo.energy.wa.gov.au/pages/cooktops.asp, accessed May, 2009.

38Date Issued: July 2009
APPENdIX A: SPACE TYPE dEFINITIONS

39Date Issued: July 2009
The definitions for the space types referred to in the Green Star Multi-Unit Residential Greenhouse Gas Emissions Calculator are as follows:
Dwellings – These spaces include areas for private individual residential use only i.e. the apartments themselves.•Foyers, lobbies, hallways and corridors – These spaces include the foyers, lobbies, hallways and corridors within the residential •building not part of private dwellings.Amenities – These spaces include, but are not limited to, gymnasiums, indoor swimming pools, common laundries, common •bathrooms, common changing facilities, business centres, community/lounge/activity rooms etc.Back of house – These spaces include, but are not limited to, plant rooms, electrical rooms, indoor garbage storage, lift rooms, •administration areas, etc. Indoor car parks – These spaces include under cover areas specifically designated for car parking.•External car parks – These spaces include all external areas specifically designated for car parking.•Linear distance of external lit walkway (m) – This measurement is used to set the benchmark for external lighting and is calculated •as the linear length of all lit walkways, including the length of walkway around an external swimming pool.

40Date Issued: July 2009
APPENdIX B: dYNAMIC SIMULATION GUIdELINES

41Date Issued: July 2009
The parameters used to simulate the HVAC energy consumption of a residential building are given in this section. These are standard criteria that must be adhered to in ordered to comply with the Green Star energy credit requirements. The outputs from this simulation will then be entered in the calculator, as outlined in Chapter 2.0: How to use the Greenhouse Gas Emissions Calculator.
Modelling Parameter It is a requirement that:
Simulation package
The simulation package used must have either:
Past the BESTEST validation test (The BESTEST – International Energy Agency •Building Energy Simulation Test and Diagnostic Method is a benchmark for building energy simulation programs created by the International Energy Agency and the US National Renewables Energy Laboratory);Past the European Union draft standard EN13791 July 2000; or•Be certified in accordance with ANSI/ASHRAE Standard 140-2001.•Please contact the Green Building Council of Australia if none of the above options •can be complied with.
Weather data
The weather data used must either be either:
A Test Reference Year (TRY) if the building location is within 50km of a TRY location; •orIn the absence of local TRY weather data, an actual year of recorded weather data •from a location within 50km of the building location; orIn the absence of TRY or actual weather data within 50km, interpolated data based •upon 3 points within 250km of the building location.
Please contact the Green Building Council of Australia if none of the above options can be complied with.
Over shadowingOvershadowing from the surrounding environment must be taken into account in •the model.
GENERAL HVAC MOdELLING PARAMETERS
Table 9: HVAC Modelling Parameters

42Date Issued: July 2009
Modelling Parameter It is a requirement that:
Building formThe simulation model is an accurate representation of the building’s shape;•All floors in the building are modeled; and•Simplifications to the building form are limited.•
Insulation • Insulationinthewalls,ceilingandfloorsisaccuratelyrepresented.
GlazingOvershadowing from the surrounding environment must be taken into account in the •model.
Windows and spandrel Sizes of windows and spandrel are accurately represented.•
Shading All shading of windows and external building fabric is accurately represented.•
Orientation The building orientation is included in the model.•
InfiltrationInfiltration is modeled to reflect façade design specification. Typical default values are 0.5 •air changes per hour.
Modelling Parameter It is a requirement that:
Lighting and equipmentLighting and equipment internal loads are calculated based on areas of each space •type.The appropriate operational profiles, from Appendix C, are used.•
Occupancy• Occupancyinternalloadsarecalculatedbasedonnumberofspaces.• Theappropriateoccupancyprofile,fromAppendixC,isusedforeachspacetype.
BUILdING ENVELOPE PARAMETERS
HVAC INTERNAL LOAdS
Table 10: Building envelope parameter
Table 11: HVAC Internal Loads

43Date Issued: July 2009
Modelling Parameter It is a requirement that:
Chilled waterWhere central chiller water is to be supplied, the chilled water pumping is calculated •using the building cooling load, the static pressure of the chilled water pumps (typically 250kPa) and the flow rate in L/s.
Heating hot water• Wherecentralheatinghotwateristobesupplied,thehotwaterpumpingis
calculated using the building heating load, the static pressure of the hot water pumps (typically 250kPa) and the flow rate in L/s.
Modelling Parameter It is a requirement that:
HVAC system designThe HVAC system modeled represents the system design for each part of the •building.
Zoning• Allairconditioningzonesrepresentedinthethermalmodelaccuratelyreflectsystem
performance and zonal solar diversity.
Chiller plant and/or AC units
• ThechillerplantsizeandACunitsareaccuratelyreflectedinthemodel.• Theactualefficiencycurvesoftheinstalledequipmentareusedinthemodel.• Wherewatercooledequipmentistobeinstalled:thedataisspecifiedunder
conditions that reflect the intended condenser water temperature controls. • Whereaircooledequipmentistobeinstalled:theCOPprofileshavebeen
accurately modeled with regard to loading and ambient conditions.
Boiler plant• Ifthereisaboilerplant,theboilerplantsize,thermalefficiencyanddistribution
efficiency are accurately reflected in the model.
Supply air and relief fans
• Thefanperformancecurves,efficiencyandstaticpressureareaccuratelyrepresented in the model.
• Theindexrunpressuredropsareaccuratelyrepresentedtoincludethetotalstaticpressure (inclusive of filters, coils and diffusers).
Cooling tower and condenser water pumping
• Iftherearecoolingtowers,theallowanceforenergyconsumptionfromcoolingtower and condenser water pumping has been made, based upon the annual cooling load of the building.
A/C PUMPING
HVAC SYSTEM SIMULATIONS
Table 12: A/C Pumping parameter
Table 13: HVAC System Stimulation parameter

44Date Issued: July 2009
Modelling Parameter It is a requirement that:
Outside air Outdoor air flows have been modeled as documented in the mechanical design •drawings and specifications, and in compliance with the appropriate standards.
Economy cycle• Theeconomycycleshavebeenmodeledtoreflectsystemspecificationnotingany
enthalpy/temperature cut-off and control point.
Primary duct temperature control
• WhereConstantVolumeSystemsaretobeinstalled,themodelinghasallowedsupply air temperatures to vary to meet loads in the space
• WhereVariableVolumeSystemsaretobeinstalled,themodelinghasallowedsupply air volumes to vary to meet loads in the space.
• Setpointshavebeenrescheduledasspecified.Notethatsimplificationsmaybemade to consider average zone temperature in lieu of high/low select.
Airflow control• Controllogic,describingtheoperationofthedamperstocontroloutsideand
re-circulated airflow, is inherent in the model and accurately reflects the airflow characteristics of the system.
Minimum turndown• Whererelevant,theminimumturndownairflowofeachairsupplyisaccurately
reflected in the model.
Chiller staging• Forsystemsthatemploymultiplechillerswithachillerstagingstrategy,thecorrect
controls are modeled to reflect the actual relationship between the chillers.
Temperature control bands • Thetemperaturecontrolbandsofthesystemaccuratelyreflectthethermalmodel.
HVAC CONTROLSTable 14: HVAC Controls
45Date Issued: July 2009
APPENdIX C: HVAC INTERNAL LOAdS, SETPOINTS ANd APERTURE SCHEdULES

46Date Issued: July 2009
This appendix contains the schedules of internal heat loads, heating and cooling setpoints and aperture schedule for each space type. These schedules should be used where dynamic simulation of the development is undertaken.
Notes on schedules:The schedules for the dwelling areas (living areas and bedroom areas) and the cooling set points for each NatHERS climate zone, •are from the ABCB Protocol for House Energy Rating Software Version 2006.1 (ABCB, 2006). As written in the protocol:
‘The heat loads [in these schedules] are for a 160 m2 dwelling with two adults and two children, with a floor area split of 80 m2 for all the living areas and 80 m2 for all the bedroom areas. Suitable adjustments should be made for houses with different total areas, and for individual spaces with different areas.’
This means that the lighting heat gains can be increased or decreased, in proportion to the size of the dwelling. The occupancy however should not be varied.
All units must be modelled with at least one zone that uses the ‘living spaces, including kitchens’ schedule of internal gains; as •even where the developer does not install any cooking equipment in a unit, it is assumed that the future tenant will retrofit the unit with some form of cooking equipment. If a unit contains further living space, in addition to the area zoned with the kitchen, the schedule ‘for living spaces that do not include a kitchen’ may be used.
The schedule for common areas was developed specifically for the Green Star – Multi Unit Residential v1 Greenhouse Gas Emissions •calculator. Occupancy is assumed to be transitory and the gains from lighting are based on the lighting power densities assumed for the Green Star – Multi Unit Residential v1 common areas lighting benchmark.

47Date Issued: July 2009
TimeSensible heat load (Watts)
Latent heat loads
(Watts)
Heating
setpoint (°C)
Cooling
setpoint (°C)Appliances and cooking
Lighting People Total
12am – 1am 100 0 0 100 0 Off Off
1am – 2am 100 0 0 100 0 Off Off
2am – 3am 100 0 0 100 0 Off Off
3am – 4am 100 0 0 100 0 Off Off
4am – 5am 100 0 0 100 0 Off Off
5am – 6am 100 0 0 100 0 Off Off
6am – 7am 100 0 0 100 0 Off Off
7am – 8am 400 180 280 860 400 20 On*
8am – 9am 100 180 280 560 200 20 On*
9am – 10am 100 0 140 240 100 20 On*
10am – 11am 100 0 140 240 100 20 On*
11am – 12pm 100 0 140 240 100 20 On*
12pm – 1pm 100 0 140 240 100 20 On*
1pm – 2pm 100 0 140 240 100 20 On*
2pm – 3pm 100 0 140 240 100 20 On*
3pm – 4pm 100 0 140 240 100 20 On*
4pm – 5pm 100 0 140 240 100 20 On*
5pm – 6pm 100 300 210 610 150 20 On*
6pm – 7pm 1100 300 210 1610 750 20 On*
7pm – 8pm 250 300 210 760 150 20 On*
8pm – 9pm 250 300 210 760 150 20 On*
9pm – 10pm 250 300 210 760 150 20 On*
10pm – 11pm 100 0 0 100 0 20 On*
11pm – 12am 100 0 0 100 0 20 On*
INTERNAL SENSIBLE ANd LATENT HEAT LOAdS, ANd HEATING ANd COOLING SETPOINTS
Table 15: Internal heat loads, and heating and cooling setpoints - for living spaces, including kitchens (ABCB, 2006)
* Refer to Table 19 for the cooling setpoint appropriate for the development’s climate

48Date Issued: July 2009
TimeSensible heat load (Watts)
Latent heat loads
(Watts)
Heating
setpoint (°C)
Cooling
setpoint (°C)Appliances and cooking
Lighting People Total
12am – 1am 0 0 0 0 0 Off Off
1am – 2am 0 0 0 0 0 Off Off
2am – 3am 0 0 0 0 0 Off Off
3am – 4am 0 0 0 0 0 Off Off
4am – 5am 0 0 0 0 0 Off Off
5am – 6am 0 0 0 0 0 Off Off
6am – 7am 0 0 0 0 0 Off Off
7am – 8am 0 180 280 460 140 20 On*
8am – 9am 0 180 280 460 140 20 On*
9am – 10am 0 0 140 140 70 20 On*
10am – 11am 0 0 140 140 70 20 On*
11am – 12pm 0 0 140 140 70 20 On*
12pm – 1pm 0 0 140 140 70 20 On*
1pm – 2pm 0 0 140 140 70 20 On*
2pm – 3pm 0 0 140 140 70 20 On*
3pm – 4pm 0 0 140 140 70 20 On*
4pm – 5pm 0 0 140 140 70 20 On*
5pm – 6pm 0 300 210 510 105 20 On*
6pm – 7pm 0 300 210 510 105 20 On*
7pm – 8pm 0 300 210 510 105 20 On*
8pm – 9pm 0 300 210 510 105 20 On*
9pm – 10pm 0 300 210 510 105 20 On*
10pm – 11pm 0 0 0 0 0 20 On*
11pm – 12am 0 0 0 0 0 20 On*
Table 16: Internal heat loads, and heating and cooling setpoints - for living spaces that do not include a kitchen (ABCB, 2006)
* Refer to Table 19 for the cooling setpoint appropriate for the development’s climate zone.
Note: All units must be modelled with at least one zone that uses the schedule of internal gains ‘for living spaces including kitchens’; even where the developer does not install any cooking equipment in a unit, it is assumed that the future tenant will retrofit the unit with some form of cooking equipment.
If a unit contains further living space, in addition to the area zoned with the kitchen, the schedule below may be used.

49Date Issued: July 2009
TimeSensible heat load (Watts)
Latent heat loads
(Watts)
Heating
setpoint (°C)
Cooling
setpoint (°C)Appliances and cooking
Lighting People Total
12am – 1am 0 0 200 200 100 15 On*
1am – 2am 0 0 200 200 100 15 On*
2am – 3am 0 0 200 200 100 15 On*
3am – 4am 0 0 200 200 100 15 On*
4am – 5am 0 0 200 200 100 15 On*
5am – 6am 0 0 200 200 100 15 On*
6am – 7am 0 0 200 200 100 15 On*
7am – 8am 0 0 0 0 0 18 On*
8am – 9am 0 0 0 0 0 18 On*
9am – 10am 0 0 0 0 0 Off Off
10am – 11am 0 0 0 0 0 Off Off
11am – 12pm 0 0 0 0 0 Off Off
12pm – 1pm 0 0 0 0 0 Off Off
1pm – 2pm 0 0 0 0 0 Off Off
2pm – 3pm 0 0 0 0 0 Off Off
3pm – 4pm 0 0 0 0 0 Off Off
4pm – 5pm 0 0 0 0 0 18 On*
5pm – 6pm 0 0 0 0 0 18 On*
6pm – 7pm 0 0 0 0 0 18 On*
7pm – 8pm 0 100 0 100 0 18 On*
8pm – 9pm 0 100 0 100 0 18 On*
9pm – 10pm 0 100 0 100 0 18 On*
10pm – 11pm 0 100 200 300 100 18 On*
11pm – 12am 0 0 200 200 100 18 On*
Table 17: Internal heat loads, and heating and cooling setpoints - for bedrooms (ABCB, 2006)
* Refer to Table 19 for the cooling setpoint appropriate for the development’s climate zone.

50Date Issued: July 2009
TimeSensible heat load (Watts)
Latent heat loads
(Watts)
Heating
setpoint (°C)
Cooling
setpoint (°C)Appliances and cooking
Lighting People Total
12am – 1am 0 0 0 7 0 Off Off
1am – 2am 0 0 0 7 0 Off Off
2am – 3am 0 0 0 7 0 Off Off
3am – 4am 0 0 0 7 0 Off Off
4am – 5am 0 0 0 7 0 Off Off
5am – 6am 0 3.5 0 7 0 Off Off
6am – 7am 0 3.5 0 7 0 20 On*
7am – 8am 0 7 0 7 0 20 On*
8am – 9am 0 7 0 7 0 20 On*
9am – 10am 0 7 0 7 0 20 On*
10am – 11am 0 7 0 7 0 20 On*
11am – 12pm 0 3.5 0 7 0 20 On*
12pm – 1pm 0 3.5 0 7 0 20 On*
1pm – 2pm 0 3.5 0 7 0 20 On*
2pm – 3pm 0 3.5 0 7 0 20 On*
3pm – 4pm 0 3.5 0 7 0 20 On*
4pm – 5pm 0 3.5 0 7 0 20 On*
5pm – 6pm 0 7 0 7 0 20 On*
6pm – 7pm 0 7 0 7 0 20 On*
7pm – 8pm 0 7 0 7 0 20 On*
8pm – 9pm 0 7 0 7 0 20 On*
9pm – 10pm 0 7 0 7 0 20 On*
10pm – 11pm 0 7 0 7 0 20 On*
11pm – 12am 0 3.5 0 7 0 20 On*
Table 18: Internal heat loads, and heating and cooling setpoints - for foyers, lobbies, hallways and corridors areas (not part of a private dwelling)
* Refer to Table 19 for the cooling setpoint appropriate for the development’s climate zone.
N.B: The heat loads presented in this schedule are Watt per square meter. This is different to each of the previous schedules, where the heat loads are presented in Watts for the whole area.
It is assumed that the occupancy of these spaces is transitory and therefore does not contribute any significant heat load to the space. For the purposes of modelling the HVAC energy consumption, the heat gains from lighting are based on the standard practice lighting power density for Foyers, hallways and corridors, used in the common areas lighting benchmark (7 W/m2) and as for the lighting benchmark, occupancy sensors are present which reduces the hours of occupancy by 40% (from 24 hours to 14.4 hours).

51Date Issued: July 2009
Table 19: Cooling setpoints for each NatHERS climate zone (ABCB, 2006)
Internal heat loads, and heating and cooling setpoints - for amenities
Other areas which are to be conditioned (such as gymnasiums, pools, common laundries etc) should be modelled using a schedule of internal loads proposed and justified by the design team.
COOLING SETPOINTS FOR EACH NATHERS CLIMATE ZONE
NatHERS climate regionCooling
setpoint (°C)1 Darwin 26.5
2 Port Hedland 27.0
3 Longreach 27.0
4 Carnarvon 26.0
5 Townsville 26.5
6 Alice Springs 26.5
7 Rockhampton 26.0
8 Moree 26.0
9 Amberley 26.0
10 Brisbane 25.5
11 Coffs Harbour 25.0
12 Geraldton 25.0
13 Perth 25.0
14 Armidale 24.0
15 Williamtown 25.0
16 Adelaide 25.0
17 Sydney East 25.5
18 Nowra 24.5
19 Charleville 27.0
20 Wagga 25.0
21 Melbourne 24.0
22 East Sale 23.0
23 Launceston 22.5
24 Canberra 24.0
25 Cabramurra 23.0
26 Hobart 23.0
27 Mildura 25.0
28 Richmond 24.5
29 Weipa 26.0
30 Wyndham 27.5
31 Willis Island 26.5
32 Cairns 26.5
33 Broome 27.0
34 Learmouth 26.5
35 Mackay 26.0
NatHERS climate regionCooling
setpoint (°C)36 Gladstone 26.0
37 Halls Creek 27.0
38 Tennant Creek 27.0
39 Mt Isa 27.0
40 Newman 28.0
41 Giles 27.5
42 Meekatharra 28.0
43 Oodnadatta 27.0
44 Kalgoorlie 26.0
45 Woomera 26.0
46 Cobar 26.5
47 Bickley 24.5
48 Dubbo 25.0
49 Katanning 24.5
50 Oakley 25.0
51 Forrest 25.5
52 Swanbourne 25.0
53 Ceduna 24.5
54 Mandurah 25.0
55 Esperance 24.0
56 Mascot 24.5
57 Manjimup 23.5
58 Albany 23.5
59 Mt Lofty 23.0
60 Tullamarine 24.0
61 Mt Gambier 23.5
62 Moorabbin 24.0
63 Warrnambool 23.0
64 Cape Otway 23.0
65 Orange 23.0
66 Ballarat 23.5
67 Low Head 23.0
68 Launceston Air 23.5
69 Thredbo 22.5

52Date Issued: July 2009
APERTURE SCHEDULES FOR ALL SPACE TYPES
If there are openable windows, the windows in the building are modelled as being open when the indoor space is above 20°C and are shut when indoor temperature exceeds the cooling setpoint specified for the development’s climate zone. The air conditioning system is modelled as off when the windows are open and on (according to schedules and set points listed in the previous section) when natural ventilation cannot maintain indoor temperatures.

53Date Issued: July 2009
APPENdIX d: PROTOCOL FOR CALCULATING LIGHTING ENERGY REdUCTION dUE TO dAYLIGHT dIMMING

54Date Issued: July 2009
Contour line representing
DF=2.5%Lighting zone
boundary
Note: Due to the complexity of modelling, a reduction in HVAC loads due to daylight dimming or switching should only be included if there will be a substantial reduction compared to the base case (i.e. greater than 2% of total energy consumption). The calculation methodology for use of daylight dimming or switching should be submitted to the GBCA via a CIR prior to submission.
For lighting plug loads the following methodology must be used. A worked example from Adelaide is included for reference. The lighting zone adjacent to the southern perimeter (floor area of 500m²) features daylight dimming, such that the light output from dimming ballasts is adjusted to maintain an illuminance of 320 lux. The lighting power density of the system (no dimming) is 8W/m².
Determine the minimum daylight factor achieved within the zone between 9am and 5pm, as measured at the working plane.1.
For the modelled example, the minimum daylight factor (DF) achieved in the zone at the working plane is calculated to be •2.5%, as illustrated below
Determine the external horizontal illuminance, Eh, that must occur in order for an internal illuminance of 320 lux to 2. be achieved at the working plane. The following formula applies:
Eh = E x 100%
Daylight Factor
Figure 17: Daylight factor model output

55Date Issued: July 2009
where:
Ei = interior illuminance at a point from a sky of assumed luminance distribution (lux)
Eh = the simultaneous external horizontal illuminance on an unobstructed horizontal plane from a sky of the same assumed luminance distribution (lux)
For the modelled example, the minimum horizontal illumance, Eh, that must occur to achieve an internal •illuminance, Ei, of 320 lux at the working plane is calculated to be 12.8 kilo lux as below
Eh = E x 100%
Daylight Factor = 320 x 100% 2.5
= 12.8 kilo lux
Determine the percentage of operational hours between 9am and 5pm for which this horizontal illuminance is 3. exceeded, based on the table below
Table 20: Diffuse horizontal Illuminance values for each climate zone
Percentage Working Year Illuminance is Exceeded
Diffuse Horizontal Illuminance (kilo lux)
Sydney Perth / Adelaide Broken Hill Brisbane Mount Isa Port Hedland Darwin
Climatic Zone Temperate Temperate Hot arid Sub-tropical Hot arid Hot arid Hot humid
Location on map (below) 3b 3b 2 1b 2 2 1a
100 0.0 1.3 0.0 0.0 8.0 4.2 7.6
95 6.3 7.0 4.6 4.7 9.3 6.7 10.8
90 8.8 8.8 5.9 7.9 10.2 7.5 12.7
85 10.6 9.7 6.6 8.8 11.1 7.9 13.3
80 11.3 10.5 7.2 9.4 11.4 8.4 14.8
75 13.3 11.1 7.6 10.1 11.9 8.6 16.1
70 14.5 11.9 8.0 11.0 12.3 8.8 17.8
65 16.1 12.6 8.4 12.8 12.7 9.1 19.0
60 18.4 14.2 8.7 15.8 13.2 9.4 19.8
55 19.9 15.8 9.1 19.0 13.8 9.7 21.3
50 22.0 17.2 9.6 21.0 14.7 10.1 23.1
45 23.3 18.1 10.2 22.4 16.0 13.2 24.4
40 24.1 18.9 12.9 23.8 17.9 15.2 25.5
35 26.7 20.2 14.7 25.9 19.2 16.8 26.4
30 28.2 21.2 16.5 27.3 20.4 17.7 27.9
25 30.2 22.3 17.4 29.7 21.7 19.3 29.6
20 32.4 23.7 21.0 31.8 23.0 20.2 31.5
15 34.3 25.1 23.2 34.0 24.9 22.3 32.4
10 36.9 26.8 27.4 37.1 26.0 24.1 34.4
5 39.4 29.5 32.5 40.7 28.3 28.8 37.8
0 44.9 53.7 39.6 51.0 44.0 49.0 43.0

56Date Issued: July 2009
The above table is sourced from the Illuminating Engineering Society of Australia (IESA) publication ‘Skylight Availability in Australia – Data and their Application to Design’ by N.C. Ruck PhD (IESA, 2001). This document provides data for a limited number of locations, and only between 9am and 5pm. The locations were chosen as being “representative of the major climatic zones on the Australian continent, together with their latitudes and climatic classification”.
It is recommended that the closest location with the closest climatic zone of the project be chosen for this calculation. Projects in Melbourne should use the values stated for Sydney.
For the modelled example, from the lookup table provided, an external horizontal illuminance of 12.6klx is exceeded for 65% •of hours between 9am and 5pm in Adelaide.
To obtain the lighting power density that should be modelled, multiply the lighting power density (no dimming) by 4. the proportion of hours for which artificial lighting is required (i.e. for which 320lux daylight is not exceeded).
For the modelled example, the lighting power density would be: 8W/m² x 35% = 2.8W/m²•

57Date Issued: July 2009
APPENdIX E: THE GREEN STAR MULTI UNIT RESIdENTIAL V1 ENERGY BENCHMARKS
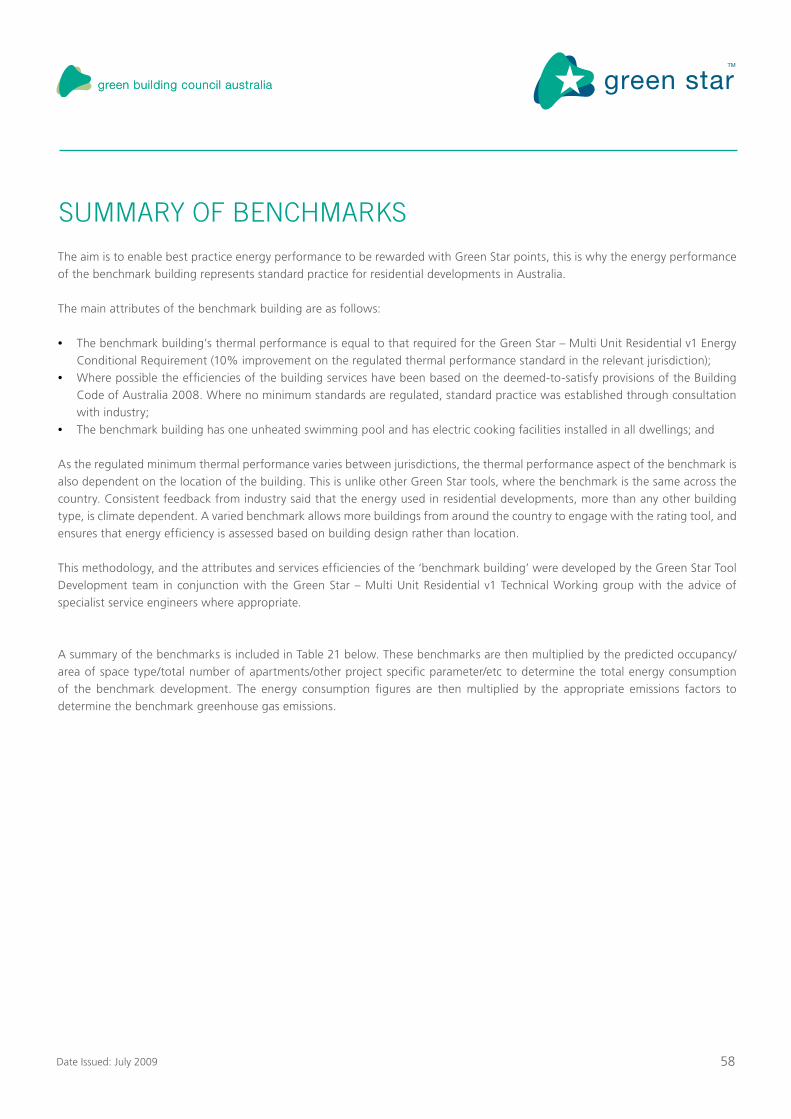
58Date Issued: July 2009
The aim is to enable best practice energy performance to be rewarded with Green Star points, this is why the energy performance of the benchmark building represents standard practice for residential developments in Australia.
The main attributes of the benchmark building are as follows:
The benchmark building’s thermal performance is equal to that required for the Green Star – Multi Unit Residential v1 Energy •Conditional Requirement (10% improvement on the regulated thermal performance standard in the relevant jurisdiction);Where possible the efficiencies of the building services have been based on the deemed-to-satisfy provisions of the Building •Code of Australia 2008. Where no minimum standards are regulated, standard practice was established through consultation with industry;The benchmark building has one unheated swimming pool and has electric cooking facilities installed in all dwellings; and•
As the regulated minimum thermal performance varies between jurisdictions, the thermal performance aspect of the benchmark is also dependent on the location of the building. This is unlike other Green Star tools, where the benchmark is the same across the country. Consistent feedback from industry said that the energy used in residential developments, more than any other building type, is climate dependent. A varied benchmark allows more buildings from around the country to engage with the rating tool, and ensures that energy efficiency is assessed based on building design rather than location.
This methodology, and the attributes and services efficiencies of the ‘benchmark building’ were developed by the Green Star Tool Development team in conjunction with the Green Star – Multi Unit Residential v1 Technical Working group with the advice of specialist service engineers where appropriate.
A summary of the benchmarks is included in Table 21 below. These benchmarks are then multiplied by the predicted occupancy/area of space type/total number of apartments/other project specific parameter/etc to determine the total energy consumption of the benchmark development. The energy consumption figures are then multiplied by the appropriate emissions factors to determine the benchmark greenhouse gas emissions.
SUMMARY OF BENCHMARKS

59Date Issued: July 2009
Parameter Benchmark details
HVAC Benchmark
The HVAC benchmark is calculated with the following parameters:•The benchmark thermal performance is equal to the thermal performance •required for the Ene-Conditional requirement.EER of benchmark heating system = 3.5•COP of benchmark cooling system = 3.2•30% additional energy is assumed to be used for pumps and fans•
Lighting benchmarks
dwellings 12.7kWh/year per m2 benchmark dwelling area
foyers, hallways, corridors
36.8kWh/year per m2 benchmark foyer, hallway, corridor area
amenities 35.0kWh/year per m2 benchmark amenity area
Back of house 17.5kWh/year per m2 benchmark back of house area
Internal car park entry zone
107.3kWh/year per m2 for the first 100m2 internal car park area
Internal car park general areas
39.4kWh/year per m2 for the remaining benchmark internal car park area
outdoor car park 19.7kWh/year per m2 benchmark outdoor car park area
external lighting 26.3kWh/yr per linear metre lit external walkway
Hot water benchmarks
Energy required to heat water to meet demand
4,077MJ(gas)/year per person
Storage system losses 2,482MJ(gas)/year per apartment
Distribution system losses
0
Lifts benchmark
≤ 3 storeys 0
>3 storeysBenchmark depends on the number of lifts in the proposed building along with their travelling distance
Escalator and travelator benchmark 0
Pools benchmark 2061.4kWh/year per development
Spas and saunas benchmark 0
CookingCook top (electric) 144kWh/year per apartment + 36kWh/year per person
Oven (electric) 118.5kWh/year per apartment + 29.6kWh/year per person
On-site electricity generation benchmark 0
Table 21: Summary of Benchmarks

60Date Issued: July 2009
SUMMARY OF BENCHMARKS
As described in the previous section, each energy benchmark is multiplied by a project specific parameter to establish the benchmark energy consumption for that end use (except for the swimming pools benchmark which is a per development benchmark). The project specific parameters include:
Benchmark occupancy•Benchmark number of apartments and number of storeys•Benchmark areas of each space type•Benchmark number of lifts and lift travel distances•
This section defines how the project specific parameters are established.
In addition to the four project specific parameters listed above, the benchmark heating and cooling loads are also project specific and depend on the project’s thermal performance requirements for the Green Star – Multi Unit Residential v1 Energy Conditional Requirement. Details are included in the following section.
Benchmark occupancy
The assumed occupancy of the benchmark development is established by multiplying the number of each type of apartment with the assumed occupancy of that apartment type. The assumed occupancy of each apartment type is given in Table 22: Assumed occupancy for each apartment type.
Benchmark number of apartments and number of storeys
The benchmark number of apartments and number of storeys is equal to the proposed development’s number of apartments and number of storeys.
Apartment typeAssumed occupancy (persons per
apartment)
Studio/1 bedroom 2
2 bedroom 3
3 bedroom 4
4 bedroom 5
5+ bedroom 6
Table 22: Assumed occupancy for each apartment type

61Date Issued: July 2009
Benchmark areas of each space type
The total area of the benchmark’s dwellings is equal to which ever is lower out of:The total area of the proposed developments’ dwellings; or •The sum of the number of apartments of each type multiplied by the standard areas of that apartment type, as given in Table •23: Standard area for each apartment type.
The areas of the other space types are equal to which ever is lower out of:The area of that space type in the proposed developments•The area established by the assumptions given in Table 24: Assumptions for standard areas of all space types apart from •dwellings
Benchmark number of lifts and lift travel distances
If the proposed development has three or less storeys, the benchmark development is assumed to contain no lifts. If the proposed development has more than three storeys, the benchmark development has the same number of lifts as the proposed development and the lifts have the same travel distance.
Apartment typeStandard area for each apartment
type (m2)
Studio/1 bedroom 80
2 bedroom 120
3 bedroom 160
4 bedroom 200
5+ bedroom 240
Space type Assumption
Foyers, lobbies, hallways and corridors 10m2 per apartment.
Amenities2m2 per apartment
(for developments with greater that 20 apartments only)
Back of House2m2 per apartment
(for developments with greater that 20 apartments only)
Indoor car parking 1 space per apartment, 30m2 per space.
Outdoor car parking1 space per apartment, 30m2 per space
Minus the area already assumed for indoor car parking
Table 23: Standard area for each apartment type
Table 24: Assumptions for standard areas of all space types apart from dwellings

62Date Issued: July 2009
BENCHMARK THERMAL PERFORMANCE
The benchmark total thermal load is equal to the project’s thermal performance conditional requirement, defined in the Green Star – Multi Unit Residential v1 Ene-Conditional credit. The Ene-Conditional credit states ‘To meet the conditional requirement, the average thermal performance of the dwellings must be improved by 10% compared to the regulated thermal performance standard in the relevant jurisdiction.’ For more information on how the thermal performance requirement should be calculated, see the Green Star – Multi Unit Residential v1 Technical Manual, Ene-Conditional credit; the additional guidance includes example calculations.
The total thermal load is then apportioned into heating and cooling loads. The ratio of heating to cooling loads for each climate zone is based on data developed by the Department of the Environment, Water, Heritage and the Arts in the report ‘Energy use in the Australian residential sector, 1986-2020’ (DEWHA, 2008). The ratio of heating to cooling loads for each NatHERS climate zone is presented in Table 25.
For example, the heating and cooling loads – for a development in Canberra is established as follows:
The Ene-conditional requirement for a development in Canberra was calculated by the design team to be 255.6 MJ/m• 2/year.According to Table 25, 10% of the thermal load in Canberra can be assumed to be cooling load and 90%, heating load.•
Therefore:The benchmark cooling load of a development in Canberra = 25.6 MJ/m2/yearThe benchmark heating load of a development in Canberra= 230.0 MJ/m2/year
How the ratios of heating to cooling were established
Department of the Environment, Water, Heritage and the Arts report ‘Energy use in the Australian residential sector, 1986-2020’ estimated the average heating and cooling loads for all dwellings in Australia, from 1986 to 2020 in order to estimate the energy consumption from this end use over this time period. For the purposes of the Green Star – Multi Unit Residential v1 thermal performance benchmark, we have assumed that the ratio of heating to cooling loads used in the report is applicable to the benchmark dwelling.
In the report, each NatHERS climate zone (69 in total) was assigned to one of ten ‘heating load’ groups and one of ten ‘cooling load’ groups (Tables 49 and 50, DEWHA, 2008). A typical thermal load for each group was then established using AccuRATE (Table 51, DEWHA, 2008). It is the ratio of the heating to cooling loads established in this report, for each climate zone, which is used to establish the benchmark heating and cooling loads applicable to the project being assessed.

63Date Issued: July 2009
Table 25: Ratio of heating to cooling loads for each NatHERS climate zone
NatHERS Climate Zone
% load
which is
heating
% load
which is
cooling
1 Darwin 0% 100%
2 Port Hedland 2% 98%
3 Longreach 19% 81%
4 Carnarvon 35% 65%
5 Townsville 2% 98%
6 Alice Springs 34% 66%
7 Rockhampton 2% 98%
8 Moree 53% 47%
9 Amberley 35% 65%
10 Brisbane 45% 55%
11 Coffs Harbour 71% 29%
12 Geraldton 35% 65%
13 Perth 53% 47%
14 Armidale 91% 9%
15 Williamtown 73% 27%
16 Adelaide 64% 36%
17 Sydney East 71% 29%
18 Nowra 79% 21%
19 Charleville 34% 66%
20 Wagga 81% 19%
21 Melbourne 86% 14%
22 East Sale 91% 9%
23 Launceston 96% 4%
24 Canberra 90% 10%
25 Cabramurra 97% 3%
26 Hobart 96% 4%
27 Mildura 64% 36%
28 Richmond 64% 36%
29 Weipa 0% 100%
30 Wyndham 0% 100%
31 Willis Island 0% 100%
32 Cairns 2% 98%
33 Broome 1% 99%
34 Learmouth 2% 98%
35 Mackay 2% 98%
NatHERS Climate Zone
% load
which is
heating
% load
which is
cooling
36 Gladstone 4% 96%
37 Halls Creek 1% 99%
38 Tennant Creek 2% 98%
39 Mt Isa 19% 81%
40 Newman 19% 81%
41 Giles 19% 81%
42 Meekathara 35% 65%
43 Oodnadatta 19% 81%
44 Kalgoorlie 53% 47%
45 Woomera 53% 47%
46 Cobar 64% 36%
47 Bickley 73% 27%
48 Dubbo 81% 19%
49 Katanning 64% 36%
50 Oakey 53% 47%
51 Forrest 64% 36%
52 Swanbourne 76% 24%
53 Ceduna 73% 27%
54 Mandurah 63% 37%
55 Esperance 86% 14%
56 Mascot 72% 28%
57 Manjimup 86% 14%
58 Albany 94% 6%
59 Mt Lofty 97% 3%
60 Tullamarine (Airport) 91% 9%
61 Mt Gambier 95% 5%
62 Moorabbin (Airport) 92% 8%
63 Warrnambool 94% 6%
64 Cape Otway 95% 5%
65 Orange 97% 3%
66 Ballarat 92% 8%
67 Low Head 95% 5%
68 Launceston (Airport) 97% 3%
69 Thredbo Village 97% 3%
64Date Issued: July 2009
HVAC BENCHMARK
LIGHTING BENCHMARK
The benchmark dwellings are served by a ducted reverse-cycle air conditioning system which meets 100% of the load. The system’s EER is 3.2 and COP is 3.5. As the systems is ducted, the energy consumption from the fan is not included in the EER or COP. Therefore, it is assumed that 30% additional energy will be consumed by the system to power the pumps and fans.
The energy consumption of the air conditioning system will depend on the heating and cooling loads of the benchmark building, which depends on the conditional requirement for the project as described in the previous section.
Firstly, the heating and cooling loads are converted into kWh/m2 from MJ/m2 by dividing by 3.6. The heating and cooling loads are
The lighting benchmarks are the assumed yearly energy consumption from lighting, per square metre, for each space type (see Appendix A – Space type definitions, for further details). The only exception being the benchmark for external lighting; which is the assumed yearly energy consumption per linear metre of lit walkway. In the Excel tool, these benchmarks are multiplied by the benchmark building areas (or length of lit walkway) to calculate the benchmark lighting energy consumption for the whole development.
The lighting benchmarks were calculated as follows:
(N.B.: dividing the right hand side of the equation by 1000 converts the result from Wh/m2/yr into kWh/m2/yr)
Heating energy benchmark (kWh/m2/yr)
=Heating load (kWh/m2)
x 130%3.5
Cooling energy benchmark (kWh/m2/yr)
=Cooling load (kWh/m2)
x 130%3.2
Lighting benchmark (kWh/m2/yr)=
Standard Practice Lighting Density (W/m2) x Hours of operation per year
1000
65Date Issued: July 2009
Table 26 presents the standard practice lighting densities, the assumed hours and days of operation, along with the resulting lighting benchmarks (annual energy consumption for lighting, per square metre), for each space type.
The figures used to determine the lighting benchmark, were established through consultation with lighting engineers. Standard practice lighting densities for most space types were advised to be the BCA maximum lighting densities, with a few exceptions. Details on assumptions for each space type follow.
Dwellings
The lighting benchmark has been developed assuming 50% of the dwelling is comprised of living areas and 50% sleeping areas.Living areas – The BCA (2008), does not give a maximum lighting power density for residential living areas. However, Table •J6.2a, does give a maximum lamp power density of 5W/m2, for spaces of a similar function; ‘…frequently occupied (areas) such as a lounge area or a dining room’. This was assumed to be standard practice. The hours of operation for the living areas are those given in the ABCB Protocol for House Energy Rating Software (2006).Sleeping areas – The BCA (2008), does not give a maximum lighting power density for residential sleeping areas. However, •Table J6.2a, does give a maximum lamp power density of 8W/m2, spaces of similar function; ‘within a dormitory of a Class 3 building used only for sleeping’. This was assumed to be standard practice. The hours of operation for the living areas and sleeping areas are those given in the ABCB Protocol for House Energy Rating Software.
Space typeStandard practice
lighting density (W/m²)
Hours of operation per day (hours)
Days of operation per year
Lighting Benchmark (Annual energy con-sumption per square
metre, kWh/m2/yr)
Dwellings
Living areas
8 6.2 36512.7
Sleeping areas
5 4 365
Foyers, hallways, cor-ridors
7 14.4 365 36.8
Amenities 8 12 365 35.0
Back of House 6 8 365 17.5
Indoor car park
Entry zone lighting (daylight hours)
20 12 365
107.3Entry zone lighting (non-
daylight hours)
4.5 12 365
Standard car park lighting
area
4.5 24 365 39.4
Outdoor car park 4.5 12 365 19.7
External lighting (per linear metre)
5.3 (W/m) 12 365 23.2(kWh/m/yr)
Table 26: Parameters used to determine the lighting benchmarks

66Date Issued: July 2009
Foyers, hallways, corridors
The BCA (2008), Section J6.2, gives a maximum artificial lamp power density requirement of 7W/m2 for ‘within public corridors, stairways and the like’. The hours of operation are set assuming occupancy sensors are present that activate the lighting for 14.4 hours per day (this is a 40% reduction on the 24 hours which otherwise be assumed for areas with no occupancy sensors), 365 days per year.
Amenities
The BCA (2008), Section J6.2, gives a maximum lamp power density requirement of 8W/m2 for ‘…areas such as lounge rooms or dining rooms’. The hours of operation are based on the assumption that the amenities spaces are open for 12 hours per day, 365 days per year.
Back of house
The BCA (2008), Section J6.2, gives a maximum lamp power density requirement of 6W/m2 for ‘service areas such as plant rooms or store rooms’. The benchmark hours are set based on an assumption that the back of house spaces will be occupied for 8 hours per day, 365 days per year.
Indoor car parks
The benchmark for indoor car parks was established by considering the lighting requirements for the ‘entry zone’ and for the rest of the car park (referred to below as general car park), separately.
Entry zone lighting – In order to facilitate a gradual adjustment from the bright conditions observed outside during the day, •to internal artificial light, contrast lighting is required. Consultation with lighting designers recommended a standard practice power density of 20W/m2. The contrast lighting operates for an average of 12 hours per day. During the other 12 hours of the day, the lighting of the entry zone is assumed to be the same as the rest of the car park (4.5W/m2).
General car park lighting – All other areas of the car park are assumed to be lit for 24 hours per day with a lighting power •density of 4.5W/m2. This lighting density was provided by consultation with lighting designers.
Outdoor car parks
The benchmark for outdoor car parks was calculated using the same lighting power density as general indoor car park lighting. The benchmark hours were set based on an assumption that timer controls present that activate the lighting for 12 hours per day, 365 days per year.
External lighting
The external lighting benchmark was calculated as energy consumption per linear metre. 5.3W/m is used as standard practice. This is the average of three common external lighting systems; bollard lighting (typically 26W per 5m = 5.2W/m); post lighting (typically 70W per 15m = 4.7W/m) and low level lighting (typically 8W per 3m = 6W/m).

67Date Issued: July 2009
HOT WATER BENCHMARK
The hot water benchmarks have been developed based on the following assumptions; a standard practice hot water system is a non-centralised, 80% efficient gas storage system, with a declared heat loss of 6.8MJ/day; and that each dwelling has 4 Star WELS rated taps and 3 Star WELS rated showerheads installed.
The energy consumption from a hot water system was calculated as follows for the purposes of Green Star – Multi Unit Residential v1 energy calculations:
This benchmark figure is calculated on a per person basis by multiplying the annual hot water demand per person (in litres), by the energy required to heat one litre of water (from 15°C to 60°C).
Calculation of annual hot water demand per person• It is assumed that it is standard practice to install 4 Star WELS rated taps and 3 Star WELS rated showerheads. These values were
prepared in consultation with the WELS section of the Department of the Environment, Water, Heritage and the Arts.
N.B. 3 Stars is the highest WELS rating currently available for showerheads. A showerhead is registered under a 3 star rating if the performance is between 9 and 7.5L/min. 9L/min is used in the benchmark, hence improvements in water efficiency can be still be achieved by the design team.
The usage rates assumed for these types of fittings can be found in the Green Star – Multi Unit Residential v1 Water Calculator Guide, available from www.gbca.org.au. The daily demand for water is calculated based on the usage rates and the water efficiency (defined by the WELS rating); 50% of this water demand is assumed to be hot water. Table 28 shows how the total annual hot water demand per person was calculated.
Benchmark for ‘Energy required to heat the necessary water to meet demand (including system efficiencies)’
This resulted in three separate benchmarks, given in Table 18: Hot water benchmarks. Details on how each benchmark was derived is given below.
Benchmark hot water energy consumption
=Energy required to heat the necessary water to meet demand (including system efficiencies)
+ Storage system losses +Distribution system losses (centralised systems only)
Hot water benchmarks
Energy required to heat the necessary water to meet demand (including system
efficiencies)4,077MJ(gas)/year per person
Storage system losses 2,482MJ(gas)/year per apartment
Distribution system losses 0
Table 27: Hot water benchmarks

68Date Issued: July 2009
Fixture/FittingWELS Star
ratingDaily water
demand (L/person)% of water
assumed hotDays per year
Annual hot water demand
(L/year per person)
Bathroom taps 4 Star7 x 0.15 minute uses per person per day
= 7.875
50% 365
1,437
Kitchen taps 4 Star4 x 0.5 minute uses per person per day
=152,738
Showerheads 3 Star1 x 8 minute use per person per day = 72
TOTAL 17,315
Table 28: Calculation of annual hot water demand per person
Energy required to raise the temperature of one litre of water, from 15°C to 60°C with the benchmark hot water system (kJ/L)
=Specific heat capacity of water
(kJ/L°C)x
Change in temperature required (°C)
= 4.186 x 45°C
80%
= 235.5kJ(gas)/L
= 0.2355MJ(gas)/L
Energy required to meet hot water de-mand of one person(MJ(gas)/year per person)
=Annual hot water demand per
person (L/year per person)x
Energy required to pro-vide 1L hot water (MJ/L)
= 17,315 x 0.2355MJ/L
= 4077MJ(gas)/yr per person
Calculation of the energy required to heat one litre of water (MJ/L)•The specific heat capacity of water is 4.186kJ/kg°C. This means that it takes 4.186kJ of energy to raise the temperature of one kilogram of water by one degree. If the system used to heat the water is not 100% efficient, more energy will be required.
To heat one litre of water (N.B.: one litre of water = one kilogram of water), from 15°C to 60°C, by a system that is 80% efficient, will require the following amount of energy:
Using the figures calculated for annual demand for hot water per person and the energy required to heat one litre of water from 15°C to 60°C, the benchmark energy required to meet the hot water demand of one person is calculated as follows:
System efficiency

69Date Issued: July 2009
Benchmark for ‘Storage system losses’
The system losses, per storage system, are calculated by multiplying the manufacturers declared heat loss (MJ/day) by 365 days. It is assumed for the benchmark case that each apartment has its own dedicated hot water system therefore the number of systems in the development is equal to the number of apartments. In the Excel tool, this benchmark figure is multiplied by the number of apartments in the development.
It was advised that for an apartment to be occupied by two to four people, a typical hot water storage system capacity would range from 130L to 135L, and that a typical declared heat loss from such a system would be 6.8MJ/day. This was based on the assumption that a standard practice heat losses from a gas storage water heater would be equal to the maximum allowable heat losses from an electric storage water heater of similar capacity, as defined by the Minimum Energy Performance Standard Requirements for Electric Storage Water Heaters (AS/NZS 4692.2:2005).
Benchmark for ‘Distribution system losses’
As the benchmark hot water system is not a centralised system (i.e. there is a hot water tank in each apartment), the distribution losses are set at zero. The same assumption can be made by design teams whose projects do not have centralised systems as the distribution losses are assumed to be small in comparison to the other energy requirements. These losses only need to be included if the hot water is provided by a centralised system, which services a number of apartments.
Storage system losses, per apartment (MJ(gas)/year per apartment)
= Declared heat loss (MJ/day) x 365 days
= 6.8MJ/day x 365 days
= 2482MJ(gas)/yr per apartment
MECHANICAL VENTILATION BENCHMARK
There are three types of mechanical ventilation systems assessed in the Green Star – Multi Unit Residential v1 Greenhouse Gas Emission Calculator. These include domestic mechanical exhausts, back-of-house and amenity mechanical ventilation and car park ventilation.
Domestic mechanical exhausts
The benchmark for dwelling exhaust systems assumes one 0.5kW bathroom exhaust and one 0.5kW kitchen exhaust, each operating for 30 minutes per day, for each apartment.
Domestic mechanical exhaust benchmark (kWh/yr per apart-ment.)
= No. exhausts xPower consumption of exhaust (kW)
xHours of operation per year
= 2 x 0.5 x (0.5 x 365)
= 182.5kWh/yr per apartment

70Date Issued: July 2009
Back-of-house and amenities mechanical ventilation
Back-of-house and amenities mechanical ventilation is considered non-standard equipment and is not included in the benchmark building and as such, has a benchmark energy consumption of zero.
Back-of-house and amenities mechanical ventilation benchmark
= 0kWh/yr
Car park ventilation
The benchmark for car park ventilation is based on a mechanical supply and exhaust system controlled by carbon monoxide (CO) monitoring and variable speed drive (VSD) fans. VSD fans are assumed to turn down to 0% minimum. Industry expertise and research has shown this system to consume 42.33kWh/m2/yr based on the profile shown in Table 29.
Car park ventilation benchmark = 42.33kWh/year per m2 of internal car park.
TimeFan Flow (with CO monitoring
and VSD fans)
12am – 1am 0%
1am – 2am 0%
2am – 3am 0%
3am – 4am 0%
4am – 5am 0%
5am – 6am 5%
6am – 7am 10%
7am – 8am 60%
8am – 9am 100%
9am – 10am 100%
10am – 11am 50%
11am – 12pm 40%
12pm – 1pm 40%
1pm – 2pm 40%
2pm – 3pm 40%
3pm – 4pm 50%
4pm – 5pm 100%
5pm – 6pm 100%
6pm – 7pm 75%
7pm – 8pm 50%
8pm – 9pm 20%
9pm – 10pm 0%
10pm – 11pm 0%
11pm – 12am 0%
Table 29: Fan flow variation with CO monitoring and VSD fans for car park ventilation

71Date Issued: July 2009
Parameter Benchmark lift
Building size (max travel
distance)†
Small residential
(max travel distance
<14m)
Low rise (max travel
distance <45m)
Medium rise (max travel
distance <80m)
High rise (max travel
distance >80m)
Number of trips‡ As proposed building (110,000 trips per year)
Average trip
time
Speed§ 0.63m/s 1.0m/s 1.75m/s 2.5m/s
DistanceThe distance travelled is the same as the proposed building. This figure is
required to be entered into the Excel tool by the design team.
Average power load** 7kW 10kW 17kW 25kW
(The benchmark lift does not have regenerative breaks)
Standby power 0.15kW
Standby hours per day 24 hours (The benchmark lift has no power off feature.)
Standby days per year 365 days
As for the proposed building, the following formula is used to calculate the annual energy consumption from the benchmark lifts (definitions for each are given in Table 30):
This formula has been adapted for Green Star from the Draft ISO standard ISO/DIS 25745-1: Energy performance of lifts and escalators - Part 1: Energy measurement and conformance.
Due to the number of variables involved, the Green Star – Multi Unit Residential v1 energy calculator works out the benchmark lift energy consumption based on the height of the proposed building. This ensures that the benchmark building lift energy consumption accurately reflects that of a standard multi-unit apartment building and can be accurately compared to the proposed building. As a number of parameters vary depending on the height of the building, the Excel tool calculates the lift energy consumption based on the formula above and using the figures in Table 30.
† Typical speeds associated with building sizes, distance of travel, and capacity of lift was from Schindler Lifts.
‡ Typical number of trips for a residential building is from Gina Barney’s presentation ‘Energy efficiency of lifts – measurement, conformance, modelling,
prediction and simulation’ (Barney, G. (2007))
§ As stated in previous footnote
** Power ratings for the typical speeds and capacity were established from the Code Of Practice For Energy Efficiency Of Lifts And Escalator Installations as required by the Electrical And Mechanical Services Department from the Government Of The Hong Kong Special Administrative Region, and as quoted on the Report on Energy Efficiency of Building Transport Equipment prepared for the Australian Building Codes Board (ABCB) as part of the ABCB’s Energy Efficiency
Project in August 2004.
Energy used by a lift per year (kWh):
=Number of trips
xAverage trip time
(s)x
Average power load
(kW))+
(Standby power(kW)
xStandby hours
per dayx
Standby days per year)
3600
Table 30: Definition of parameters used to calculate the energy consumption of a lift
LIFTS BENCHMARK

72Date Issued: July 2009
Escalators and travelators are considered non-standard facilities; therefore the benchmark energy consumption for escalators and travelators is zero.
Escalator and travelator benchmark = 0kWh/yr
The benchmark for pools is based on an outdoor un-heated 50,000 litre pool. This benchmark is independent of the size of the development – one development = one pool. The pool pump has a power rating of 1kW and is controlled by an intelligent pump controller. The pool has one halogen underwater pool light and is manually sanitised. The data used in the development of this benchmark was based on The Australian Greenhouse Office Report no. 2004/12, ‘Minimum Energy Performance Standards – Swimming Pools and Spa Equipment’.
The energy consumption from this pool has been calculated as follows:
Where:
Pumping energy has been calculated assuming that the pool has a 1kW pump, with a pump efficiency of 260l/min. The daily •turn-over is assumed to be 1.5 per day (based on the intelligent pump controller being programmed for 2 pool turn-overs in summer, 1.5 in spring/autumn and 1 in winter).
Heating energy is assumed to be zero, as only 5% of pools in Australia are heated.•The pool contains one 100W halogen under-water pool light, which is lit for 6 hours per day (it is not lit during daylight hours •as it is an outdoor pool). N.B. The only lighting energy included in the pool energy consumption benchmark is the underwater lighting. This is because any lighting of pool areas is to be included as External lighting (for outdoor pools), or Amenities lighting (for indoor pools).
LIFTS BENCHMARK
POOLS, SPAS ANd SAUNAS BENCHMARK
Benchmark pool energy consumption (kWh/yr)
=
Pumping energy
(kWh/yr)+
Heating energy
(kWh/yr)+
Under-water lighting energy
(kWh/yr)+
Sanitising equipment
energy(kWh/yr)
+
Timers and con-trols energy
(kWh/yr)
Pump energy con-sumption (kWh/yr)
= Pump power (kW) x
Time for one turn over (pool size (L) divided by pump efficiency (L/minute))
xNumber of turnovers per year (number of daily turn-overs x 365)
= 1 x (50,000/260) x (1.5 x 365)
= 1754.8kWh/yr

73Date Issued: July 2009
1000
1000
Pool lighting energy = Total lighting power (W) x Operational hours per year
consumption (kWh/yr) = 100 X (6 X 365) (N.B. dividing by 1000 converts the result from Wh/yr into kWh/yr)
1000
219kWh/yr=
Energy consumption by intelligent pump controller (kWh/yr
=Controller power consumption
(W) x Operational hours per year
= 10 X (24 X 365) (N.B. dividing by 1000 converts the result from Wh/yr into kWh/yr)
1000
= 87.6kWh/yr
Pools benchmark (kWh/yr) = 1754.8 + 0 + 219 + 0 + 87.6
= 2061.4kWh/yr per development
Spas and saunas benchmark
= 0kWh/yr
Sanitising equipment energy use is zero as the benchmark pool is manually sanitised.•The timers and controls for the benchmark pool comprise of one intelligent pump controller. The intelligent pump controller •is assumed to continuously use 10W.
The total benchmark energy consumption for pools is:
Spas and saunas are considered non-standard facilities; therefore the benchmark energy consumption for escalators and travelators is zero.

74Date Issued: July 2009
The benchmark cooking equipment is an electric oven and electric cook top.
The energy consumed by the benchmark oven and cook top is as follows:
COOKING BENCHMARK
Energy consumed by benchmark electric ovens (kWh/year)
= 50% x 237 x Number of apartments +50% x 237 x Occupancy of
development
Energy consumed by benchmark electric cook tops (kWh/year)
= 50% x 288 x Number of apartments +50% x 288 x Occupancy of
development
4
4
Basis for benchmark cooking systems
The Australian Bureau of Statistics report ‘Environmental Issues: Energy Use and Conservation’ (ABS, 2008) contains information on the Australian trends of cook top and oven ownership. The results used from the report in the cooking benchmark are as follows:
Benchmark oven fuel type:•In all states and territories, the most common fuel type used in ovens is electricity (75% of households use electricity, 20% mains gas and the remainder LPG/bottled gas) (ABS, 2008 pp43).The fuel type used for the Green Star – Multi Unit Residential v1 benchmark is therefore assumed to be electricity.
Benchmark cook top fuel type:•Electricity is the most commonly used fuel type for cook tops in Australia (55% of households use electricity, 36% mains gas and 8% LPB/bottled gas, with the remainder being wood, solar-photovoltaic and gas-electricity combined systems) (ABS, 2008 pp45). This trend does vary by state; in Victoria and Western Australia the most commonly used fuel type is mains gas. The fuel type used for the Green Star – Multi Unit Residential v1 benchmark is however, based on the most commonly used fuel type used for cook tops in Australia, and is therefore assumed to be electricity.
Basis for the energy consumed by cook tops and ovens (for the proposed as well as the benchmark development)
The following assumptions were used to estimate the energy consumed by cook tops and ovens in the Green Star – Multi Unit Residential v1 Greenhouse Gas Emissions calculator are based on the figures used in the Department of the Environment, Water, Heritage and the Arts in the report ‘Energy use in the Australian residential sector, 1986-2020’ (DEWHA, 2008) combined with data from Australian Bureau of Statistics report ‘Housing Occupancy and Costs’ (ABS, 2007), the Western Australian Sustainable Energy Development Office website and assumptions made by the GBCA as detailed below.
Annual energy consumption from ovens•The Department of the Environment, Water, Heritage and the Arts in the report ‘Energy use in the Australian residential sector, 1986-2020’ (DEWHA, 2008) estimated the average annual energy consumption per oven for an average Australian household, in 2007, to be:
237kWh/year for electricity; and-1.7GJ/year for gas-
75Date Issued: July 2009
Annual energy consumption from cook tops:•The Department of the Environment, Water, Heritage and the Arts in the report ‘Energy use in the Australian residential sector, 1986-2020’ (DEWHA, 2008) estimated the average annual energy consumption per cooktop for an average Australian household, in 2007, to be:
288kWh/year for electricity (based on a 55% electric cook top); and-1.6GJ/year for gas-
Other cook tops with greater efficiencies are available on the market; efficiencies for these technologies have been sourced form the Western Australian Sustainable Energy Development Office website. The table below shows the efficiency assumed in the Green Star – Multi Unit Residential v1 Greenhouse Gas Emissions calculator, along with the energy consumption per cook top for a three bedroom apartment.Other cook tops with greater efficiencies are available on the market; efficiencies for these technologies have been sourced form the Western Australian Sustainable Energy Development Office website. The table below shows the efficiency assumed in the Green Star – Multi Unit Residential v1 Greenhouse Gas Emissions calculator, along with the energy consumption per cook top for a three bedroom apartment.
Assumption used to apportion energy use to apartment size and occupancy•It is assumed that 50% of the energy consumed by the oven and cook tops was independent and 50% dependent on household size (and has been assumed to vary linearly with occupancy). The average household size given in the ABS report (ABS, 2007), was just over three bedrooms. The occupancy level used in the Green Star – Multi Unit Residential v1 tool for a three bedroom apartment is four persons. Therefore the energy used by ovens and cook tops can be represented as follows:
Where E(Standard) is the average annual energy consumed by the cooking system for an average Australian household (three bedroom, four persons). The values of E(Standard) used in this equation are given in Table 32 below.
Technology type EfficiencyElectricity consumption per cook top in a
three bedroom apartment (kWh/yr)
Ceramic - halogen cook top 50% 317
Solid plate cook top 55% 288
Ceramic - standard cook top 60% 264
Coil cook top 65% 244
Ceramic - Induction cook top 85% 186
Energy consumed by ovens or cook tops in the development
=50% x E (Standard) x
Number of apartments
+50% x E (Standard) x
Occupancy of development4
Table 31: Energy Consumption per cook top
76Date Issued: July 2009
Cooking system type E(Standard)
Ceramic - halogen cook top
Solid plate cook top
Gas oven 1.7 GJ/year
Electric oven 273 kWh/year
Cook top
Gas cook top 1.6 GJ/year
Ceramic - halogen cook top 317 kWh/year
Solid plate cook top 288 kWh/year
Ceramic - standard cook top 264 kWh/year
Coil cook top 244 kWh/year
Ceramic - Induction cook top 186 kWh/year
Table 32: Summary of E(Standard) for each cooking system type
On-site electricity generation is not yet considered standard practice; therefore the benchmark development does not include any electricity generating equipment.
ON-SITE ELECTRICITY GENERATION BENCHMARK
On-site electricity generation benchmark = 0kWh/yr
77Date Issued: July 2009
APPENdIX F: GREENHOUSE GAS EMISSIONS FACTORS
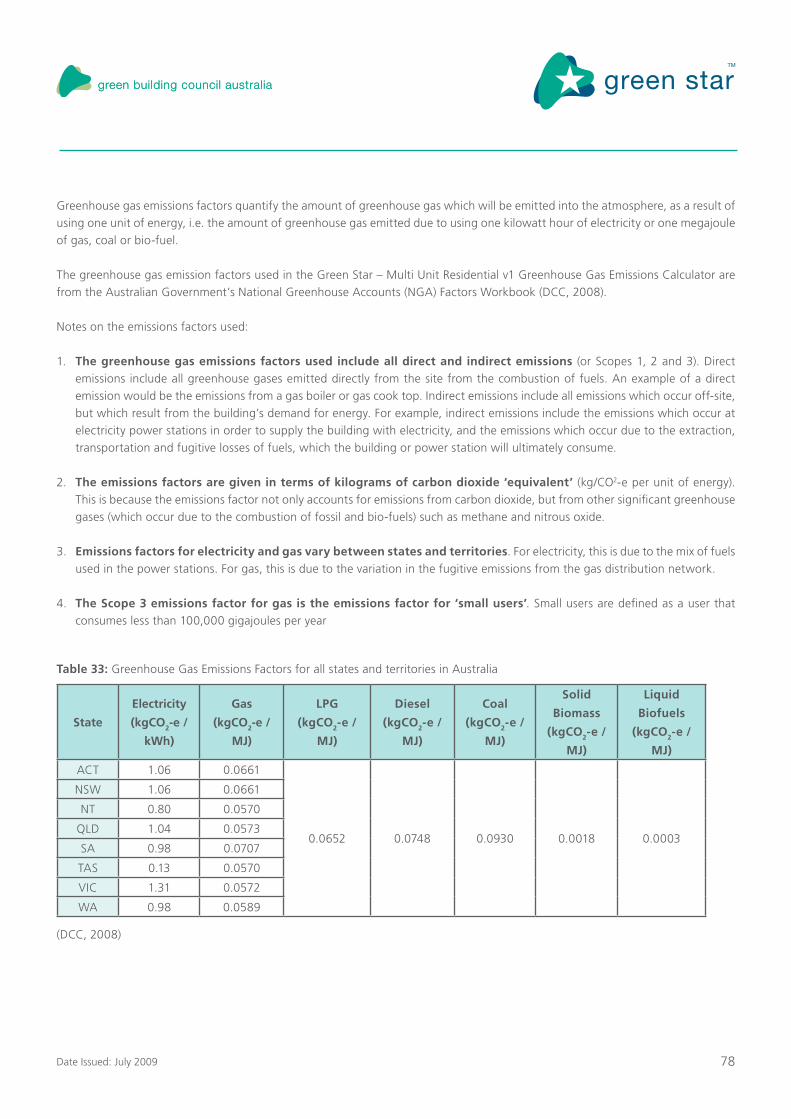
78Date Issued: July 2009
Greenhouse gas emissions factors quantify the amount of greenhouse gas which will be emitted into the atmosphere, as a result of using one unit of energy, i.e. the amount of greenhouse gas emitted due to using one kilowatt hour of electricity or one megajoule of gas, coal or bio-fuel.
The greenhouse gas emission factors used in the Green Star – Multi Unit Residential v1 Greenhouse Gas Emissions Calculator are from the Australian Government’s National Greenhouse Accounts (NGA) Factors Workbook (DCC, 2008).
Notes on the emissions factors used:
1. The greenhouse gas emissions factors used include all direct and indirect emissions (or Scopes 1, 2 and 3). Direct emissions include all greenhouse gases emitted directly from the site from the combustion of fuels. An example of a direct emission would be the emissions from a gas boiler or gas cook top. Indirect emissions include all emissions which occur off-site, but which result from the building’s demand for energy. For example, indirect emissions include the emissions which occur at electricity power stations in order to supply the building with electricity, and the emissions which occur due to the extraction, transportation and fugitive losses of fuels, which the building or power station will ultimately consume.
2. The emissions factors are given in terms of kilograms of carbon dioxide ‘equivalent’ (kg/CO2-e per unit of energy). This is because the emissions factor not only accounts for emissions from carbon dioxide, but from other significant greenhouse gases (which occur due to the combustion of fossil and bio-fuels) such as methane and nitrous oxide.
3. Emissions factors for electricity and gas vary between states and territories. For electricity, this is due to the mix of fuels used in the power stations. For gas, this is due to the variation in the fugitive emissions from the gas distribution network.
4. The Scope 3 emissions factor for gas is the emissions factor for ‘small users’. Small users are defined as a user that consumes less than 100,000 gigajoules per year
State
Electricity
(kgCO2-e /
kWh)
Gas
(kgCO2-e /
MJ)
LPG
(kgCO2-e /
MJ)
Diesel
(kgCO2-e /
MJ)
Coal
(kgCO2-e /
MJ)
Solid
Biomass
(kgCO2-e /
MJ)
Liquid
Biofuels
(kgCO2-e /
MJ)
ACT 1.06 0.0661
0.0652 0.0748 0.0930 0.0018 0.0003
NSW 1.06 0.0661
NT 0.80 0.0570
QLD 1.04 0.0573
SA 0.98 0.0707
TAS 0.13 0.0570
VIC 1.31 0.0572
WA 0.98 0.0589
Table 33: Greenhouse Gas Emissions Factors for all states and territories in Australia
(DCC, 2008)

79Date Issued: July 2009
APPENdIX G: dOCUMENTATION REQUIREMENTS

80Date Issued: July 2009
The energy modelling report must be prepared in accordance with the Green Star – Multi Unit Residential v1 Greenhouse Gas Emissions Guide and must clearly:
• Identifyalldefaultvaluesused(e.g.occupantdensity);• Identifyallofthedesign-driveninputs,referencingdrawings,schedulesandspecificationsandwheneverassumptionsareused,
they must be justified and conservative; and• Correspondtothedesign.
All other aspects of the building must have been modelled correctly, with no significant compromises made. If these requirements are not met, then the reasons for this will need to be adequately justified.
The Energy Modelling Report must include as a minimum the information detailed below:
1. Executive SummaryThe executive summary must including at a minimum:- A schedule detailing the number, area and type of dwelling(s) and the area of all common space types; and - A description of all systems installed with their environmental performance; and - A summary of all calculations and points claimed.
2. Description of Building Construction
• Building Envelope: Providing details on how the following aspects of the building envelope have been modelled:
- Building form, including any simplifications and their effect;- Orientation;- Insulation;- Glazing;- Shading (window shading and external building fabric) and overshadowing;- Window and spandrel sizes; and- Infiltration.
• Dwelling thermal performance: Copy of the Ene-Con calculator
3. Energy Simulation Details and Results
The following must be provided for both all areas in the building.
• Lighting: Detailing the energy use calculations, and including supporting documentation for each space, or typical space, including:
- The lighting power density;- The lighting controls systems and their energy use; and- The operational profiles used.
• Hot Water: Detailing, and including any supporting documentation of, the domestic hot water heating energy requirements and fuel type;

81Date Issued: July 2009
• Mechanicalventilation,liftsandotheramenities:Detailing,andincludingsupportingdocumentationof:
- Lift energy calculations;- Car park ventilation details; and- Any other energy use such as pools, sauna, spa, black water treatment plant, escalators or travelators.
• Cooking Detailing, and including supporting documentation of, all oven and cook top appliances; and• Electricity Generation Detailing, and including supporting documentation of, how the following has modelled, including all
operational assumptions (e.g. solar/wind resources):
- Renewable energy systems; and- Co-generation, tri-generation systems.
Where dynamic modelling has not been undertaken
• Heating system details: Provide details on the following
- System description, number installed, area serviced, fuel type and COP for all systems.- Manufacturer’s data sheets confirming the inputs above, and including the test procedure by which the COP for the system
was obtained.
• Cooling system details: Provide details on the following
- System description, number installed, area serviced, fuel type and EER for all systems.- Manufacturer’s data sheets confirming the inputs above, and including the test procedure by which the EER for the system
was obtained.
• Ceiling Fan Details Provide details on the installed ceiling fans, number of installed fans, and a justification of all calculations.
Where dynamic modelling has been undertaken
Simulation package and model description
The simulation and model brief must include at a minimum:• Confirmationthatthesimulationpackagecomplieswithoneofthefollowingstandards:
- BESTEST (US NREL, 2005); or- The European Union draft standard EN13791 July 2000; or- Be certified in accordance with ANSI/ASHRAE Standard 140-2001.
• Confirmationthatthebuildingperformanceisanalysedonanhourlybasisforafullyear;• Detailsoftheweatherdatafileselected(typeofdataandweatherstationlocation)
82Date Issued: July 2009
• Adescriptionofthesimulationpackage’saccuracyatrepresenting:
- The proposed HVAC systems;- The HVAC controls which are to be used;- Glazing on the building – whether the model represents glazing as only a U-value and shading coefficient;- The performance curves and sizes for plant items; and- The daylighting effects and the operation of daylight controls.
• Adescriptionofanycompromisesmadeinregardstothemodellingofthebuildingandwhateffecttheyhaveontheresults.
• ShowinghowtherequirementsdetailedintheAdditionalGuidancesections‘SimulationPackageRequirements’and‘EnergyModelling Report Requirements’ are met
• SpaceTypeBreakdown:Detailsofhoweachrelevantspacetype(seeAppendixA)waschosenforeachsectionofthebuildingincluding details of the area (m2) for each of the allocated space type.
HVAC Energy Systems
• HVAC System: Detailing, and including supporting documentation of, how the following aspects of the HVAC system have been modelled/represented in the model:
- HVAC system design;- Air-conditioning zones;- Chiller plant, including the chiller plant size and details on the efficiency curves that have been used and details on how the
chiller data is relevant to the intended condenser water temperature controls;- Boiler plant;- Supply air and exhaust fans, including details on how the index run pressure drops have been calculated and modelled and
including:- Fan Maximum Total Motor Shaft Power- Maximum Fan Motor Power to Air Flow Rate Ratio- System static pressure- Cooling tower fans; and- Cooling tower and condenser water pumping.
• Building Environmental Control Strategy including:
- A clear description of the overall control systems. The description must include an analysis of the benefits and conflicts of having these control strategies working alongside each other;
- Control(s) of any building envelope elements (glazing, shading devices, etc); - Lighting/daylighting interaction(s); and - Air / plant side HVAC control(s); detailing, and including supporting documentation describing how the following aspects
of the HVAC controls have been modelled/represented in the model:- Outside air flow;- Economy cycle;- Primary duct temperature control, including details on how design temperatures and setpoints have been modelled;- Airflow control;

83Date Issued: July 2009
- Minimum turndown;- Chiller staging; and- Temperature control bands.
• A/C Pumping: Detailing, and including supporting documentation of, how the following have been calculated:- Chilled water; and- Heating hot water.
• Internal Loads: Confirming that the following were used as per the Green Star – Multi-Unit Residential Greenhouse Gas Emissions Calculator Guide:
- Lighting power density and operational profiles;- Equipment load density and operational profiles; and- Occupancy loads and occupancy profiles.