green retrofits single most important measure · the owner’s perspective *source: kilroy realty...
TRANSCRIPT

“Green retrofits are the single most important measure
that corporations and real estate owners can take to reduce their operating costs,
raise commercial property values and achieve important
environmental benefits like reduced carbon dioxide emissions.” - Deloitte

• 20% energy savings by 2020
• 30 million square feet
• Make LA the greenest big city
in the US
LA Better Buildings Challenge

LA Better Buildings Challenge
7,000 Cars

LA Better Buildings Challenge
900,000 Trees
LA Better Buildings Challenge
80,000 Barrels of Oil

LA Better Buildings Challenge
7,000 Jobs

WHY DO I NEED ANOTHER CHALLENGE IN MY LIFE?
I’m slammed at work, and this stuff is confusing…
LA Better Buildings Challenge

8
Retrocommissioning
BMS systems
Geothermal conditioning
Get LEED certified
Replace chiller
Solar panels
Ice storage
Focus on energy
Green roof
Change behavior
Continuous commissioning
Zero energy
Holistic repositioning
Change light bulbs
Window film
White roof
benchmark
Recladding
Deep rejuvenation
DO THE PERFECT THING?
DO NOTHING
DO SOMETHING!
LA Better Buildings Challenge
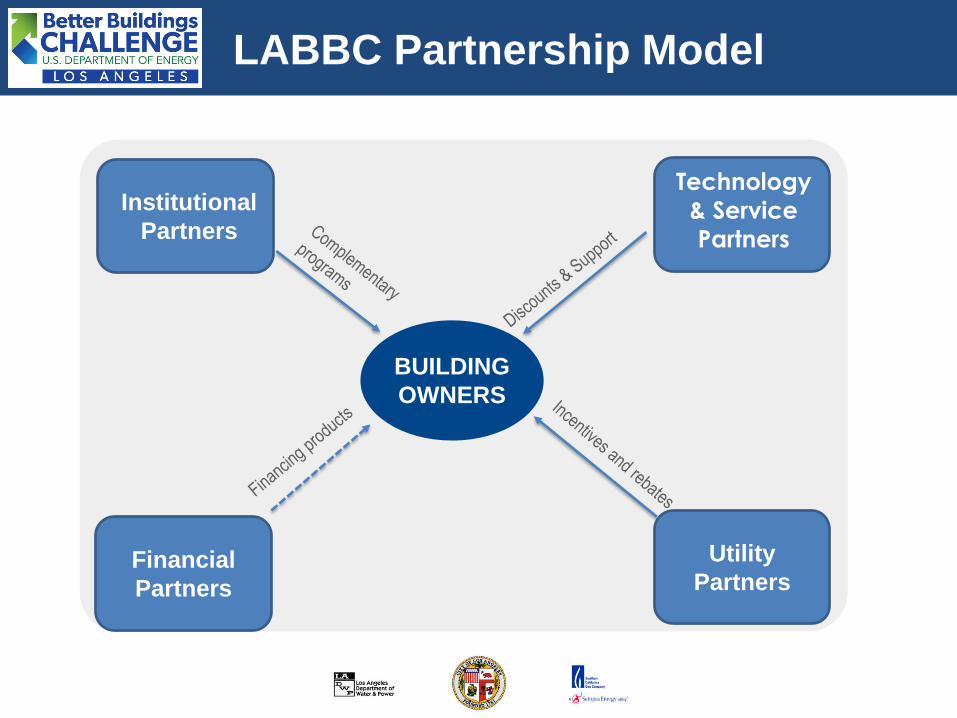
LABBC Partnership Model
BUILDING
OWNERS
Utility
Partners
Technology
& Service
Partners
Financial
Partners
Institutional
Partners

Going Green, Makes Green
Hard Value Soft Value
8.5% Reduction in operating costs Market differentiation
6.8% Increase in building values Growing tenant demand
9.2% Increase in ROI Reduced risk of obsolescence
6.4% Increased occupancy Lower energy cost risk
6.2% Increases in rent Stay ahead of regulations
8.5% Reduction in operating costs Reputation, public image
*Source: McGraw Hill, Green Outlook 2011: Green Trends Driving Growth

http://www.eere.energy.gov/pdfs/doe_taf_mou_signed_6-10.pdf
Energy Performance will Impact Values more and
more directly
Stay ahead of Regulation

Tenants Care about Green
• Fewer Sick Days
• Average of 2.9 fewer sick days
• Net impact of ~$5/sf
occupied
• Higher Productivity
• 55% report productivity
improvement (~$20/sf)
• Recruitment and retention
• Young people want green
• But what is the main
reason tenants care?
Source: CBRE 2009 Green Building Study
LOWER TOTAL COST OF OCCUPANCY

The Tenant’s Perspective:
An Example
*Source: Kilroy Realty Corporation
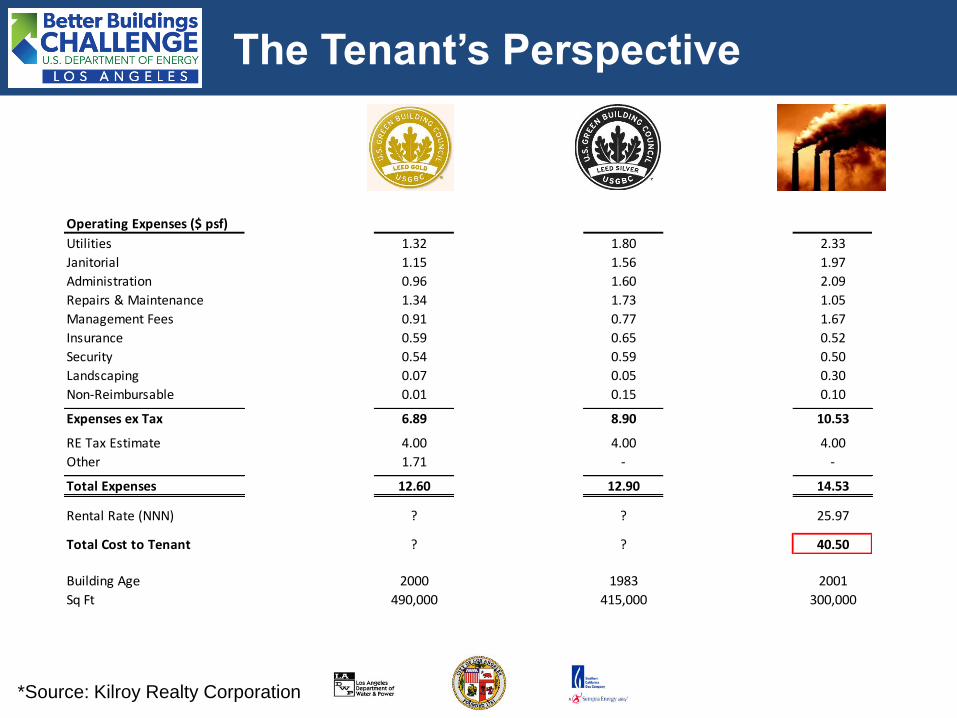
The Tenant’s Perspective
Building Age 2000 1983 2001
Sq Ft 490,000 415,000 300,000
Operating Expenses ($ psf)
Utilities 1.32 1.80 2.33
Janitorial 1.15 1.56 1.97
Administration 0.96 1.60 2.09
Repairs & Maintenance 1.34 1.73 1.05
Management Fees 0.91 0.77 1.67
Insurance 0.59 0.65 0.52
Security 0.54 0.59 0.50
Landscaping 0.07 0.05 0.30
Non-Reimbursable 0.01 0.15 0.10
Expenses ex Tax 6.89 8.90 10.53
RE Tax Estimate 4.00 4.00 4.00
Other 1.71 - -
Total Expenses 12.60 12.90 14.53
Rental Rate (NNN) ? ? 25.97
Total Cost to Tenant ? ? 40.50
*Source: Kilroy Realty Corporation

The Tenant’s Perspective
*Source: Kilroy Realty Corporation
Operating Expenses ($ psf)
Utilities 1.32 1.80 2.33
Janitorial 1.15 1.56 1.97
Administration 0.96 1.60 2.09
Repairs & Maintenance 1.34 1.73 1.05
Management Fees 0.91 0.77 1.67
Insurance 0.59 0.65 0.52
Security 0.54 0.59 0.50
Landscaping 0.07 0.05 0.30
Non-Reimbursable 0.01 0.15 0.10
Expenses ex Tax 6.89 8.90 10.53
RE Tax Estimate 4.00 4.00 4.00
Other 1.71 - -
Total Expenses 12.60 12.90 14.53
Rental Rate (NNN) 27.90 27.60 25.97
Total Cost to Tenant 40.50 40.50 40.50

The Owner’s Perspective
*Source: Kilroy Realty Corporation
Operating Expenses ($ psf)
Utilities 1.32 1.80 2.33
Janitorial 1.15 1.56 1.97
Administration 0.96 1.60 2.09
Repairs & Maintenance 1.34 1.73 1.05
Management Fees 0.91 0.77 1.67
Insurance 0.59 0.65 0.52
Security 0.54 0.59 0.50
Landscaping 0.07 0.05 0.30
Non-Reimbursable 0.01 0.15 0.10
Expenses ex Tax 6.89 8.90 10.53
RE Tax Estimate 4.00 4.00 4.00
Other 1.71 - -
Total Expenses 12.60 12.90 14.53
Rental Rate (NNN) 27.90 27.60 25.97
Total Cost to Tenant 40.50 40.50 40.50
Additional Net Income ($ psf) 1.92 1.63
Additional Net Income 938,952 678,641
Additional Bldg Value (7cap) 13,413,604 9,694,868
Utilities Savings Only ($ psf) 1.02 0.53
Additional Net Income 497,047 222,660
Additional Bldg Value (7cap) 7,100,667 3,180,855
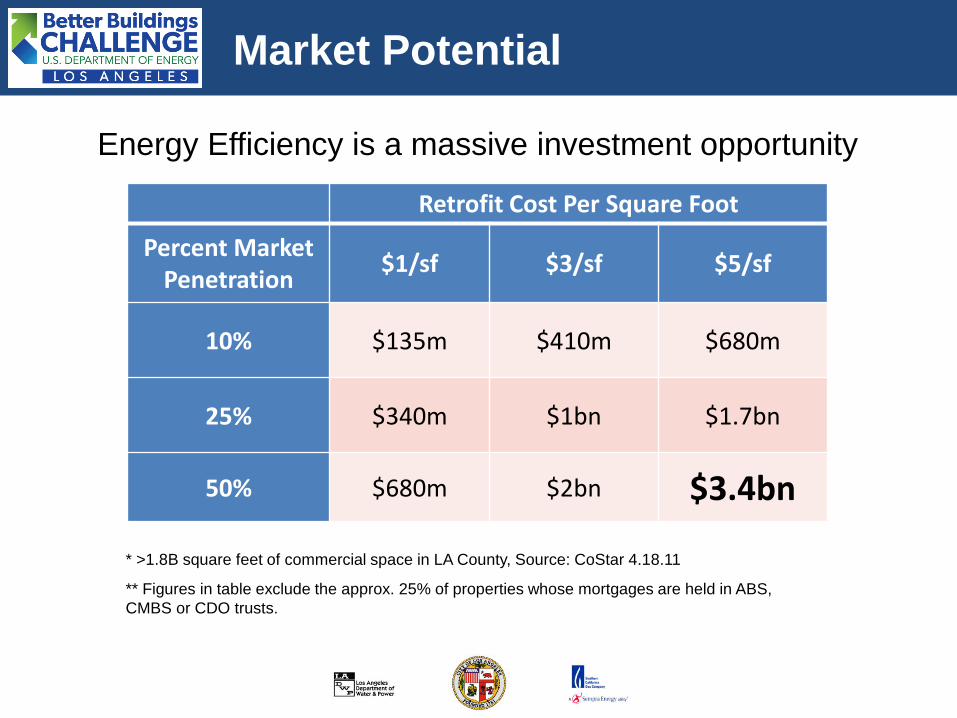
Market Potential
Retrofit Cost Per Square Foot
Percent Market Penetration
$1/sf $3/sf $5/sf
10% $135m $410m $680m
25% $340m $1bn $1.7bn
50% $680m $2bn $3.4bn
* >1.8B square feet of commercial space in LA County, Source: CoStar 4.18.11
** Figures in table exclude the approx. 25% of properties whose mortgages are held in ABS,
CMBS or CDO trusts.
Energy Efficiency is a massive investment opportunity
SO WHO ELSE IS INVOLVED?
OK, I’m listening…
LA Better Buildings Challenge

*As of 3/20/2013
LABBC Partners

LABBC Founding Partners

Commercial Buildings

Municipal Buildings

Residential Buildings

23%
12%
30%
24%
11%
Project Status
Completed
Planned
SupportNeeded
Following Up
• 91 ASHRAE Level II Audits in
2012 (>35M square feet)
• 32 of 91 (35%) have already
implemented or budgeted to
implement projects
• Savings equivalent to taking over
2,500 cars off the road or
powering over 1,800 homes for a
year
Projected Annual Dollar Savings
ECM cost after Rebate ECM Payback
(in years) Estimated Saved
kWh
Estimated Saved Gal./CCF
Estimated Saved Therms
$2,279,674 $12,437,096 5.46 17,118,551 10,515,972 31,092
The Foundation Has Been Laid

26
22%
37%
30%
11%
Support Requested
RebateIdentification
FinancingAssistance
ProjectManagement
AdditionalResearch
• Financing could unlock another $21
Million in Investment
• Support in securing Rebates and
Incentives could unlock $14 Million
more
• Project Management support could
unlock another $17 Million
The Foundation Has Been Laid

Individualized Case Management & Special Incentives
to LABBC Support BBC Participants
Project Identification & Development through LADWP “EETAP”*
• Automated Data Acquisition
• Energy Audits
• Project Development Support
Financing & Implementation
• Technology Discounts
• Technical Services Discounts
• Contractor Introductions
• Rebate Application Support
• Tax Incentive Support
• Project Financing Support
The Data Spoke, We Listened
* The Energy Efficiency Technical Assistance Program is in development, precise offerings still TBD.

Energy Audits & Project Support
Subsidized Energy Audits • Pre-screened, Approved Engineering Firms
• Comprehensive Report Deliverable
• Unbiased Analysis and Support in
reviewing the results
Project Development Support • Dedicated Project Manager
• Direct access to Department of Building &
Safety
• Unbiased advice on available technology
and project implementation strategy
• Rebate assistance and support
* The Energy Efficiency Technical Assistance Program is in development, precise offerings still TBD.

Data Acquisition & Tracking
Free automated utility tracking and analytics for participating properties.
Track your building’s water, electricity and natural gas use all in one place. The online
software does all the work, no hardware installation required.
Benefits:
• Automatically import consumption
and cost data
• Export to Portfolio Manager for
Energy Star ratings
• Monitor and analyze performance
through intuitive visualizations
• Measure and verify the
effectiveness of building retrofits
• Track your building’s performance
against LABBC goals
• Share your building information with
your organization and with external
partners

Innovative Financing Options
Inability to secure repayment drives up rates, shortens terms
Assets held by single-purpose LLC with no credit
Owner desires to preserve borrowing capacity
Competition for capital
“Split-incentives” between landlords and tenants
Short hold period
Short payback requirements
Repayment secured through property taxes or utility bills
Repayment secured by contract or by property, not owner credit
Off-balance Sheet Treatment preserves borrowing capacity
100% external financing Repayment structured as an
operating expense, like utility bills Repayment transfers with property Longer term financing = cash flow +
Historical Barriers New Solutions
LABBC assists Partners in evaluating financing options to enable
implementation of deeper projects while preserving capital for investment in
core business activities and enhancing cash flow

Cash Flow Positivity
-5000000
-4000000
-3000000
-2000000
-1000000
0
1000000
2000000
3000000
1 2 3 4 5 6 7 8 9 10 11 12 13 14 15 16 17 18 19 20
Cumulative Unlevered Cash Flow
Cumulative Levered Cash Flow (Net)
No upfront cost for necessary equipment replacement

Discounted Products & Services
• Discounts from distributor pricing on high-efficiency
building products
• Free analysis of accelerated depreciation
and other tax benefits of going green
• Deep bench of resources for technical services
• Access to a short-listed, qualified group of
energy efficiency financing entities
• Free, non-biased assistance with
financial analysis of energy efficiency
investment opportunities

Tax Incentives for EE Retrofits
But if you’re going green…

• Cost Segregation
• Provides a means of accelerating the depreciable life of certain improvements
• 2012 Tangible Property Regulations
• Building owners may now write down the value of building components disposed of during building improvement projects.
• EPAct 179-D Tax Deduction
• Tax deduction of up to $1.80/sf for properties that improve performance above ASHRAE 90.1-2001
Tax Incentives for EE Retrofits
The LABBC is partnered with best in class tax consultation firms to
provide a pro-bono predictive analysis of tax benefits that improve the
ROI of EE projects
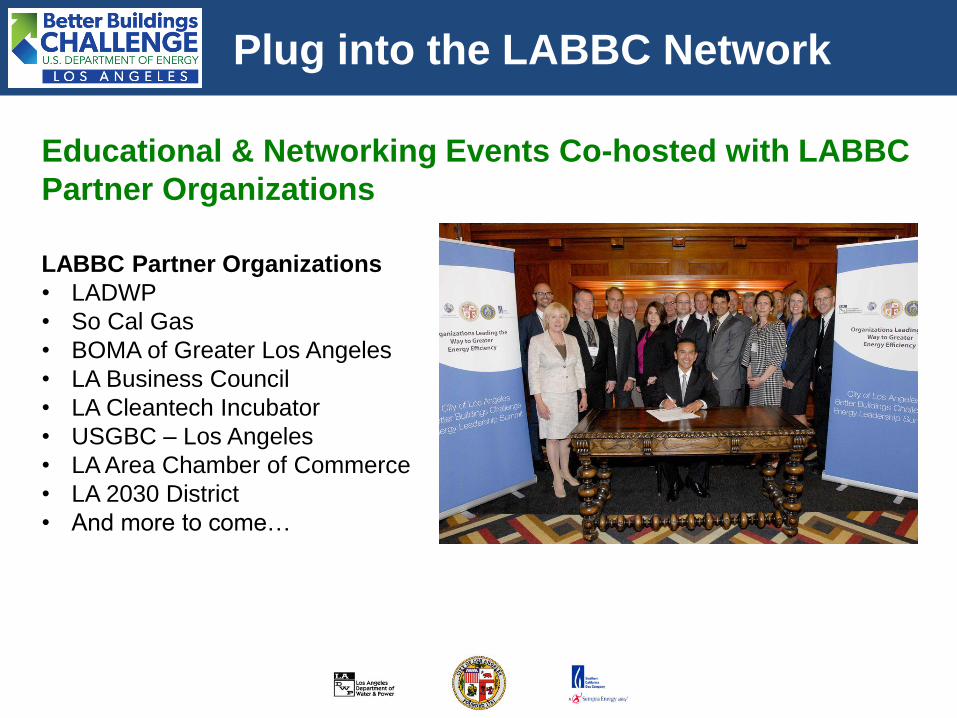
Plug into the LABBC Network
Educational & Networking Events Co-hosted with LABBC
Partner Organizations
LABBC Partner Organizations
• LADWP
• So Cal Gas
• BOMA of Greater Los Angeles
• LA Business Council
• LA Cleantech Incubator
• USGBC – Los Angeles
• LA Area Chamber of Commerce
• LA 2030 District
• And more to come…

Showcase Projects

Upcoming LABBC Events
LABBC Building
Technology Showcase
• Fast Pitch
Presentations
• Panel Discussions
• Networking
LABBC Webinar Series
• New Tax Incentives for
EE retrofits
• Staying ahead of
impending legislation
• Innovations in Energy
Efficiency Project
Financing
• And more
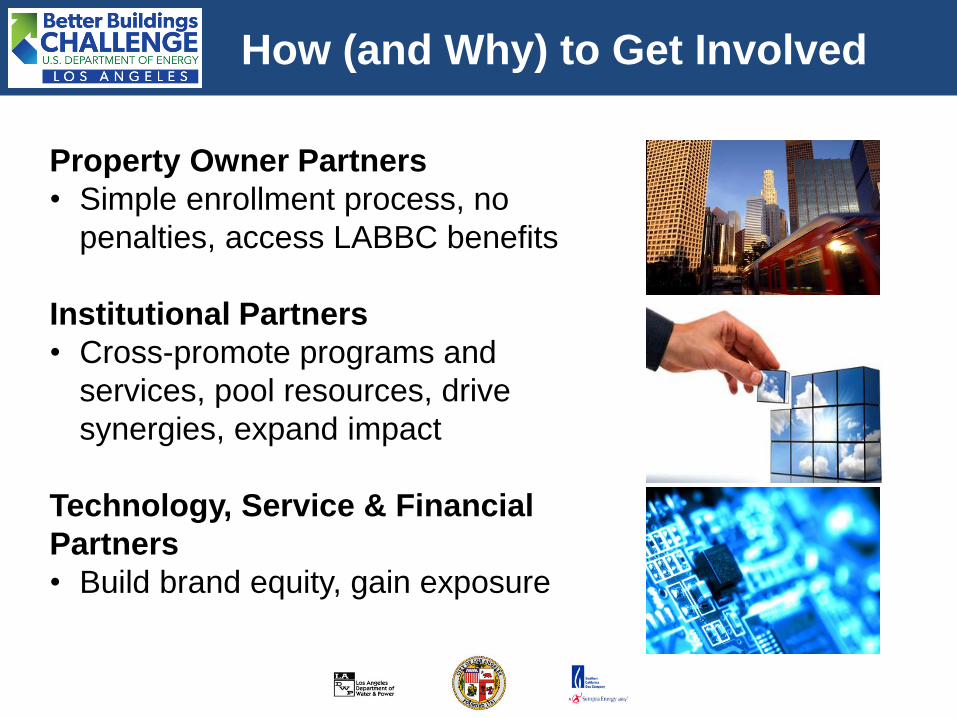
How (and Why) to Get Involved
Property Owner Partners
• Simple enrollment process, no
penalties, access LABBC benefits
Institutional Partners
• Cross-promote programs and
services, pool resources, drive
synergies, expand impact
Technology, Service & Financial
Partners
• Build brand equity, gain exposure

Take the Challenge Today!
• Enrolling allows you to take advantage of the program’s
resources
• Simple two-page
enrollment form
• No penalties if you can
not meet the 20% goal
• Data is reported only in
aggregate
Your building will benefit from helping make LA the
greenest big City in the US
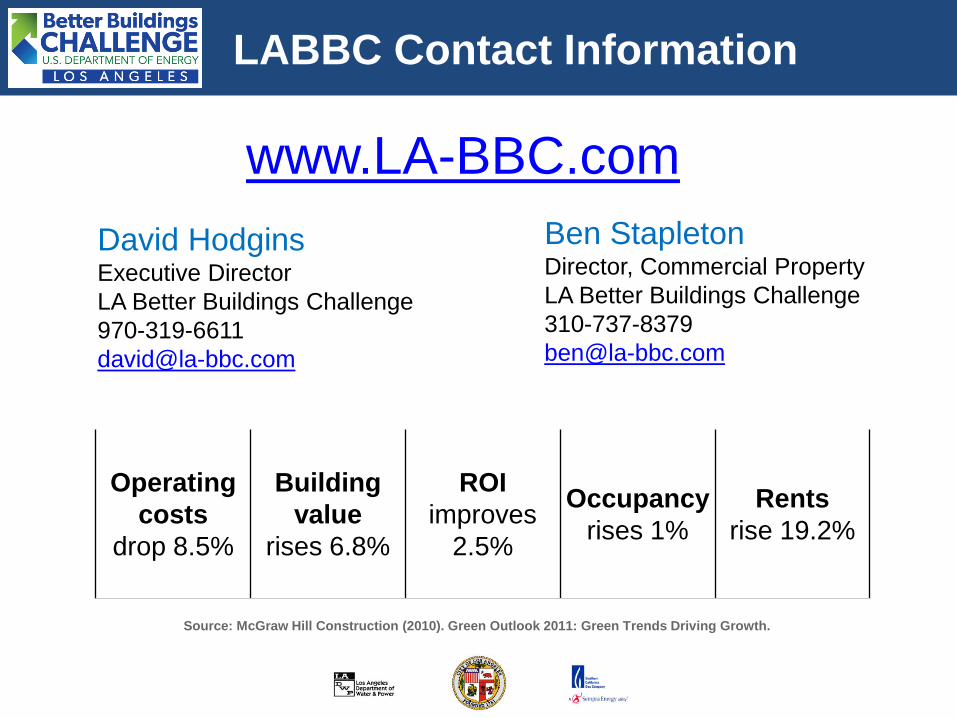
David Hodgins Executive Director
LA Better Buildings Challenge
970-319-6611
LABBC Contact Information
Ben Stapleton Director, Commercial Property
LA Better Buildings Challenge
310-737-8379
Operating
costs
drop 8.5%
Building
value
rises 6.8%
ROI
improves
2.5%
Occupancy
rises 1%
Rents
rise 19.2%
Source: McGraw Hill Construction (2010). Green Outlook 2011: Green Trends Driving Growth.
www.LA-BBC.com

1. Deloitte – http://www.deloitte.com
2. Deloitte – An Inconvenient Truth, 2012
3. Deloitte – An Inconvenient Truth, 2012
4. USGBC
5. McGraw Hill Construction, Green Outlook 2011: Green Trends Driving Growth, 2010
6. McGraw Hill Construction, Green Outlook 2011: Green Trends Driving Growth, 2010
References