green infrastructure report - home - university of cincinnati
TRANSCRIPT

1 | P a g e
TABLE OF CONTENTS ABSTRACT 2 LIST OF FIGURES AND TABLES 3 INTRODUCTION/BACKGROUND 4 ENGINEERING INTERVENTION: PERVIOUS PAVEMENTS 3-12 ENGINEERING INTERVENTION: BIORETENTION 13-23 ENGINEERING INTERVENTION: SOLAR ENERGY 24-29 ENGINEERING INTERVENTION: GREEN ROOFS 30-37 REFERENCES 38-40 SUMMARY OF WORK 40

2 | P a g e
Figure/Table Number Page
Table 1.1 5Table 1.2 6Figure 1.1 6Figure 1.2 7Table 1.3 8Figure 1.3a 8Figure 1.3b 9Table 1.4 10Table 1.5 13Table 2.1 14Figure 2.1 15Figure 2.2 15Figure 2.3 16Figure 2.4 17Table 2.2 18Table 2.3 18-19Figure 2.5 19Figure 2.6 20Table 2.4 20Table 2.5 21Table 2.6 21Table 2.7 22Figure 2.7 23Figure 3.1 26Figure 3.2 28Figure 3.3 29Figure 3.4 29Table 3.1 30Figure 4.1a&b 31Table 4.1 32Table 4.2 34Figure 4.2 35Figure 4.3 35Figure 4.4 36Figure 4.5 37

3 | P a g e
Abstract Green infrastructure uses natural features of the land to manage water and provide environmental and community benefits. It is widely becoming more popular and important in today’s society. With the revolution of “going green” and the climate change that can be seen today, protecting and bettering our community has become a priority. Green infrastructure allows us to continue our development of urban areas while simultaneously providing enhanced benefits to the community. Burnet Woods faces the problem of being a large park within an urbanized city. It is bounded on all sides by businesses, residential neighborhoods, or local institutions. Green infrastructure will allow the park to use the resources it has at hand or planned in the future to improve the water quality and reduce pollutants. Utilizing pervious pavements, green roofs, bioretention systems, and solar panels will provide many benefits and help the park become more sustainable. All of these will be thoroughly examined and researched to find the best fits. Each one of these green infrastructure designs has their own specific benefits and uses. Bioretention systems are used as a stormwater management practice and provide many benefits. These include reducing pollutants in the runoff, recharging groundwater, and alleviating stress on the current stormwater management system. Pervious pavements can be used in-lieu of traditional pavements to allow for maximum ground infiltration and reduction in stormwater runoff. Solar panels would allow Burnet Woods to reduce its electrical carbon footprint and possibly reduce costs. Green roofs can reduce stormwater runoff, reduce urban heat island and can possibly allow for a creative and innovative design.

4 | P a g e
Introduction/Background Burnet Woods is meant to be the oasis of Cincinnati where people can escape
from the city life. Unfortunately, the park does not seem to be meeting this expectation so stakeholders are looking into possibilities of a change.
Throughout the city of Cincinnati, there is an issue concerning the capacity of combined wastewater and storm water sewers and their inability to handle current runoff quantities. These sewer systems, called combined sewers, collect sanitary and industrial waste water as well as storm water runoff and transport it to treatment plants, after which it is treated and discharged to local rivers or streams. During heavy rainfall events, these combined sewers are overwhelmed and untreated sewage and runoff enter local streams or rivers. These overflows are termed combined sewer overflows (CSOs). Through negotiations with USEPA, the US Department of Justice, and the State of Ohio, the Metropolitan Sewer District of Greater Cincinnati (MSDGC) has drafted a consent decree that formed the response program to resolve its overflows (Kwiatkowski). Without remediation of the current sewer systems, Cincinnati will face fines and penalization. In 2004, this global consent decree was approved and MSDGC was required to pay $1.2 million in fines to federal and state agencies for past storm sewer overflows and combined sewer overflows, as well as invest $5.3 million in local environmental enhancement projects (Oh.gov). Just this November, Lima, OH became another Ohio city that will be enlisted under a consent decree and was issued a civic penalty of $49,000 (Cannon, Phillippa).
Within the Centennial Master Plan for Burnet Woods, there is immense opportunity to implement green infrastructure in order to reduce runoff and its effect on combined sewer overflows while simultaneously enhancing Burnet Woods’ function and aesthetic appeal, and ultimately benefit the city of Cincinnati and the community surrounding Burnet Woods.
Engineering Intervention: Pervious Pavement
One green infrastructure technique that has potential to play a major role in the reduction of runoff is the use of pervious, or permeable pavement. Pervious pavement provides the structural integrity necessary for both commercial and residential use while offering heightened infiltration capabilities. The improved infiltration capabilities can be a result of a porous surface course material being used, from water passing through joints between pavers, or a combination of both. Typical porous surface materials include porous asphalt, porous concrete or interlocking pavers, but can also include reinforced grass, turf or gravel (Implementing Green Infrastructure in Northern Kentucky Communities 16-19). The selection of paving material should be based on the amount of traffic the pavement will be exposed to. In addition to the level of traffic, the underlying soil type, amount of rainfall, slope and drainage patterns of the proposed locations must all be taken into consideration for the pavement to perform optimally. We are proposing to use pervious pavement in lieu of traditional impervious pavement in all new pavement construction.

5 | P a g e
Scope of work The scope of work included in this proposal consists of utilizing pervious pavements
in all new pavement construction or improvements in the Centennial Master Plan for Burnet Woods. This includes but is not limited to:
• roadways • parking lots/stalls • sidewalks • paved trails
Deliverables
In order for pervious pavements to be deemed a practical application to be utilized in Burnet Woods, there is one crucial factor that needs to be identified: the underlying soil type that will provide the foundation for the pavement. A void space, which represents the amount of empty space between soil particles, of 40% is required of the underlying soil. This ensures that the precipitation that passes through the permeable surface will be able to infiltrate the soil, through the void spaces to recharge the groundwater. For this reason, infiltration testing must occur prior to construction. In most cases, Hydrologic Soil Groups (HSG) A&B are suitable to build pervious pavements upon, but HSG C&D may require underdrains (City of Lancaster Green Infrastructure Plan 18). The HSG classification is based on the depth of a water impermeable layer and the runoff potential of the soil when saturated, as seen in Table 7-1 and 7-2 (United States Department of Agriculture, and Natural Resources Conservation Service)
Table 1.1
http://directives.sc.egov.usda.gov/OpenNonWebContent.aspx?content=17757.wba
• sports courts • playground surfaces • plaza pavements

6 | P a g e
Table 1.2 - Criteria for assignment of hydrologic soil groups
http://directives.sc.egov.usda.gov/OpenNonWebContent.aspx?content=17757.wba
As mentioned above, there is a wide variety of permeable pavements to choose from. Possible selections include porous asphalt or concrete, interlocking pervious pavers, and reinforced gravel or grass paving. Each permeable surface material has their own advantages and disadvantages that must be factored into the selection process. If pervious pavements are persued next semester, a recommendation of pavement will be provided based upon the following, all of which will also be incorporated into the deliverables.
• Required and recommended maintenance for selected pavement • Life-cycle analysis • Analysis of runoff mitigation and respective energy/cost savings • Analysis of air quality and climate benefits/effect on carbon footprint • Cost estimate • Ensure construction process abides by all legal/zoning/safety standards
Figure 1.1 - Porous Concrete and Asphalt
http://www.epa.gov/smartgrowth/pdf/northern_kentucky_ch1-4.pdf
Porous concrete costs can range from $2 to $7 per square foot (2005 figures) while the excavation, base course, subgrade and filter material can vary depending on the specific design and contractor installing the pavement. Because the compressive strength of porous materials are less than that of their impermeable counterparts, the thickness of

7 | P a g e
the concrete must be increased which results in a higher initial cost. The thickness of the concrete layer can range from 5-8 inches. The total cost of the system can still remain lower however. When properly designed, porous materials can eliminate the need to install storm drain inlets, piping, and retention basins which can amount to two to three times more than pervious concrete. There is also less grading involved in the construction process since there is no need to slope the paved area towards drains. (Economic Benefits). In addition, by choosing permeable pavements, existing sewer systems remain unaffected by new development due to the fact that storm water will be managed via infiltration rather than rebuilding or resizing city storm sewers to handle increased runoff. In terms of storm water runoff, porous concrete has been shown to retain 99 to 100 percent of stormwater volume and has infiltration rates of hundreds of inches per hour. According to, “Implementing Green Infrastructure in Northern Kentucky Communities,” a surface permeability of at least 20 inches per hour is required to function as a pervious pavement. Over time, the infilatration rate can be reduced to 5 inches per hour due to clogging of the pores, therefore vaccuum sweeping is recommended quarterly to maintain maximum permeability. According to a case study in Lancaster, PA, the cost to vaccuum sweep a half acre parking lot is approximately $400-500 per year. Life spans are very similar to regular concrete, at 20-30 years.
Porous Asphalt can cost from $0.50 to $1 per square foot and the required thickness can range from 3-4 inches. The same cost reductions and benefits from above apply, as well as for the remainder of the previous pavement types that will be introduced. Porous asphalt has recorded retention amounts ranging from 25 to 100% of stormwater volume, and similar to porous concrete, has infiltration rates of hundreds of inches per minute. When the surface becomes clogged, these rates can plummet to 1inch per hour, but is still adequate for most stormwater events. While the maintenance requirements are the same as porous concrete, the typical life-span is shorter at 15-20 years. As with all performance-based systems, proper maintenance can enhance life-span. A great example comes from one of the best-known porous parking lots, located at the Walden Pond State Reservation in Massachusetts, which was constructed in 1977. While it has never been repaved, it is in good shape and still drains effectively (National Asphalt Pavement Association). One advantage that porous asphalt has over porous concrete is that it is less susceptible to freeze-thaw damage during winter months which maintains the life-span and keeps patching and maintenance costs lower.
Pervious Concrete Pavers
Figure 1.2 – Pervious Concrete Pavers
http://www.epa.gov/smartgrowth/pdf/northern_kentucky_ch1-4.pdf

8 | P a g e
As evident from Figure 4-8 above, the base and subbase layers for pervious concrete pavers are similar to those of the porous concrete and asphalt. The cost of concrete pavers can vary greatly depending upon the desired aesthetics and performance, but typically fall between $2 and $8 per square foot. As with porous asphalt, infiltration rates are hundreds of inches per hour, and according to the Interlocking Concrete Pavement Institute, a minimum of 100 inches per hour is required and tested on site to measure performance. Retention of stormwater volume ranges from 34-100%. If pervious pavers are to be used on a project in which the Americans with Disabilities Act (ADA) governs, the surface openings between pavers cannot exceed ½ inch. Specific care must be taken to ensure the pavers are suitable for handicapped parking spaces as well.
According to the EPA, “Porous asphalt, pervious concrete, and permeable pavers all have the same underlying stormwater storage and support structure. The only difference is the permeable surface treatment. The choice of permeable surface is relevant to user needs, cost, material availability, constructability, and maintenance, but it has minimal impact on the overall stormwater retention, detention, and treatment of the system.” The similarities in stormwater storage and support structure therefore result in pollutant removal quantities that are equivalent. They are summarized below (CTC & Associates).
For all systems, pollutant removals are:
Pollutant Percent Removed Total Suspended Solids 85-95% Total Phosphorous 65-85% Total Nitrogen 80-85% Nitrate (as N) 30% Metals 98%
Table 1.3 – Pollutant Removals
Reinforced Grass and Gravel
Figure 1.3 a - Reinforced Grass
http://www.epa.gov/smartgrowth/pdf/northern_kentucky_ch1-4.pdf

9 | P a g e
Figure 1.3 b - Reinforced Gravel
http://www.epa.gov/smartgrowth/pdf/northern_kentucky_ch1-4.pdf
Reinforced grass and gravel paving are both newer permeable pavement techniques and have limited information published due to the fact that they require a reinforcing grid, commonly made of plastics, sold by privately owned companies.
One company called Invisible Structures, Inc. has a reinforcing grid product called Grasspave2. They state that a system composed of Grasspave2 grid, sand and a base course performs with a permeability of 2.63 to 38.55 inches of water per hour (Invisible Structures). Costs are mainly indicative of the type of reinforcing grid chosen and therefore can vary widely. The grid material and cell shape are typically based upon the strength parameters required by the desired application. For reinforced grass paving, applications should be limited to areas with low traffic volume and vehicle speeds such as roadway shoulders, maintenance roads, emergency vehicle access roads and infrequently used parking areas. Reinforced or pervious gravel systems have the same restrictions and are typically limited to parking lots, driveways, storage yards or maintenance roads. A crucial downfall of pervious gravel systems is the fact that they are not ADA compliant and are therefore difficult to use in public locations (Urban Drainage and Flood Control District). The rest of the pavement techniques discussed thus far are ADA compliant. The life-spans for grass and gravel pavers are approximately 60 and 25 years, respectively (Glist).
Pervious Pavement Selection Criteria
As seen above, there are many factors that need to be considered when selecting what surface material to use for specific paving applications. The selection of paving material should be based on the desired application and level of traffic the pavement will be exposed to. In addition to the level of traffic, the underlying soil type, amount of rainfall, slope and drainage patterns of the proposed locations must all be taken into consideration for the pavement to perform optimally. By analyzing the topography, the hydrology and drainage areas can be determined in order to create a plan to maximize the amount of runoff reduction. The National Resource Conservation Service website can be utilized to provide information on the soil types and profiles in the area in question.
Quantitative Benefits
The quantitative benefits of permeable pavements can be calculated fairly easily given the necessary information can be obtained. The benefits can be broken down into a

10 | P a g e
structure as done in “The Economic Benefits of Green Infrastructure: A Case Study of Lancaster, PA.” Categories of water quality benefits, energy-related benefits, air-quality related benefits, and climate change-related benefits are generated and methods to calculate a numerical cost savings are presented.
The data necessary to evaluate the cost savings of each benefit are found in Appendix B of “The Economic Benefits of Green Infrastructure: A Case Study of Lancaster, PA.” Appendix B: Data Requirements List DATA NEEDED FOR WORKING THROUGH A VALUATION WITHIN THE WATER, ENERGY, AIR QUALITY AND CLIMATE CHANGE SECTIONS OF THE GUIDE • Data needs for existing green infrastructure projects/installations
o Project-specific green infrastructure data: Square foot area of green infrastructure feature Type of green infrastructure installed along with details of these features (e.g., number and type of trees being planted, etc.) Drainage area for the green infrastructure feature Amount of stormwater being retained by the green infrastructure feature (estimated or results from monitoring)
Water-Related Benefits
• Improved water quality due to enhanced pollutant capture
• Reduced runoff=fewer CSOs
• Lower water storage costs
• Lower operation costs associated with decreased water treatment
Energy-Related Benefits
• Less water treatment means less energy required from treatment plants
Air Quailty-Related Benefits • Color of concrete
is lighter than asphalt and helps to reduce urban temperatures and improve air quality
• Less water treatment means less air pollutants expelled from treatment plants
Climate Change-Related Benefits • Reinforced grass
pavers directly absorb CO2
• Less water treatment means less CO2 generated from treatment plants
Table 1.4 – Benefits of Porous Paving Material

11 | P a g e
• Data needs for future planned green infrastructure projects o Site design specs for the anticipated green infrastructure project(s) o Square foot area of green infrastructure feature o Type of green infrastructure being installed along with details about the anticipated features (e.g., number and type of trees being planted, etc.) o Drainage area for the green infrastructure feature o Estimated amount of stormwater that will be retained by the green infrastructure feature
• Average annual precipitation in your region (inches) • Average water treatment costs to customers ($/gallon) • Average capital costs for additional grey infrastructure capacity ($/gallon) • Annual number of cooling degree days (°F days) in your region • Annual number of heating degree days (°F days) in your region • R values for conventional and green roofs in your region (can use Guides range for this if not available) • Type of wastewater treatment used (trickling filter, activated sludge, advanced WW treatment, advanced WW treatment nitrification) and how many million gallons per day the plant produces • Average cost of electricity for your utility ($/kWh) • Average cost of natural gas for your utility ($/Btu) • Average annual pollutant uptake (lbs/SF) for NO2, O3, SO2, and PM-10 within your region (Guide provides source for reference) • Average value ($/lbs) of reduced NO2, O3, SO2, and PM-10 within your region (Guide provides source for reference) http://water.epa.gov/infrastructure/greeninfrastructure/upload/CNT-Lancaster-Report-508.pdf Design Standards/Best Practices
Ohio falls in to EPA region 5 along with many other states of the Midwest. According to the EPA, “The States of Michigan, Minnesota, and Wisconsin are the NPDES Permitting Authority for the majority of discharges within their respective states. The States of Illinois, Indiana, and Ohio are the NPDES Permitting Authorities for all discharges within their respective states” (US EPA Water Permits Division, Municipal Branch). NPDES refers to the EPAs National Pollutant Discharge Elimination System that regulates sources which discharge pollutants into waters of the United States. Unfortunately, ODOT, Ohio’s Department of Transportation, has yet to incorporate permeable pavement specifications or regulations into their Construction Materials and Specifications-2013 document. The City of Cincinnati does not have anything of the sort at the time either, so the best solution is to default to the Best Management Practices (BPMs) recommended by the EPA. Luckily, the EPA has an entire series called “The Green Infrastructure Permitting and Enforcement Series.” This series provides EPA and state permitting and enforcement professionals with a guide to integrating green infrastructure approaches into NPDES wet weather programs. The series consists of six factsheets and four supplements addressing general accountability considerations; CSOs; SSOs; stormwater; TMDLs (Total Maximum Daily Loads); and water quality standards. It also includes sample language and case studies to illustrate the concepts discussed (Federal Regulatory Programs). For example, the NPDES stormwater program requires

12 | P a g e
construction site operators engaged in clearing, grading, and excavating activities that disturb 1 acre or more, including smaller sites in a larger common plan of development or sale, to obtain coverage under an NPDES permit for their stormwater discharges.
There are also various independent organizations in their respective professional communities that have material to supplement permeable pavement topics. Such organizations include the Interlocking Concrete Pavement Institute (ICPI), the American Concrete Institute (ACI), the National Asphalt Pavement Association (NAPA), and the Water Environmental Research Foundation (WERF). In addition to these, some forward thinking states have incorporated permeable pavements into their specifications which can be researched if the EPA content is not sufficient.
In respect to safety and zoning, the City of Cincinnati City Planning and Buildings Department has maps to determine the boundaries of Burnet Woods and the neighboring residences. According to the City Planning and Buildings Department, Burnet Woods is not currently on the list of historical landmarks, which would indeed complicate any construction intent planned for the park. (Local Historic Landmarks - City Planning & Buildings). To ensure any construction that did take place was done in a safe and legal manner, the Occupational Safety and Health Administration (OSHA) standards must be known and followed by all parties involved. Not doing so could result in hefty fines and penalties, but even more so, possible fatalities. Making Burnet Woods Successful Pervious pavements could play a huge role in the revival of Burnet Woods. Due to their coarser surface, pervious pavement has proven to reduce glare and automobile hydroplaning accidents as well as reduce ice buildup on the pavement. By installing pervious pavements, doing so reduces the land requirement for retention basins which provides freedom to develop other areas of the park and ultimately evolve the park into a more attractive, profitable site (Pervious Pavement). In addition to increasing the number of visitors the park attains, the local residents have reason to promote permeable pavements, as well as other green infrastructure techniques. According to the Center for Neighborhood Technology (CNT), studies conclude that property values are notably higher in areas with low impact design and proximity to trees and other vegetation. In King County, Washington, it was estimated that properties adjacent to green infrastructure areas ranged from 3.5-5% higher than others. Another benefit involves noise reduction. With Burnet Woods being in the center of a very urban area, it is not always the “Oasis” it was mean to be with respect to the sounds surrounding visitors. A study in Europe using porous concrete pavement found a reduction in noise level of up to 10 decibels. In fact, there is also a correlation between lower noise levels and higher property values (Center for Neighborhood Technology), which only strengthens the incentive for local residents to apply pervious pavement in Burnet Woods. Social, Political, and Economic Issues Despite the multiple economic and social benefits presented above, there will be a part of the local population that is simply opposed to any new construction or development of Burnet Woods. Whether it is a sentimental connection or a general opposition to the noise, congestion and traffic that comes along with all construction, there will be a group that makes developing the park a hassle. Another very pertinent

13 | P a g e
argument that can often be presented is that of cost. Surrounding residents may be very passionate about reviving the park, but if funding the enhancements involves raising taxes to assist with the cost, it may cause a portion of those passionate residents to change their opinions. Cost Estimate Based on a rough estimate of length of new or improved roadways, and walking trails, a cost ranging from $2.3 to $4.9 million was calculated. In this calculation the Centennial Master Plan was used, using Ludlow Ave. as a scale. Ludlow is a 2 lane road with street parking on both sides, and was assumed to be 48 feet wide. Based on that scale, lengths of roadway were calculated where sections with parking tick marks were assumed to be 2 lanes with 18’ long parking spots for a width of 42’. Roads without parking tick marks were assumed to be 2 lane for a width of 24’ wide. Parking roads summed up to 3930 feet, non-parking roads to 2500 feet. Any new walking paths were assumed to be 9 feet wide and summed up to 11090 feet long. Per a study done in Northern Kentucky, permeable pavement cost varied from $7-$15 per square foot.
Length (ft) Width (ft) Square Footage
Price @$7/sf
Price @$15/sf
Parking Roads
3930 42 165060 1,155,420 2,475,900
Non-Parking Roads
2500 24 60000 420,000 900,000
Walking Paths/Trails
11090 9 99810 698,670 1,497,150
Total 2,274,090 4,873,050
Table 1.5 - Cost Estimate

14 | P a g e
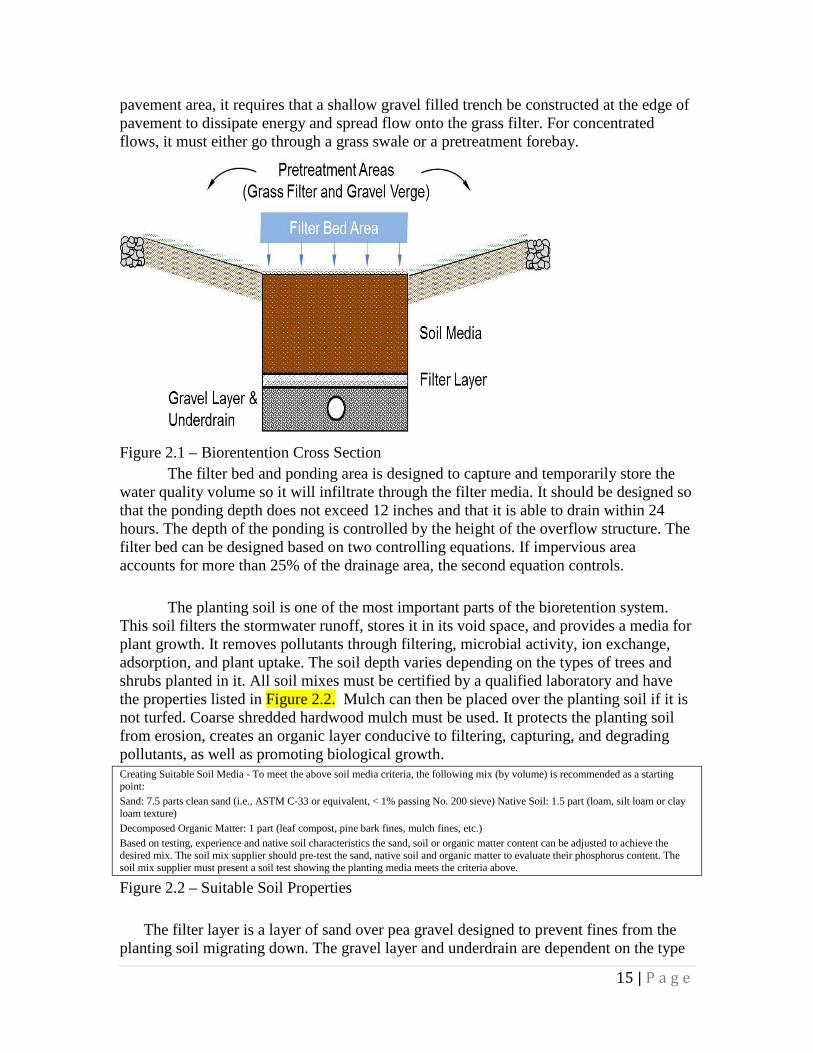
Engineering Intervention: Bioretention An engineering intervention we are proposing from the Uptown Parks Masterplan (2007) is the creation of a bioretention basin in the park. Bioretention is the use of soil media and plant material to remove pollutants from stormwater runoff. It is defined by the EPA to be a type of green infrastructure. The creation of these will improve the quality of water as well as assist in the control of stormwater runoff. The Uptown Parks Masterplan (2007) calls for native landscape restoration and biofiltration, which is synonymous with bioretention. The exact location of the bioretention basin is not specified on the plan. However, suggested placements of these will be addressed later in paper. Bioretentions are best used for small drainage areas, typically less than 2 acres. The Ohio Department of Natural Resources, Division of Soil and Water Conservation publishes the Rainwater and Land Development, which includes standards and guidelines for bioretentions. Bioretention is one of many stormwater management practices. They can provide effective treatment for many runoff quality problems including: total suspended solids, heavy metals, organic compounds, bacteria, and nutrients (specifically phosphorus and nitrogen). It does this by promoting settling, adsorption, microbial breakdown, and nutrient assimilation by plants. It is designed similarly to a detention basin, as the shape is similar but typically not as deep as a detention basin. It allows shallow ponding which will lead to gradual percolation through the soil media. From Table 2.1 below, it can be seen that compared to other typical stormwater management practices, TSS (the suspended solids) median removal for filtering and infiltration practices are the highest of any, 86% and 95%, respectively. The Ohio EPA allows flexibility and options for TSS, but has a target of 80% removal. The bioretention would exceed the recommendation of the Ohio EPA, and is also the best option available for the suspended solids removal. BMP Median TSS Removal (%) Dry Pond 47 Wet Pond 80 Stormwater Wetland 76 Filtering Practicies 86 Infiltratoin Practices 95 Table 2.1 There are several components of a bioretention system. Figure 2.1 shows a cross section for the general components. The pretreatment area is a grass filter used to capture excessive sediment before it reaches the filter bed area. High sediment loads can cause clogging of the bioretention material. The design of the pretreatment area depends on the type of flow, it can either be sheet drained or concentrated. For sheet drained from a
15 | P a g e
pavement area, it requires that a shallow gravel filled trench be constructed at the edge of pavement to dissipate energy and spread flow onto the grass filter. For concentrated flows, it must either go through a grass swale or a pretreatment forebay.
Figure 2.1 – Biorentention Cross Section The filter bed and ponding area is designed to capture and temporarily store the water quality volume so it will infiltrate through the filter media. It should be designed so that the ponding depth does not exceed 12 inches and that it is able to drain within 24 hours. The depth of the ponding is controlled by the height of the overflow structure. The filter bed can be designed based on two controlling equations. If impervious area accounts for more than 25% of the drainage area, the second equation controls. The planting soil is one of the most important parts of the bioretention system. This soil filters the stormwater runoff, stores it in its void space, and provides a media for plant growth. It removes pollutants through filtering, microbial activity, ion exchange, adsorption, and plant uptake. The soil depth varies depending on the types of trees and shrubs planted in it. All soil mixes must be certified by a qualified laboratory and have the properties listed in Figure 2.2. Mulch can then be placed over the planting soil if it is not turfed. Coarse shredded hardwood mulch must be used. It protects the planting soil from erosion, creates an organic layer conducive to filtering, capturing, and degrading pollutants, as well as promoting biological growth. Creating Suitable Soil Media - To meet the above soil media criteria, the following mix (by volume) is recommended as a starting point: Sand: 7.5 parts clean sand (i.e., ASTM C-33 or equivalent, < 1% passing No. 200 sieve) Native Soil: 1.5 part (loam, silt loam or clay loam texture) Decomposed Organic Matter: 1 part (leaf compost, pine bark fines, mulch fines, etc.) Based on testing, experience and native soil characteristics the sand, soil or organic matter content can be adjusted to achieve the desired mix. The soil mix supplier should pre-test the sand, native soil and organic matter to evaluate their phosphorus content. The soil mix supplier must present a soil test showing the planting media meets the criteria above.
Figure 2.2 – Suitable Soil Properties
The filter layer is a layer of sand over pea gravel designed to prevent fines from the planting soil migrating down. The gravel layer and underdrain are dependent on the type

16 | P a g e
of bioretention used. There are four different variations of bioretentions, all dependent on the existing conditions and design criteria.
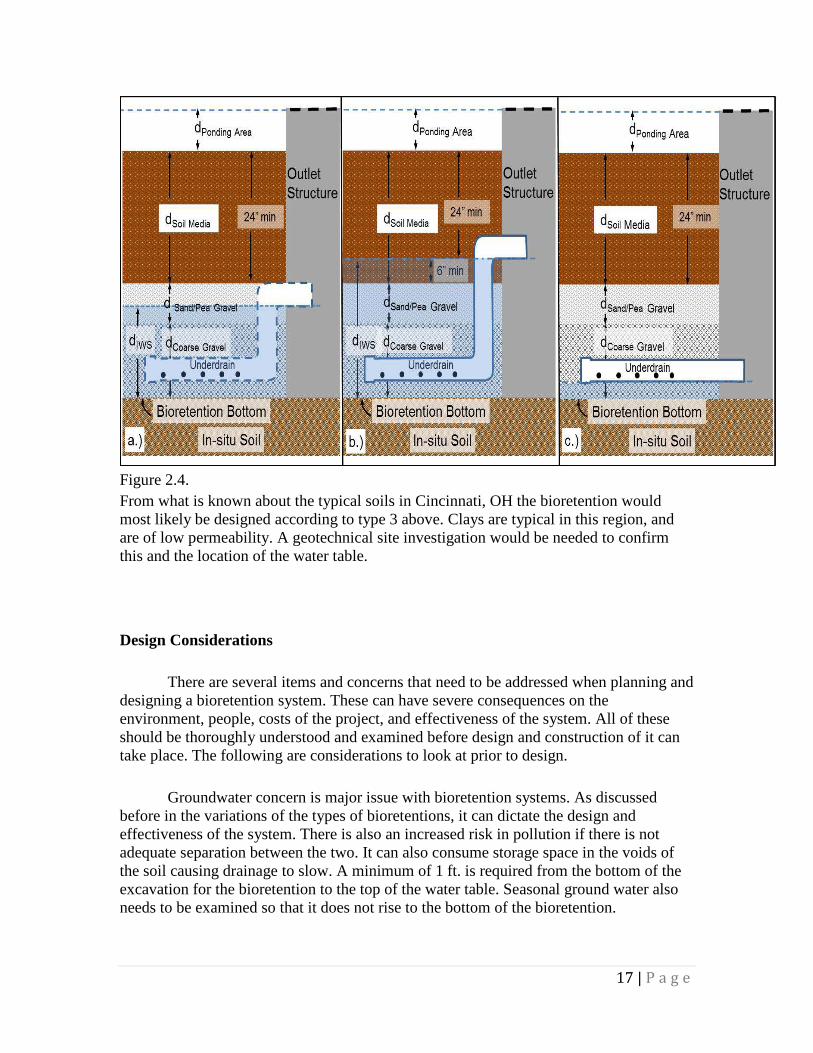
1. In-Situ Soils suitable for filtration. If in-situ soils can fully infiltrate the water within 48 hours and ground pollution risk is low, exfiltration can be used as the primary drainage. It may be designed without an underdrain. This is shown in figure 2.3.A.
2. Limited Infiltration and/or Enhanced Nitrogen Treatment. It provides an internal water storage layer below shown in Figure 2.4.B. It allows for extended exfiltration time. It also acts as an anoxic zone, which encourages denitrification. This design can provide between 40% and 80% removal of nitrogen from surface runoff.
3. Low Infiltration In-Situ Soils. Sites with low permeability soils, the underdrain provides most of the drainage.
4. Impermeable Liner. For sites with a high water table and shallow bedrock, an impervious liner separates the bioretention from in-situ soils and water table as shown in Figure 2.4.C. The underdrain provides all of the drainage. For sand, loamy sand, For loamy or silt soils For clayey soils with Kfs For situations, and sandy loam subgrade with 0.05<Kfs,0.5 in/hr. <0.05 in/hr. Some added where interaction soils with Kfs >0.5 in/hr. sump volume may be with groundwater acceptable on soils with and surrounding Kfs= 0.02 - 0.05 in/hr. soils must be Limited.
Figure 2.3
17 | P a g e
Figure 2.4. From what is known about the typical soils in Cincinnati, OH the bioretention would most likely be designed according to type 3 above. Clays are typical in this region, and are of low permeability. A geotechnical site investigation would be needed to confirm this and the location of the water table. Design Considerations There are several items and concerns that need to be addressed when planning and designing a bioretention system. These can have severe consequences on the environment, people, costs of the project, and effectiveness of the system. All of these should be thoroughly understood and examined before design and construction of it can take place. The following are considerations to look at prior to design. Groundwater concern is major issue with bioretention systems. As discussed before in the variations of the types of bioretentions, it can dictate the design and effectiveness of the system. There is also an increased risk in pollution if there is not adequate separation between the two. It can also consume storage space in the voids of the soil causing drainage to slow. A minimum of 1 ft. is required from the bottom of the excavation for the bioretention to the top of the water table. Seasonal ground water also needs to be examined so that it does not rise to the bottom of the bioretention.
18 | P a g e
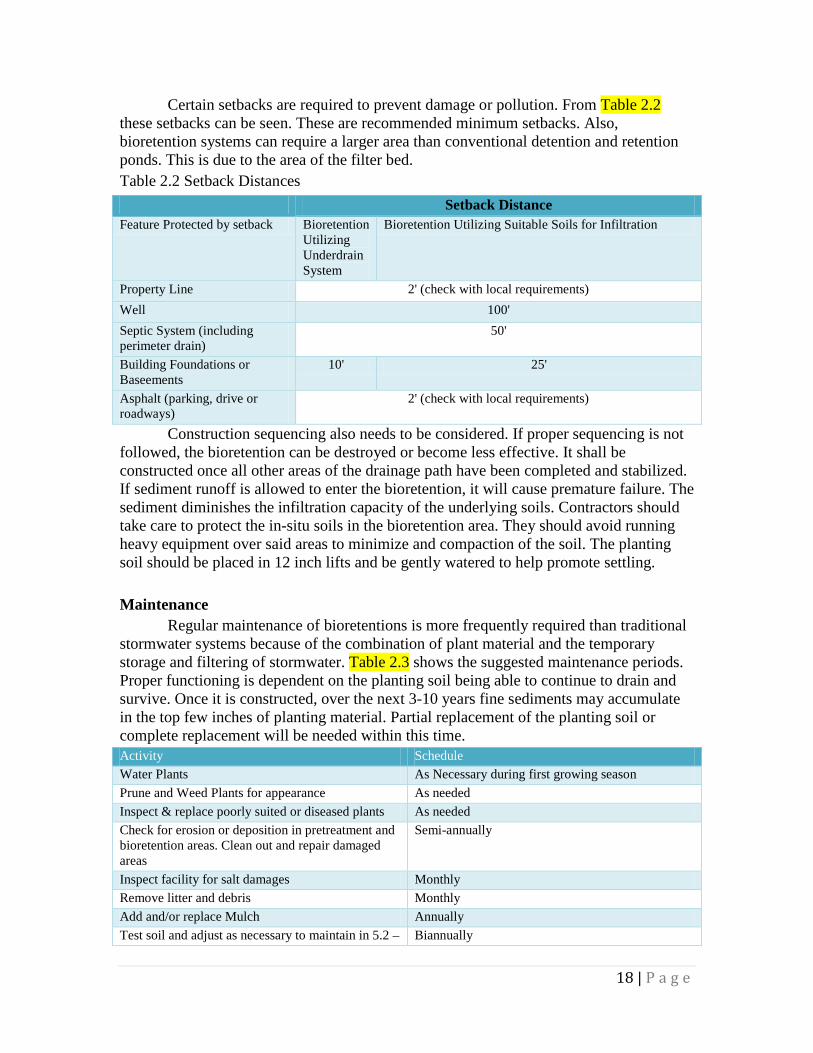
Certain setbacks are required to prevent damage or pollution. From Table 2.2 these setbacks can be seen. These are recommended minimum setbacks. Also, bioretention systems can require a larger area than conventional detention and retention ponds. This is due to the area of the filter bed. Table 2.2 Setback Distances
Construction sequencing also needs to be considered. If proper sequencing is not followed, the bioretention can be destroyed or become less effective. It shall be constructed once all other areas of the drainage path have been completed and stabilized. If sediment runoff is allowed to enter the bioretention, it will cause premature failure. The sediment diminishes the infiltration capacity of the underlying soils. Contractors should take care to protect the in-situ soils in the bioretention area. They should avoid running heavy equipment over said areas to minimize and compaction of the soil. The planting soil should be placed in 12 inch lifts and be gently watered to help promote settling. Maintenance Regular maintenance of bioretentions is more frequently required than traditional stormwater systems because of the combination of plant material and the temporary storage and filtering of stormwater. Table 2.3 shows the suggested maintenance periods. Proper functioning is dependent on the planting soil being able to continue to drain and survive. Once it is constructed, over the next 3-10 years fine sediments may accumulate in the top few inches of planting material. Partial replacement of the planting soil or complete replacement will be needed within this time. Activity Schedule Water Plants As Necessary during first growing season Prune and Weed Plants for appearance As needed Inspect & replace poorly suited or diseased plants As needed Check for erosion or deposition in pretreatment and bioretention areas. Clean out and repair damaged areas
Semi-annually
Inspect facility for salt damages Monthly Remove litter and debris Monthly Add and/or replace Mulch Annually Test soil and adjust as necessary to maintain in 5.2 – Biannually
Setback Distance Feature Protected by setback Bioretention
Utilizing Underdrain System
Bioretention Utilizing Suitable Soils for Infiltration
Property Line 2' (check with local requirements) Well 100' Septic System (including perimeter drain)
50'
Building Foundations or Baseements
10' 25'
Asphalt (parking, drive or roadways)
2' (check with local requirements)

19 | P a g e
8.0 pH range Check planting soil and filter layer for clogging, replacing, necessary portions
2-10 years/ as needed
Table 2.3 – Maintenance Schedule Case Study An existing county owned Park N Ride parking lot has had poorly managed drainage. This case study examines the benefits of using bioretention to manage the stormwater runoff. It also looks at the impact to the local stream and the reduction in pollutants. This case study was picked because of its in-depth analysis of the water quality benefits and the cost analysis breakdown.
Figure 2.5 – Drainage Area Two separate bioretention areas (Figure 2.6) are to be constructed on this property. The total drainage area is 6.5 acres with 3.8 of that as impervious area. The parking lot currently contributes drainage to poorly rated tributaries of the Cyprus Creek. The hydrology parameters used can be seen in Table 2.4. The goal was to improve the drainage and the water quality that enters the streams and tributaries. The soils are on this site are clay and silt loam.

20 | P a g e
Figure 2.6 – Bioretention Areas
Table 2.4 – Hydrology Parameter There are two bioretentions designed per MDE guidance that stipulates for over 5 acres of drainage there needs to be more than one. They are sized to manage a 1 inch storm. They are primarily designed as filtration structures with underdrains due to poor draining soils underlying them. The benefits can be seen in Table 2.5. The bioretention
Parameter
Value
Weighted Curve Number 84.9
Time of Concentration (hrs) 0.136 Flow 1-yr- Existing Cond (cfs) 12.0
Flow 2-yr- Existing Cond (cfs) 17.0
Runoff 1-yr- Existing Cond (in.) 1.33
Runoff 2-yr- Existing Cond (in.) 1.84
Flow 1-yr- Future Cond (cfs) 17.0
Flow 2-yr- Future Cond (cfs) 22.0
Runoff 1-yr- Future Cond (in.) 1.79
Runoff 2-yr- Future Cond (in.)
2.35
21 | P a g e
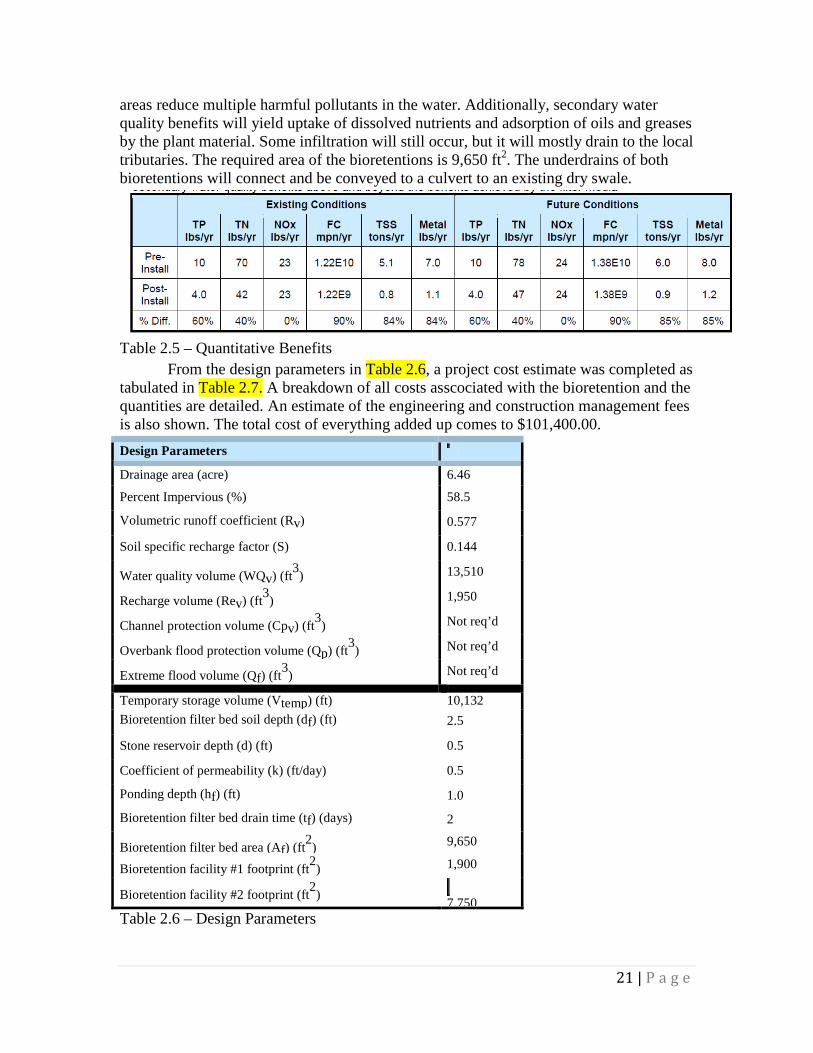
areas reduce multiple harmful pollutants in the water. Additionally, secondary water quality benefits will yield uptake of dissolved nutrients and adsorption of oils and greases by the plant material. Some infiltration will still occur, but it will mostly drain to the local tributaries. The required area of the bioretentions is 9,650 ft2. The underdrains of both bioretentions will connect and be conveyed to a culvert to an existing dry swale.
Table 2.5 – Quantitative Benefits From the design parameters in Table 2.6, a project cost estimate was completed as tabulated in Table 2.7. A breakdown of all costs asscociated with the bioretention and the quantities are detailed. An estimate of the engineering and construction management fees is also shown. The total cost of everything added up comes to $101,400.00. Design Parameters
Drainage area (acre) 6.46
Percent Impervious (%) 58.5
Volumetric runoff coefficient (Rv) 0.577
Soil specific recharge factor (S) 0.144
Water quality volume (WQv) (ft3) 13,510
Recharge volume (Rev) (ft3) 1,950
Channel protection volume (Cpv) (ft3) Not req’d
Overbank flood protection volume (Qp) (ft3) Not req’d
Extreme flood volume (Qf) (ft3) Not req’d
Temporary storage volume (Vtemp) (ft) 10,132 Bioretention filter bed soil depth (df) (ft) 2.5
Stone reservoir depth (d) (ft) 0.5
Coefficient of permeability (k) (ft/day) 0.5
Ponding depth (hf) (ft) 1.0
Bioretention filter bed drain time (tf) (days) 2
Bioretention filter bed area (Af) (ft2) 9,650
Bioretention facility #1 footprint (ft2) 1,900
Bioretention facility #2 footprint (ft2)
7,750 Table 2.6 – Design Parameters

22 | P a g e
Table 2.7 – Cost Estimate This case study can be directly correlated to the proposed design interventions in
Burnett Woods. The sizing of the bioretention areas can scaled from the drainage area to the area of the bioretentions in this study. Also, the water quality benefits can be used to show what kind of improvements bioretentions have. The total reduction in pollutants may not be the same, but the overall scope and what can be reduced will stay constant. Depending on the size and number of bioretention areas implemented in Burnett Woods, the project cost estimate of the County Park and Ride can altered to show a projected cost of the Burnett Woods project. This will serve as a ball park estimate for the project.

23 | P a g e
Location The red arrow on Figure 2.7 is pointing to the proposed location of the bioretention. This location was chosen because of multiple reasons. First, the natural topography of the area indicates that this is a low elevation point compared to the surrounding area. This will allow for natural drainage to slope into the bioretention as well as assist in piping stormwater runoff from nearby impervious pavements. Secondly, it will require minimal re-grading due to the current hydrology of the surrounding area.
Figure 2.7 – Location Within Burnet Woods
From scaling off of Google Earth, the drainage are from pervious area was determined to be approximately 200,000 ft2 or 4.6 acres. The potential drainage from impervious areas was estimated at 40,000 ft2 or 0.92 acres. This was based off of scaling from the drawing and reasonably guessing the drainage paths from the current and proposed roads and paths. The total drainage area would be 5.52 acres. This is similar to the County Park and Ride case study, which had a total drainage area of 6.5 acres, but had larger impervious drainage area of 3.8 acres.

24 | P a g e
Based off of the approximations for drainage areas, and comparing the scope of the bioretention area to that of the case study, a reasonable estimate can be produced. Changing the project cost estimate from the case study to the size of the bioretention used in Burnett Woods, a total cost can be calculated. The bioretention from the County Park and Ride had 6.5 acres of drainage and total bioretention area of 9,650 ft2 which is a ratio of 1485 ft2 per acre. Using this and the approximated area for the bioretention in Burnett Woods, it would be 8,200 ft2. This is slightly smaller than the bioretention in the case, about 85% of the size. Assuming the unit costs would remain the same for a different region and all other things considered, the cost for the bioretention in Burnett Woods be $86,190. Conclusion Burnet Woods is ideal for a bioretention system. Its natural landscape allows for a bioretention system to be placed without much altercation to the existing environment. It will help reduce the load on the stormwater system and improve the water quality by filtering it and reducing the pollutants. The cost is not prohibitive, especially when compared to the potential benefits. Overall, bioretention will provide many benefits to the community and environment.
25 | P a g e
Engineering Intervention: Solar Energy A Brief History
Currently, the vast majority of energy is produced by the burning of fossils fuels, such as coal, oil and natural gas. These traditional energy resources face several challenges that include rising prices, limited access and supply and risk associated with climate change, i.e. greenhouse gas emissions. As these challenges grow more and more severe, governments, businesses and consumers are beginning to turn alternative renewable energy resources, like solar power, geothermal, wind and hydroelectric energy. This paper will focus on the most rapidly growing of them all, solar energy.
In 1839 the photvoltaic effect was discovered by French physicist Alexandre Edmond Becquere. The photovoltaic effect is the generation of electrical energy upon exposure to light. When light hits certain metals it causes compounds to either emit electrons or accept electrons, and the combination of these compounds allows electrons to flow through a conductor and thereby creating electricity.
Up until the 1970s solar energy was deemed largely impractical due to high production costs for a low efficiency solar panel. During the 1970s Exxon Corporation developed a more efficient and more cost effective panel that marked a major step in the evolution of solar power as a viable alternative to fossil fuels. Exxon’s innovative design reduced the cost of producing panels from roughly $100 per watt to about $20 per watt.[1] Despite these challenges, under the right circumstances, solar energy projects make economic sense right now in Cincinnati. The cost of installing solar has dropped sharply from $9/watt a few years ago to less than $3/watt today. [6] There are currently 43 states that have state mandated incentive program that allow homeowners and businesses to sell their excess energy back to traditional utility providers at retail prices. This revenue comes in the form of credits on electric bills.[4] Cincinnati is a good location for solar. In fact, the country with the most solar electricity production is Germany. When compared to Germany, Cincinnati has more potential to make electricity from the sun (more southern latitude, and fewer average hours of cloud cover per year).[6]
Cincinnati is already home to the largest urban and educationally accessible solar array in the United States. The Cincinnati Zoo & Botanical Garden houses 2 large solar parking canopies that produce 1.6 megawatts of electricity which, over the years, will provide the zoo 20% of its power. It marks Cincinnati’s first major step in meeting its goal set forth in the Green Cincinnati Plan of 20% of all households and businesses containing some sort of solar system. The revitalization of Burnet Woods gives the city a chance to maximize the potential of the park as a tool to help reduce the large carbon footprint of the surrounding urban area.
Scope of Work The scope of work discussed in this proposal will be the implementation of a Photovoltaic (PV) solar system that consists of installing solar panels on the roofs of select existing structures and constructing solar parking canopies in areas along the proposed roadways given by the Centennial Master Plan for Burnet Woods.

26 | P a g e
Select structures include:
• Trailside Nature Center • Bandstand • Shelter on the west side of the park near
Clifton Ave.
The parking canopies are being proposed along the new roadway connecting Burnet Woods Dr. and Brookline Ave as shown in the figure on the right. Deliverables To determine the feasibility and practicality of implementing a PV system, the following engineering analyses will be conducted:
• Size and quantity of solar panels o This will include choosing a desired power output, providing loading
requirements for necessary structural calculations and a mounting system detail.
• Analysis of potential energy output and possible uses within the park • Required and recommended maintenance • Life cycle • Analysis of energy/cost savings • Analysis of climate benefits/effect on carbon footprint • Cost estimate • Aesthetically pleasing design • Ensure construction process abides by all legal/zoning/safety standards
Implementing A Photovoltaic System: What to Consider? How will the system be utilized? Is the aim to simply reduce energy costs or to try and eliminate them completely within the park? The more likely option here is to reduce the cost of energy within the park. With the space available and only a handful existing structures on which to place solar panels,
Figure 3.1 - Solar Array Locations

27 | P a g e
simply reducing energy costs is more feasible. Unless more drastic measures are taken, such as clearing trees and leveling the land for a small solar field, using 100% solar power in the park is unlikely. Some more outlandish and not-so-cost effective options include a floating solar array on the lake and using new technology in the form of solar roadways for all new roadway construction in the park. Is there enough space? As mentioned in the previous section, the existing layout and conditions of Burnet Woods limit its solar energy producing potential. Solar panels can be placed on the roofs of existing structures with minimal tree cover, ensuring maximum sun exposure. The proposed construction of new roadways and improved parking, also provide opportunities for solar implementation. What type of panel should be used? On existing structures, roof mounted PV systems will be used. The panels will be rail mounted with adjustable supports to tilt panels to an angle of optimum sun exposure. Sizing of the panels will determined depending on the desired power output and available space. The proposed parking canopies will be similar to those at the Cincinnati Zoo, only on a much smaller scale. The canopies will be single sloped, 1 parking space deep (18’ and 9’ wide per Structural Solar, LLC Design criteria) with vertical supports spaced from 18’ to 27’ on center. What is our budget? Cost is the ultimate limiting factor in all construction projects. That being said, solar arrays are easily expanded. An entire large system does not have to be implemented all at once. [5] It is estimated by the U.S. department of energy that most solar energy systems pay for themselves in only 5 years. Maintenance is minimal for rooftop solar panel systems. Regular rainfall is enough to keep the solar panels clean and functioning properly. Heavy leaf and snowfall may decrease the panels’ effectiveness. This can be easily mitigated with a spritz from a water hose or a light brushing. Design A preliminary design for the rooftop arrays would include a design of the mounting systems for each of the existing structures mentioned previously and the sizing of the panels with loading requirements for each. Included in the design of the parking canopies would be the structural dimensions, eave height and the aesthetics of the structure itself.
The main source of codes and standards for solar energy systems is the Solar America Board for Codes and Standards (Solar ABCs). Solar ABCs compiles documents, regulations, and technical materials related to solar codes and standards from ASTM International, the International Code Council, the National Fire Protection Association,

28 | P a g e
among numerous others. All PV systems shall be designed in accordance with the Article 690 Solar Photovoltaic (PV) Systems of the National Electric Code (NEC). [10]
• Zoning: per 1703-10.8.B of the Cincinnati Land Development Code – Height Encroachment. “The following may exceed the established limit of the district provided they do not exceed the maximum height by more than 6 feet.”
Safety
The majority if the health and safety risks associated with photovoltaic solar panels comes in the harvesting and processing of the raw materials that make up the solar cells. These things include fume silica, carbon and sulfur dioxide emissions, other highly volatile/combustible chemicals. The primary hazard after the installation of the rooftop panels arises in the event of a fire. Even though it is possible for toxic fumes to be released by the burning of the panels, it is of no major concern because the melting point of the materials is relatively high. The most serious safety hazard is the potential for shock or electrocution of firefighters that incidentally come in contact with high voltage conductors.
To mitigate this hazard, the model code developed by the California Department of Forestry & Fire Protection and the International Fire Code can be followed. It can be applied to both rooftop mounted and ground mounted solar arrays. [7] Economics As technology and awareness has improves over the years, the price of installing a solar panel system has steadily declined. It is estimated, that today, a PV system can be installed for as little as $3 per watt.
Figure 3.2 - Solar Price Plummet
The main driving force behind the price is the desired power output and size of the array, which will be determined later. However, the initial investment can be significantly reduced by government incentive programs. According to the U.S. Department of Energy, solar systems can pay for themselves in about 5 years.
http://www.vox.com/2014/9/29/6849723/solar-power-net-metering-utilities-fight-states

29 | P a g e
Case in point, the City of Springboro. In 2011, the City of Springboro launched its solar program that has since reduced its energy cost within the parks by 80%. It has also generated revenue in the form of Solar Renewable Energy Credits (SRECs) that can be sold to its traditional utility provider. It is also expected that the solar system will yield a return on investment in only 5.2 years. Figure 3.3 is a solar array installed on a shelter in a Springboro park. Sustainability
Most solar panel systems have life span ranging anywhere from 20 to 30 years, and most manufacturers’ warranties reflect that. Some manufacturers boast a linear decline in performance efficiency over the life of the panels, while others claim their panels decline in a stair stepping manner. This is shown in the figure below.
Figure 3.4 - Decline in Efficiency Over Time
As mentioned prior, solar energy can play and integral role in reducing Cincinnati’s Carbon Footprint and helping push towards the goal of doubling renewable energy production each year through 2020.
According to eGRID, Cincinnati’s electricity generating portfolio emits approximately 1 ton CO2 per megawatt hour. Since solar panels emit no CO2, each megawatt hour produced reduces CO2 emissions by 1 ton. If it is assumed that by 2028, that Cincinnati has met its 20% goal, CO2 emissions could be reduced by about 200,000 tons annually.
Figure 3.3 - Solar Array on Shelter at Springboro Park
http://www.ci.springboro.oh.us/solar-project.html
http://energyinformative.org/lifespan-solar-panels/

30 | P a g e
Table 3.1 - CO2 Reduction in Cincinnati
Human Factors Implementing renewable energy strategies, like solar energy, will not only save money, it will also increase awareness among the city’s residents as to the many alternate sources of clean energy that are available. The more people that are behind the renewable energy initiative, the easier it will be to reduce the reliance on fossil fuels, improve the overall quality of life in the area and spur further economic growth.[6]
Total (est.)
Twenty P ercent
Average P V system (kw)
Total C O2 removed (tons)
R es idences 150,000 30000 4.4 132000B usinesses 15,000 3000 22 66000Total 198000
Source: Green Cincinnati Plan

31 | P a g e
Engineering Intervention: Green Roofs
Growing in popularity, green roofs provide an excellent technique of green infrastructure with the goal of urban storm water runoff reduction, as well as reducing the urban heat island effect. In reference to green infrastructure as a whole, Will Rogers, Trust for Public Land, said it best, “Show me a healthy community with a healthy economy and I will show you a community that has its green infrastructure in order and understands the relationship between the built and the unbuilt environment.” Structurally, a type of building roof that is composed of various types of vegetation, a growing medium, filter layer membrane, and having the actual roof structure underlying. These type of roofs are not just considered green infrastructure due to the green color of the vegetation, but because of the specific ‘green’ environmental mitigation that a green roof provides. A green roof absorbs both sunlight and rainwater, filtering each in a separate way. Sunlight is absorbed by the vegetation, creating a shading effect for underlying roof surface hence creating a cooling or insulating effect for the building. Rain water is mitigated through the process of evapotranspiration, or transvaporation (both have the same meaning). Rainwater is absorbed and harvested by the vegetation. Plants absorb water through the growing medium and then emit the water through their leaves – this process is called transpiration. Evaporation, the conversion of a liquid to the gas from, occurs simultaneously, therefore creating evapotranspiration. (Reducing Urban Heat Islands, 2008)
Extensive Extensive roofs utilize a system of lighter weight material with the idea being to design a green roof that requires minimum maintenance while still providing environmental benefits to the owner. Plants that can survive in adverse conditions generally make the best choices extensive roofs. Structurally, green roofs will require the least amount of structural support due to the thinner medium and lighter weight vegetation used. This causes lower costs and overall lower maintenance. Extensive green roofs can be built on roofs up to 30° slope or even more, which would equal a ratio of rise to run of 7:12 or greater. The slope determines if the roof will need additional support to hold the growing medium and other parts of the vegetative layer in place to prevent a potential roof slide. (Reducing Urban Heat Island, 2008)
Figure 4.1 a & b – Green Roofs

32 | P a g e
Intensive An intensive green roof is the complete opposite of an extensive roof. It can include vegetation that would be thought of as normal garden vegetation, shrubs, trees, etc. Compared to extensive green roofs, intensive green roofs are heavier and require a higher initial investment and more maintenance over the long term than extensive roofs. They generally require more structural support to accommodate the weight of the additional growing medium, use of the public, and load of the vegetation. Irrigation systems are also often necessary for intensive roofs. Shown below is a comparison chart of advantages and disadvantages between extensive and intensive roofing systems. (Reducing Urban Heat Island, 2008)
Table 4.1 - Comaprison of Extensive and Intensive Roofing Systems
http://www.nps.gov/tps/sustainability/new-technology/green-roofs/define.htm
Depending on the level of maintenance and usage, an intensive, extensive, or semi-intensive (mix of both), should be utilized. In addition to type, location, climate, and slope of the proposed roof should be considered when choosing a design for optimum performance. We are proposing to utilize green roofing systems in Burnett Woods with both an intensive roof implanted on the new restaurant, as well as an extensive green roof retrofit to the existing trailside nature center.

33 | P a g e
Scope of Work The scope of work included for the proposal consists of using a semi-intensive
green roof structure and techniques for the construction of the new Burnett Woods Restaurant. In addition, the scope of work includes an intensive green roof retrofit to the existing Burnett Woods Trailside Nature Center. Deliverables
- Thorough design of both Intensive and Semi-Intensive green roof. o Including cross section design, calculation of structural dead and live
loads, and recommended vegetation to be used. - Complete design and construction cost estimate. - Required and recommended maintenance for the appropriate design. - Lifecycle analysis - Analysis of runoff mitigation and respective energy/cost savings. - Analysis of air quality and climate benefits/effect on carbon footprint. - Compliance with applicable engineering/architectural/technical standards and
guidelines. Design Selection Process When beginning the design of a green roof, many factors need to be considered. Siting considerations must be taken in to account before the design is chosen. Such considerations include whether the site will be new construction or a retrofit project. The amount of stormwater that a green roof mitigates is directly proportional to the area it covers, the depth and type of the growing medium, slope of the roof, type of plants selected (intensive vs. extensive), and amount of exposure to rainwater/stormwater. The larger the green roof area, the more stormwater that can be mitigated. Green roofs are appropriate for both commercial and industrial and large residential buildings such as condominiums or apartment complexes. Green roofs can also prove useful for small residential buildings under some circumstances. A building must be able to support the loading of green roof materials under fully saturated conditions. Green roofs can be designed to be either intensive, semi-intensive, or extensive green roofs. The type of design chosen will depend upon loading capacity, budget, design goals, and stormwater retention desired. There will also be variations in the type of green roof selected depending upon climate, types of plants chosen, soil layer depth desired and feasibility and other design considerations. Green roofs can be constructed layer by layer, or can be purchased as a system. Depending on the climate, many green roof systems will need to be designed that are tolerant to drought or colder temperatures. This would include the installation of an irrigation system in order to sustain the type of vegetation selected for the design, as well as plants that might be tolerable of the colder months of the year. In new construction, buildings should be designed to manage a potentially increased load associated with the green roof. When designing green roofs for existing structures, engineers must take the load restrictions of the building into account.

34 | P a g e
Maintenance Maintenance must also be considered during initial design. Once construction has been completed, green roofs, both intensive and extensive, must be monitored to ensure that the vegetation develops as planned. Depending on the season when the green roof is implemented, green roofs may need to be continuously irrigated and or fertilized. After the first season, extensive green roofs require much less maintenance compared to that of an intensive roof. The roofs may need occasional weeding and may require some watering during exceptionally dry periods. An easy system must be developed to mend leaks in the roof, as there are only two types of roofs in this world: those that have a leak, and those that will leak in the future. Intensive roofs need to be maintained just as any garden or vegetation of the like would need to be maintained. Benefits: Quantitative vs. Qualitative Installing a green roofing system can produce both qualitative benefits as well as quantitative as shown below: Quantitative Qualitative Reduced Energy Use Enhanced Quality of Life Reduced Air Pollution and Greenhouse Gas Emissions
Improved Human Health and Comfort
Stormwater Management Table 4.2 – Quantitative vs Qualitative Benefits Quantitiative Reduced Energy Use Through the process of shading and evapotranspiration, green roofs are able to ‘cool’ the roof surface significantly greater than a standard roof. A study was conducted on Chicago’s City Hall building compared to a neighboring building without a green roof. It was found that the green roof project for city hall could save approximately 9,270 kWh per, as well as savings in heating of 740 million Btus. (Department of Environment, City of Chicago) When translated to a dollar amount, this equals about $3,600 annual savings. (Department of Environment, Chicago City Hall, 2014) Reduced Air Pollution and Greenhouse Gas Emissions With reduced energy use comes reduced air pollution and greenhouse gas emissions. Researchers have found that a typical 1000sq.ft. extensive green roof can remove and average of 40 pounds of PM from the air annually. This equals to approximately the same amount that 15 passenger cars will emit in a given year. (Berghage, 2009) Stormwater Management Through the process of evapotranspiration and a green roofs ability to hold and store water, green roofs provide an excellent strategy to mitigate stormwater. A study in North Carolina found that during peak rainfall, green roofs were able to reduce rainwater run off by more than 75 percent. During temporary storage, green roofs can store more than 60 percent of all rainfall. (Moran, 2004)

35 | P a g e
Qualitative Enhanced Quality of Life Green roofs are able to provide the same type of quality of life benefits that a normal garden could depending on the type of green roof that is installed. It is also currently being researched that green roofs could potentially protect endangered or rare natural vegetation to an area. The elevation of the roof could protect the vegetation from potential predators and damage. Improved Human Health and Comfort Through the process of both shading and evapotranspiration, green roofs are able to create a cooling effect. This in turn delivers a significantly less need to use artificial sources such as aircondition to keep the building cool. This creates a more natural feel for the inside of the building. During the winter months, a green roof is able to act as a natural insulator, therefore reducing the amount of heating necessary to keep the building warm. Figure 4.2 - Roof Temperature Comparison Standard Roofs vs. Green Roofs During
July
http://www.nps.gov/tps/sustainability/greendocs/rosenzweig-sm.pdf
Figure 4.3 - Roof Comparison of Heat Flow Standard Roofs vs. Green Roofs

36 | P a g e
http://liveroof.com/solar-reflectance-how-green-roofs-reduce-energy-demands-2/
Costs Costs for both extensive and intensive green roof systems are more expensive than a standard roofing system, but the qualitative and quantitative benefits as described above. For an extensive green roof, the cost per square-ft of roof surface can range from $13.20-$31.05, and an additional $10-$15 for a retrofit project. Intensive roofs, largely depending on the vegetation used, can cost anywhere from $55.00-$338.00 ($200 of that coming from vegetation alone), plus an additional $10-$15. These square-footage estimates consider component design and specifications, project administration and site review, the green roof system itself, installation and labor, maintenance, irrigation systems, and additional guard rail system. For a standard extensive 2000 square-foot extensive green roof, the price can fluctuate anywhere from $26,000-$62,000. For a standard 2000 square-foot intensive green roof design, the price can fluctuate anywhere from $110,000-$676,000. See appendix for each square-footage cost breakdown. (Berhage, 2009) Figure 4.4 - Costs associated with Installing an Extensive Green Roof on an Existing Building

37 | P a g e
Figure 4.5Cost Associated with building an Intensive Green Roof on Existing Building
(Berghage, 2009)
Design Standards, Guides, Best Practices ASTM has produced several standards in regards to testing for green roof construction and they are as follows (ASTM, 2014):
- ASTM E2396 – Standard Testing Method for Saturated Water Permeability of Granular Drainage Media [Falling-Head Method] for Green Roof Systems.
- ASTM E2397 – Standard Practice for Determination of Dead Loads and Live Loads Associated with Green Roof Systems.
- ASTM E2398 – Standard Test Method for Water Capture and Media Retention of Geocomposite Drain Layers for Green Roof Systems.
- ASTM E2399 – Standard Test Method for Maximum Media Density for Dead Load Analysis.
- ASTM E2400 – Standard Guide for Selection, Installation, and Maintenance of Plants for Green Roof Systems.
The design must comply with National Fire Protection Association codes, National Electric Code, International Building Code. (GSA, 2009) LEED Certification is often needed to manage the design of a green roof, as well as accreditation by the Green Roof Professionals (GRP).

38 | P a g e
Social, Political, and Economic Issues With the magnitude of the proposed plan to update Burnett Woods, Social, Political, and Economical issues all need to be considered. Burnett Woods has been a staple of the Clifton Heights area since 1881, and holds a great deal of importance to locals who have used the park over the last 100 plus years. A major project conducted in Burnet Woods could potentially create unwanted traffic, costs, and social impacts that locals may not want to be a part of. These issues must be discussed more in depth for the final design proposal.

39 | P a g e
References Pervious Pavements:
1. Cannon, Phillippa. "U.S. Clean Water Act Settlement in Lima, Ohio, to Reduce Sewage Overflows." EPA, 20 Nov. 2014. Web.
2. Center for Neighborhood Technology, and American Rivers. "The Value of Green Infrastructure." (2010): 49-50. Web.
3. City Of Lancaster Green Infrastructure Plan. APPENDIX A - GREEN INFRASTRUCTURE TECHNOLOGY FACT SHEETS (n.d.): n. pag. Web.
4. CTC & Associates. "Comparison of Permeable Pavement Types: Hydrology, Design, Installation, Maintenance and Cost." Transportation Synthesis Report: Comparison of Permeable Pavement Types (n.d.): n. pag. 13 Jan. 2012. Web.
5. "Economic Benefits." The Concrete Network. N.p., n.d. Web. 09 Dec. 2014. 6. "Federal Regulatory Programs." United States Environmental Protection Agency. N.p.,
n.d. Web. 01 Dec. 2014. 7. Glist, Dustin. "The Double Life of Porous Paver-Curb Appeal with Function." Landscape
Online. N.p., Mar. 2006. Web. 8. "Implementing Green Infrastructure in Northern Kentucky Communities." US EPA:
Smart Growth: Stormwater Management Handbook: Implementing Green Infrastructure in Northern Kentucy Communities (n.d.): n. pag. May 2009. Web.
9. Invisible Structures. Grasspave2 Technical Specifications (n.d.): 4. 12 Apr. 2013. Web. 10. Kwiatkowski, Brian, Craig Straub, Daniel Ketzer, and David Russell. "A Holistic
Watershed Approach for CSO Separation and Removal | Articles | Stormwater." A Holistic Watershed Approach for CSO Separation and Removal | Articles | Stormwater. N.p., n.d. Web. 09 Dec. 2014.
11. "Local Historic Landmarks - City Planning & Buildings." City of Cincinnati Planning and Buildings. N.p., n.d. Web. 01 Dec. 2014.
12. National Asphalt Pavement Association. "Porous Asphalt." Asphalt Pavement. N.p., n.d. Web. 09 Dec. 2014.
13. Oh.gov., and Final As Of. Metropolitan Sewer District of Greater Cincinnati GLOBAL CONSENT DECREE Fact Sheet (n.d.): n. pag. Web.
14. "Pervious Pavement." Lake Superior Streams. N.p., n.d. Web. 01 Dec. 2014. 15. “The Economic Benefits of Green Infrastructure: A Case Study of Lancaster, PA.” 16. United States Department of Agriculture, and Natural Resources Conservation Service.
"Part 639 Hydrology National Engineering Handbook." N.p., May 2007. Web. 17. Urban Drainage and Flood Control District. Urban Storm Drainage Criteria Manual
Volume 3 (n.d.): 143-56. Nov. 2010. Web. 18. US Environmental Protection Agency. The Economic Benefits of Green Infrastructure: A
Case Study of Lancaster, PA (n.d.): n. pag. Feb. 2014. Web. 19. US EPA Water Permits Division, Municipal Branch. 2012 NPDES General Permit for
Stormwater Discharges From Construction Activities Appendix B Permit Areas Eligible for Coverage (n.d.): 2. Web. 1 Dec. 2014

40 | P a g e
Solar Panel:
1. Reece, Will. "The History of Solar Power." Energy and Utilities. Experience.com. Web. 10 Dec. 2014.
2. "Net Metering." Database of State Incentives for Renewables and Efficiency. U.S. Department of Energy, n.d. Web. 10 Dec. 2014.
3. Plumer, Brad. "Solar Power Is Growing so Fast That Older Energy Companies Are Trying to Stop It." Vox, 29 Sept. 2014. Web. 10 Dec. 2014.
4. Taylor, E. "Photovoltaics: Getting Started." Pvpower.com, 3 Nov. 2009. Web. 10 Dec. 2014.
5. "Green Cincinnati Plan." City of Cincinnati, 2013. Web. 10 Dec. 2014. 6. Good Company. "Health and Safety Concerns of Photvoltaic Cells." Oregon Department
of Transportation, n.d. Web. 10 Dec. 2014. 7. "Buying a Photovoltaic Solar Electric System: A Consumer Guide." California Energy
Commission, Apr. 2000. Web. 10 Dec. 2014. 8. "Codes and Standards." Solar ABCs, n.d. Web. 10 Dec. 2014. 9. Maehlum, Mathias A. "The Real Lifespan of Solar Panels." Energy Informative, 7 May
2014. Web. 10 Dec. 2014. 10. Structural Solar. "Design Criteria for Structural Solar Supports for Parking Canopies
Installations." N.p., n.d. Web. 10 Dec. 2014.
Bioretion:
1. Busiek, Brian, Flores, Hala. County Park and Ride Bioretention. Retrieved November 22, 2014 from http://www.aacounty.org/DPW/Watershed/AundelBeachParkandRide.pdf .
2. Kolar Designs. Cincinnati Parks Department. 2014. SRISYS, INC. Web. 22 November 2014.
3. Mathews, John. Division of Soil and Water Conservation. “ Rainwater and Land Development: Ohio’s Standards for Stormwater Management, Land Development and Urban Stream Protection”. Ohio Department of Natural Resources. Columbus, OH. December 2006 Third Edition.
4. n.p. www.epa.gov. United States Environmental Protection Agency. Website. 22 November 2014.
Green Roofs: 1. ASTM International. N.p., 05 Nov. 2014. Web. 27 Nov. 2014. <http://www.astm.org/>. 2. Berghage, Robert D., David Beattie, Christine Thuring, Farzaneh Razaei, and Thomas P.
O'Connor. "Green Roofs for Storm Water Runoff Control." (n.d.): n. pag. National Service Center for Environmental Publications. EPA. Feb. 2009. Web. 20 Nov. 2014. <nepis.epa.gov>.
3. Department of Environment. Chicago City Hall green roof project. Retrieved 27 November 2014 from <http://egov.city ofchicago.org>.
4. "Green Roof Accreditation." Green Roof Professionals. N.p., n.d. Web. 27 Nov. 2014. <http://greenroofs.org/index.php/education/grpaccreditation>.

41 | P a g e
5. GSA Green Roof Benefits and Challenges." General Services Administration. N.p., n.d. Web. 20 Nov. 2014. <http%3A%2F%2Fwww.gsa.gov%2Fportal%2FmediaId%2F167831%2FfileName%2FChallenges_to_Green_Roof_Construction.action>.
6. Moran, A., B. Hunt et al. 2004. A North Carolina Field Study to Evaluate Greenroof Runoff Quantity, Runoff Quality, and Plant Growth. Paper Presented at Green Roofs for Healthy Cities Conference, Portland, OR, June 2004.
7. Reducing Urban Heat Islands: Compendium of Strategies. Washington, DC: Climate Protection Partnership Division, U.S. Environmental Protection Agency, 2008. 2008. Web. 20 Nov. 2014. <http://www.epa.gov/heatislands/resources/pdf/GreenRoofsCompendium.pdf>.
Summary of Work: Introduction and Abstract: Jeff Cole and Cory Budinscak Pervious Pavements: Jeff Cole Solar Panels: Ryan Tincher Bioretention: Cory Budinscak Green Roofs: Tyler Munroe