“green gas” (sng) production by supercritical gasification of … · “green gas” (sng)...
TRANSCRIPT
November 2004
ECN-C--04-081
“GREEN GAS” (SNG) PRODUCTION BY SUPERCRITICAL GASIFICATION OF BIOMASS
M. Mozaffarian, E.P. Deurwaarder (ECN Biomass) S.R.A. Kersten (Twente University)
This project is realised by financial support of the NEO-Programme that Novem carries out in order of the
Dutch Ministry of Economic Affairs. The Novem project number is: 268-03-04-02-006
Revisions
A
Final version: 10 November 2004
B Made by: M. Mozaffarian
ECN-Biomass Verified/Approved by: R. van Ree
Issued by:
H.J. Veringa

2 ECN-C--04-081
Account The work described in this report has been performed by the Business Unit Biomass of the Energy Research Centre of the Netherlands (ECN), in cooperation with the University of Twente. This project has been carried out within the framework of the Novem-NEO Programme. The Novem project number is 268-03-04-02-006, and the ECN project number is 7.5229. Abstract The objective of this study was to evaluate the production of “Green Gas” (SNG) from relatively wet biomass/waste streams (70-95 wt.% water) by the supercritical (ca. 600°C, 300 bar) water gasification (SCWG) process. Wet biomass and related feedstock can be gasified in hot compressed water to produce combustible gas mixtures. At relatively low temperatures, just below the critical temperature, catalysts are required and gases rich in methane can be produced. At higher temperatures and supercritical conditions, hydrogen-rich gases are formed, especially from low-concentration feedstock. When the biomass concentration in water increases, the product will gradually contain more hydrocarbons and full conversion becomes difficult. Catalysts are required then to improve the conversion. Catalysts, suitable for long operating times, are not available yet. From the overall heat balance, it is demonstrated that intensive heat exchange between feedstock and products is essential, especially for gasification in supercritical water. This heat exchange is a non-trivial matter, as the feedstock will already produce decomposition products like tar and char or coke, while being heated. Non-conventional solutions for the pump, heat exchanger and reactor, as well as for residual carbon combustion, may be required to obtain a practical process. When producing SNG from the product gas, the present hydrogen should react with carbon oxides in a methanation unit. The high pressure of the product gas (300 bar) is favoured for methanation reactions. In practice, however, this is not proven yet. Although most impurities are expected to be removed with the aqueous phase, resulting in a large waste water stream, the product gas may still contain some impurities such as sulphur and chlorine. Additional guard beds might, therefore, be necessary to prevent deactivation of the methanation catalyst. An integral system analysis for the production of SNG from glycerol by SCWG was executed, based on an Aspen Plus equilibrium model. For a catalytic process with complete carbon conversion, overall SNG yields over 70% could be achieved. Considering the economy of the SCWG process, it seems more realistic that the development of the process be based on production of methane-rich gas or SNG, instead of hydrogen production. Low-temperature gasification will be favoured for SNG production, compared to high-temperature gasification of biomass, resulting in higher methane concentrations in the product gas, and a smaller external methanation unit. Besides, less external heat will be necessary, to bring the feedstock to the required reactor inlet temperature, both aspects resulting in lower costs. According to a first rough estimation, the SNG production costs by SCWG process are relatively high, even when the feedstock would be available for free. This is mainly due to relatively high investment and maintenance costs of this process, compared to other biomass/waste-related SNG production technologies. An important potential to reduce the production costs in the SCWG process is the application of wet organic waste streams as feedstock, with a negative market value. In other words, organic waste treatment can be a promising application for the SCWG process. The SCWG process is in an early stage of development. Additional R&D will be required at lab-/pilot-scale for the coming years, followed by a techno-economic evaluation of the process, with the related go no-go decision towards a demonstration. Keywords Biomass, Green Gas, synthetic natural gas, SNG, biofuels, supercritical gasification, subcritical gasification, methanation, feasibility, modelling, Aspen Plus

ECN-C--04-081 3
CONTENTS
LIST OF TABLES 4
LIST OF FIGURES 4
EXECUTIVE SUMMARY 7
1. INTRODUCTION 9 1.1 Background 9 1.2 Problem definition 9 1.3 Objective 10 1.4 Report outline 10
2. BIOMASS GASIFICATION IN SUB AND SUPERCRITICAL WATER: A REVIEW 11
2.1 Introduction 11 2.2 Short historical background 12 2.3 Theory 13 2.3.1 Supercritical and near supercritical water 13 2.3.2 Chemistry 13 2.3.3 Interpretation of the results with global models 14 2.3.4 Thermodynamics 14 2.4 Laboratory-scale results 17 2.4.1 Used reactor systems & interpretation of the results 17 2.4.2 Results of non-catalytic experiments 18 2.4.3 Catalytic results 25 2.5 Status of pilot-plant projects 28 2.6 Future prospects 31 2.7 Conclusions 32
3. MODELLING OF “GREEN GAS” (SNG) PRODUCTION BY SUPERCRITICAL GASIFICATION OF BIOMASS 33
3.1 Case definition 33 3.2 Availability of biomass and waste 34 3.3 Experimental data 36 3.4 System modelling 37 3.4.1 Introduction 37 3.4.2 Supercritical water gasification 37 3.4.3 Energy balance 38 3.4.4 Upgrading to SNG 40 3.4.5 Overall system energy balance 41 3.4.6 SNG as transportation fuel (CSNG) 41 3.4.7 Conclusions 41 3.5 Economic analysis 43 3.6 RD&D trajectory 45
4. CONCLUSIONS & RECOMMENDATION 47 4.1 Conclusions 47 4.2 Recommendation 48
REFERENCES 49
APPENDIX A PROPERTIES OF USED REACTORS ON LABORATORY SCALE 55
APPENDIX B REPORTED RESULTS OF NON-CATALYTIC GASIFICATION EXPERIMENTS 59

4 ECN-C--04-081
APPENDIX C REPORTED RESULTS OF CATALYTIC GASIFICATION EXPERIMENTS 65
LIST OF TABLES
Table 2-1 Influence of the reactor material on the carbon conversion (Xc,%) as reported by Antal and co-workers (Yu, 1993a) 18
Table 2-2 Typical reported results of SCWG for low, medium and high concentrations dry matter in the feedstock 19
Table 2-3 Comparison of gasification results of 10 wt.% glucose, lignin and wood at 600 and 750 oC as presented by van Swaaij et al. (Van Swaaij, 2003). The measurements were in quartz capillaries 20
Table 2-4 Comparison between fermentation and wet gasification 27 Table 2-5 Typical reported results of catalysed high-temperature SCWG 28 Table 2-6 Typical “raw” gas composition for gasification of 5 wt.% glycerol with and
without additives 30 Table 3-1 Possible sources for anaerobic digestion for the generation of methane in the
Netherlands (Reith et al., 2003) 35 Table 3-2 Capillary data (at 300 bar) 36 Table 3-3 Pilot plant data (at 300 bar) 36 Table 3-4 Input data integrated system based on glycerol as feed stream 39 Table 3-5 Stream properties for a system as given in table 3-4 and figures 3-3 and 3-6 40 Table 3-6 Properties of some of the streams for a system as given in table 3-4 and figure
3-6 41 Table 3-7 Modelling results of integrated systems for production of SNG and CSNG by
gasification of wet biomass in supercritical water, followed by methanation 42 Table 3-8 Reported costs for SCWG (Kersten, 2003) 44
LIST OF FIGURES
Figure 2-1 Lumped reaction path scheme for gasification of biomass in supercritical water (SCWG). 14
Figure 2-2 Results of equilibrium calculations for low-temperature and high-temperature gasification of C6H12O6 in hot compressed water 15
Figure 2-3 The efficiency of a water-water counter-current heat exchanger plotted versus the operating pressure for different surface areas, AHE: (m2) per unit throughput (kg/s). The flow rates (kg/s) on both sides were assumed to be equal in the calculations. U = 1000 W/(m2.K), Thot,in = 600 oC, Tcold,in = 25oC 16
Figure 2-4 Reported experimental SCWG results for glucose. a) Xc versus the reactor temperature (all reported glucose data are plotted, see Table B-I, Appendix B), b) product composition versus the reactor temperature (Lee, 2002) 21
Figure 2-5 Product composition and carbon conversion versus the dry matter content in the feed (Yu, 1993a) 22
Figure 2-6 a) Influence of pressure on the gas yields (1.8 wt.% of glucose at 700 oC), b) influence of pressure on the carbon efficiency for different components. The data were obtained by a series of capillary experiments as described by Van Swaaij et al. (Van Swaaij, 2003) 23
Figure 2-7 Parity plots of calculated versus measured carbon conversions for: a) the severity concept, b) two competing 1st order reaction and c) competing 1st (r2,1)
ECN-C--04-081 5
and 2nd (r2,2) order reactions. All glucose data (see Table B-I, Appendix B) were included in the analysis 24
Figure 2-8 Low-temperature gasification results with different biomass feedstocks and catalysts (Matsumura) 26
Figure 2-9 Low-temperature gasification of manure in a continuous set-up. COD conversion, carbon conversion and the fraction of methane in the product gas are plotted versus the LHSV (Liquid Hourly Space Velocity) 27
Figure 2-10 Simplified scheme of the PDU for biomass gasification in supercritical water, built by BTG for the University of Twente 30
Figure 2-11 Pilot plant results. Product composition for gasification of 5 wt.% glycerol with 0.0075wt.% NaOH 30
Figure 2-12 Scheme for application outlets of SCWG 31 Figure 3-1 ”Green Gas” (SNG) production by supercritical gasification of biomass 33 Figure 3-2 Hydrogen production by supercritical gasification of biomass 33 Figure 3-3 Simplified scheme of the Aspen Plus model 37 Figure 3-4 Aspen Plus modelling results (equilibrium calculation) for gasification of
glycerol: (a) carbon conversion as function of wt.% glycerol, (b) gas composition as function of wt.% glycerol, (c) gas composition as function of temperature, (d) gas composition as function of pressure 38
Figure 3-5 Aspen Plus modelling results: (a) heat capacity of water at 300 bar as function of temperature, (b) temperature profile of the feed stream and product gas in the heat exchanger 39
Figure 3-6 Simplified scheme of the downstream treatment of the Aspen Plus model 40

6 ECN-C--04-081

ECN-C--04-081 7
EXECUTIVE SUMMARY
Problem definition One of the potentially interesting processes for the production of “Green Gas” (SNG) is the supercritical water gasification (SCWG) of relatively wet biomass/waste streams (70-95 wt.% water). Gasification in hot compressed water converts wet biomass/waste streams into medium calorific gas, rich in either hydrogen or methane. “Green Gas” production can then be realised by the integration of SCWG of biomass/waste and methanation/gas conditioning in one process. This concept is especially interesting for the transition to a renewable fuel based economy, using the existing natural gas infrastructure. To evaluate the potential of the SCWG technology and make a comparison with other SNG production technologies, it is necessary to carry out a technical and economic analysis of the technology for this specific application.
Objective The objective of this study was to evaluate the production of “Green Gas” (SNG) from relatively wet biomass/waste streams (70-95 wt.% water) by the supercritical (ca. 600°C, 300 bar) water gasification (SCWG) process. This project can be considered as a complementary work to an earlier NECST study “Feasibility of biomass/waste-related SNG production technologies” (Mozaffarian et al., 2003), in which, based on comparable assumptions, a number of biomass conversion technologies for SNG production are evaluated.
Conclusions A detailed review has been carried out regarding both sub- and supercritical gasification of biomass. Also based on experimental data, delivered by the University of Twente, an integrated model has been developed within the Aspen Plus process simulation package. Based on the literature survey and the modelling work the following conclusions are made: 1. Wet biomass and related feedstock can be gasified in hot compressed water to produce
combustible gas mixtures. If produced, contaminants like tars and particulates will be in the liquid phase. At relatively low temperatures, just below the critical temperature, catalysts are required and gases rich in methane can be produced. At higher temperatures and supercritical conditions, hydrogen-rich gases are formed, especially from low-concentration feedstock. When the biomass concentration in water increases, the product will gradually contain more hydrocarbons and full conversion becomes difficult. Catalysts are required then to improve the conversion. Catalysts, suitable for long operating times, are not available yet.
2. From the overall heat balance, it is demonstrated that intensive heat exchange between feedstock and products is essential, especially for gasification in supercritical water. This heat exchange is a non-trivial matter, as the feedstock will already produce decomposition products like tar and char or coke, while being heated. Non-conventional solutions for the pump, heat exchanger and reactor, as well as for residual carbon combustion, may be required to obtain a practical process.
3. When producing SNG from the product gas, the present hydrogen should react with carbon oxides in a methanation unit. The high pressure of the product gas (300 bar) is favoured for methanation reactions. In practice, however, this is not proven yet. Although most impurities are expected to be removed with the aqueous phase, resulting in a large waste water stream, the product gas may still contain some impurities such as sulphur and chlorine. Additional guard beds might, therefore, be necessary to prevent deactivation of the methanation catalyst.
4. An integral system analysis for the production of SNG from glycerol by SCWG was executed, based on an Aspen Plus equilibrium model. For a catalytic process with complete carbon conversion, overall SNG yields over 70% could be achieved.
8 ECN-C--04-081
5. Considering the economy of the SCWG process, it seems more realistic that the development of the process be based on production of methane-rich gas or SNG, instead of hydrogen production. Low-temperature gasification will be favoured for SNG production, compared to high-temperature gasification of biomass, resulting in higher methane concentrations in the product gas, and a smaller external methanation unit. Besides, less external heat will be necessary, to bring the feedstock to the required reactor inlet temperature, both aspects resulting in lower costs.
6. According to a first rough estimation, the SNG production costs by SCWG process are relatively high, even when the feedstock would be available for free. This is mainly due to relatively high investment and maintenance costs of this process, compared to other biomass/waste-related SNG production technologies. An important potential to reduce the production costs in the SCWG process is the application of wet organic waste streams as feedstock, with a negative market value. In other words, organic waste treatment can be a promising application for the SCWG process.
7. The SCWG process is in an early stage of development. Additional R&D will be required at lab-/pilot-scale for the coming years, followed by a techno-economic evaluation of the process, with the related go no-go decision towards a demonstration.

ECN-C--04-081 9
1. INTRODUCTION
1.1 Background Within the Dutch sustainable energy policy an important role is foreseen for the application of biomass and waste. 10% of the total primary energy demand in 2020 has to be fulfilled by renewable energy sources (MEZ, 1995, 1997). About 50% of this policy target has to be realised by biomass and waste. For the long term (2040) the Dutch Ministry of Economic Affairs has proposed a Biomass Vision within the Energy Transition activities, declaring that 30% of the fossil fuels in the power and transportation sectors, and 20-45% of the fossil-based raw materials in the chemical industry have to be substituted by biomass (MEZ, 2003). In the short term (< 5 years) biomass will mainly be used for direct and indirect cofiring in conventional power plants. In the mid term (5-10 years) it is expected, that the technology for stand-alone decentralised CHP would be mature enough to become an important option. However, in order to satisfy the long-term (> 10 years) expectations of using biomass in the future energy infrastructure, this renewable energy source should also be used as a substitute for fossil fuels in other market sectors. To realise this, conversion technologies should be developed to produce secondary energy carriers from biomass (such as Fischer-Tropsch diesel, methanol, bio-ethanol, “Green Gas” (SNG), or H2), substituting the present conventional energy carriers based on petroleum and natural gas. Compared to other biomass conversion routes, the major advantage of the “Green Gas” concept is, that it is a cheap and simple method for large-scale introduction of bio-energy at many locations, including the small consumers. This is thanks to the existing dense Dutch and European gas infrastructure. For Europe this will contribute to the security of gas supply, which will be more and more dependent from import, while for the Netherlands it will save the natural gas resources for a longer period. Furthermore, “Green Gas” is easier to transport and store than electricity or heat. The gas grid losses (<1%) are much less than those of the electricity and heat distribution networks (4% and 15%). Promising near future applications for “Green Gas” are co-generation at household level, and as alternative fuel for transportation (i.e. CNG).
1.2 Problem definition One of the potentially interesting processes for the production of “Green Gas” (SNG) is the supercritical water gasification (SCWG) of relatively wet biomass/waste streams (70-95 wt.% water). At temperatures and pressures above the critical point of water (Tc = 373.95oC, Pc = 220.64 bar) there is no distinction between gas phase and liquid phase. Also the behaviour of water will change considerably at these supercritical conditions, and water will even be consumed as a reactant. Gasification in hot compressed water converts wet biomass/waste streams into medium calorific gas, rich in either hydrogen or methane. “Green Gas” production can then be realised by the integration of SCWG of biomass/waste and methanation/gas conditioning in one process. This concept is especially interesting for the transition to a renewable fuel-based economy, using the existing natural gas infrastructure. To evaluate the potential of SCWG technology and make a comparison with other SNG production technologies, it is necessary to carry out a technical and economic analysis of the technology for this specific application.

10 ECN-C--04-081
1.3 Objective The objective of this study is to evaluate the production of “Green Gas” (SNG) from relatively wet biomass/waste streams (70-95 wt.% water) by the supercritical (ca. 600°C, 300 bar) water gasification (SCWG) process. This project can be considered as a complementary work to an earlier NECST study “Feasibility of Biomass/Waste-Related SNG Production Technologies” (Mozaffarian et al., 2003), in which, based on comparable assumptions, a number of biomass conversion technologies for SNG production are evaluated.
1.4 Report outline Chapter 2 gives a review of biomass gasification in sub and supercritical water. Chapter 3 presents the modelling of “Green Gas” (SNG) production by supercritical gasification of biomass. The conclusions and recommendation are presented in chapter 4.
ECN-C--04-081 11
2. BIOMASS GASIFICATION IN SUB AND SUPERCRITICAL WATER: A REVIEW
The literature survey, presented in this chapter, is carried out by the University of Twente (Kersten, 2003).
2.1 Introduction Continuing emission of carbon dioxide to the atmosphere is generally accepted to be the largest cause of global warming. CO2 from fossil fuels combustion is currently held responsible for over 60% of the enhanced greenhouse effect (UNFCCC, 2002). The ambition to reduce these emissions has led to worldwide research programs concerned with new and renewable energy production technologies. Biomass is considered to be a renewable energy source, because, through biomass, CO2 is stored via photosynthesis and released via combustion within a relatively short cycle and with no net production. Although wet biomass may have a very low overall heating value, advanced conversion processes may still extract products with a high heating value from it. Very wet biomass (moisture content > 70 wt.%) cannot be converted economically by traditional techniques like pyrolysis, combustion, and gasification, due to the cost and energy requirement for water evaporation (2.4 MJ/kg at atmospheric conditions). Gasification in hot compressed water is considered as a promising technique to convert such wet streams into medium calorific gas, rich in either hydrogen or methane. In hot compressed water (say P > 200 bar), the heat effects associated with water evaporation are only marginal compared to ambient conditions (∆Hvap becomes zero at Pc). Therefore, by practicing countercurrent heat exchange between the feed stream and the reactor effluent, high thermal efficiencies can be reached despite of the low dry matter content of the feedstock. Apart from this essential energetic benefit, the unique properties of hot compressed water are believed to promote ionic reaction pathways over radical routes, leading to less char formation (Buhler, 2002; Penninger, 1999). Furthermore, it was found that organic molecules are very reactive in pressurised water at temperatures above 250oC. This provided a major impetus for the use of hot compressed water as reaction medium for waste disposal processes. Roughly speaking, there are two approaches to gasification in hot compressed water in terms of reaction temperature ranges. In low-temperature catalytic gasification at 350 to 400oC, the feedstock is gasified with the help of a catalyst into a methane-rich gas. High temperature supercritical gasification is carried out in the range of 500 to 700oC, with or without catalysis, and produces primarily hydrogen. This paper is a review of both technologies. The following items are included: 1. The historical background of the process development. 2. Theoretical aspects of the process regarding the properties of hot compressed water, the
postulated chemistry, and thermodynamics. 3. An analysis of reported laboratory and bench scale results with respect to the influence of
the operating conditions, the catalysis applied, and mutual consistency. 4. Process data such as: feedstock specifications, mass balance, contamination level of the
effluent water, and costs. 5. The status of the running pilot plant projects. 6. An overall assessment of the process plus a comparison with fermentation, being an
alternative process for the conversion of wet biomass.

12 ECN-C--04-081
2.2 Short historical background Already in 1978 biomass was proposed as a potential feedstock for hydrogen production (Antal, 1978):
C6H10O5 + 7H2O → 6CO2 + 12H2 (2-1) In this idealised stoichiometric equation, cellulose (represented as C6H10O5) reacts with water to produce hydrogen and carbon dioxide, mimicking the commercial manufacture of hydrogen from methane by catalytic steam reforming (Van Hook, 1980; Xu, 1989a; Xu, 1989b; Wagner, 1992). Antal reported detailed thermochemical equilibrium predictions concerning this reaction at ambient pressure. Temperatures above 600°C were predicted to leave no solid carbon product and produce a gas rich in H2, CH4, CO, and CO2. At the same time, studies were reported of the reaction kinetics of cellulose pyrolysis in steam. The presence of steam showed little or no measurable effect on the pyrolysis reactions (Antal, 1978; Antal, 1980; Mok, 1983a; Mok, 1983b). Moreover, it was found that biomass did not react directly with steam at atmospheric pressure to produce the desired products. Instead, significant amounts of tar and char were formed, and the gas contained higher hydrocarbons in addition to the desired light gases (Antal, 1980; Antal, 1982; Antal, 1983a; Antal, 1985a; Antal, 1985b). The later work of Corella and his co-workers (Herguido, 1992) still illustrates these obstacles for conversion to gases. In a fluid bed operating at atmospheric pressure Corella’s group observed char yields of 10 to 20 wt.% from the steam gasification of wood sawdust, and yields of tar decreasing to 4 wt.% as the temperature of the bed increased from 650 to 775°C. Unfortunately, even at the highest temperature only 80% of the carbon in the feedstock was converted to gas (Antal, 1978; Antal, 1980; Mok, 1983a; Mok, 1983b). By employing a secondary, fluidised bed of calcined dolomite operating at 800 to 875°C, Corella and his co-workers (Delgado, 1997) were able to convert almost all the tar to gas. Nevertheless, the char byproduct remained unconverted. Any production of char represents an effective loss of gas. Many other workers have reported similar results (Bridgwater, 1995). Thus, the formation of pyrolytic char and tar during gasification sets limits on the efficient production of hydrogen from biomass by steam reforming at low pressure. A possible way to overcome these problems was presented in 1985, when Modell (Modell, 1985) described experiments involving the quick immersion of maple wood sawdust in supercritical water (SCWG). The sawdust quickly decomposed to tars and some gas without the formation of char. This paper set off the research on gasification of biomass in supercritical water. Since then, researchers of Hawaii University, Forsungszentrum Karslruhe (FzK), Osaka Gas, NIRE, Hiroshima University, BTG and the UT, have explored the process constantly on laboratory scale. By employing a carbonaceous catalyst at temperatures above 600°C and pressures in excess of the critical pressure, complete gasification of a 22 wt.% glucose solution (Xu, 1996a) and a 14 wt.% sawdust emulsion has been achieved (Xu, 1998). Nevertheless, carbon is perceived to be an unlikely and will probably not be the catalyst finally selected for the process. Recently two, so far non-catalytic, pilot-scale demonstration plants have been erected and started-up by the University of Twente and FzK. Research conducted in the early eighties on biomass gasification mechanisms suggested that the combined advantage of a high-pressure environment and a metal catalyst could compensate in the slow reaction kinetics found for operation at lower temperatures (Elliott, 1985). Ideal gasification of a cellulose-based material in pressurised water at low temperatures can be described by:
C6H10O5 + H2O → 3CO2 + 3CH4 (2-2) In autoclaves, at 210 bar and subcritical temperature (350oC), near-total conversion of the complex organic structure of biomass to gas was accomplished in the presence of a ruthenium metal catalyst. The gas produced was a medium-heating-value (high excluding CO2) gas due to the synthesis of important levels of methane, as dictated by thermodynamic equilibrium calculations. This type of processing, called the Battelle concept (Elliott, 1994a), has been also

ECN-C--04-081 13
accomplished at bench-scale in continuous-flow reactor systems in the mid nineties. More recent results with improved catalyst formulations have provided a basis to move the process development forward from the bench-scale to a scaled-up reactor system operated at 6-33 litres per hour (Elliott, 1999). Tests with this pilot facility processing waste water streams showed that this process could be used effectively to clean the waste water and to recover the combustion value of the organic waste in the form of useful fuel gas.
2.3 Theory
2.3.1 Supercritical and near supercritical water The behaviour of water above and near the critical point (Tc = 373.946 oC, Pc = 220.640 bar) has been studied extensively (Shaw, 1991; Franch, 1987). In fact, al relevant physical properties have been determined experimentally and are tabulated (NIST). Here only the properties, which have been associated with hot compressed water as a new reaction medium, are discussed. 1. The dielectric constant of supercritical water is in the range of 2 to 30 (εr = 80 for water at
ambient conditions). This range covers solvents from hexane (non-polar) to methanol (polar). The reduced dielectric constant combined with a considerably diminished number of hydrogen bonds causes that hot compressed water behaves like an organic solvent. For many organic compounds high solubilities can be achieved in near critical water and complete miscibility can be attained in supercritical water. Moreover, gases are also completely miscible in supercritical water. On the other hand, salts will hardly dissolve in supercritical water, because of the low dielectric constant.
2. In the vicinity of the critical point, the ion-product can be as high as 10-11. As a result, the H+-ion concentration is about thirty times higher than at ambient conditions. This indicates that, near the critical point, water possesses the properties of an acid / base catalyst. In the high-temperature range of the supercritical region, the ion-product decreases again to very low values. In fact, Kw is about 9 orders of magnitude lower at 600oC and 250 bar than at ambient conditions.
3. Due to its low density and viscosity and high diffusibility, supercritical water has excellent transport characteristics.
4. A slight change in pressure or temperature can generate a huge change in the physical properties. This facilitates fast control over the properties, allowing a “switching” operation mode.
2.3.2 Chemistry Because of the miscibility of organic compounds and gases in supercritical water, there is an opportunity to conduct chemistry in a single phase that otherwise would have to occur in a multiphase system. This has several advantages, viz. there are no inter-phase mass transfer limitations reducing the reaction rates, and higher concentrations of reactants can be attained. It has been found that the strong dissociation of water near the critical point generates a sufficiently high H+-concentration for acid-catalysed organic reactions to proceed without any added acid (Penninger, 1999; Penninger, 1988; Xu, 1997a; Savage, 1999). Several studies have been conducted in order to unravel such ionic mechanisms for the conversion of biomass-derived components in supercritical water (Antal, 1988; Adschiri, 1993; Sakaki, 1996; Kabyemela, 1998; Kabyemela, 1997; Kabyemela, 1999). Some proofs have been presented that, indeed, near the critical point, ionic chemistry is more dominant than radical chemistry (Buhler, 2002; Kabyemela, 1998; Kabyemela, 1997; Kabyemela, 1999). In addition, parts of the reaction network of the decomposition of model compounds in hot compressed water have been elucidated. However, a reaction scheme provided with rate equations, useful for reactor engineering purposes, is not yet available.
14 ECN-C--04-081
No studies were found that report on mechanistic investigations of biomass gasification in hot compressed water in the high-temperature regime. Although it seems plausible that, due to the higher temperature and the impossibility of hydrolysis, as a result of the very low Kw, radical reactions (pyrolysis and cracking) control the chemistry (Ea ≈ 150 kJ/mole for pyrolysis (Wagenaar, 1994)).
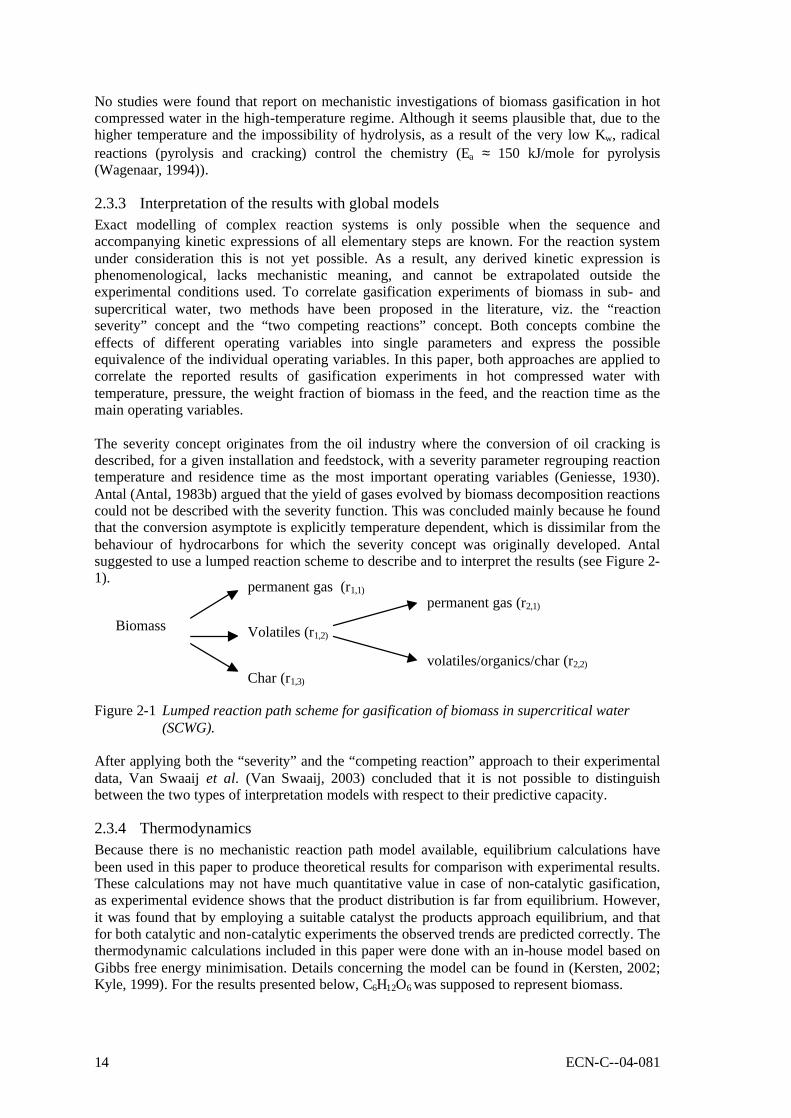
2.3.3 Interpretation of the results with global models Exact modelling of complex reaction systems is only possible when the sequence and accompanying kinetic expressions of all elementary steps are known. For the reaction system under consideration this is not yet possible. As a result, any derived kinetic expression is phenomenological, lacks mechanistic meaning, and cannot be extrapolated outside the experimental conditions used. To correlate gasification experiments of biomass in sub- and supercritical water, two methods have been proposed in the literature, viz. the “reaction severity” concept and the “two competing reactions” concept. Both concepts combine the effects of different operating variables into single parameters and express the possible equivalence of the individual operating variables. In this paper, both approaches are applied to correlate the reported results of gasification experiments in hot compressed water with temperature, pressure, the weight fraction of biomass in the feed, and the reaction time as the main operating variables. The severity concept originates from the oil industry where the conversion of oil cracking is described, for a given installation and feedstock, with a severity parameter regrouping reaction temperature and residence time as the most important operating variables (Geniesse, 1930). Antal (Antal, 1983b) argued that the yield of gases evolved by biomass decomposition reactions could not be described with the severity function. This was concluded mainly because he found that the conversion asymptote is explicitly temperature dependent, which is dissimilar from the behaviour of hydrocarbons for which the severity concept was originally developed. Antal suggested to use a lumped reaction scheme to describe and to interpret the results (see Figure 2-1).
Figure 2-1 Lumped reaction path scheme for gasification of biomass in supercritical water (SCWG).
After applying both the “severity” and the “competing reaction” approach to their experimental data, Van Swaaij et al. (Van Swaaij, 2003) concluded that it is not possible to distinguish between the two types of interpretation models with respect to their predictive capacity.
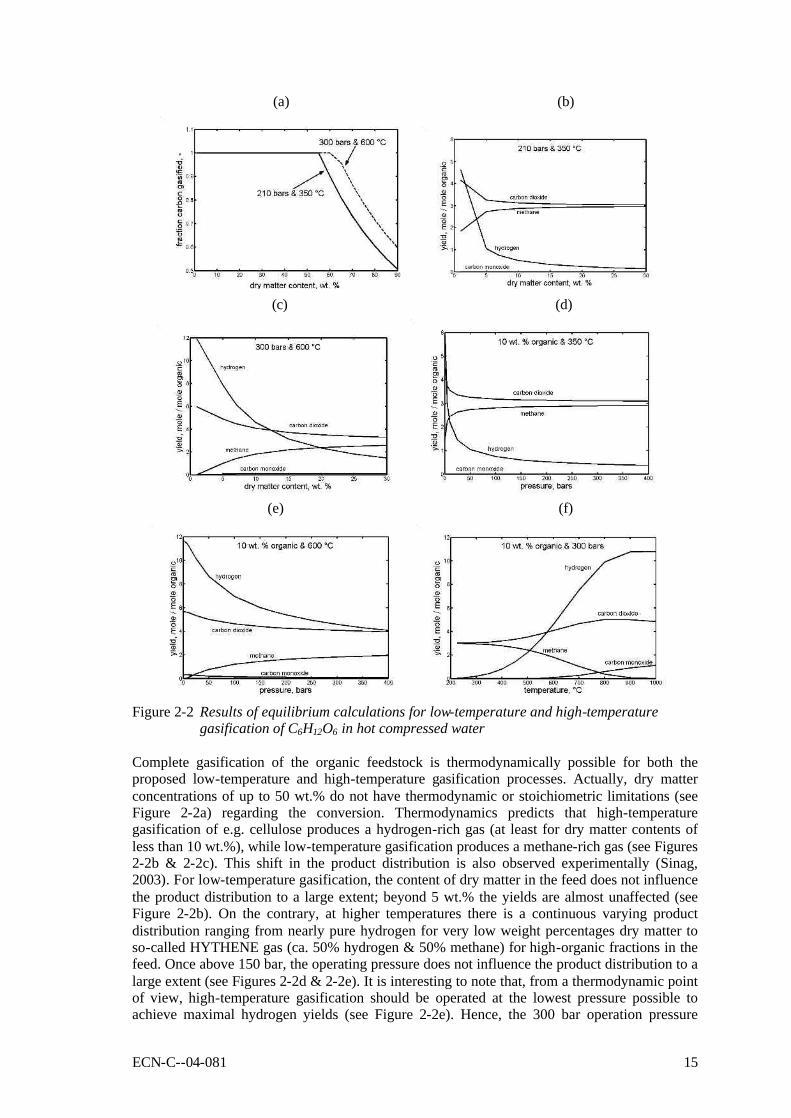
2.3.4 Thermodynamics Because there is no mechanistic reaction path model available, equilibrium calculations have been used in this paper to produce theoretical results for comparison with experimental results. These calculations may not have much quantitative value in case of non-catalytic gasification, as experimental evidence shows that the product distribution is far from equilibrium. However, it was found that by employing a suitable catalyst the products approach equilibrium, and that for both catalytic and non-catalytic experiments the observed trends are predicted correctly. The thermodynamic calculations included in this paper were done with an in-house model based on Gibbs free energy minimisation. Details concerning the model can be found in (Kersten, 2002; Kyle, 1999). For the results presented below, C6H12O6 was supposed to represent biomass.
Biomass
permanent gas (r1,1)
Char (r1,3)
Volatiles (r1,2)
permanent gas (r2,1)
volatiles/organics/char (r2,2)
ECN-C--04-081 15
(a) (b)
(c) (d)
(e) (f)
Figure 2-2 Results of equilibrium calculations for low-temperature and high-temperature
gasification of C6H12O6 in hot compressed water Complete gasification of the organic feedstock is thermodynamically possible for both the proposed low-temperature and high-temperature gasification processes. Actually, dry matter concentrations of up to 50 wt.% do not have thermodynamic or stoichiometric limitations (see Figure 2-2a) regarding the conversion. Thermodynamics predicts that high-temperature gasification of e.g. cellulose produces a hydrogen-rich gas (at least for dry matter contents of less than 10 wt.%), while low-temperature gasification produces a methane-rich gas (see Figures 2-2b & 2-2c). This shift in the product distribution is also observed experimentally (Sinag, 2003). For low-temperature gasification, the content of dry matter in the feed does not influence the product distribution to a large extent; beyond 5 wt.% the yields are almost unaffected (see Figure 2-2b). On the contrary, at higher temperatures there is a continuous varying product distribution ranging from nearly pure hydrogen for very low weight percentages dry matter to so-called HYTHENE gas (ca. 50% hydrogen & 50% methane) for high-organic fractions in the feed. Once above 150 bar, the operating pressure does not influence the product distribution to a large extent (see Figures 2-2d & 2-2e). It is interesting to note that, from a thermodynamic point of view, high-temperature gasification should be operated at the lowest pressure possible to achieve maximal hydrogen yields (see Figure 2-2e). Hence, the 300 bar operation pressure

16 ECN-C--04-081
chosen in practice, is because of energy balance and kinetic considerations. Figure 2-2f shows that, according to thermodynamics, there is a strong shift from methane towards hydrogen and carbon monoxide while increasing the temperature. Methane-rich gas can be produced up to temperatures of ca. 500oC, higher temperatures favour the production of hydrogen. Heat exchange Although it has been suggested sometimes (Antal, 1993) that supercritical water properties would be beneficial for the gasification reaction, experiments at high temperature (T > 550oC) have shown little influence of the pressure on either the carbon conversion degree, or the product yield and distribution (see below). As explained before, the justification for process development of SCWG is to create an opportunity for the treatment of organic residues in water like for instance food processing residues and fermentation residues. In that respect, it is crucial for the process that the heat content of the reactor effluent is utilised as far as possible to pre-heat the feedstock stream (mainly water) to reaction conditions, at least for high-temperature gasification of a feedstock with a low organic matter content. However, evaporation and re-condensation of the water is not practical because the corresponding huge heat of evaporation effects at nearly isothermal and isobaric conditions cannot be dealt with easily. Heating of the feedstock stream to the desired gasification temperatures without such evaporation, requires operation at high pressures. This is the true incentive of the high pressures involved in wet gasification. The efficiency of heat exchange in relation to the applied pressure can be calculated from the heat balance for a counter-current shell-tube heat exchanger. The result is presented in the underneath diagram, in which the heat-exchanger efficiency is plotted as function of the operating pressure. Figure 2-3 shows that, eventually, the maximal efficiency for a heat exchanger with infinite surface area becomes 100% when the supercritical pressure is passed. The diagram also shows
0 50 100 150 200 250 300 3500.0
0.1
0.2
0.3
0.4
0.5
0.6
0.7
0.8
0.9
1.0
ηH
E [-]
pressure [bar]
(10)
(25)
(50)(100)(infinite)
Available area per unit mass throughput
m2/(kg/s)
critical pressure
Figure 2-3 The efficiency of a water-water counter-current heat exchanger plotted versus the
operating pressure for different surface areas, AHE: (m2) per unit throughput (kg/s). The flow rates (kg/s) on both sides were assumed to be equal in the calculations. U = 1000 W/(m2.K), Thot,in = 600 oC, Tcold,in = 25oC
ECN-C--04-081 17
that below the critical pressure, the maximal efficiency decreases very rapidly. However, for practical heat exchangers with finite dimensions this drop is less severe. In practice, a hundred percent transfer of the available heat in the reactor effluent to the feedstock stream is impossible. In fact, efficiencies of ca. 75% are typical for liquid-liquid shell and tube heat exchangers (Woods, 1995). For such efficiency the operating pressure should be ca. 180 bar in case of 50 m2 per kg/s throughput or 300 bar in case of 25 m2 per kg/s throughput (Figure 2-3).
2.4 Laboratory-scale results In this section, all reported results of gasification experiments in hot compressed water on laboratory scale are listed. These data will be interpreted with respect to the influences of the operating conditions, the catalysis applied, and mutual consistency.
2.4.1 Used reactor systems & interpretation of the results Table A-I (see Appendix A) summarises the properties of all used reactors on laboratory scale. Every reactor used so far was constructed from metal. Batch and continuous reactors were employed. Batch tests were performed in autoclaves and for continuous experiments stirred vessels, laminar-flow reactors, and fixed beds were applied. High-temperature gasification For meaningful interpretation of gasification experiments it is essential that the experimental conditions are constant with respect to space and time during each experimental run. This cannot be achieved in conventional autoclaves as used by Kruse (Kruse, 2003a; Kruse, 1999), because the heating time is large compared to the reaction time (see below). As a result there is a simultaneous heating and reaction trajectory, which makes interpretation of the results difficult, if not impossible. Kruse and co-workers (Kruse, 2003a) solved this problem by injecting cold biomass into an autoclave at reaction temperature. Nearly, all used flow reactors were derived from the ones designed by Antal and co-workers (Yu, 1993a). The flow reactors, used to study high-temperature gasification, consisted of a heating zone, an empty tube and, if present, a fixed catalytic bed. In the empty tube, the Reynolds number was in the range of 100 to 200, leading to laminar flow. Re-calculation of the applied Peclet number learned that the actual flow regime in this section approached plug-flow (Pe was always higher than 20). In each reactor segment, the temperature was different during the experiments. In fact, the peak temperature in the heating section was sometimes more than one hundred degrees higher than in the catalytic bed. In each section the residence time was in the range of 5 to 50 seconds. Next to this, it turned out that catalytic effects obscured the results (see below). Hence, also the data obtained in the flow reactors are not easy to interpret. A continuous stirred tank reactor was used for the investigation of biomass conversion in supercritical water by Kruse et al. (Sinag, 2003; Kruse, 2003a; Kruse, 2003b). Cold feedstock was supplied continuously into the reactor by the screw press, and rapidly heated, by mixing, with the hot content of the reactor. Potic et al. (Potic) developed a novel high-throughput screening technique, which allows quick and save experimentation with thermochemical conversion reactions of wet feedstock at severe operating conditions in a non-catalytic environment. In this technique, small sealed quartz capillaries (ID = 1 mm) filled with biomass or model compounds in water, are heated rapidly in a fluidised bed to the desired reaction temperature. The reaction pressure can be accurately controlled by the initial amount of solution in the capillary. After a certain contact time, the capillaries are lifted out of the fluidised bed, rapidly quenched and destroyed to collect the produced gases for GC analysis.

18 ECN-C--04-081
Low-temperature gasification In the early stage of the development of catalytic low-temperature gasification the Batelle researchers used conventional autoclaves (Elliott, 1993a; Elliott, 1994b). Further continuous studies were performed in fixed-bed reactors with a maximum throughput of ca. 30 l/h (Elliott, 1994a). Interpretation The conversion of carbon in biomass to carbon in permanent gases (carbon conversion = Xc) was often chosen as the main process qualifier for gasification in hot compressed water (Hao, 2003; Lee, 2002; Antal, 2000), because it indicates the distribution of carbon over the desired products (permanent gases) and the undesired product (liquids and polymers). This approach has been adopted for this paper. Xc is defined by:
cnumber of c atoms in the produced permanent gasX =
number of c atoms in the feedstock (2-3)
Beside the carbon conversion, also data concerning the product gas distribution are presented in this paper.
2.4.2 Results of non-catalytic experiments The reported results of non-catalytic gasification experiments are summarised in Table B-I as presented in appendix B. As can be seen, predominently high-temperature results (SCWG) are available for non-catalytic gasification. Gasification experiments were performed with model compounds, more realistic biomass and waste streams. In general, it can be concluded that all experimental results are difficult to interpret due to wall-catalytic effects, non-uniform reactor temperature, and other reasons discussed above. In line with that, it appeared that the results are scattered, and that mutual comparison is difficult, if not impossible. For instance, Antal et al. (Yu, 1993a) reported results of gasification experiments, conducted under the same conditions, but using different metals for the construction of the reactor. The type of metal influenced the product distribution and the gasification efficiency considerably (see Table 2-1). Van Swaaij et al. (Van Swaaij, 2003) found that, compared to metal reactors, the results from quartz reactors showed lower gasification efficiencies at identical process conditions. These findings indicate that the results from metal reactors are obscured by catalytic activity. This catalytic activity is not understood, and cannot be scaled to large-scale reactors, because of the large area over volume ratios of the small laboratory equipment used. Table 2-1 Influence of the reactor material on the carbon conversion (Xc,%) as reported by
Antal and co-workers (Yu, 1993a)
Reactor material
Feedstock Inconel Xc [%]
Corroded Hastelloy Xc [%]
New Hastelloy Xc [%]
Glucose (3.6 wt.%) 82 86 89 Glucose (12.8 wt.%) 68 n.a. 82 Acetic acid (3.6 wt.%) 14 53 10
Despite the interpretation problems related to the published data, the reported non-catalytic results are still indicative for the process. Table 2-2 shows some typical results of gasification experiments conducted at the proposed conditions for SCWG. At temperatures as low as 450oC it appeared to be possible to achieve nearly complete conversion of model compound and biomass solutions with a very low dry matter content (< 2 wt.%). For cellulose derivates, like
ECN-C--04-081 19
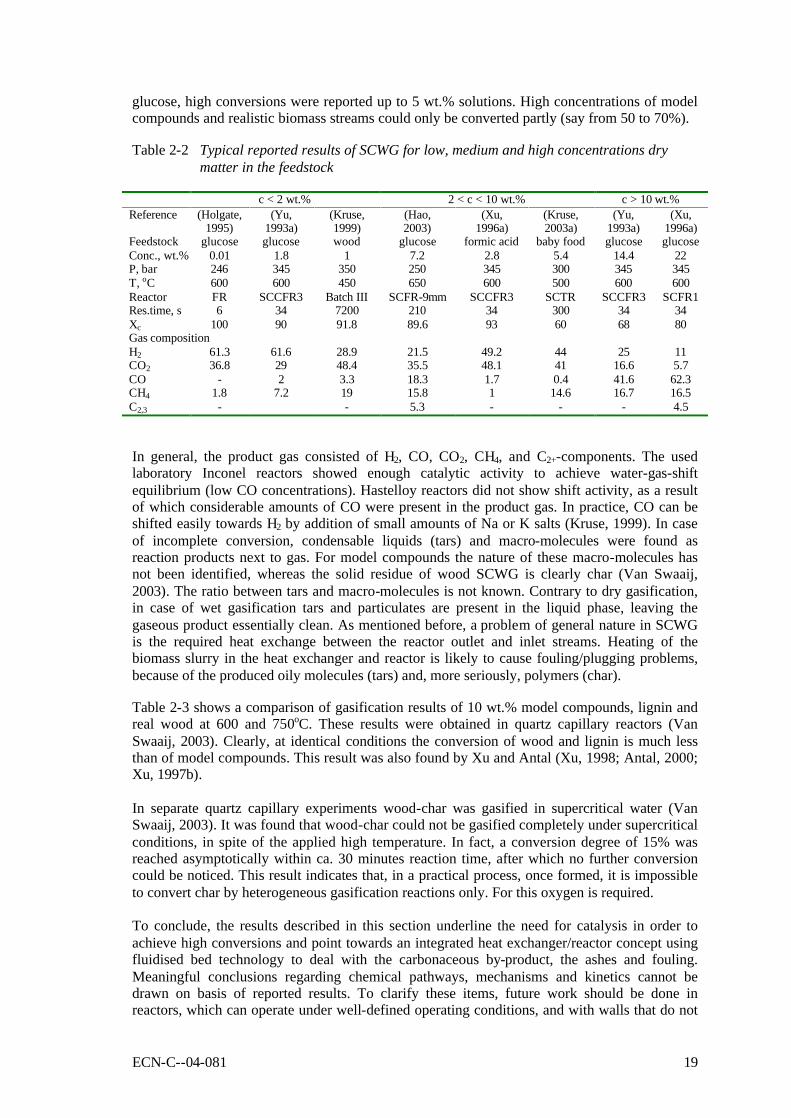
glucose, high conversions were reported up to 5 wt.% solutions. High concentrations of model compounds and realistic biomass streams could only be converted partly (say from 50 to 70%). Table 2-2 Typical reported results of SCWG for low, medium and high concentrations dry
matter in the feedstock
c < 2 wt.% 2 < c < 10 wt.% c > 10 wt.% Reference (Holgate,
1995) (Yu,
1993a) (Kruse, 1999)
(Hao, 2003)
(Xu, 1996a)
(Kruse, 2003a)
(Yu, 1993a)
(Xu, 1996a)
Feedstock glucose glucose wood glucose formic acid baby food glucose glucose Conc., wt.% 0.01 1.8 1 7.2 2.8 5.4 14.4 22 P, bar 246 345 350 250 345 300 345 345 T, oC 600 600 450 650 600 500 600 600 Reactor FR SCCFR3 Batch III SCFR-9mm SCCFR3 SCTR SCCFR3 SCFR1 Res.time, s 6 34 7200 210 34 300 34 34 Xc 100 90 91.8 89.6 93 60 68 80 Gas composition H2 61.3 61.6 28.9 21.5 49.2 44 25 11 CO2 36.8 29 48.4 35.5 48.1 41 16.6 5.7 CO - 2 3.3 18.3 1.7 0.4 41.6 62.3 CH4 1.8 7.2 19 15.8 1 14.6 16.7 16.5 C2,3 - - 5.3 - - - 4.5 In general, the product gas consisted of H2, CO, CO2, CH4, and C2+-components. The used laboratory Inconel reactors showed enough catalytic activity to achieve water-gas-shift equilibrium (low CO concentrations). Hastelloy reactors did not show shift activity, as a result of which considerable amounts of CO were present in the product gas. In practice, CO can be shifted easily towards H2 by addition of small amounts of Na or K salts (Kruse, 1999). In case of incomplete conversion, condensable liquids (tars) and macro-molecules were found as reaction products next to gas. For model compounds the nature of these macro-molecules has not been identified, whereas the solid residue of wood SCWG is clearly char (Van Swaaij, 2003). The ratio between tars and macro-molecules is not known. Contrary to dry gasification, in case of wet gasification tars and particulates are present in the liquid phase, leaving the gaseous product essentially clean. As mentioned before, a problem of general nature in SCWG is the required heat exchange between the reactor outlet and inlet streams. Heating of the biomass slurry in the heat exchanger and reactor is likely to cause fouling/plugging problems, because of the produced oily molecules (tars) and, more seriously, polymers (char). Table 2-3 shows a comparison of gasification results of 10 wt.% model compounds, lignin and real wood at 600 and 750oC. These results were obtained in quartz capillary reactors (Van Swaaij, 2003). Clearly, at identical conditions the conversion of wood and lignin is much less than of model compounds. This result was also found by Xu and Antal (Xu, 1998; Antal, 2000; Xu, 1997b). In separate quartz capillary experiments wood-char was gasified in supercritical water (Van Swaaij, 2003). It was found that wood-char could not be gasified completely under supercritical conditions, in spite of the applied high temperature. In fact, a conversion degree of 15% was reached asymptotically within ca. 30 minutes reaction time, after which no further conversion could be noticed. This result indicates that, in a practical process, once formed, it is impossible to convert char by heterogeneous gasification reactions only. For this oxygen is required. To conclude, the results described in this section underline the need for catalysis in order to achieve high conversions and point towards an integrated heat exchanger/reactor concept using fluidised bed technology to deal with the carbonaceous by-product, the ashes and fouling. Meaningful conclusions regarding chemical pathways, mechanisms and kinetics cannot be drawn on basis of reported results. To clarify these items, future work should be done in reactors, which can operate under well-defined operating conditions, and with walls that do not
20 ECN-C--04-081
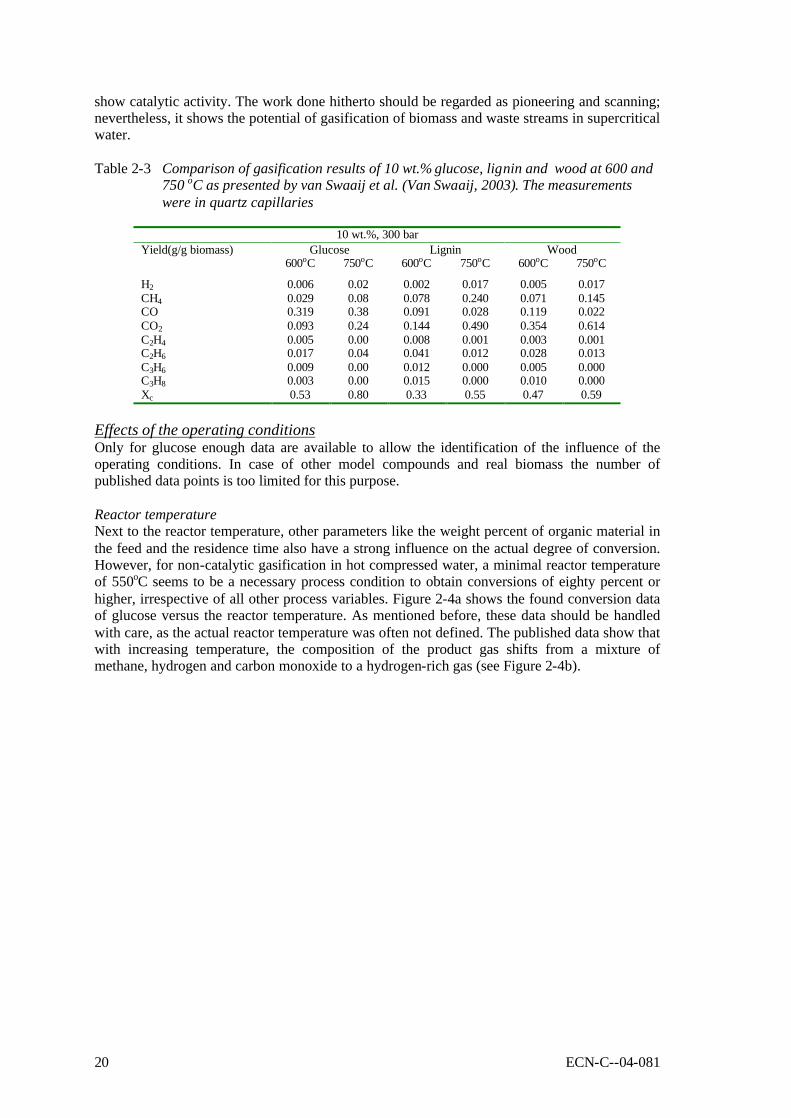
show catalytic activity. The work done hitherto should be regarded as pioneering and scanning; nevertheless, it shows the potential of gasification of biomass and waste streams in supercritical water. Table 2-3 Comparison of gasification results of 10 wt.% glucose, lignin and wood at 600 and
750 oC as presented by van Swaaij et al. (Van Swaaij, 2003). The measurements were in quartz capillaries
10 wt.%, 300 bar
Glucose Lignin Wood Yield(g/g biomass) 600oC 750oC 600oC 750oC 600oC 750oC
H2 0.006 0.02 0.002 0.017 0.005 0.017 CH4 0.029 0.08 0.078 0.240 0.071 0.145 CO 0.319 0.38 0.091 0.028 0.119 0.022 CO2 0.093 0.24 0.144 0.490 0.354 0.614 C2H4 0.005 0.00 0.008 0.001 0.003 0.001 C2H6 0.017 0.04 0.041 0.012 0.028 0.013 C3H6 0.009 0.00 0.012 0.000 0.005 0.000 C3H8 0.003 0.00 0.015 0.000 0.010 0.000 Xc 0.53 0.80 0.33 0.55 0.47 0.59
Effects of the operating conditions Only for glucose enough data are available to allow the identification of the influence of the operating conditions. In case of other model compounds and real biomass the number of published data points is too limited for this purpose. Reactor temperature Next to the reactor temperature, other parameters like the weight percent of organic material in the feed and the residence time also have a strong influence on the actual degree of conversion. However, for non-catalytic gasification in hot compressed water, a minimal reactor temperature of 550oC seems to be a necessary process condition to obtain conversions of eighty percent or higher, irrespective of all other process variables. Figure 2-4a shows the found conversion data of glucose versus the reactor temperature. As mentioned before, these data should be handled with care, as the actual reactor temperature was often not defined. The published data show that with increasing temperature, the composition of the product gas shifts from a mixture of methane, hydrogen and carbon monoxide to a hydrogen-rich gas (see Figure 2-4b).

ECN-C--04-081 21
400 500 600 700 8000
20
40
60
80
100
frac
tion
carb
on g
asifi
ed, %
T, oC
c = 10.8 wt. %very low residence time
c < 2 wt. %
(a)
500 600 700 8000
20
40
60
80
100
500 600 700 8000
20
40
60
80
100
500 600 700 8000
20
40
60
80
100
500 600 700 8000
20
40
60
80
100
500 600 700 8000
20
40
60
80
100
C e
ffici
ency
, %ga
s co
mpo
sitio
n, %
T, oC
C efficiency
H2
CO2
CO
CH4
Figure 2-4 Reported experimental SCWG results for glucose. a) Xc versus the reactor
temperature (all reported glucose data are plotted, see Table B-I, Appendix B), b) product composition versus the reactor temperature (Lee, 2002)
22 ECN-C--04-081
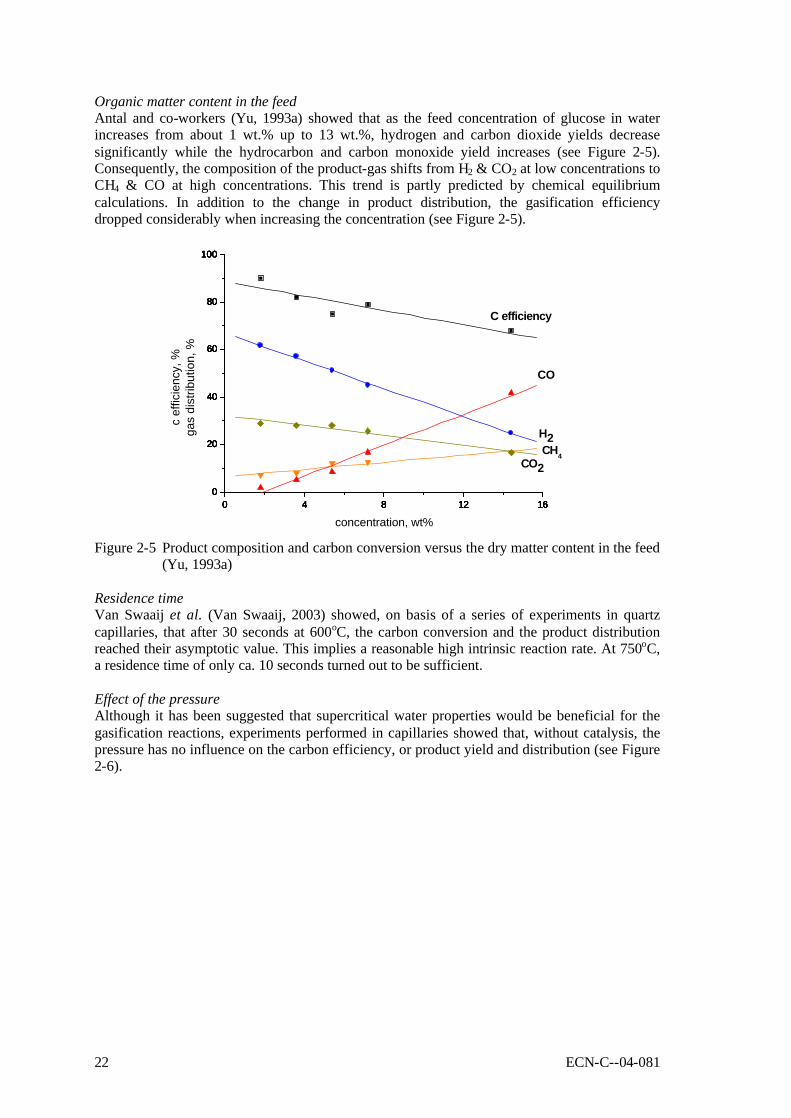
Organic matter content in the feed Antal and co-workers (Yu, 1993a) showed that as the feed concentration of glucose in water increases from about 1 wt.% up to 13 wt.%, hydrogen and carbon dioxide yields decrease significantly while the hydrocarbon and carbon monoxide yield increases (see Figure 2-5). Consequently, the composition of the product-gas shifts from H2 & CO2 at low concentrations to CH4 & CO at high concentrations. This trend is partly predicted by chemical equilibrium calculations. In addition to the change in product distribution, the gasification efficiency dropped considerably when increasing the concentration (see Figure 2-5).
0 4 8 12 160
20
40
60
80
100
0 4 8 12 160
20
40
60
80
100
0 4 8 12 160
20
40
60
80
100
0 4 8 12 160
20
40
60
80
100
0 4 8 12 160
20
40
60
80
100
C efficiency
H2
CO
CO2CH4
c ef
ficie
ncy,
%ga
s di
strib
utio
n, %
concentration, wt% Figure 2-5 Product composition and carbon conversion versus the dry matter content in the feed
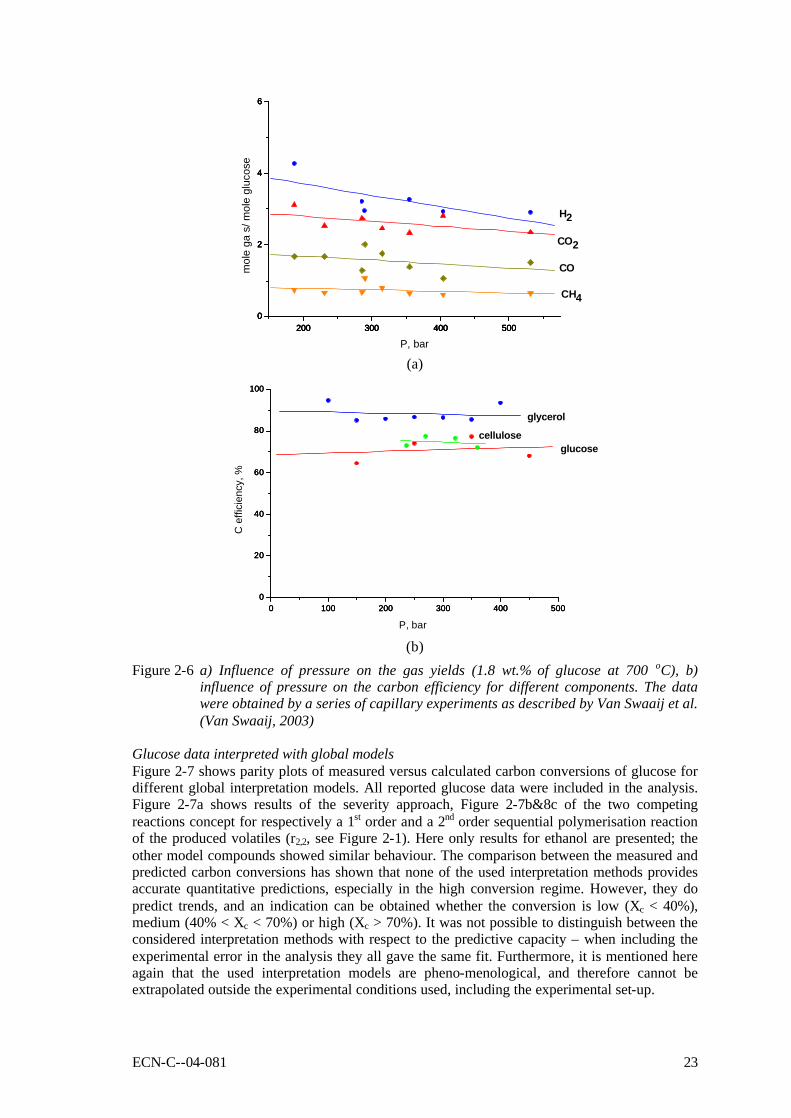
(Yu, 1993a) Residence time Van Swaaij et al. (Van Swaaij, 2003) showed, on basis of a series of experiments in quartz capillaries, that after 30 seconds at 600oC, the carbon conversion and the product distribution reached their asymptotic value. This implies a reasonable high intrinsic reaction rate. At 750oC, a residence time of only ca. 10 seconds turned out to be sufficient. Effect of the pressure Although it has been suggested that supercritical water properties would be beneficial for the gasification reactions, experiments performed in capillaries showed that, without catalysis, the pressure has no influence on the carbon efficiency, or product yield and distribution (see Figure 2-6).
ECN-C--04-081 23
200 300 400 5000
2
4
6
200 300 400 5000
2
4
6
200 300 400 5000
2
4
6
200 300 400 5000
2
4
6
mol
e ga
s/ m
ole
gluc
ose
P, bar
H2
CO2
CO
CH4
(a)
0 100 200 300 400 5000
20
40
60
80
100
0 100 200 300 400 5000
20
40
60
80
100
0 100 200 300 400 5000
20
40
60
80
100
C e
ffici
ency
, %
P, bar
glycerol
glucosecellulose
(b)
Figure 2-6 a) Influence of pressure on the gas yields (1.8 wt.% of glucose at 700 oC), b) influence of pressure on the carbon efficiency for different components. The data were obtained by a series of capillary experiments as described by Van Swaaij et al. (Van Swaaij, 2003)
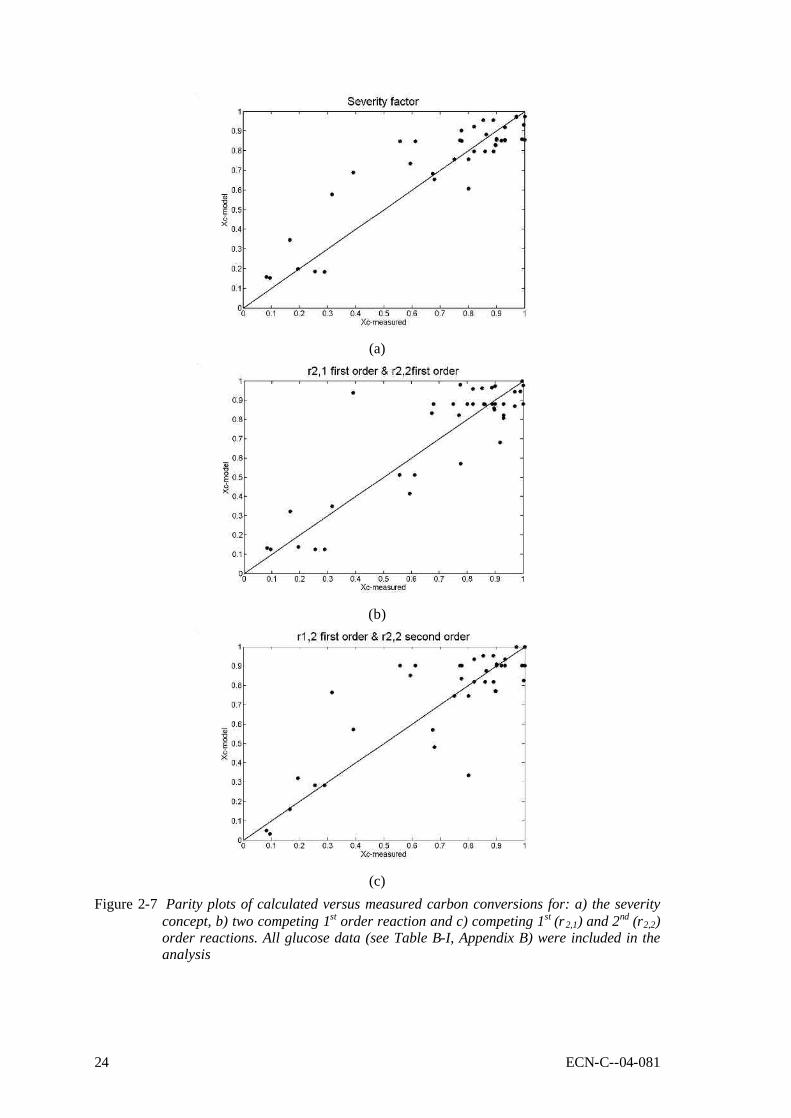
Glucose data interpreted with global models Figure 2-7 shows parity plots of measured versus calculated carbon conversions of glucose for different global interpretation models. All reported glucose data were included in the analysis. Figure 2-7a shows results of the severity approach, Figure 2-7b&8c of the two competing reactions concept for respectively a 1st order and a 2nd order sequential polymerisation reaction of the produced volatiles (r2,2, see Figure 2-1). Here only results for ethanol are presented; the other model compounds showed similar behaviour. The comparison between the measured and predicted carbon conversions has shown that none of the used interpretation methods provides accurate quantitative predictions, especially in the high conversion regime. However, they do predict trends, and an indication can be obtained whether the conversion is low (Xc < 40%), medium (40% < Xc < 70%) or high (Xc > 70%). It was not possible to distinguish between the considered interpretation methods with respect to the predictive capacity – when including the experimental error in the analysis they all gave the same fit. Furthermore, it is mentioned here again that the used interpretation models are pheno-menological, and therefore cannot be extrapolated outside the experimental conditions used, including the experimental set-up.
24 ECN-C--04-081
(a)
(b)
(c)
Figure 2-7 Parity plots of calculated versus measured carbon conversions for: a) the severity concept, b) two competing 1st order reaction and c) competing 1st (r2,1) and 2nd (r2,2) order reactions. All glucose data (see Table B-I, Appendix B) were included in the analysis

ECN-C--04-081 25
2.4.3 Catalytic results Low-temperature gasification – The Battelle concept It was found that through the use of a metal catalyst, biomass gasification could be accomplished with high levels of carbon conversion to gas at relatively low temperatures (Kruse, 1999; Park, 2003). The Battelle concept (Sealock, 1991; Elliott, 1997) was developed in early research on biomass gasification mechanisms. Batch tests suggested that the advantage of the high-pressure environment with a metal catalyst could compensate for the slow reaction kinetics for operation at lower temperatures (Elliott, 1985). Further studies showed that biomass slurries could be processed in continuous-flow reactors at low-temperature gasification conditions and still achieve high-conversion at reasonable processing rates (Elliott, 1993b; Elliott, 1993c). More recent results with improved catalyst formulations, as presented below, provided a basis to move the processing forward from the bench-scale to a scaled-up reactor system operated at 6-30 litres per hour. Previous research in low-temperature gasification has shown that new catalyst formulations are required for the pressurised water environment. Only a limited range of catalytic metals can be used in the process because of the oxidation of the metal components in the hot-water environment (Elliott, 1993d). In addition, conventional catalyst support materials, such as silica and alumina are also severely degraded in this reaction environment. New catalyst formulations for low-temperature gasification include combinations of stable metals, such as ruthenium or nickel bimetallics and stable supports, such as certain titania, zirconia, or carbon. For example, the ruthenium on rutile titania extrudate is particularly valuable in this process (Elliott, 2001). The ruthenium is easily reduced to its active form and maintains its activity for long periods of operation. The rutile form of titania is the stable crystalline form of titania at these reaction conditions. Although rutile is the crystalline phase with lower surface area (~45 m2/g), active catalysts with up to 3 wt.% ruthenium can be synthesised. Catalysts with up to 7 wt.% ruthenium on carbon extrudates have also been shown to be valuable in this processing environment. Batch results The feedstocks tested included residues from biorefinery-type operations in which useful components, such as starch or hemicellulose were first recovered from the biomass and the residue was then processed in the low-temperature gasification. The obtained results for 10 wt.% dry solids slurries, processed for 4 hours at respectively 350°C, 370°C, and 400°C, are shown in Figure 2-8 (Matsumura). The batch reactor test results showed a range of reactivity of the feedstocks in the presence of the various catalysts. Without catalyst, the gasification is limited. The ruthenium on titania catalyst (with much lower metal loading) appeared to exhibit much lower activity relative to the ruthenium on carbon catalyst, though direct comparison on the same feedstock is not available. Considering the experimental variability, the two stabilised nickel catalysts appear to be nearly equivalent, at a level of activity intermediate to the two ruthenium catalysts. The comparison of the several feedstocks using the Ru/Ni catalyst shows the highest reactivity with the manure solids followed by the lightly processed grains. The more severely processed lignocellulosic feedstocks showed lower activity as a group. The effect of temperature is obvious, but there is no dramatic effect noticeable at the supercritical point of water (374oC).
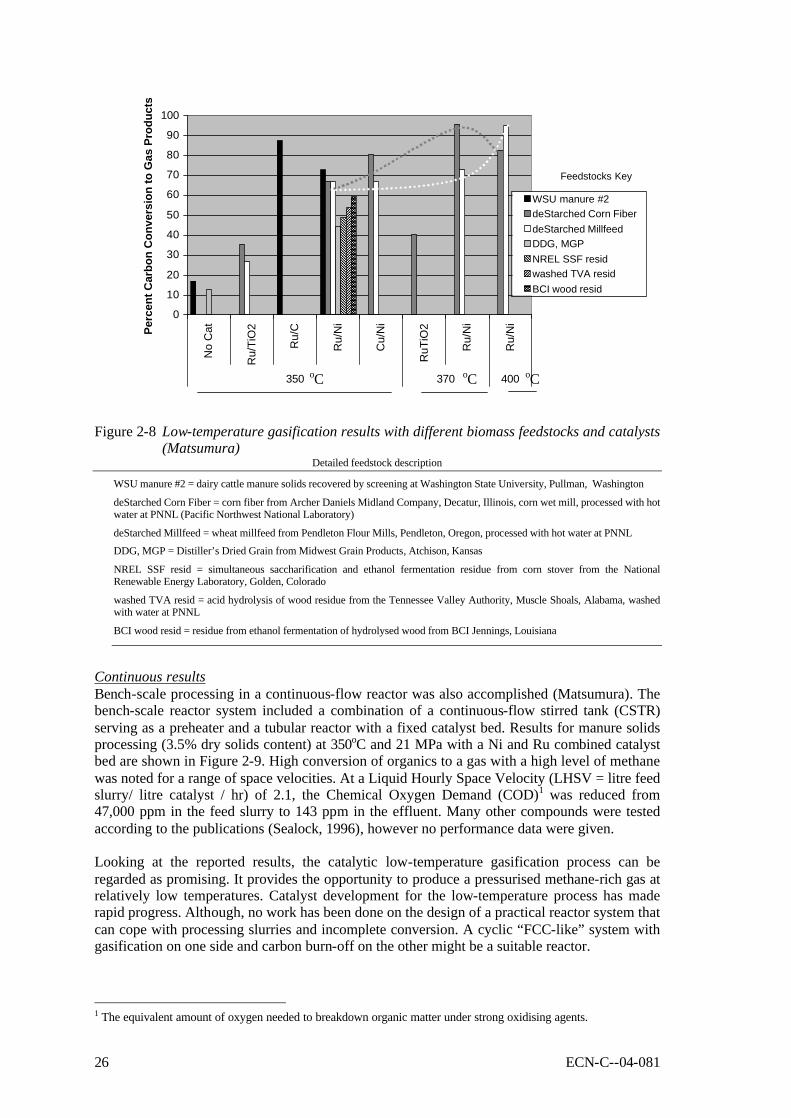
26 ECN-C--04-081
0
10
20
30
40
50
60
70
80
90
100
No
Cat
Ru/
TiO
2
Ru/
C
Ru/
Ni
Cu/
Ni
RuT
iO2
Ru/
Ni
Ru/
Ni
350 370 400
Perc
ent C
arbo
n C
onve
rsio
n to
Gas
Pro
duct
s
WSU manure #2deStarched Corn FiberdeStarched MillfeedDDG, MGPNREL SSF residwashed TVA residBCI wood resid
Feedstocks Key
Figure 2-8 Low-temperature gasification results with different biomass feedstocks and catalysts
(Matsumura) Detailed feedstock description
WSU manure #2 = dairy cattle manure solids recovered by screening at Washington State University, Pullman, Washington
deStarched Corn Fiber = corn fiber from Archer Daniels Midland Company, Decatur, Illinois, corn wet mill, processed with hot water at PNNL (Pacific Northwest National Laboratory)
deStarched Millfeed = wheat millfeed from Pendleton Flour Mills, Pendleton, Oregon, processed with hot water at PNNL
DDG, MGP = Distiller’s Dried Grain from Midwest Grain Products, Atchison, Kansas
NREL SSF resid = simultaneous saccharification and ethanol fermentation residue from corn stover from the National Renewable Energy Laboratory, Golden, Colorado
washed TVA resid = acid hydrolysis of wood residue from the Tennessee Valley Authority, Muscle Shoals, Alabama, washed with water at PNNL
BCI wood resid = residue from ethanol fermentation of hydrolysed wood from BCI Jennings, Louisiana
Continuous results Bench-scale processing in a continuous-flow reactor was also accomplished (Matsumura). The bench-scale reactor system included a combination of a continuous-flow stirred tank (CSTR) serving as a preheater and a tubular reactor with a fixed catalyst bed. Results for manure solids processing (3.5% dry solids content) at 350oC and 21 MPa with a Ni and Ru combined catalyst bed are shown in Figure 2-9. High conversion of organics to a gas with a high level of methane was noted for a range of space velocities. At a Liquid Hourly Space Velocity (LHSV = litre feed slurry/ litre catalyst / hr) of 2.1, the Chemical Oxygen Demand (COD)1 was reduced from 47,000 ppm in the feed slurry to 143 ppm in the effluent. Many other compounds were tested according to the publications (Sealock, 1996), however no performance data were given. Looking at the reported results, the catalytic low-temperature gasification process can be regarded as promising. It provides the opportunity to produce a pressurised methane-rich gas at relatively low temperatures. Catalyst development for the low-temperature process has made rapid progress. Although, no work has been done on the design of a practical reactor system that can cope with processing slurries and incomplete conversion. A cyclic “FCC-like” system with gasification on one side and carbon burn-off on the other might be a suitable reactor.
1 The equivalent amount of oxygen needed to breakdown organic matter under strong oxidising agents.
oC oC oC

ECN-C--04-081 27
0102030405060708090
100
perc
ent
1.65 2.09 2.60LHSV
COD conversionCarbon gasificationCH4 gas fraction
Figure 2-9 Low-temperature gasification of manure in a continuous set-up. COD conversion,
carbon conversion and the fraction of methane in the product gas are plotted versus the LHSV (Liquid Hourly Space Velocity)
Comparison with fermentation Fermentation is another conversion route for the production of methane-rich gas from wet biomass and it is, contrary to the SCWG process, a proven technology. Table 2-4 shows a comparison between fermentation and wet gasification regarding relevant process qualifiers such as the required reactor size, robustness, and the gas quality. Table 2-4 Comparison between fermentation and wet gasification
Fermentation Gasification in hot compressed water Reactor size (investment costs)
Large reactors are required due to low reaction rates
Conventional fluid bed technology
Robustness
Bacteria cannot handle all
feedstock and can loose activity as a result of poisoning
For a FB concept with catalyst regeneration no problems are
expected Gas quality
Clean gas
Nearly pure CH4
Clean gas § H2/CO2 mixture § CH4/CO2 mixture
Looking at Table 2-4, only with respect to gas quality fermentation is slightly favoured over gasification in hot compressed water. However, this cannot compensate for the large reactors required and the low robustness of the fermentation process. Especially when considering that CO2 can be easily extracted, e.g. by means of commercially available pressure swing absorption, from the product gas of SCWG. High-temperature gasification University of Hawaii was the first to run the supercritical water gasification experiment at high temperatures of 500-600oC, using model compounds. They intended to conduct gasification of biomass without catalyst using metal tubing reactors. However, what they found, using glucose

28 ECN-C--04-081
as feedstock, was that gasification efficiency was affected by the reactor wall material (Yu, 1993b). Later, this finding was supported by Lee et al. (Lee, 1999). They pretreated the reactor with sodium chloride to obtain catalytic effect from the wall. They also measured the temperature distribution along the reactor, and found that at lower temperatures exothermic reaction takes place all along the reactor, while when reaction temperature is high, front half of the reactor shows endothermic behaviour while latter half shows exothermic one. Researchers in University of Hawaii then employed carbonaceous catalysts to attain complete gasification of 20 wt.% of glucose solution. They also gasified single chemical compounds such as acetic acid, phenol, benzene, methanol, and glycerol (Xu, 1996b). Table 2-5 gives a few typically examples of catalysed high-temperature gasification tests. In Table C-I (see Appendix C) al reported catalytic high-temperature results are listed. Table 2-5 Typical reported results of catalysed high-temperature SCWG Reference (Kruse, 1999) (Kruse, 2000) (Xu, 1998) (Garcia, 1997) (Antal, 2000) glucose pyrocatechol Corn starch Poplar wood sawdust Potato waste Feedstock Conc., wt.%
1.8 6.6 10.4 22.6 13.4
P, bar 310 300 280 280 280 T, oC 600 700 650 650 719
Catalyst K2CO3 KOH Coconut shell activated carbon
Coconut shell activated carbon
Coconut shell activated carbon
Reactor
Tubular reactor I
Tubular
reactor II
SCFR3
SCFR2
SCFR4
Res. time, s 138 60 16452 5940 2088 Xc 97 99 102 74 79 Gas comp. H2 28 53.3 39 26 32 CO2 67 34.7 42 45 44 CO 0.2 1 1 5.2 1 CH4 2.3 8.6 19 17 21 C2,3 - 2.4 - 3.3 -
Although complete gasification is not always possible, carbonaceous catalysts were found effective for all compounds tested. Despite the successful use of coconut shell activated coal as a catalyst on laboratory scale, it will probably not be the catalyst finally selected for the process. This has several reasons: 1. The catalytic activity of coal is not understood making scale-up of the laboratory
experiments difficult. 2. The rate of coal gasification in SCW is slow but certainly not zero, leading to consumption
of the catalyst. 3. The catalysts developed for low-temperature gasification seem to be more promising and
also, with minor adjustments, applicable for high-temperature gasification.
2.5 Status of pilot-plant projects SCWG is in an early stage of development. Due to its potential with respect to possible conversion of waste materials to a valuable gas, the laboratory research is developing rapidly. It is encouraging to see how the various research groups in the world are collaborating. However, large-scale commercial installations do not exist yet. The gap between small-scale testing in laboratories to practical demonstration of a new process is usually bridged by experimentation with a number of pilot plants differing in scale. At present there are two pilot plants being operated in the world:

ECN-C--04-081 29
q The largest plant, in operation since the beginning of 2003, is the one of Forschungszentrum Karlsruhe (FzK) in Germany (Boukis, 2002). It has a design capacity of 100 l/hr, and was built to demonstrate supercritical gasification of wet residues from wine production.
q EU subsidies plus a grant awarded by the Japanese NEDO enabled the construction of a well-equipped process development unit (PDU) in Enschede, The Netherlands (Potic, 2002), with a maximum throughput capacity of 30 l/hr. BTG Biomass Technology Group bv has been responsible for the technical realisation and start-up of this small pilot plant, which will be further used in PhD research work at the University of Twente.
A special problem in the process development of SCWG is the feeding. The nature of biomass feedstock for SCWG varies from dilute waste streams of organics solved in water, to heavy slurries of biomass in water. In case the starting material is coarse or fibrous, the original biomass should be ground and mixed with water to make a pumpable slurry. For instance verge-grass, wine-grape residues, or municipal waste fractions must be treated in that way. Although pumps for light slurries of fines are commercially available, they are hardly tested for biomass feedstock. High-pressure pumping is required for heavy viscous streams and sometimes the cement pump, known from building with concrete, is mentioned as a possible solution.
Introduction of feedstock in the SCWG process is under investigation in at least two EU sponsored research projects, i.e. “Winegas” and “Superhydrogen”. Apart from these projects, the feeding of wet biomass feed is also examined in the development of the HTU process (Goudriaan, 1990). Unfortunately, no information has been published until now. It is expected however, that for every specific feedstock type the pumping problems can be solved at last.
To experience all problems possibly related to the development of the SCWG process, it was decided to build and test a PDU of simple and straightforward design in the high-pressure laboratories of Twente University. It has a capacity of 5-30 litre/hr and is designed for operation temperatures up to 650°C and a pressure of around 300 bar. A flow sheet of the process is given in Figure 2-10. Four liquid containers are installed, represented in the figure by a single one. Two feedstock vessels allow the switching from one to another type of biomass (or another composition). At least 2 hours of operation is possible without refilling the feedstock bins. The other two storage vessels contain clean and effluent water respectively.
Heat exchange between the inlet and outlet streams has been implemented in the PDU, as it is essential for achieving acceptable thermal efficiencies. A simple double-walled tube heat exchanger is installed. The feedstock is flowing through the outer tube (5/4", Incoloy 825), and the reactor effluent through the inner tube (1/2" Incoloy 825). In this way, about 7 kW of heat can be exchanged between the reactor inlet and outlet. The reactor tube has an inner diameter of 14 mm, a total length of 15 m, and is made also from Incoloy 825. It is heated externally by a 20 kW natural gas burner. A residence time of 0.5 to 2 minutes is probably needed to achieve complete carbon conversion. The two-phase product stream from the reactor arrives in a high-pressure (HP) gas-liquid separator (P = 300 bar, T = 25-100°C) from which the liquid phase is further transferred to a low-pressure (LP) gas liquid separator (P = 1 bar, T = 20°C). Figure 2-10 shows that the gas released from the HP is rich in hydrogen. The LP separator produces a CO2-rich gas. The results presented in Figure 2-11 are obtained during two hours of continuous operation at the following conditions: T = 580oC, P = 270 bar, and a 5 wt.% glycerol solution in water. Apparently, the addition of a small quantity of sodium ions is essential to catalyse the shift from CO to H2 (see Table 2-6). As first feedstocks “simple” components like ethanol and glycerol have been used in the PDU, while later trials are intended for the more difficult feedstock types like starch and, eventually, real biomass.

30 ECN-C--04-081
Water & Minerals
H2-rich gas
Heat Exchanger
CO2-rich fuel gas
T = 650 °CP = 300 bar
Feed Pump
Figure 2-10 Simplified scheme of the PDU for biomass gasification in supercritical water,
built by BTG for the University of Twente
0
10
20
30
40
50
60
70
12:57 13:55 14:52
Time
[vol
%]
H2CH4COCO2C2H4C2H6
Figure 2-11 Pilot plant results. Product composition for gasification of 5 wt.% glycerol with
0.0075wt.% NaOH Table 2-6 Typical “raw” gas composition for gasification of 5 wt.% glycerol with and without
additives
- Na2CO3 0.01wt.% NaOH 0.01wt.%
Hydrogen (H2) Carbon Monoxide (CO) Carbon Dioxide (CO2) Methane (CH4) Ethylene (C2H4) Ethane (C2H6) Propylene (C3H6) Propane (C3H8)
28 25 22 13 2 8
0.6 1
49 1
35 10 0.2 3.8 0.2 0.6
50 0.3 35 10 0.2 3.8 0.3 0.9

ECN-C--04-081 31
2.6 Future prospects The arguments to strive for a hydrogen-driven economy are well known. Scenarios for so-called “zero-emission” cars, and “highly-efficient” fuel cells for power production, are extensively discussed in the media. It is also generally recognised that the implementation of a hydrogen economy will require a huge technology effort and quite some time (decades) because of the lacking infrastructure for storage and distribution. Nevertheless, the governmental policies have been clearly re-directed to support this development, in addition to the instruments for improved efficiencies and the utilisation of renewable sources in energy production. If hydrogen from renewable sources is considered, this is mostly referring to systems on basis of wind or hydropower in combination with electrolysis of water. Hydrogen from biomass is now also being put forward as an alternative option. It could be separated from biomass syngas (H2/CO), which would require the development of oxygen blown high-pressure gasifiers that can cope with biomass as a feedstock. Alternatively, biomass-syngas could be produced from liquid fuels derived from biomass, with the proven gasification technology that is applied for crude oil. It should be noticed that the above syngas route is always starting from dry biomass as a feedstock, that is with a moisture content of less than 50 wt.%
Although SCWG is a totally new concept it has, in the present stage of consideration, a number of very interesting aspects (see Figure 2-12): 1. The process is suitable to process very wet feedstock like for instance algae or water
hyacinth. In fact any agricultural or industrial waste streams can be utilised, provided that its value is low enough to allow economic conversion in the high-pressure / high-temperature SCWG process.
2. It is important to note that the products of SCWG will be available at high pressure, which is practically always needed for any further use.
3. In case a catalyst or a secondary shift reactor is applied to convert the CO in the product gas, the product will exclusively contain H2, CH4 and CO2. Because of its relatively high concentration, it is quite interesting to consider CO2 sequestration for underground storage.
4. Mixtures of H2 and CH4 are on a short to medium term applicable to mix into any distribution network for natural gas and make this partially green. In the Netherlands, this co-feeding application has a huge potential because of the large scale of natural gas utilisation.
5. Last but not least, hydrogen from SCWG can be used for fuel cell applications, in which case the CH4 and any other hydrocarbons should be converted in a secondary reformer. Upgrading steps like water-gas shift and steam reforming are known technologies and are not expected to hinder the development of that particular application seriously.
Figure 2-12 Scheme for application outlets of SCWG
Wet Biomass SuperCritical WaterGasification Process
Water &minerals
Desalination
CompressedH2
CompressedCO2
Mobile-stationaryFuel cells
Underground storageDeep-sea sequestrationRe-use
Water
Minerals
Upgrading
CompressedH2 / CH4
Substitute NaturalGas (CNG/SNG)
(Longterm)
(Medium term)

32 ECN-C--04-081
The achievements of the last few years are based on financial support by the European Commission and the Japanese NEDO, for research at universities and in the research institutes. It appears that all active players in the field have joint to push the technology to the demonstration phase. A working group has been established with participants from the USA, Japan and Europe who will meet every year to exchange ideas and share the results of investigations. This collaboration may be the key to success.
2.7 Conclusions Wet biomass and related feedstock can be gasified in hot compressed water to produce combustible gas mixtures. If produced, contaminants like tars and particulates will be in the liquid phase. At relatively low temperatures, just below the critical temperature, catalysts are required and gases rich in methane can be produced. At higher temperatures and supercritical conditions, hydrogen rich gases are formed, especially from low concentration feedstock. When the biomass concentration in water increases, the product will gradually contain more hydrocarbons and full conversion becomes difficult. Catalysts are required then to improve the conversion. Such observations from the literature are largely consistent with simple thermodynamic models, despite the fact that equilibrium is generally not achieved in practice. From the overall heat balance, it is demonstrated that intensive heat exchange between feedstock and products is essential, especially for gasification in supercritical water. This heat exchange is a non-trivial matter, as the feedstock will already produce decomposition products like tar and char or coke, while being heated. Non-conventional solutions for the pump, heat exchanger and reactor, as well as for residual carbon combustion, may be required to obtain a practical process. Despite all the problems in the early stage of development, the wet-biomass conversion processes could become an attractive option for the production of clean “green” gas from biomass and organic waste.
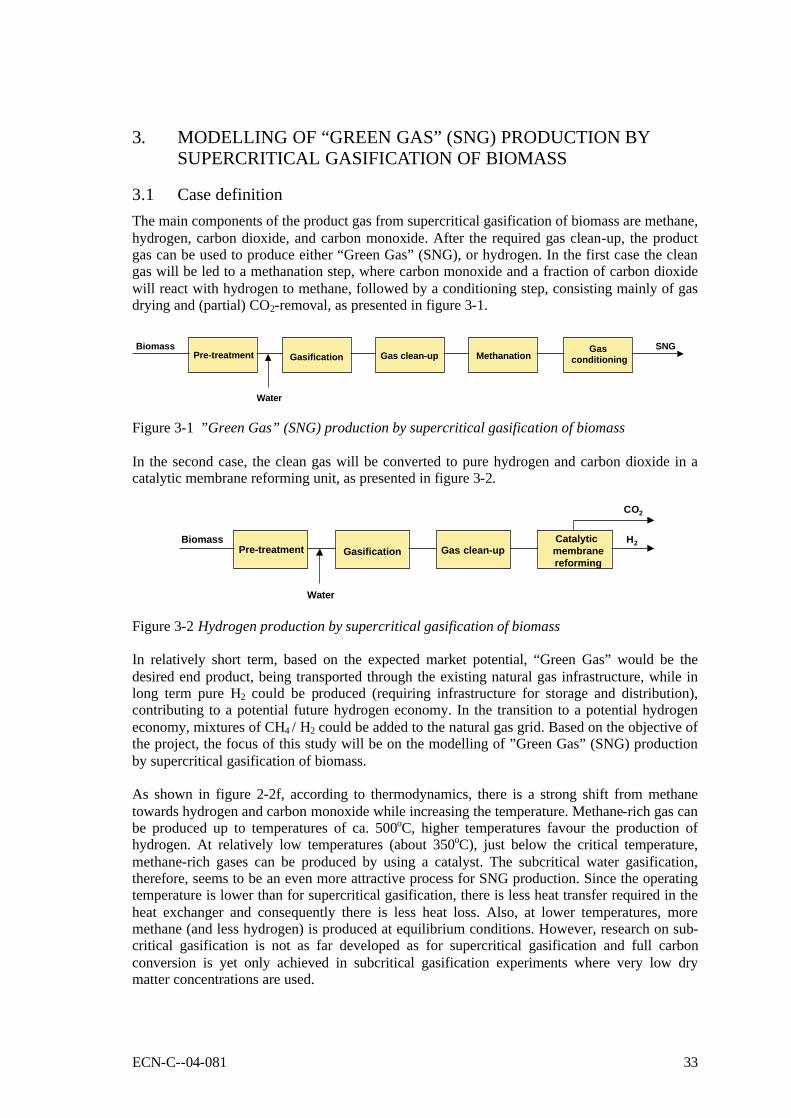
ECN-C--04-081 33
3. MODELLING OF “GREEN GAS” (SNG) PRODUCTION BY SUPERCRITICAL GASIFICATION OF BIOMASS
3.1 Case definition The main components of the product gas from supercritical gasification of biomass are methane, hydrogen, carbon dioxide, and carbon monoxide. After the required gas clean-up, the product gas can be used to produce either “Green Gas” (SNG), or hydrogen. In the first case the clean gas will be led to a methanation step, where carbon monoxide and a fraction of carbon dioxide will react with hydrogen to methane, followed by a conditioning step, consisting mainly of gas drying and (partial) CO2-removal, as presented in figure 3-1.
Figure 3-1 ”Green Gas” (SNG) production by supercritical gasification of biomass In the second case, the clean gas will be converted to pure hydrogen and carbon dioxide in a catalytic membrane reforming unit, as presented in figure 3-2.
Figure 3-2 Hydrogen production by supercritical gasification of biomass In relatively short term, based on the expected market potential, “Green Gas” would be the desired end product, being transported through the existing natural gas infrastructure, while in long term pure H2 could be produced (requiring infrastructure for storage and distribution), contributing to a potential future hydrogen economy. In the transition to a potential hydrogen economy, mixtures of CH4 / H2 could be added to the natural gas grid. Based on the objective of the project, the focus of this study will be on the modelling of ”Green Gas” (SNG) production by supercritical gasification of biomass. As shown in figure 2-2f, according to thermodynamics, there is a strong shift from methane towards hydrogen and carbon monoxide while increasing the temperature. Methane-rich gas can be produced up to temperatures of ca. 500oC, higher temperatures favour the production of hydrogen. At relatively low temperatures (about 350oC), just below the critical temperature, methane-rich gases can be produced by using a catalyst. The subcritical water gasification, therefore, seems to be an even more attractive process for SNG production. Since the operating temperature is lower than for supercritical gasification, there is less heat transfer required in the heat exchanger and consequently there is less heat loss. Also, at lower temperatures, more methane (and less hydrogen) is produced at equilibrium conditions. However, research on sub-critical gasification is not as far developed as for supercritical gasification and full carbon conversion is yet only achieved in subcritical gasification experiments where very low dry matter concentrations are used.
BiomassGasification Methanation
Gas conditioning
SNGPre-treatment Gas clean-up
Water
BiomassGasification
Catalytic membranereforming
H2Pre-treatment Gas clean-up
Water
CO2
34 ECN-C--04-081
3.2 Availability of biomass and waste The SCWG process is mainly aimed for conversion of wet biomass and waste streams. Examples of such streams with their potential in the Netherlands are (Hemmes, 2004): q Vegetable, fruit and garden (VFG) waste, organic wet fraction (OWF) of municipal solid
waste (MSW), waste streams from agricultural, food and beverage industries, manure, etc. Hemmes estimates that annually between 5.3 and 12 million tonnes (dry matter) of such sources to be available in the Netherlands. Assuming a conversion efficiency of 65%, this will result in 70 to 160 PJ of energy, corresponding to 2.3 to 5.3% of the present annual Dutch energy consumption.
q Wet energy crops with a large potential in the Netherlands: micro algae 36 PJ per year, water plants (seaweeds) in salt water 333 PJ per year and in fresh water 14 PJ per year, total 383 PJ per year.
q Polluted (wet) waste streams, such as sewage sludge (1.8 million tonnes per year with 0.4 million tonne dry matter), harbour sludge, mud species (40 million tonnes per year with 10-20% organic matter).
q Household and industrial waste water: 2 million tonnes dry organic matter per year. Reith et al. have reviewed the possible sources for anaerobic digestion for the generation of methane in the Netherlands (Reith et al., 2003), as summarised in table 3-1. According to these data, anually more than 14 million tonnes of such sources would be available in the Netherlands, which are also suitable sources for the SCWG process. Van de Beld et al. expect, that about 25% of the Dutch biomass-related sustainable energy targets in 2020 can be realised by optimal use of the available wet biomass streams in the Netherlands (Beld et al., 2004a). They refer to an inventory made by Vis (Vis, 2002), concerning the availability of waste streams in the food and beverage industry. These streams would have a potential of 122 PJ, from which a large percentage is used as fodder. About 44 PJ would be available for energy purposes. According to Siemons (Siemons, 2003) from the available 44 PJ, about 32 PJ can easily be combusted, and therefore, is a potential fuel for co-firing projects for electricity generation. The choice of the conversion route would, among others, depend on energetic efficiency and capital costs. Another feedstock for SCWG process is glycerol, a by-product of biodiesel production from rapeseed (RME: rapeseed methyl ester). According to reported process data, for each MW of biodiesel produced, 0.045 MW of glycerol is produced (Deurwaarder et al., 2003).

ECN-C--04-081 35
Table 3-1 Possible sources for anaerobic digestion for the generation of methane in the Netherlands (Reith et al., 2003)
Source Waste stream Production
tonne/year Dry matter
% Municipal waste Vegetable, Fruit & Garden waste 1,457,000 30 Market gardening Stalks/leaf
Withdrawn vegetables Tomato-stalks Withdrawn fruit Withdrawn ornamental plants Cabbage leaf Chicory waste Roadside grass
231,500 51,000 45,000 21,000
485 100,000 87,500 600,000
15 6,5 15 12 10 18 20 50
Maintenance greenery Waste 150,000 12 Maintenance ditches/canals Organic waste 110,000 9 Flavour industry Slurry from onion oil
Filter bed 11,500 4,000
9 50
Onion proc. industry Sorting waste 60,000 13 Vegetable/fruit proc. industry Organic biological
Activated sludge 4,806,000
3,000
Pulp & paper industry (primary) sludge 330,000 40 Slaughterhouses Sludge grease catcher
Flotation sludge Slaughter waste/blood/hair Unborn manure Purification sludge
10,000 44,000 617,000 95,000 8,000
5 5
100 Dairy industry Organic biological
Purification sludge 129,000 1,000
15
Fish proc. industry Organic biological Fuller’s earth
31,000 15,000
100 100
Oil and grease industry Purification sludge 20,000 Starch and fodder industry Organic biological 2,674,000 Trade/services/etc. OSS-waste2 290,000 20 Catering/homes/etc. Swill3 107,800 5-7 Other industrial treatment plants Purification sludge 1,600,000 Total 14,194,300
2 organic fraction of office, shops and services, like canteen waste 3 organic waste of catering industry and kitchens of homes, barracks, etc.

36 ECN-C--04-081
3.3 Experimental data Two sets of experimental data were available from the University of Twente (at 300 bar). The first set, presented in table 3-2, concerns data from batchwise capillary tests, being carried out during about one minute with wood, as well as with glucose, as a model compound. The second set, presented in table 3-3, concerns data from continuous pilot plant tests, being carried out with glycerol as a model compound. Table 3-2 Capillary data (at 300 bar)
Gas composition
vol%
Compound
d.m. wt.%
T
°C
Catalyst
C-conv.
% H2 CO2 CO CH4 C2H4 C2H6 C3H6 C3H8
Wood 9
600 750
- -
48 60
12.4 26.0
38.9 42.6
20.6 2.4
21.5 27.6
0.6 0.1
4.5 1.3
0.6 0.0
1.1 0.0
Wood 16 695 - 41 10.6 33.9 20.4 30.1 0.2 4.5 0.2 0.1
Glucose 1.5 500
600 700
- - -
32 68 99
7 16 35
39 16 24
44 55 30
2 7 9
1 0 0
1 2 2
5 2 0
2 2 0
Glucose 17 460 550 610 655 700 800
- - - - - -
23 58 71 76 84 83
8 9
10 12 18 37
33 10 8 7
13 32
53 66 62 59 47 11
3 9
13 15 16 19
1 1 1 0 0 0
1 3 4 6 6 1
1 1 1 0 0 0
0 1 2 1 0 0
Glucose 17 600 catalyst 100 11 48 0 41 0 0 0 0 Table 3-3 Pilot plant data (at 300 bar)
Gas composition
vol% Compound d.m.
wt.% T
°C Catalyst C-con.
% H2 CO2 CO CH4 C2H4 C2H6 C3H6 C3H8
Glycerol 5 600 0.01 wt.% NaOH
100 46.9 33.3 0.0 15.8 0.0 3.9 0.1 0.0
Glycerol 5 600 0.01 wt.% NaOH
100 43.6 33.7 0.1 16.5 0.1 5.0 0.0 0.0
The capillary data (table 3-2) show, that: q without a catalyst complete carbon conversion is not possible; q carbon conversion increases at a higher operating temperature, and decreases as the d.m.
content of the feedstock increases; q in presence of a catalyst complete carbon conversion can be achieved, even at a relatively
high d.m. content, much more methane can be produced, and the product gas would mainly consist of hydrogen, carbon dioxide, and methane.
It is, however, not known how the catalyst would behave in a continuous system, and how long it would be active. In case of pilot plant data, complete conversion of glycerol has been achieved in presence of a dilute NaOH solution, catalysing shift reaction. Comparable with capillary data in presence of a catalyst, the product gas consists mainly of hydrogen, carbon dioxide, and methane. The wt.% glycerol in these test, however, is very low. Based on the above-mentioned data, it is finally decided to use glycerol as feedstock in the modelling work, however, at a higher (realistic) concentration of 17 wt.%, and assuming chemical equilibrium.

ECN-C--04-081 37
3.4 System modelling
3.4.1 Introduction In order to provide an integral system analysis, the process of supercritical water gasification for SNG production has been modelled with the Aspen Plus simulation package. All kinds of organic compounds can be used within the model as feedstock, e.g. glycerol, glucose and different types of biomass. The model uses equilibrium calculations, which are based on Gibbs free energy minimisation. This means that the model can more or less predict catalytic experiments of supercritical water gasification, of course depending on the ability of a specific catalyst to have the reaction reach the chemical equilibrium. The Aspen Plus model cannot predict non-catalytic experiments, but this is not required, because non-catalytic supercritical water gasification does not achieve high carbon conversions and is, therefore, not interesting from a commercial point of view. The simplified scheme of the PDU of the University of Twente (see figure 2-10) was taken as a basis for model flow sheet. It is reproduced in Aspen Plus form, as presented in figure 3-3. The required specific downstream operations for the optimisation of SNG production are represented and described further on.
LIQPROD
LP-PROD
LIQPROD2
PRODUCT
HP-PROD
FEED FEED-2 REAC-IN
REAC-OUT
LP-SEP
HP-SEP
PUMP
REACTOR
HEAT-EX
Downstreamoperations
Figure 3-3 Simplified scheme of the Aspen Plus model
3.4.2 Supercritical water gasification The gasification has been modelled using glycerol as a model compound, but for glucose and biomass similar results can be expected. For calculation of physical properties a modified 'Redlich-Kwong-Soave equation of state' has been used. The major parameters of the system, i.e. temperature, pressure and dry matter content, have been varied to observe their effects on the product gas composition. It was found that up to 50-60 wt.% of dry matter (glycerol in this case) in the feed the carbon conversion is complete (figure 3-4a). At higher dry matter contents the undesired carbon formation takes place. The amount of methane in the product gas increases with higher dry matter in the feed (figure 3-4b), lower temperatures (figure 3-4c) and higher pressures (figure 3-4d). For the amount of hydrogen produced obviously the opposite trends are found. Carbon monoxide concentrations are always low, because of the huge amount of water present, causing the water-gas shift reaction to shift almost completely towards hydrogen and carbon dioxide (equation 3-1). These trends are all in line with general expectations and also with modelling work from the University of Twente (see §2.3.4).

38 ECN-C--04-081
CO + H2O ↔ H2 + CO2 (3-1) The product distributions from the experiments with the Twente University pilot plant (see table 3-3) can be compared with the one from the modelling results in figure 3-4b at 5 wt.% glycerol. The two are very similar except for the fact that in the experiments ethane is formed, whereas this is not expected for a system in equilibrium.
0 10 20 30 40 50 60 70 80 90 100
Wt.% glycerol
0
10
20
30
40
50
60
70
80
90
100
Car
bon
conv
ersi
on (%
)
300 bar, 600 øC
0 5 10 15 20 25 30
Wt.% glycerol
0
10
20
30
40
50
60
70
Gas
com
posi
tion
(%)
300 bar, 600 øC
methane
carbon dioxide
hydrogen
carbon monoxide
(a) (b)
400 450 500 550 600 650 700 750 800
Temperature (øC)
0
10
20
30
40
50
60
70
Gas
com
posi
tion
(%)
10 wt.% glycerol, 300 bar
methane
carbon dioxide
hydrogen
carbon monoxide
0 50 100 150 200 250 300 350 400
Pressure (bar)
0
10
20
30
40
50
60
70
Gas
com
posi
tion
(%)
10 wt.% glycerol, 600 øC
methane
carbon dioxide
hydrogen
carbon monoxide
(c) (d) Figure 3-4 Aspen Plus modelling results (equilibrium calculation) for gasification of glycerol:
(a) carbon conversion as function of wt.% glycerol, (b) gas composition as function of wt.% glycerol, (c) gas composition as function of temperature, (d) gas composition as function of pressure
3.4.3 Energy balance In the process of supercritical water gasification the wet feed stream is first compressed to high pressures and subsequently heated to the necessary reaction temperature. In this way, when the wet feed stream is heated it changes from liquid state directly to supercritical state, because of the high pressure used. Thus, there is no vapour phase involved, which means that huge evaporation and re-condensation effects are avoided. Therefore, it is possible to use the heat available in the hot product stream flowing out of the reactor to heat the cold wet feed stream. However, the heat exchanger necessary for the heat exchange between these two streams is not a conventional one, because both the cold and the hot streams cross the critical point. Close to the critical point, the heat capacity of water changes rapidly (figure 3-5a), which means that the temperature profiles in the heat exchanger are not straightforward (figure 3-5b).
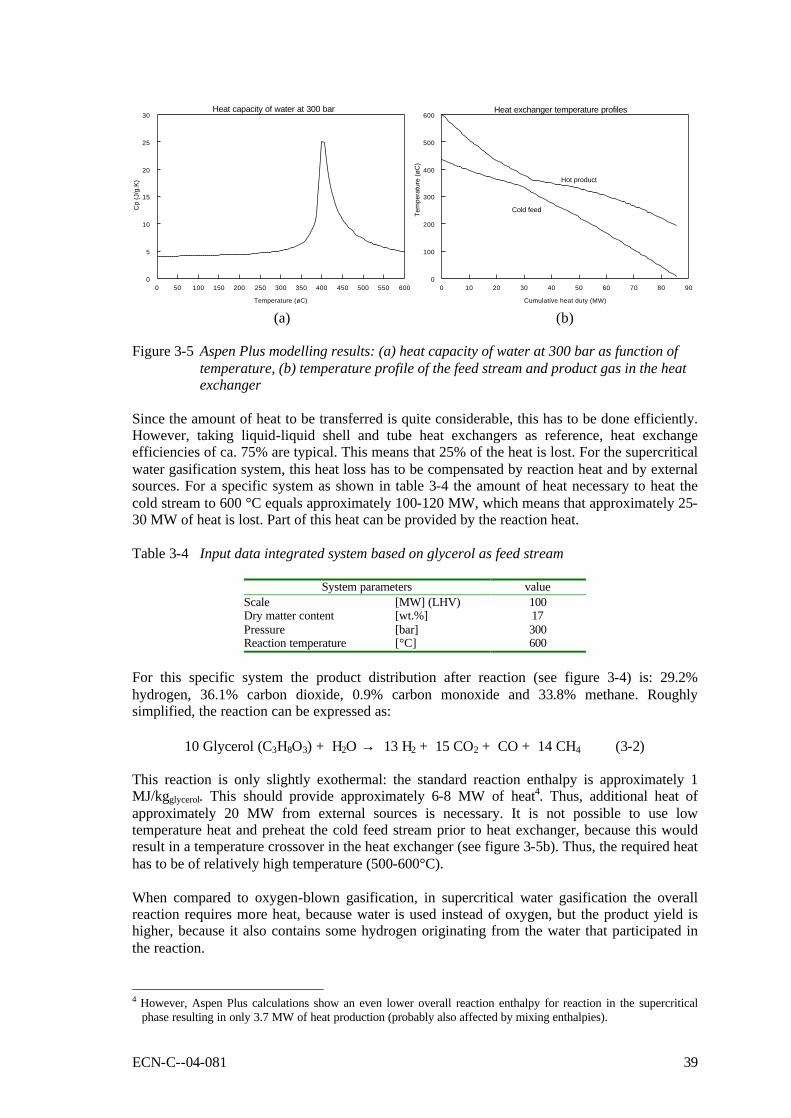
ECN-C--04-081 39
0 50 100 150 200 250 300 350 400 450 500 550 600
Temperature (øC)
0
5
10
15
20
25
30
Cp
(J/g
.K)
Heat capacity of water at 300 bar
0 10 20 30 40 50 60 70 80 90
Cumulative heat duty (MW)
0
100
200
300
400
500
600
Tem
pera
ture
(øC
)
Heat exchanger temperature profiles
Hot product
Cold feed
(a) (b) Figure 3-5 Aspen Plus modelling results: (a) heat capacity of water at 300 bar as function of
temperature, (b) temperature profile of the feed stream and product gas in the heat exchanger
Since the amount of heat to be transferred is quite considerable, this has to be done efficiently. However, taking liquid-liquid shell and tube heat exchangers as reference, heat exchange efficiencies of ca. 75% are typical. This means that 25% of the heat is lost. For the supercritical water gasification system, this heat loss has to be compensated by reaction heat and by external sources. For a specific system as shown in table 3-4 the amount of heat necessary to heat the cold stream to 600 °C equals approximately 100-120 MW, which means that approximately 25-30 MW of heat is lost. Part of this heat can be provided by the reaction heat. Table 3-4 Input data integrated system based on glycerol as feed stream
System parameters value Scale [MW] (LHV) 100 Dry matter content [wt.%] 17 Pressure [bar] 300 Reaction temperature [°C] 600
For this specific system the product distribution after reaction (see figure 3-4) is: 29.2% hydrogen, 36.1% carbon dioxide, 0.9% carbon monoxide and 33.8% methane. Roughly simplified, the reaction can be expressed as:
10 Glycerol (C3H8O3) + H2O → 13 H2 + 15 CO2 + CO + 14 CH4 (3-2) This reaction is only slightly exothermal: the standard reaction enthalpy is approximately 1 MJ/kgglycerol. This should provide approximately 6-8 MW of heat4. Thus, additional heat of approximately 20 MW from external sources is necessary. It is not possible to use low temperature heat and preheat the cold feed stream prior to heat exchanger, because this would result in a temperature crossover in the heat exchanger (see figure 3-5b). Thus, the required heat has to be of relatively high temperature (500-600°C). When compared to oxygen-blown gasification, in supercritical water gasification the overall reaction requires more heat, because water is used instead of oxygen, but the product yield is higher, because it also contains some hydrogen originating from the water that participated in the reaction.
4 However, Aspen Plus calculations show an even lower overall reaction enthalpy for reaction in the supercritical
phase resulting in only 3.7 MW of heat production (probably also affected by mixing enthalpies).

40 ECN-C--04-081
3.4.4 Upgrading to SNG After the product stream flows out of the heat exchanger, it can be separated in different ways depending on the desired product(s). Generally, first a high-pressure separation (i.e. the same pressure as in the reactor) is executed at 25-100 °C to remove the major part of the water. Also, approximately 20% of the carbon dioxide and a few percentages of hydrogen and methane are removed, since they remain solved in the water. Subsequently, the gaseous product can be treated further to obtain the desired product. The aqueous product can be separated further in one or more steps at lower pressure(s). In this way CO2-rich gas(es) with low calorific value are recovered and can either be added, after compression, to the high-pressure product gas, or be burnt to provide process heat. For the model the latter option was chosen. The stream properties for a system as given in table 3-4 and figures 3-3 and 3-6 are given in table 3-5. Table 3-5 Stream properties for a system as given in table 3-4 and figures 3-3 and 3-6
Property PRODUCT HP-PROD LIQPROD LP-PROD LIQPROD2 Composition H2O [kmol/hr] 6058 4 6055 1 6053 H2 [kmol/hr] 302 294 8 8 0 CO2 [kmol/hr] 373 305 68 64 4 CO [kmol/hr] 9 9 0 0 0 CH4 [kmol/hr] 349 341 8 8 0 C2H6 [kmol/hr] 0 0 0 0 0 Mass flow [kg/s] 36.7 5.5 31.2 0.8 30.3 Temperature [°C] 193 50 50 15 15 Pressure [bar] 300 300 300 1 1
The most straightforward method to exploit the high-pressure product gas is to remove the carbon dioxide first and then separate the methane and the hydrogen, e.g. by a membrane, and sell them as separate products. However, for SNG production the methane yield should be maximised, which requires an additional methanation process. A conventional methanation at 15 bar is considered. Therefore, in the model, prior to the methanation the gas is expanded from 300 bar to 15 bar in a turbine, after which steam is added in order to prevent carbon formation during methanation (see figure 3-6).
PRODUCT
HP-PROD
LIQPROD
METHFEED METHPROD
WATER
RAW-SNG
CO2
SNG
MP-PROD
STEAM
LP-PROD
LIQPROD2
HP-SEP
METHANCOOLER CO2-SEPTURBINE
1
LP-SEP
Use
Figure 3-6 Simplified scheme of the downstream treatment of the Aspen Plus model After methanation, the product gas is first cooled to -10 °C to remove water, and subsequently most of the carbon dioxide is removed (approximately 80%) in order to bring the Wobbe-index of the gas within the Dutch natural gas specification (i.e. between 43.46 and 44.41 MJ/Nm3). A small amount of hydrogen, approximately 2% will still be present in the product gas. For the specific system as described in table 3-4, the properties for some of the streams from figure 3-6 are given in table 3-6.

ECN-C--04-081 41
Table 3-6 Properties of some of the streams for a system as given in table 3-4 and figure 3-6
Property HP-PROD METHFEED METHPROD RAW-SNG SNG Composition H2O [vol.%] 0.4 50.0 62.1 0.0 0.0 H2 [vol.%] 30.9 15.5 0.5 1.4 1.9 CO2 [vol.%] 32.1 16.1 13.8 35.4 9.9 CO [vol.%] 0.9 0.5 0.0 0.0 0.0 CH4 [vol.%] 35.8 18.0 23.7 63.2 88.2 C2H6 [vol.%] 0.0 0.0 0.0 0.0 0.0 Mole flow [kmol/hr] 952 1896 1749 655 469 Mass flow [kg/s] 5.5 10.2 10.2 4.7 2.4 Temperature [°C] 50 268 266 -10 15 Pressure [bar] 300 15 15 15 15
3.4.5 Overall system energy balance The SNG yield of the supercritical gasification process is very high (see table 3-7), because the reaction is only slightly exothermic and, therefore, the major part of the energy value remains in the product. However, there is a large heat requirement for the process and the overall process efficiency depends largely on how this heat is provided. If this heat can be produced with high efficiency, the integrated system efficiency will still be very high. The integrated system results are given in table 3-7, along with results for production of SNG for transportation, a concept that will be described in §3.4.6.
3.4.6 SNG as transportation fuel (CSNG) Since the product gas is initially produced at 300 bar, it might be useful to operate the downstream processes at this pressure and thus produce compressed SNG (CSNG) at 300 bar, which can be used as a transportation fuel. However, this would require a methanation process under supercritical conditions, which is far from conventional methanation and which would require considerable development time. A methanation process at 60 bar should be possible in a conventional reactor. Thus, the product gas can be expanded to 60 bar, then upgraded to SNG and consequently compressed to 300 bar. This was modelled with the system from table 3-4. As gas quality specification, instead of using the Wobbe index, a maximum of 5% of inert gases in the SNG was used, which is based on specifications for the use of upgraded biogas for transportation in Sweden (City of Gothenburg, 2000). The integrated system results are given in table 3-7. Compared to the system of SNG production at 15 bar, the product yield of this system is similar, but the product contains a lower amount of hydrogen. Also, the process requires somewhat more steam to prevent carbon formation and additional compression of the SNG causes net power consumption.
3.4.7 Conclusions An integral system analysis for the production of SNG by supercritical water gasification was executed based on an Aspen Plus process model. The model is based on equilibrium and can predict catalytic supercritical water gasification of glycerol, biomass and other compounds. The composition of the produced gas corresponds well with modelling results and pilot plant data from the University of Twente. The produced gas can be upgraded to SNG for injection into the natural gas grid or for use as a (compressed) transportation fuel. Although in the system analysis one specific downstream method has been used, alternative downstream methods are possible for SNG production or co-production of SNG and hydrogen. The selected process has a high SNG yield, over 90%, but it also requires a large amount of heat, equal to approximately 20% of the biomass input. This heat is necessary, because of the heat loss in the heat exchanger. Supplying a part of the product gas or produced SNG for heat delivery, will result in an overall SNG yield over 70%.

42 ECN-C--04-081
Table 3-7 Modelling results of integrated systems for production of SNG and CSNG by gasification of wet biomass in supercritical water, followed by methanation
MASS & ENERGY FLOW SNG for gas grid SNG for transportation
Mass (kg/s) Energy (MW) Mass (kg/s) Energy (MW) In: Glycerol 6.2 100 6.2 100 Water 30.5 30.5 Steam 4.7 5.8 Power 2.3 3.0 Heat (>500°C) 19.3 19.3 Out: SNG 2.4 92.8 2.1 92.4 Power 2.4 1.5 Heat (120-500°C ) 1.3 1.4 Water 35.9 37.3 CO2 2.3 2.3 LP-product 0.8 0.8 SNG-to-glycerol ratio: 0.39 0.93 0.34 0.92 Carbon conversion: 100% 100% SNG efficiency: 92.8% 92.4% CO2 separation degree 80% 90% SNG SPECIFICATION CH4 [mol.%] 88.17 94.24 H2 [mol.%] 1.90 0.93 CO2 [mol.%] 9.89 4.80 C2+ [mol.%] 0.00 0.00 H2O [mol.%] 0.03 0.02*
CO [mol.%] 0.01 0.00 Pressure [bar] 15** 300***
LHV [MJ/kg] 38.41 43.97 LHV [MJ/mn
3] 31.86 33.93 HHV [MJ/kg] 42.64 48.80 Wobbe [MJ/mn
3] 44.16 48.69
* This water content is still approximately a factor 6 too high for use as transportation fuel (City of Gothenburg, 2000), additional water removal is necessary.
** For the foreseen application, i.e. injection into the natural gas distribution grid(s), a pressure of only 8 bar is necessary. The 15 bar given here excludes the pressure drop during the SNG production.
*** Natural gas for transportation is generally used at 200-250 bar, but stored at somewhat higher pressures, e.g. 300 bar.
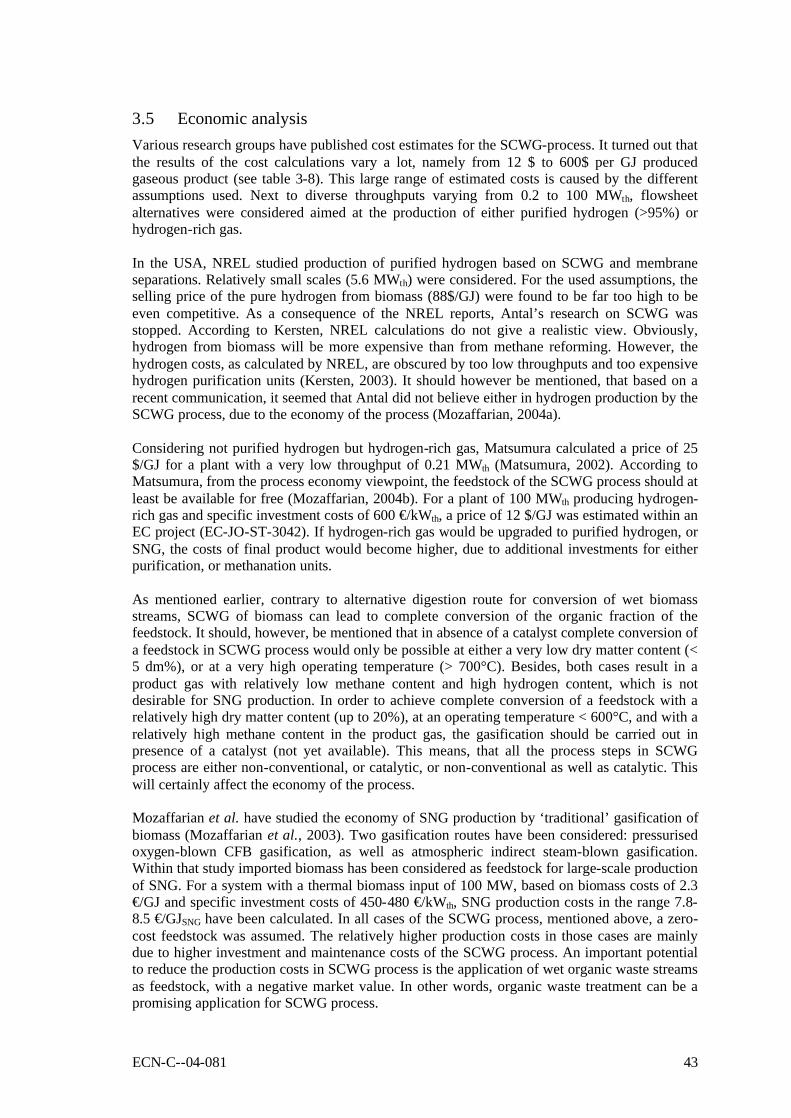
ECN-C--04-081 43
3.5 Economic analysis Various research groups have published cost estimates for the SCWG-process. It turned out that the results of the cost calculations vary a lot, namely from 12 $ to 600$ per GJ produced gaseous product (see table 3-8). This large range of estimated costs is caused by the different assumptions used. Next to diverse throughputs varying from 0.2 to 100 MWth, flowsheet alternatives were considered aimed at the production of either purified hydrogen (>95%) or hydrogen-rich gas. In the USA, NREL studied production of purified hydrogen based on SCWG and membrane separations. Relatively small scales (5.6 MWth) were considered. For the used assumptions, the selling price of the pure hydrogen from biomass (88$/GJ) were found to be far too high to be even competitive. As a consequence of the NREL reports, Antal’s research on SCWG was stopped. According to Kersten, NREL calculations do not give a realistic view. Obviously, hydrogen from biomass will be more expensive than from methane reforming. However, the hydrogen costs, as calculated by NREL, are obscured by too low throughputs and too expensive hydrogen purification units (Kersten, 2003). It should however be mentioned, that based on a recent communication, it seemed that Antal did not believe either in hydrogen production by the SCWG process, due to the economy of the process (Mozaffarian, 2004a). Considering not purified hydrogen but hydrogen-rich gas, Matsumura calculated a price of 25 $/GJ for a plant with a very low throughput of 0.21 MWth (Matsumura, 2002). According to Matsumura, from the process economy viewpoint, the feedstock of the SCWG process should at least be available for free (Mozaffarian, 2004b). For a plant of 100 MWth producing hydrogen-rich gas and specific investment costs of 600 €/kWth, a price of 12 $/GJ was estimated within an EC project (EC-JO-ST-3042). If hydrogen-rich gas would be upgraded to purified hydrogen, or SNG, the costs of final product would become higher, due to additional investments for either purification, or methanation units. As mentioned earlier, contrary to alternative digestion route for conversion of wet biomass streams, SCWG of biomass can lead to complete conversion of the organic fraction of the feedstock. It should, however, be mentioned that in absence of a catalyst complete conversion of a feedstock in SCWG process would only be possible at either a very low dry matter content (< 5 dm%), or at a very high operating temperature (> 700°C). Besides, both cases result in a product gas with relatively low methane content and high hydrogen content, which is not desirable for SNG production. In order to achieve complete conversion of a feedstock with a relatively high dry matter content (up to 20%), at an operating temperature < 600°C, and with a relatively high methane content in the product gas, the gasification should be carried out in presence of a catalyst (not yet available). This means, that all the process steps in SCWG process are either non-conventional, or catalytic, or non-conventional as well as catalytic. This will certainly affect the economy of the process. Mozaffarian et al. have studied the economy of SNG production by ‘traditional’ gasification of biomass (Mozaffarian et al., 2003). Two gasification routes have been considered: pressurised oxygen-blown CFB gasification, as well as atmospheric indirect steam-blown gasification. Within that study imported biomass has been considered as feedstock for large-scale production of SNG. For a system with a thermal biomass input of 100 MW, based on biomass costs of 2.3 €/GJ and specific investment costs of 450-480 €/kWth, SNG production costs in the range 7.8-8.5 €/GJSNG have been calculated. In all cases of the SCWG process, mentioned above, a zero-cost feedstock was assumed. The relatively higher production costs in those cases are mainly due to higher investment and maintenance costs of the SCWG process. An important potential to reduce the production costs in SCWG process is the application of wet organic waste streams as feedstock, with a negative market value. In other words, organic waste treatment can be a promising application for SCWG process.
44 ECN-C--04-081
Table 3-8 Reported costs for SCWG (Kersten, 2003)5
Feed System Capital cost Gas price E price Reference
Throughput wet ton / day
(MWth)
Dry matter
wt.%
Flow-sheet
Products
M$
$/GJ
$/kWh NREL (Amos 1999a)
9 (0.28) 90 (2.8)
180 (5.6)
15 15 15
SCWG-plant (recycle reactor) H2-purification
Waste water disposal
Purified H2 6.5 31 50
603 246 205
NREL (Amos 1999b)
180 (5.6) 15 SCWG-plant H2-purification
Waste water disposal
Purified H2 26 88
NREL (Amos 1999b)
180 (5.6) 15 SCWG-plant H2-purification
Waste water disposal Combustion turbine (407 kWe)
Purified H2 Electricity
28 103
NREL (Amos 1999b)
180 (5.6) 15 SCWG-plant H2-purification
Waste water disposal Combined cycle (1758 kWe)
Purified H2 Electricity
29.6 107
NREL (Amos 1999b)
180 (5.6) 15 SCWG-plant Waste water disposal
Combined cycle (721 kWe)
Electricity 29.6 0.63
(Matsumura 2002)
5 (0.21) 20 SCWG-plant Waste water disposal
H2-rich gas 2.1 25.5
EC project: (EC-JO-ST-3042)
3200 (100) 15 SCWG-plant H2-rich gas 60 12
5 In all cases it was assumed that the feedstock price was 0$/GJ and 1$=1 €.
ECN-C--04-081 45
Considering the economy of the SCWG process, it seems more realistic that the development of the process be based on production of methane-rich gas or SNG, instead of hydrogen production. In the former case low-temperature gasification will be favoured according to thermodynamics, resulting in high methane concentrations in the product gas. This means that, compared to high-temperature gasification, a smaller external methanation unit will be required for SNG production. Besides, less external heat will be necessary, to bring the feedstock to the required reactor inlet temperature, both aspects resulting in lower costs. Vogel et al. have studied the production of SNG from wood and manure, at high feed concentrations (up to 30 wt.%), by catalytic gasification in hot compressed water in a laboratory batch reactor at 350-415°C and 270-320 bar (Vogel et al., 2004). The reported product gas, consists mainly of methane (49 mol%) and carbon dioxide (48 mol%), with little hydrogen (3 mol%). They have calculated an SNG cost of 10 $/GJ for a 20 MWth SNG plant (calculated thermal process efficiency 70%), located in Switzerland, when using clean wood at 3.5 $/GJ. For zero-cost biomass such as manure, they expect an SNG cost around 5-6 $/GJ. Their economic analysis is based on the assumption, that no external methanation unit will be required. Other assumptions, such as the investment and operating and maintenance costs are not known. Besides, it is not known whether they take the biomass pretreatment costs, as well as the costs of waste water treatment and gas cleaning into account. It is also interesting to know how they solve pumping of a biomass slurry with up to 30 wt.% of wood. In paragraph 2.1 it is mentioned, that very wet biomass streams (moisture content > 70 wt.%) cannot be converted economically by traditional techniques like pyrolysis, combustion, and gasification, due to the cost and energy requirement for water evaporation. Taking the remarks made about the economic aspects of SCWG process for SNG production into account, it seems interesting to make a comparison between the economy of the SCWG process and other routes for conversion of wet biomass/waste streams like digestion and HTU processes, as well as thermochemical routes for conversion of relatively dry biomass streams. For the latter processes possibly a large amount of the water content of biomass streams could be removed mechanically, by different filtration techniques, eventually followed by drying to the required moisture content for combustion (50 wt.%), or gasification (10-15 wt.%).
3.6 RD&D trajectory Supercritical water gasification process is in an early stage of development and far away from commercial application. As mentioned in previous chapter, one of the important aspects for future investigation is the introduction of feedstock in the SCWG process. The experimental results, obtained so far, are mainly based on ideal model feedstocks. Regarding the heat balance, an intensive heat exchange between feedstock and products is essential. This heat exchange is a non-trivial matter, as the feedstock will already produce decomposition products like tar and char or coke, while being heated. Non-conventional solutions for the pump, heat exchanger and reactor, as well as for residual carbon combustion, may be required to obtain a practical process. When the biomass concentration in water increases, the product will gradually contain more hydrocarbons and full conversion becomes difficult. Catalysts are required then to improve the conversion. Catalysts, suitable for long operating times, are not available yet. When producing SNG from the product gas, the present hydrogen should react with carbon oxides in a methanation unit. The high pressure of the product gas (300 bar) is favoured for methanation reactions. In practice, however, this is not proven yet. Although most impurities are expected to be removed with the aqueous phase, resulting in a large waste water stream, the product gas may still contain some impurities such as sulphur and chlorine. Additional guard beds might, therefore, be necessary to prevent deactivation of the methanation catalyst. All these aspects/uncertainties require additional research and development at lab-/pilot-scale for the coming years, followed by a techno-economic evaluation of the process, with the related go no-go decision towards a demonstration.

46 ECN-C--04-081
ECN-C--04-081 47
4. CONCLUSIONS & RECOMMENDATION
4.1 Conclusions A detailed review has been carried out regarding both sub- and supercritical gasification of biomass. Also based on experimental data, delivered by the University of Twente, an integrated model has been developed within the Aspen Plus process simulation package. Based on the literature survey and the modelling work the following conclusions are made: 1. Wet biomass and related feedstock can be gasified in hot compressed water to produce
combustible gas mixtures. If produced, contaminants like tars and particulates will be in the liquid phase. At relatively low temperatures, just below the critical temperature, catalysts are required and gases rich in methane can be produced. At higher temperatures and supercritical conditions, hydrogen-rich gases are formed, especially from low-concentration feedstock. When the biomass concentration in water increases, the product will gradually contain more hydrocarbons and full conversion becomes difficult. Catalysts are required then to improve the conversion. Catalysts, suitable for long operating times, are not available yet.
2. From the overall heat balance, it is demonstrated that intensive heat exchange between feedstock and products is essential, especially for gasification in supercritical water. This heat exchange is a non-trivial matter, as the feedstock will already produce decomposition products like tar and char or coke, while being heated. Non-conventional solutions for the pump, heat exchanger and reactor, as well as for residual carbon combustion, may be required to obtain a practical process.
3. When producing SNG from the product gas, the present hydrogen should react with carbon oxides in a methanation unit. The high pressure of the product gas (300 bar) is favoured for methanation reactions. In practice, however, this is not proven yet. Although most impurities are expected to be removed with the aqueous phase, resulting in a large waste water stream, the product gas may still contain some impurities such as sulphur and chlorine. Additional guard beds might, therefore, be necessary to prevent deactivation of the methanation catalyst.
4. An integral system analysis for the production of SNG from glycerol by SCWG was executed, based on an Aspen Plus equilibrium model. The composition of the product gas corresponds well with modelling results and pilot plant data from the University of Twente. For a catalytic process with complete carbon conversion, overall SNG yields over 70% could be achieved.
5. Considering the economy of the SCWG process, it seems more realistic that the development of the process be based on production of methane-rich gas or SNG, instead of hydrogen production. Low-temperature gasification will be favoured for SNG production, compared to high-temperature gasification of biomass, resulting in higher methane concentrations in the product gas, and a smaller external methanation unit. Besides, less external heat will be necessary, to bring the feedstock to the required reactor inlet temperature, both aspects resulting in lower costs.
6. According to a first rough estimation, the SNG production costs by SCWG process are relatively high, even when the feedstock would be available for free. This is mainly due to relatively high investment and maintenance costs of this process, compared to other biomass/waste-related SNG production technologies. An important potential to reduce the production costs in the SCWG process is the application of wet organic waste streams as feedstock, with a negative market value. In other words, organic waste treatment can be a promising application for the SCWG process.
7. The SCWG process is in an early stage of development. Additional R&D will be required at lab-/pilot-scale for the coming years, followed by a techno-economic evaluation of the process, with the related go no-go decision towards a demonstration.
48 ECN-C--04-081
4.2 Recommendation Due to expected (relatively) high investment and maintenance costs of the SCWG process for SNG production, it is recommended to make a comparison between the economy of the SCWG process and other routes for conversion of wet biomass/waste streams like digestion and HTU processes, as well as thermochemical routes for conversion of relatively dry biomass streams. For the latter processes possibly a large amount of the water content of biomass streams could be removed mechanically, by different filtration techniques, eventually followed by drying to the required moisture content for combustion (50 wt.%), or gasification (10-15 wt.%).
ECN-C--04-081 49
REFERENCES
Adschiri, T., S. Hirose, R.M. Malaluan, K. Arai: Noncatalytic Conversion of Cellulose in Supercritical and Subcritical Water, Journal of Chemical Engineering of Japan, 26(6): 676-680, 1993 Amos, W.A.: Assessment of supercritical water gasification, milestone report for the U.S. Department of Energy's Hydrogen Program, National Renewable Energy Laboratory, 1999a Amos, W.A.: Assessment of supercritical water gasification: alternative design, milestone report for the U.S. Department of Energy's Hydrogen Program, National Renewable Energy Laboratory, 1999b Antal, M.J., H.L. Friedman,F.E. Rogers: Kinetics of Cellulose Pyrolysis in Nitrogen and Steam, Combust. Sci. Technol 21: 141, 1980
Antal, M.J., S. Manarungson, W.S. Mok: Hydrogen Production by Steam Reforming Glucose in Supercritical Water, Advances in Thermochemical Biomass Conversion. A.V. Bridgewater. London, Blackie Academic and Professional: 1367-1377, 1993
Antal, M.J., S.G. Allen, D. Schulman, X. Xu, R.J. Divilio: Biomass Gasification in Supercritical Water, Ind. Eng. Chem. Res. 39: 4040-4053, 2000
Antal, M.J., W.S. Mok: A Study of the Acid Catalysed Dehidratation of Fructose in Near-Critical Water, Research in Thermochemical Biomass Conversion. A.V. Bridgwater and L.J. Kuester. New York, Elsevier: 464-472, 1988
Antal, M.J.: A Review of the Vapor Phase Pyrolysis of Biomass Derived Volatile Matter, Fundamentals of Thermochemical Biomass Conversion. L.K. T. A. M. Milne. New York, Elsevier Applied Science: 511, 1985b
Antal, M.J.: Biomass Pyrolysis. Part 1: Carbohydrate Pyrolysis, Solar Energy. J.A. K. W. D. Boer. New York, Plenum Press: 61, 1982
Antal, M.J.: Biomass Pyrolysis. Part 2: Lignocellulose Pyrolysis, Solar Energy. J.A. K. W. D. Boer. New York, Plenum Press: 175, 1985a
Antal, M.J.: Energy from Biomass and Waste, D.L. Class. Chicago: 495, 1978
Antal, M.J.: The Effects of Reactor Severity on the Gas Phase Pyrolysis of Cellulose and Kraft Lignin Derived Volatile Matter, Ind. Eng. Chem. Res. 22: 366, 1983a
Antal, M.J.: The Effects of Reactor Severity on the Gas Phase Pyrolysis of Cellulose and Kraft Lignin Derived Volatile Matter, Ind. Eng. Chem. Res. 22: 366-375, 1983b
Beld, L. van de, Hutten, R. van, Kokke, R.: Produktie van SNG/CNG via vergassing van natte biomassa in superkritiek water. Novem-NEO project nr: 0268-03-04-02-010, April 2004b Beld, L. van de, Penninger, J.: Vergassing in superkritiek water: status en toekomstperspectief voor Nederland. Novem-NEO project nr: 0268-03-07-01-0018, April 2004a Boukis, N., V. Diem, D. E., G. U., K. A.: Advances with the process of biomass gasification in supercritical water, 4th International Symposium on High Pressure Technology and Chemical Engineering, Venice, Italy, 2002
Bridgwater, A.V.: The Technical and Economic Feasibility of Biomass Gasification for Power Generation, Fuel 74: 631, 1995
Buhler, W., E. Dinjus, H.J. Ederer, A. Kruse,M. C.: Ionic reactions and pyrolysis of glycerol as competing reaction pathways in near- and supercritical water, J. of Supercritical Fluids 22: 37, 2002
50 ECN-C--04-081
City of Gothenburg: Biogas technology and biogas use in Sweden; an overview. Traffic & public transport authority, November 2000
Delgado, J., M.P. Aznar, J. Corella: Biomass Gasification with Steam in Fluidised Bed: Effectiveness of CaO, MgO, and CaO-MgO for Hot Raw Gas Cleaning, Ind. Eng. Chem. Res. 36: 1535, 1997
Deurwaarder, E.P., Ree, R. van: Biofuels for transportation; conventional and advanced alternatives within a Dutch perspective. ECN-CX--03-099 (confidential), December 2003 EC-project: JO-ST-3042 Elliott, D.C., E.G. Baker, R.S. Butner, J. L. J. Sealock: Bench-Scale Reactor Tests of Low-Temperature, Catalytic Gasification of Wet Industrial Wastes, J. Solar Energy Eng. 115(1): 52-56, 1993b
Elliott, D.C., G.G. Neuenschwander, M.R. Phelps, T.R. Hart, A.H. Zacher, L.J. Silva: Chemical Processing in High-Pressure Aqueous Environment. 6. Demonstration of Catalytic Gasification for Chemical Manufacturing Wastewater Clean-up in Industrial Plants, Ind. Eng. Chem. Res. 38: 879, 1999
Elliott, D.C., J. L. J. Sealock, E.G. Baker: Chemical Processing in High-Pressure Aqueous Environments. 2. Development of Catalysts for Gasification, Ind. Eng. Chem. Res. 32(8): 1542-1548, 1993d
Elliott, D.C., J. L. J. Sealock, E.G. Baker: Method for the Catalytic Conversion of Organic Materials into a Product Gas, U.S., 1997
Elliott, D.C., J. L. J. Sealock: Low Temperature Gasification of Biomass Under Pressure, Fundamentals of Thermochemical Biomass Conversion. T.A.M. R. P. Overend, and L. K. Mudge. London, Elsevier Applied Science Publishers: 937-950, 1985
Elliott, D.C., L.J. Sealock, B.E.G.: Chemical Processing in High-Pressure Aqueous Environment: 2. Development of Catalyst for Gasification, Ind.Eng.Chem.Res. 32: 1542, 1993a
Elliott, D.C., L.J. Sealock, Jr., E.G. Baker: Chemical Processing in High-Pressure Aqueous Environment. 3. Batch Reactor Process Development Experiments for Organics Destruction, Ind. Eng. Chem. Res. 33: 558, 1994b
Elliott, D.C., L.J. Sealock, M.R. Phelps, G.G. Neuenschwander, T.R. Hart: Development of a Catalytic System for Gasification of Wet Biomass, First Biomass Conference of the Americas: Energy, Environment, Agriculture, and Industry, Burlington, Vermont, U.S., 1993c
Elliott, D.C., M.R. Phelps, L.J. Sealock, Jr., E.G. Baker: Chemical Processing in High-Pressure Aqueous Environment. 4. Continuous-Flow Reactor Process Development Experiments for Organic Destruction, Ind. Eng. Chem. Res. 33: 566, 1994a
Elliott, D.C., T.A. Werpy, Y. Wang, J.G. Frye, Jr.: Ruthenium on Rutile Catalyst, Catalytic System, and Method for Aqueous Phase Hydrogenations, U.S., 2001
Franch, E.U.: Fluids at High Pressure and Temperature, J.Chem.Thermodynamics 19: 225, 1987
Garcia, A.N., X. Xu, M.J. Antal: Carbon Catalysed Gasification of Organic Wastes in Supercritical Water, The 4th Symposium on Supercritical Fluids, Senai, Japan, 1997
Geniesse, J.C., R. Reuter: Effect of Time and Temperature on the Cracking of Oils, Ing.Eng.Chem. 22: 1274, 1930
Goudriaan, F., D.G.R. Peferoen: Liquid Fuels from Biomass via a Hydrothermal Process, Chem. Eng.Sci. 45: 2729, 1990
Hao, X.H., L.J. Guo, X. Mao, X.M. Zhang, X.J. Chen: Hydrogen Production from Glucose used as a Model Compound of Biomass Gasified in Supercritical Water, International Journal of
ECN-C--04-081 51
Hydrogen Energy 28: 55, 2003
Hemmes, K.: Vergassing van natte biomassa/reststromen in superkritiek water (SG), voor de productie van groen gas (SNG), SNG/H2-mengsels,basis chemicaliën en puur H2. projectvoorstel ingediend aan “Subsidieregeling BSE Ondersteuning”, 29 januari 2004
Herguido, J., J. Corella, J. Gonzalez-Saiz: Steam Gasification of Lignocellulosic Residues in a Fluidised Bed at a Small Pilot Scale. Effect of the Type of Feedstock, Ind. Eng. Chem. Res. 31: 1274, 1992
Holgate, H.R., J.C. Meyer, W.J. Tester: Glucose Hydrolysis and Oxidation in Supercritical Water, AIChE J. 41: 637-648, 1995
J.P. Van Hook, J.P.: Methane-Steam Reforming, Catal. Rev. -Sci. Eng 21: 1., 1980
Kabyemela, B.M., M. Takigawa, T. Adschiri, R.M. Malaluan, K. Arai: Mechanism and Kinetics of Cellobiose Decomposition in Sub- and Supercritical Water, Ind. Eng. Chem. Res. 37: 357-361, 1998
Kabyemela, B.M., T. Adschiri, R.M. Malaluan, K. Arai, H. Ohzeki: Rapid and Selective Conversion of Glucose to Erythrose in Supercritical Water, Ind. Eng. Chem. Res. 36: 5063, 1997
Kabyemela, B.M., T. Adschiri, R.M. Malaluan, K. Arai: Glucose and Fructose Decomposition in Subcritical and Supercritical Water: Detailed Reaction Pathway, Mechanisms, and Kinetics, Ind. Eng. Chem. Res. 38: 2888-2895, 1999
Kersten, S.R.A.: Biomass Gasification in Circulating Fluidised Beds, Enschede, University of Twente: 227, 2002
Kersten, S.R.A.: Biomass gasification in sub and supercritical water: a review. University of Twente, November 2003
Kruse, A., A. Gawlik: Biomass Conversion in Water at 330-410 C and 30-50 MPa. Identification of Key Compounds for Indicating different Chemical Reaction Pathways, Ind.Eng.Chem.Res. 42: 267, 2003b
Kruse, A., D. Meier, P. Rimbrecht, E. Schacht: Gasification of Pyrocatechol in Supercritical Water in the Presence of Potassium Hydroxide, Ind.Eng.Chem.Res. 39: 4842, 2000
Kruse, A., J. Abeln, E. Dinjus, M. Kluth, G. Petrich, M. Schacht, H. Sadri, H. Schmieder: Gasification of Biomass and Model Compounds in Hot Compressed Water, International Meeting of the GVC-Fachausschuβ "Hochdruckverfahrenstechnik", Karlsruhe, Germany, 1999
Kruse, A., T. Henningsen, A. Sinag, J. Pfeiffer: Biomass Gasification in Supercritical Water: Influence of the Dry Matter Content and the formation of Phenols, Ind.Eng.Chem.Res. 42: 3711-3717, 2003a
Kyle, B.G.: Chemical and Process Thermodynamics, New Jersey, Prentice Hall PTR, 1999
L.J. Sealock, L.J., Jr., D.C. Elliott: Method for the Catalytic Conversion of Lignocellulosic Materials, U.S., 1991
Lee, I. -G. L. Jae-Sung, M.-S. Kim: Hydrogen production by the gasification of biomass in supercritical water, 5th Korea-Japan Joint Symposium '99 on Hydrogen Energy, Yusong, Taejon, Korea, 1999
Lee, I., M.S. Kim, S.K. Ihm: Gasification of Glucose in Supercritical Water, Ind. Eng. Chem. Res. 41: 1182, 2002
Matsumura, Y., T. Minowa, B. Potic, S.R.A. Kersten, W. Prins, W.P.M. Van Swaaij, L. Van de Beld, D.C. Elliott, G.G. Neuenschwander, A. Kruse, J.M.L. Penninger, M.J. Antal: Biomass Gasification in Near- and Supercritical Water: Status and Prospects, in preparation Matsumura, Y.: Evaluation of supercritical water gasification and biomethanation for wet biomass utilization in Japan. Energy Conversion and
52 ECN-C--04-081
biomass utilization in Japan. Energy Conversion and Menagement 43: 1301, 2002 MEZ (Ministerie van Economische Zaken): Biomassa: de groene motor in transitie; stand van zaken na de tweede etappe. Den Haag, December 2003 MEZ (Ministerie van Economische Zaken): Derde energienota. Den Haag, 1995 MEZ (Ministerie van Economische Zaken): Duurzame energie in opmars, actieprogramma 1997-2000. Den Haag, 1997 Modell, M.: Gasification and Liquefaction of Forest Products in Supercritical Water, Fundamentals of Thermochemical Biomass. T.A.M. R. P. M. Overend, L. K. London, Elsevier Applied Science Publishers, Ltd.: 95, 1985
Mok, W.S.L., M.J. Antal: Effects of Presure on Biomass Pyrolysis. II. Heats of Reaction of Cellulose Pyrolysis, Thermochim. Acta 68: 165, 1983a
Mok, W.S.L.: The Effects of Pressure on Biomass Pyrolysis and Gasification, Princeton Univ, 1983b
Mozaffarian, M., Zwart, R.W.R.: Feasibility of biomass/waste-related SNG production technolo-gies. Final report, ECN-C--03-066, ECN, Petten, The Netherlands, July 2003
Mozaffarian, M.: Personal communication. 30 August 2004a
Mozaffarian, M.: Personal communication. 30 August 2004b
NIST National Institute of Standards and Technology
Park, K.C., H. Tomiyasu: Gasification Reaction of Organic Compounds Catalysed by RuO2 in Supercritical Water, ChemCommun.: 694, 2003
Penninger, J.M.L., R.J.A. Kersten,H.C.L. Baur (1999). Reactions of Diphenylether in Supercritical Water-Mechanism and Kinetics, J. Supercritical Fluids 16: 119-132, 1999
Penninger, J.M.L.: Reactions of Di-n-butylphthalate in Water at Nesr-critical Temperature and Pressure, Fuel 67: 490, 1988
Potic, B., L. Van de Beld, D. Asink, W. Prins, W.P.M. Van Swaaij: Gasification of Biomass in Supercritical Water, 12th European Conference and Exhibition on Biomass for Energy, Industry and Climate Protection, Amsterdam, 2002
Potic, B., S.R.A. Kersten, W. Prins, W.P.M. Van Swaaij: A High-throughput Screening Technique for Conversion in Hot Compressed Water, submitted to Ind.Eng.Chem.Res
Reith, J.H., Wijffels, R.H., Barten, H.: Bio-methane & bio-hydrogen; status and perspectives of biological methane and hydrogen production. ISBN: 90-9017165-7, 2003
Sakaki, T., M. Shibata, T. Miki, H. Hirosue, N. Hayashi: Reaction Model of Cellulose Decomposition in near-Critical Water and Fermentation of Product, Bioresource Technology 58: 197-202, 1996
Savage, P.E.: Organic Chemical Reactions in Supercritical water, Chem. Rev. 99: 603, 1999
Sealock, L.J., Jr., D.C. Elliott, E.G. Baker, A.G. Fassbender, L.J. Silva: Chemical Processing in High-Pressure Aqueous Environments. 5. New Processing Concepts, Ind. Eng. Chem. Res. 35(11): 411-4118, 1996
Shaw, R.W., T.B. brill, A.A. Clifford, E.U. Franch: Supercritical Water- a Medium for Chemistry, Chem. Eng.News 69: 26, 1991
Siemons, R.V.: Biogas voor bijmenging in het aardgasnet, rapport aan het Team Nieuw Gas (23 juli 2003). In “Wegen naar Nieuw Gas: de eerste stap is een daalder waard”, Ministerie van Economische Zaken, december 2003
Sinag, A., A. Kruse, V. Schwarzkopf: Key Compounds of the Hydropyrolysis of Glucose in Supercritical Water in the Presence of K2CO3, Ind. Eng. Chem. Res. 42: 3516-3521, 2003
ECN-C--04-081 53
UNFCCC, U.: United Nations Framework Convention on Climate Change Secretariat (UNFCCC) and United Nations Development Programme (UNDP), 2002
Van Swaaij, W.P.M.: Technical Feasibility of Biomass Gasofocation in a Fluidised Bed with Supercritical Water, Enschede, University of Twente: 160, 2003
Vis, M.: Beschikbaarheid van reststromen uit de voedings- en genotmiddelenindustrie voor energieproduktie. BTG bv, Novem project: 2020-01-23-03-0003, juli 2002
Vogel, F., M. Waldner: Catalytic hydrothermal gasification of wood biomass at high feed concentrations. Contribution to the “Science in Thermal and Chemical Biomass Conversion” Conference, Victoria, Vancouver Island, BC, Canada, 30 August - 2 September 2004
Wagenaar, B.M., W. Prins, W.P.M. Van Swaaij: Flash Pyrolysis Kinetics of Pine Wood, Fuel Proc. Techn. 36: 291, 1994
Wagner, E.S., G.F. Froment: Steam Reforming Analysed, Hydrocarbon Processing(July): 69, 1992
Woods, D.R.: Process Design and Engineering Practice, New Jersey, PTR Prentice Hall, 1995
Xu, J., G.F. Froment: Methane Steam Reforming, Methanation and Water-Gas Shift: I. Intrinsic Kinetics, AIChE J. 35: 88, 1989a
Xu, J., G.F. Froment: Methane Steam Reforming: II. Diffusional Limitations and Reactor Simulation, AIChE J. 35: 97, 1989b
Xu, X., M.J. Antal, D.G.M. Anderson: Mechanism and Temperature-Dependent Kinetics of the Dehydration of tetra-Butyl Alcohol in Hot Compressed Liquid Water, Ind. Eng. Chem. Res. 36: 23, 1997a
Xu, X., M.J. Antal, Jr.: Gasification of Sewage Sludge and Organics in Supercritical Water, AIChE Annual Meeting, 1997b
Xu, X., M.J. Antal, Jr.: Gasification of Sewage Sludge and Other Biomass for Hydrogen Production in Supercritical Water, Enviromental Progress 17: 215, 1998
Xu, X., Y. Matsumura, J. Stenberg, M.J. Antal, Jr.: Carbon-Catalysed Gasification of Organic Feedstocks in Supercritical Water, Ind. Eng. Chem. Res. 35: 2522, 1996b
Xu, X., Y. Matsumura, J. Stenberg, M.J. Antal: Carbon-Catalysed Gasification of Organic Feedstocks in Supercritical Water, Ind. Eng. Chem. Res. 35: 2522-2530, 1996a
Yu, D., M. Aihara, M.J. Antal, Jr.: Hydrogen Production by Steam Reforming Glucose in Supercritical Water, Energy Fuels 7: 574, 1993b
Yu, D., M. Aihara, M.J. Antal: Hydrogen Production by Steam Reforming Glucose in Supercritical Water, Energy & Fuels 7: 574-577, 1993a

54 ECN-C--04-081

ECN-C--04-081 55
APPENDIX A PROPERTIES OF USED REACTORS ON LABORATORY SCALE

56 ECN-C--04-081

ECN-C--04-081 57
Table A-I Properties of used reactors on laboratory scale
Research group
Reactor type Reactor Material V ml
ID mm
L mm
Kruse et al. Autoclave I SS 1000 - - Tubular reactor II Inconel 625 - 8 500 Bench-scale tubular reactor Inconel 625 - 8 15000 Batch reactor I Inconel 625 1000 Batch reactor II Nimonic110 100 Batch III-tumbling autoclave Inconel 625 1000 Tubular reactor I n.a. Continuous Stirred Tank
Reactor(CSTR) Nimonic 90 190
Antal et al. SCAFR SCCFR1 HastelloyC276 - 1.44 6100 SCCFR2 Corroded HastelloyC276 - 1.44 6100 SCCFR3 Inconel 625 - 1.44 6100 SCFR1 Inconel 625 - 4.75 SCFR2 Hastelloy C276 - 6.25 952 SCFR3 Hastelloy C276 - 6.22 1016 SCFR4 Hastelloy C276 - 6.22 1016 SCFR5 Hastelloy C276 - 6.22 1016 SCFR6 Hastelloy C276 - 6.22 1016 Hao et al. SCFR-6mm SS316 - 6 SCFR-9mm SS316 - 9 Holgate et al. FR Inconel 625 - 1.71 4700 Lee et al. SCWFR Hastelloy C276 - 6.22 670 Model et al. Magnetically stirred autoclave SS 316 1000 - - Park et al. autoclave n.a. Elliott et al. Autoclave Inconel 1000 FBCTR-Bench scale (BS) SS 304 25 1830 FBCTR-Micro scale(MC) SS 316 13 300 Vogel et al. autoclave n.a.
SCAFR-supercritical annular flow reactor SCCFR- supercritical Coil flow reactor SCFR-supercritical flow reactor Nimonic- nickel base alloy CSTR- Continuous Stirred Tank Reactor FBCTR- Fixed Bed Continuous Tank Reactor FR – flow reactor n.a.- not available

58 ECN-C--04-081
ECN-C--04-081 59
APPENDIX B REPORTED RESULTS OF NON-CATALYTIC GASIFICATION EXPERIMENTS

60 ECN-C--04-081
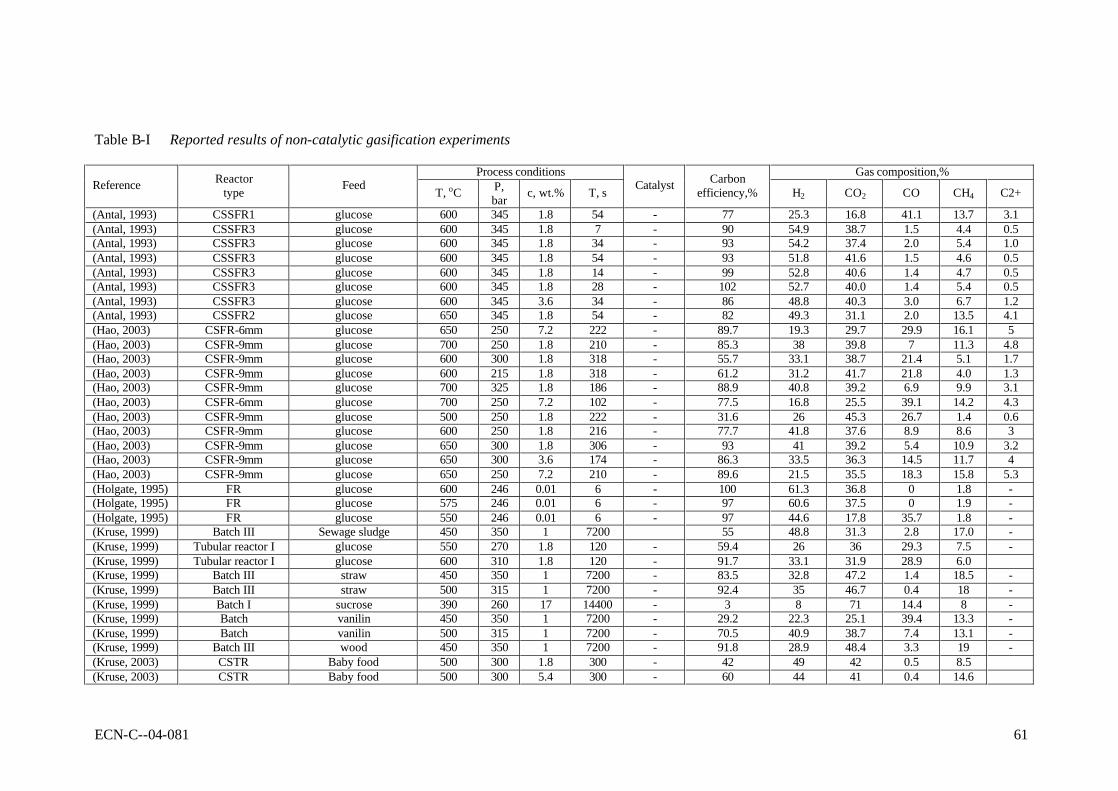
ECN-C--04-081 61
Table B-I Reported results of non-catalytic gasification experiments
Process conditions Gas composition,% Reference Reactor
type Feed T, oC P, bar c, wt.% T, s Catalyst Carbon
efficiency,% H2 CO2 CO CH4 C2+
(Antal, 1993) CSSFR1 glucose 600 345 1.8 54 - 77 25.3 16.8 41.1 13.7 3.1 (Antal, 1993) CSSFR3 glucose 600 345 1.8 7 - 90 54.9 38.7 1.5 4.4 0.5 (Antal, 1993) CSSFR3 glucose 600 345 1.8 34 - 93 54.2 37.4 2.0 5.4 1.0 (Antal, 1993) CSSFR3 glucose 600 345 1.8 54 - 93 51.8 41.6 1.5 4.6 0.5 (Antal, 1993) CSSFR3 glucose 600 345 1.8 14 - 99 52.8 40.6 1.4 4.7 0.5 (Antal, 1993) CSSFR3 glucose 600 345 1.8 28 - 102 52.7 40.0 1.4 5.4 0.5 (Antal, 1993) CSSFR3 glucose 600 345 3.6 34 - 86 48.8 40.3 3.0 6.7 1.2 (Antal, 1993) CSSFR2 glucose 650 345 1.8 54 - 82 49.3 31.1 2.0 13.5 4.1 (Hao, 2003) CSFR-6mm glucose 650 250 7.2 222 - 89.7 19.3 29.7 29.9 16.1 5 (Hao, 2003) CSFR-9mm glucose 700 250 1.8 210 - 85.3 38 39.8 7 11.3 4.8 (Hao, 2003) CSFR-9mm glucose 600 300 1.8 318 - 55.7 33.1 38.7 21.4 5.1 1.7 (Hao, 2003) CSFR-9mm glucose 600 215 1.8 318 - 61.2 31.2 41.7 21.8 4.0 1.3 (Hao, 2003) CSFR-9mm glucose 700 325 1.8 186 - 88.9 40.8 39.2 6.9 9.9 3.1 (Hao, 2003) CSFR-6mm glucose 700 250 7.2 102 - 77.5 16.8 25.5 39.1 14.2 4.3 (Hao, 2003) CSFR-9mm glucose 500 250 1.8 222 - 31.6 26 45.3 26.7 1.4 0.6 (Hao, 2003) CSFR-9mm glucose 600 250 1.8 216 - 77.7 41.8 37.6 8.9 8.6 3 (Hao, 2003) CSFR-9mm glucose 650 300 1.8 306 - 93 41 39.2 5.4 10.9 3.2 (Hao, 2003) CSFR-9mm glucose 650 300 3.6 174 - 86.3 33.5 36.3 14.5 11.7 4 (Hao, 2003) CSFR-9mm glucose 650 250 7.2 210 - 89.6 21.5 35.5 18.3 15.8 5.3 (Holgate, 1995) FR glucose 600 246 0.01 6 - 100 61.3 36.8 0 1.8 - (Holgate, 1995) FR glucose 575 246 0.01 6 - 97 60.6 37.5 0 1.9 - (Holgate, 1995) FR glucose 550 246 0.01 6 - 97 44.6 17.8 35.7 1.8 - (Kruse, 1999) Batch III Sewage sludge 450 350 1 7200 55 48.8 31.3 2.8 17.0 - (Kruse, 1999) Tubular reactor I glucose 550 270 1.8 120 - 59.4 26 36 29.3 7.5 - (Kruse, 1999) Tubular reactor I glucose 600 310 1.8 120 - 91.7 33.1 31.9 28.9 6.0 (Kruse, 1999) Batch III straw 450 350 1 7200 - 83.5 32.8 47.2 1.4 18.5 - (Kruse, 1999) Batch III straw 500 315 1 7200 - 92.4 35 46.7 0.4 18 - (Kruse, 1999) Batch I sucrose 390 260 17 14400 - 3 8 71 14.4 8 - (Kruse, 1999) Batch vanilin 450 350 1 7200 - 29.2 22.3 25.1 39.4 13.3 - (Kruse, 1999) Batch vanilin 500 315 1 7200 - 70.5 40.9 38.7 7.4 13.1 - (Kruse, 1999) Batch III wood 450 350 1 7200 - 91.8 28.9 48.4 3.3 19 - (Kruse, 2003) CSTR Baby food 500 300 1.8 300 - 42 49 42 0.5 8.5 (Kruse, 2003) CSTR Baby food 500 300 5.4 300 - 60 44 41 0.4 14.6
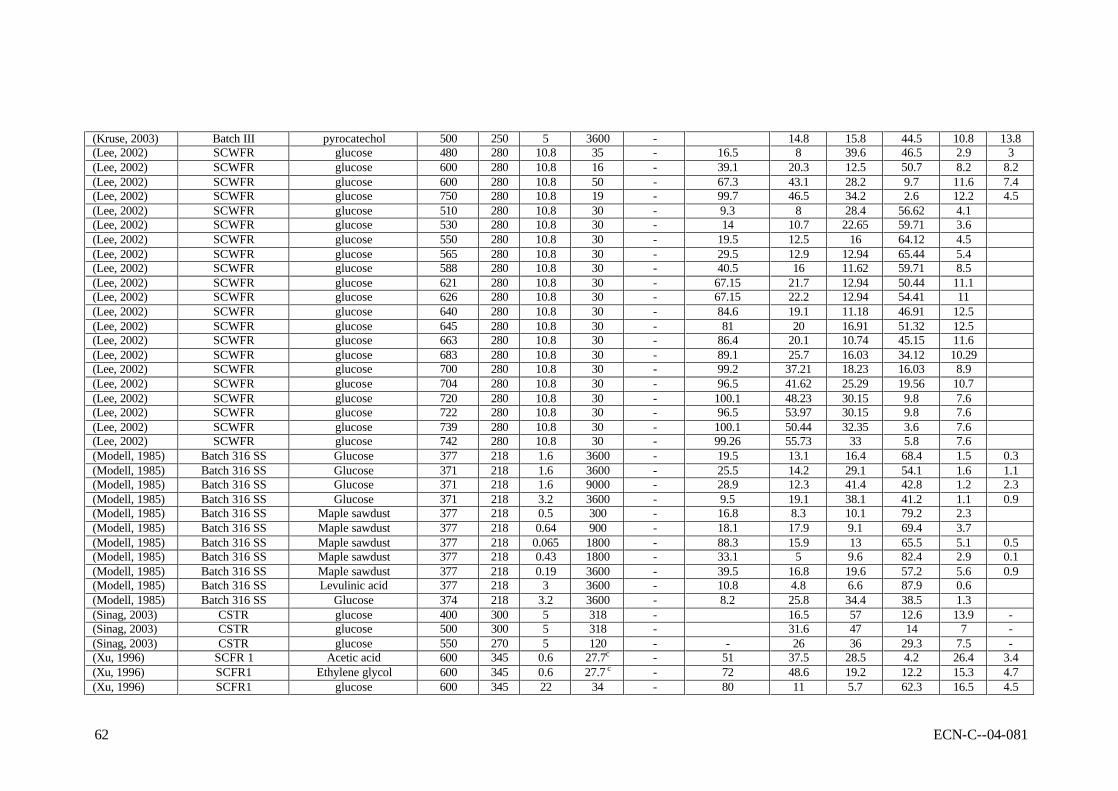
62 ECN-C--04-081
(Kruse, 2003) Batch III pyrocatechol 500 250 5 3600 - 14.8 15.8 44.5 10.8 13.8 (Lee, 2002) SCWFR glucose 480 280 10.8 35 - 16.5 8 39.6 46.5 2.9 3 (Lee, 2002) SCWFR glucose 600 280 10.8 16 - 39.1 20.3 12.5 50.7 8.2 8.2 (Lee, 2002) SCWFR glucose 600 280 10.8 50 - 67.3 43.1 28.2 9.7 11.6 7.4 (Lee, 2002) SCWFR glucose 750 280 10.8 19 - 99.7 46.5 34.2 2.6 12.2 4.5 (Lee, 2002) SCWFR glucose 510 280 10.8 30 - 9.3 8 28.4 56.62 4.1 (Lee, 2002) SCWFR glucose 530 280 10.8 30 - 14 10.7 22.65 59.71 3.6 (Lee, 2002) SCWFR glucose 550 280 10.8 30 - 19.5 12.5 16 64.12 4.5 (Lee, 2002) SCWFR glucose 565 280 10.8 30 - 29.5 12.9 12.94 65.44 5.4 (Lee, 2002) SCWFR glucose 588 280 10.8 30 - 40.5 16 11.62 59.71 8.5 (Lee, 2002) SCWFR glucose 621 280 10.8 30 - 67.15 21.7 12.94 50.44 11.1 (Lee, 2002) SCWFR glucose 626 280 10.8 30 - 67.15 22.2 12.94 54.41 11 (Lee, 2002) SCWFR glucose 640 280 10.8 30 - 84.6 19.1 11.18 46.91 12.5 (Lee, 2002) SCWFR glucose 645 280 10.8 30 - 81 20 16.91 51.32 12.5 (Lee, 2002) SCWFR glucose 663 280 10.8 30 - 86.4 20.1 10.74 45.15 11.6 (Lee, 2002) SCWFR glucose 683 280 10.8 30 - 89.1 25.7 16.03 34.12 10.29 (Lee, 2002) SCWFR glucose 700 280 10.8 30 - 99.2 37.21 18.23 16.03 8.9 (Lee, 2002) SCWFR glucose 704 280 10.8 30 - 96.5 41.62 25.29 19.56 10.7 (Lee, 2002) SCWFR glucose 720 280 10.8 30 - 100.1 48.23 30.15 9.8 7.6 (Lee, 2002) SCWFR glucose 722 280 10.8 30 - 96.5 53.97 30.15 9.8 7.6 (Lee, 2002) SCWFR glucose 739 280 10.8 30 - 100.1 50.44 32.35 3.6 7.6 (Lee, 2002) SCWFR glucose 742 280 10.8 30 - 99.26 55.73 33 5.8 7.6 (Modell, 1985) Batch 316 SS Glucose 377 218 1.6 3600 - 19.5 13.1 16.4 68.4 1.5 0.3 (Modell, 1985) Batch 316 SS Glucose 371 218 1.6 3600 - 25.5 14.2 29.1 54.1 1.6 1.1 (Modell, 1985) Batch 316 SS Glucose 371 218 1.6 9000 - 28.9 12.3 41.4 42.8 1.2 2.3 (Modell, 1985) Batch 316 SS Glucose 371 218 3.2 3600 - 9.5 19.1 38.1 41.2 1.1 0.9 (Modell, 1985) Batch 316 SS Maple sawdust 377 218 0.5 300 - 16.8 8.3 10.1 79.2 2.3 (Modell, 1985) Batch 316 SS Maple sawdust 377 218 0.64 900 - 18.1 17.9 9.1 69.4 3.7 (Modell, 1985) Batch 316 SS Maple sawdust 377 218 0.065 1800 - 88.3 15.9 13 65.5 5.1 0.5 (Modell, 1985) Batch 316 SS Maple sawdust 377 218 0.43 1800 - 33.1 5 9.6 82.4 2.9 0.1 (Modell, 1985) Batch 316 SS Maple sawdust 377 218 0.19 3600 - 39.5 16.8 19.6 57.2 5.6 0.9 (Modell, 1985) Batch 316 SS Levulinic acid 377 218 3 3600 - 10.8 4.8 6.6 87.9 0.6 (Modell, 1985) Batch 316 SS Glucose 374 218 3.2 3600 - 8.2 25.8 34.4 38.5 1.3 (Sinag, 2003) CSTR glucose 400 300 5 318 - 16.5 57 12.6 13.9 - (Sinag, 2003) CSTR glucose 500 300 5 318 - 31.6 47 14 7 - (Sinag, 2003) CSTR glucose 550 270 5 120 - - 26 36 29.3 7.5 - (Xu, 1996) SCFR 1 Acetic acid 600 345 0.6 27.7c - 51 37.5 28.5 4.2 26.4 3.4 (Xu, 1996) SCFR1 Ethylene glycol 600 345 0.6 27.7 c - 72 48.6 19.2 12.2 15.3 4.7 (Xu, 1996) SCFR1 glucose 600 345 22 34 - 80 11 5.7 62.3 16.5 4.5
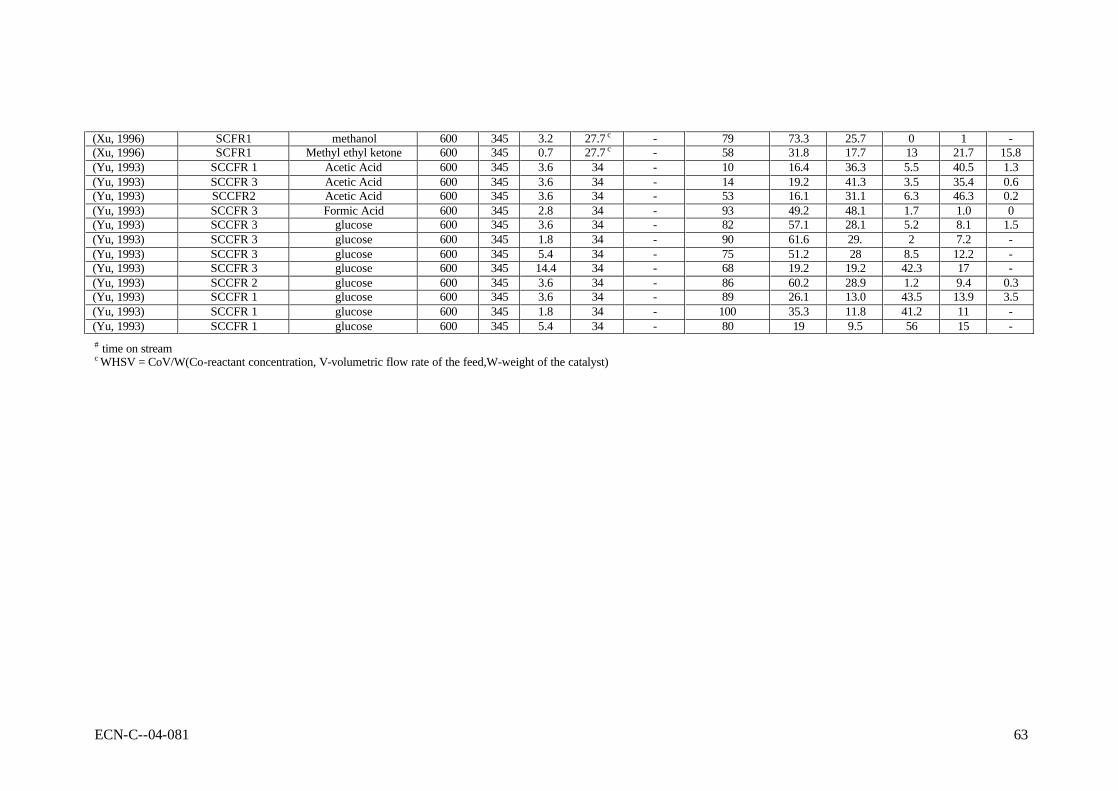
ECN-C--04-081 63
(Xu, 1996) SCFR1 methanol 600 345 3.2 27.7 c - 79 73.3 25.7 0 1 - (Xu, 1996) SCFR1 Methyl ethyl ketone 600 345 0.7 27.7 c - 58 31.8 17.7 13 21.7 15.8 (Yu, 1993) SCCFR 1 Acetic Acid 600 345 3.6 34 - 10 16.4 36.3 5.5 40.5 1.3 (Yu, 1993) SCCFR 3 Acetic Acid 600 345 3.6 34 - 14 19.2 41.3 3.5 35.4 0.6 (Yu, 1993) SCCFR2 Acetic Acid 600 345 3.6 34 - 53 16.1 31.1 6.3 46.3 0.2 (Yu, 1993) SCCFR 3 Formic Acid 600 345 2.8 34 - 93 49.2 48.1 1.7 1.0 0 (Yu, 1993) SCCFR 3 glucose 600 345 3.6 34 - 82 57.1 28.1 5.2 8.1 1.5 (Yu, 1993) SCCFR 3 glucose 600 345 1.8 34 - 90 61.6 29. 2 7.2 - (Yu, 1993) SCCFR 3 glucose 600 345 5.4 34 - 75 51.2 28 8.5 12.2 - (Yu, 1993) SCCFR 3 glucose 600 345 14.4 34 - 68 19.2 19.2 42.3 17 - (Yu, 1993) SCCFR 2 glucose 600 345 3.6 34 - 86 60.2 28.9 1.2 9.4 0.3 (Yu, 1993) SCCFR 1 glucose 600 345 3.6 34 - 89 26.1 13.0 43.5 13.9 3.5 (Yu, 1993) SCCFR 1 glucose 600 345 1.8 34 - 100 35.3 11.8 41.2 11 - (Yu, 1993) SCCFR 1 glucose 600 345 5.4 34 - 80 19 9.5 56 15 - # time on stream c WHSV = CoV/W(Co-reactant concentration, V-volumetric flow rate of the feed,W-weight of the catalyst)

64 ECN-C--04-081

ECN-C--04-081 65
APPENDIX C REPORTED RESULTS OF CATALYTIC GASIFICATION EXPERIMENTS

66 ECN-C--04-081
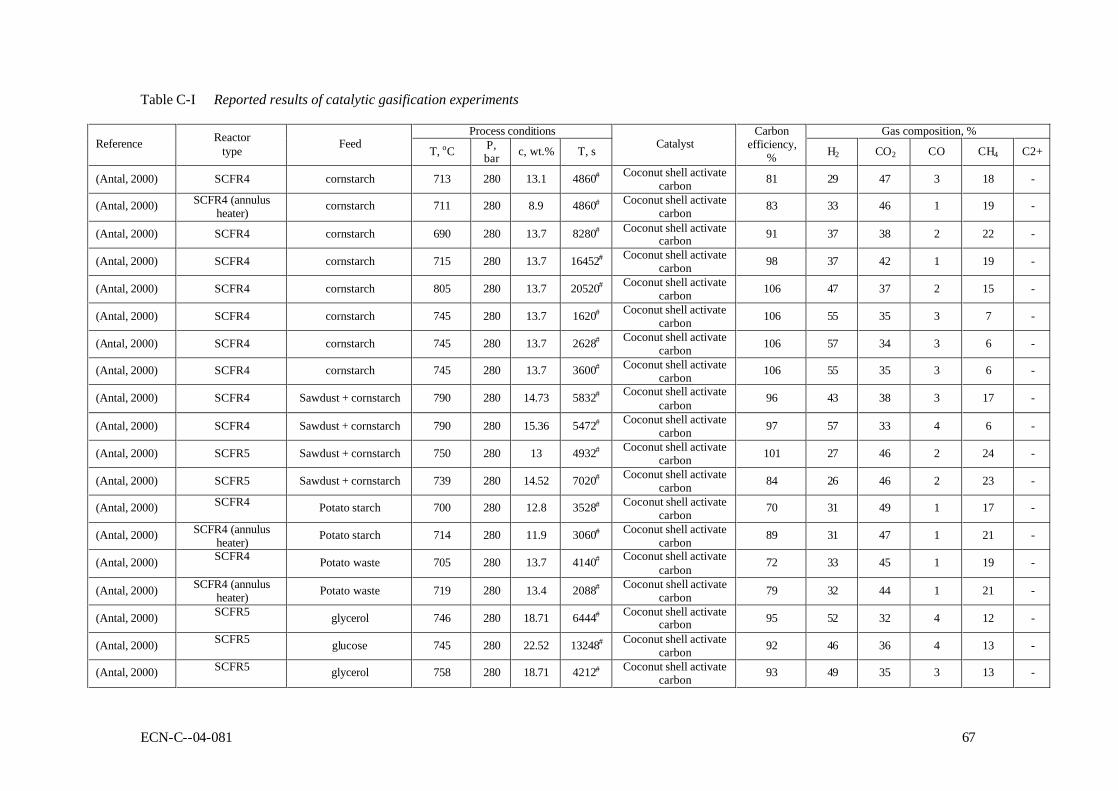
ECN-C--04-081 67
Table C-I Reported results of catalytic gasification experiments
Process conditions Gas composition, % Reference Reactor
type Feed T, oC P, bar c, wt.% T, s Catalyst
Carbon efficiency,
% H2 CO2 CO CH4 C2+
(Antal, 2000) SCFR4 cornstarch 713 280 13.1 4860# Coconut shell activate carbon 81 29 47 3 18 -
(Antal, 2000) SCFR4 (annulus heater) cornstarch 711 280 8.9 4860# Coconut shell activate
carbon 83 33 46 1 19 -
(Antal, 2000) SCFR4 cornstarch 690 280 13.7 8280# Coconut shell activate carbon 91 37 38 2 22 -
(Antal, 2000) SCFR4 cornstarch 715 280 13.7 16452# Coconut shell activate carbon 98 37 42 1 19 -
(Antal, 2000) SCFR4 cornstarch 805 280 13.7 20520# Coconut shell activate carbon 106 47 37 2 15 -
(Antal, 2000) SCFR4 cornstarch 745 280 13.7 1620# Coconut shell activate carbon 106 55 35 3 7 -
(Antal, 2000) SCFR4 cornstarch 745 280 13.7 2628# Coconut shell activate carbon 106 57 34 3 6 -
(Antal, 2000) SCFR4 cornstarch 745 280 13.7 3600# Coconut shell activate carbon 106 55 35 3 6 -
(Antal, 2000) SCFR4 Sawdust + cornstarch 790 280 14.73 5832# Coconut shell activate carbon 96 43 38 3 17 -
(Antal, 2000) SCFR4 Sawdust + cornstarch 790 280 15.36 5472# Coconut shell activate carbon 97 57 33 4 6 -
(Antal, 2000) SCFR5 Sawdust + cornstarch 750 280 13 4932# Coconut shell activate carbon 101 27 46 2 24 -
(Antal, 2000) SCFR5 Sawdust + cornstarch 739 280 14.52 7020# Coconut shell activate carbon 84 26 46 2 23 -
(Antal, 2000) SCFR4 Potato starch 700 280 12.8 3528# Coconut shell activate carbon 70 31 49 1 17 -
(Antal, 2000) SCFR4 (annulus heater) Potato starch 714 280 11.9 3060# Coconut shell activate
carbon 89 31 47 1 21 -
(Antal, 2000) SCFR4 Potato waste 705 280 13.7 4140# Coconut shell activate carbon 72 33 45 1 19 -
(Antal, 2000) SCFR4 (annulus heater) Potato waste 719 280 13.4 2088# Coconut shell activate
carbon 79 32 44 1 21 -
(Antal, 2000) SCFR5 glycerol 746 280 18.71 6444# Coconut shell activate carbon 95 52 32 4 12 -
(Antal, 2000) SCFR5 glucose 745 280 22.52 13248# Coconut shell activate carbon 92 46 36 4 13 -
(Antal, 2000) SCFR5 glycerol 758 280 18.71 4212# Coconut shell activate carbon 93 49 35 3 13 -

68 ECN-C--04-081
(Antal, 2000) SCFR5 Kraft lignin+ cornstarch 757 280 15 6372# Coconut shell activate
carbon 15 48 47 2 2 -
(Antal, 2000) SCFR5 glycerol 748 280 18.71 6444# Coconut shell activate carbon 89 51 31 4 13 -
(Antal, 2000) SCFR5 Avicel+ cornstarch 756 280 16 9720# Coconut shell activate carbon 83 30 45 2 21 -
(Garcia, 1997) CSFR2 glycerol 625 280 12.3 2880# Coconut shell activated carbon 86 41 22 17 9.6 4.4
(Garcia, 1997) CSFR2 glycerol 625 280 12.3 6480# Coconut shell activated carbon 97 46 24 13 8.6 2.9
(Garcia, 1997) CSFR2 glycerol 625 280 12.3 10080# Coconut shell activated carbon 93 51 25 9.5 7.9 2.4
(Garcia, 1997) CSFR2 glycerol 625 280 12.3 13680# Coconut shell activated carbon 97 54 26 8.1 8.2 2.3
(Garcia, 1997) CSFR2 glycerol 625 280 12.3 17280# Coconut shell activated carbon 98 53 27 7 8.1 2.2
(Garcia, 1997) CSFR2 glycerol 625 280 12.3 19080# Coconut shell activated carbon 97 52 27 6.6 8.1 2.1
(Garcia, 1997) CSFR2 Poplar wood sawdust + corn starch paste 650 280 22.6 3708# Coconut shell activated
carbon 73 33 44 2.5 16 2.2
(Garcia, 1997) CSFR2 Poplar wood sawdust + corn starch paste 650 280 22.6 5940# Coconut shell activated
carbon 74 26 45 5.2 17 3.3
(Garcia, 1997) CSFR2 Poplar wood sawdust + corn starch paste 650 280 22.6 8640# Coconut shell activated
carbon 70 28 45 4.9 17 3.2
(Hao, 2003) CSFR-6mm glucose 650 250 7.2 222 KOH 93.9 25.7 50.2 0.5 19.2 4.4 (Hao, 2003) CSFR-6mm glucose 650 250 7.2 108 Na2CO3 90.8 23.1 50.9 2.7 19.3 4 (Kruse, 2000) Tubular reactor II pyrocatechol 700 200 6.6 60 KOH 99 58.7 33 1.3 6 1 (Kruse, 2000) Tubular reactor II pyrocatechol 700 300 6.6 60 KOH 99 53.3 34.7 1 8.6 2.4 (Kruse, 2000) Tubular reactor II pyrocatechol 700 400 6.6 60 KOH 99 48.7 36.3 1 10.5 3.5 (Kruse, 2000) Tubular reactor II pyrocatechol 700 200 13.2 60 KOH 99 53.4 33.8 1.5 8.7 2.6 (Kruse, 2000) Tubular reactor II pyrocatechol 700 300 13.2 60 KOH 99 39 39 1.1 14.5 6.4 (Kruse, 2000) Tubular reactor II pyrocatechol 700 400 13.2 60 KOH 99 37 39.4 1.3 16.5 5.8 (Kruse, 2000) Batch III pyrocatechol 500 250 5 3600 KOH 0.5 wt.% 28 37 10 16 9 (Kruse, 2000) Batch III pyrocatechol 500 250 5 3600 KOH 5 wt.% 48 37 1 10 4 (Kruse, 1999) Tubular reactor I glucose 550 310 1.8 138 K2CO3 95.2 29 46 0.1 1.9 (Kruse, 1999) Tubular reactor I glucose 550 310 5 138 K2CO3 81 47 69 1.9 8.7 (Kruse, 1999) Tubular reactor I glucose 600 310 1.8 138 K2CO3 97 28 55 0.2 3.3 - (Kruse, 1999) Tubular reactor I glucose 600 310 5 138 K2CO3 91.8 37 67 4.1 7.3 - (Kruse, 1999) Batch III straw 450 350 1 7200 K2CO3 82.1 42.7 39.7 1.0 16.5 - (Kruse, 1999) Batch III straw 500 315 1 7200 K2CO3 92.5 43.7 40.6 0.12 15.6 - (Kruse, 1999) Batch III vanilin 450 350 1 7200 K2CO3 73.5 45.9 38.6 0.5 15.0 - (Kruse, 1999) Batch III vanilin 500 315 1 7200 K2CO3 78.1 40.9 43 1.5 14.6 - (Kruse, 1999) Batch III wood 450 350 1 7200 K2CO3 81.2 34.2 50 0.7 15.3 -
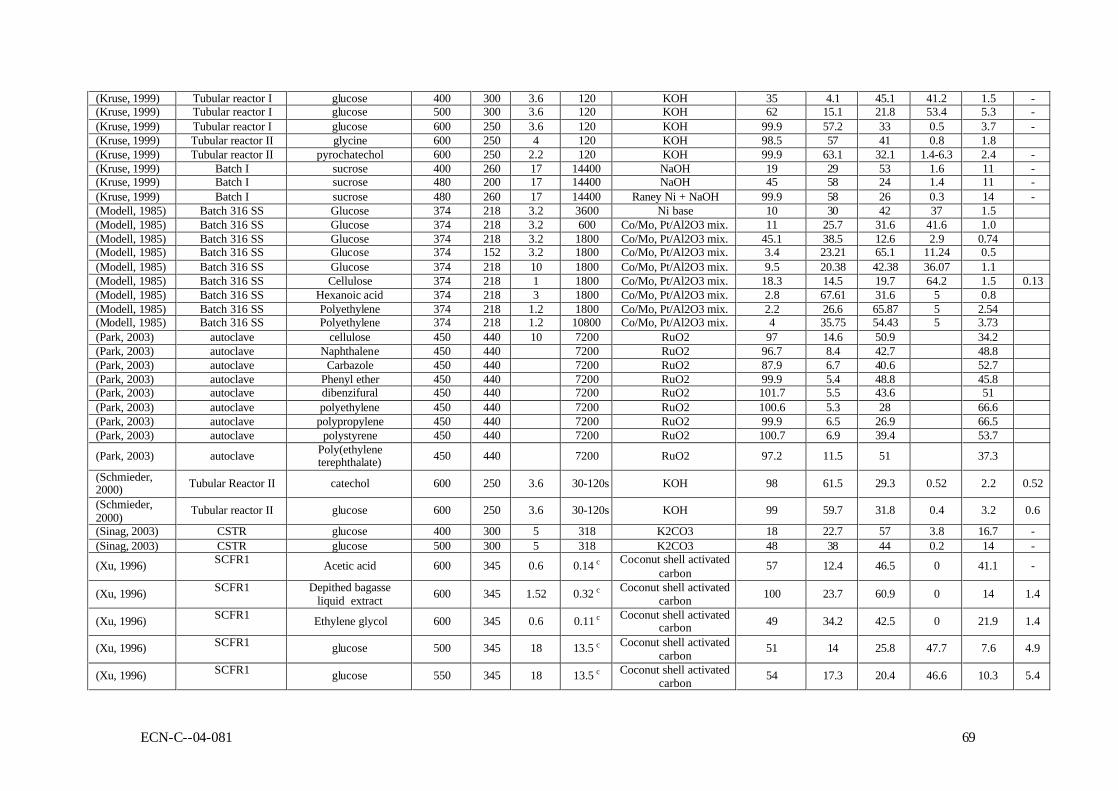
ECN-C--04-081 69
(Kruse, 1999) Tubular reactor I glucose 400 300 3.6 120 KOH 35 4.1 45.1 41.2 1.5 - (Kruse, 1999) Tubular reactor I glucose 500 300 3.6 120 KOH 62 15.1 21.8 53.4 5.3 - (Kruse, 1999) Tubular reactor I glucose 600 250 3.6 120 KOH 99.9 57.2 33 0.5 3.7 - (Kruse, 1999) Tubular reactor II glycine 600 250 4 120 KOH 98.5 57 41 0.8 1.8 (Kruse, 1999) Tubular reactor II pyrochatechol 600 250 2.2 120 KOH 99.9 63.1 32.1 1.4-6.3 2.4 - (Kruse, 1999) Batch I sucrose 400 260 17 14400 NaOH 19 29 53 1.6 11 - (Kruse, 1999) Batch I sucrose 480 200 17 14400 NaOH 45 58 24 1.4 11 - (Kruse, 1999) Batch I sucrose 480 260 17 14400 Raney Ni + NaOH 99.9 58 26 0.3 14 - (Modell, 1985) Batch 316 SS Glucose 374 218 3.2 3600 Ni base 10 30 42 37 1.5 (Modell, 1985) Batch 316 SS Glucose 374 218 3.2 600 Co/Mo, Pt/Al2O3 mix. 11 25.7 31.6 41.6 1.0 (Modell, 1985) Batch 316 SS Glucose 374 218 3.2 1800 Co/Mo, Pt/Al2O3 mix. 45.1 38.5 12.6 2.9 0.74 (Modell, 1985) Batch 316 SS Glucose 374 152 3.2 1800 Co/Mo, Pt/Al2O3 mix. 3.4 23.21 65.1 11.24 0.5 (Modell, 1985) Batch 316 SS Glucose 374 218 10 1800 Co/Mo, Pt/Al2O3 mix. 9.5 20.38 42.38 36.07 1.1 (Modell, 1985) Batch 316 SS Cellulose 374 218 1 1800 Co/Mo, Pt/Al2O3 mix. 18.3 14.5 19.7 64.2 1.5 0.13 (Modell, 1985) Batch 316 SS Hexanoic acid 374 218 3 1800 Co/Mo, Pt/Al2O3 mix. 2.8 67.61 31.6 5 0.8 (Modell, 1985) Batch 316 SS Polyethylene 374 218 1.2 1800 Co/Mo, Pt/Al2O3 mix. 2.2 26.6 65.87 5 2.54 (Modell, 1985) Batch 316 SS Polyethylene 374 218 1.2 10800 Co/Mo, Pt/Al2O3 mix. 4 35.75 54.43 5 3.73 (Park, 2003) autoclave cellulose 450 440 10 7200 RuO2 97 14.6 50.9 34.2 (Park, 2003) autoclave Naphthalene 450 440 7200 RuO2 96.7 8.4 42.7 48.8 (Park, 2003) autoclave Carbazole 450 440 7200 RuO2 87.9 6.7 40.6 52.7 (Park, 2003) autoclave Phenyl ether 450 440 7200 RuO2 99.9 5.4 48.8 45.8 (Park, 2003) autoclave dibenzifural 450 440 7200 RuO2 101.7 5.5 43.6 51 (Park, 2003) autoclave polyethylene 450 440 7200 RuO2 100.6 5.3 28 66.6 (Park, 2003) autoclave polypropylene 450 440 7200 RuO2 99.9 6.5 26.9 66.5 (Park, 2003) autoclave polystyrene 450 440 7200 RuO2 100.7 6.9 39.4 53.7
(Park, 2003) autoclave Poly(ethylene terephthalate) 450 440 7200 RuO2 97.2 11.5 51 37.3
(Schmieder, 2000) Tubular Reactor II catechol 600 250 3.6 30-120s KOH 98 61.5 29.3 0.52 2.2 0.52
(Schmieder, 2000) Tubular reactor II glucose 600 250 3.6 30-120s KOH 99 59.7 31.8 0.4 3.2 0.6
(Sinag, 2003) CSTR glucose 400 300 5 318 K2CO3 18 22.7 57 3.8 16.7 - (Sinag, 2003) CSTR glucose 500 300 5 318 K2CO3 48 38 44 0.2 14 -
(Xu, 1996) SCFR1 Acetic acid 600 345 0.6 0.14 c Coconut shell activated carbon 57 12.4 46.5 0 41.1 -
(Xu, 1996) SCFR1 Depithed bagasse liquid extract 600 345 1.52 0.32 c Coconut shell activated
carbon 100 23.7 60.9 0 14 1.4
(Xu, 1996) SCFR1 Ethylene glycol 600 345 0.6 0.11 c Coconut shell activated carbon 49 34.2 42.5 0 21.9 1.4
(Xu, 1996) SCFR1 glucose 500 345 18 13.5 c Coconut shell activated carbon 51 14 25.8 47.7 7.6 4.9
(Xu, 1996) SCFR1 glucose 550 345 18 13.5 c Coconut shell activated carbon 54 17.3 20.4 46.6 10.3 5.4

70 ECN-C--04-081
(Xu, 1996) SCFR1 glucose 600 345 18 13.5 c Coconut shell activated carbon 98 26.7 21 35 12.2 5.1
(Xu, 1996) SCFR1 glucose 600 345 22 16 c Coconut shell activated carbon 99 28.1 24.1 30.3 13.2 4.3
(Xu, 1996) SCFR1 glucose 600 255 22 16.1 c Coconut shell activated carbon 99 24.2 18.6 39.5 12.5 5.2
(Xu, 1996) SCFR1 glucose 600 345 22 22.2 c Coconut shell activated carbon 103 28.6 39.5 10 15.7 6.2
(Xu, 1996) SCFR1 glycerol 600 345 18.4 4.36 c Coconut shell activated carbon 99 51.7 31.2 2.3 14.1 0.7
(Xu, 1996) SCFR1 glycerol 600 345 18.4 44 c Coconut shell activated carbon 101 54.3 29.2 2 13.4 1.1
(Xu, 1996) SCFR1 methanol 600 345 3.2 0.54 c Coconut shell activated carbon 78 72.4 24.8 1.4 1.4 -
(Xu, 1996) SCFR1 Methyl ethyl ketone 600 345 0.7 0.14 c Coconut shell activated carbon 62 22 51.1 0 24.3 2.6
(Xu, 1996) SCFR1 Sewage sludge 600 345 2.8 0.5 c Coconut shell activated carbon 100 36 49.2 3.6 2.1 9.1
(Xu, 1998) SCFR3 Corn starch 650 280 10.4 16452# Coconut shell activated carbon 102 39 42 1 19 -
(Xu, 1998) SCFR3 Poplar wood sawdust/corn starch 650 280 15.6 5472# Coconut shell activated
carbon 98 57 33 4 6 -
(Xu, 1998) SCFR3 Sewage sladge/corn starch 650 280 7.2 6768# Coconut shell activated
carbon 99 42 39 1 17 -
(Elliott, 1994) FBCTR-Bench scale (BS) phenol 350 210 2 Ru/Al2O3 100.2 1.2 42 - 54 1.5
(Vogel, 2002) Batch reactor Wood sawdust 375 320 20 Ni/•Al2O3 14 14 78 - 8 - (Vogel, 2002) Batch reactor Wood sawdust 423 317 10.9 Ni/•Al2O3 23 30 61 - 9 - (Vogel, 2002) Batch reactor Wood sawdust 402 327 10 Raney Ni 2800 77 26 45 - 29 - (Vogel, 2002) Batch reactor Wood sawdust 410 323 10 Raney Ni 2800 78 34 44 - 23 - (Vogel, 2002) Batch reactor Wood sawdust 409 324 9.9 Raney Ni 2800 80 33 43 - 23.5 - (Vogel, 2002) Batch reactor Wood sawdust 413 320 19.9 Raney Ni 2800 78 21 45 - 34 - (Vogel, 2002) Batch reactor Wood sawdust 405 321 29.9 Raney Ni 2800 75 18 46 - 36 - (Vogel, 2002) Batch reactor Wood sawdust 348 325 29.9 Raney Ni 2800 74 4.5 51 - 44.5 -
# time on stream c WHSV=CoV/W(Co-reactant concentration, V-volumetric flow rate of the feed,W-weight of the catalyst)

ECN-C--04-081 71