manureecomine · manureecomine green fertilizer upcycling from manure: technological, economic and...
TRANSCRIPT

ManureEcoMine
Green fertilizer upcycling from manure: Technological,
economic and environmental sustainability demonstration
Grant agreement no. 603744
Deliverable 4.2: Demonstrative operation ES:
Performance of the pilot including trace
contaminants, with comparison to the NL
demonstration results
Work Package WP4
Technological optimization of the pilot plant
Task
4.2. Demonstrative operation ES: Performance of the pilot
including trace contaminants with comparison to the NL
demonstration results
Due Date 31/10/2016
Date Delivered 30/10/2016
Prepared by
(Lead Partner) Ahidra
Other partners involved UGent, UdG, USC, Colsen, Balsa
Dissemination Level PU

ManureEcoMine: Green fertilizer upcycling from manure: Technological, economic and environmental sustainability demonstration (ENV.2013.6.3-2/603744) – Grant agreement no. 603744
2
Deliverable 4.2. Demonstrative operation ES: Performance of the pilot including trace contaminants
with comparison to the NL demonstration results
Summary
Along the present deliverable, the ManureEcoMine pilot plant operation in Spain under steady state
condition is presented, covering the period from May 2016 to September 2016.
After an intense optimization phase done during WP3 and presented in deliverable 3.3, the steady
state operation of the pilot plant in Spain aimed to carry out a technical demonstration at longer term
while working at the most optimum operational conditions for all the units. The objective behind this
was to demonstrate the stability of the data and of the products obtained.
The digester was tested at long term operating at an OLR of 3 g COD/L·d. Two steady state periods
were considered: (1) transforming the digestate into permeate with an acidification step to maximize
P recovery; (2) transforming digestate into centrate to generate struvite without membranes and
without the acidification step.
It was possible to confirm, at long term, the results that had already been observed along the
optimization stage. The obtained product in the struvite unit was analysed through X-ray diffraction
by the partner Lequia, in order to identify the precipitated compounds. Results indicated that the main
product detected was struvite. It was also proved that generating struvite from centrate was possible
but lower efficiencies were obtained.
The biological nitrogen reactor did not run under steady state due to design issues linked to the
inefficient oxygen mass transfer. Results from this reactor were presented in deliverable 3.3.
Deliverable 4.1 describes the steady state operation in NL, information needed to make a final
comparison between the ES and NL data.
ManureEcoMine: Green fertilizer upcycling from manure: Technological, economic and environmental sustainability demonstration (ENV.2013.6.3-2/603744) – Grant agreement no. 603744
3
Deliverable 4.2. Demonstrative operation ES: Performance of the pilot including trace contaminants
with comparison to the NL demonstration results
Summary
1. INTRODUCTION ........................................................................................................................................ 4
2. PILOT OPERATION .................................................................................................................................... 4
2.1. PROCESS OVERVIEW .................................................................................................................................... 4
3. MATERIALS AND METHODS...................................................................................................................... 6
4. RESULTS AND DISCUSSION ....................................................................................................................... 6
4.1. DEMONSTRATION STAGE OF MESOPHILIC DIGESTION........................................................................................... 7
4.2. DEMONSTRATION STAGE OF SOLID/LIQUID SEPARATION AFTER DIGESTION .......................................................... 21
4.3. DEMONSTRATION STAGE OF ULTRAFILTRATION MEMBRANES ............................................................................ 31
4.4. DEMONSTRATION STAGE OF PHOSPHORUS RECOVERY THROUGH STRUVITE PRECIPITATION ..................................... 48
4.5. DEMONSTRATION STAGE OF NITROGEN REMOVAL THROUGH A BIOLOGICAL PROCESS............................................... 54
5. OVERALL MASS BALANCES ..................................................................................................................... 55
6. CONCLUSIONS ........................................................................................................................................ 58
7. FINAL REMARKS OPTIMIZATION OF PILOT PLANT NL VS. ES SCENARIO .................................................. 60
8. COMPARISON OF TRACE CONTAMINATION AND MIGRATION AT THE PILOT PLANT IN THE
NETHERLANDS AND IN SPAIN ......................................................................................................................... 63
8.1. ANTIBIOTICS ............................................................................................................................................ 63
8.2. HEAVY METALS ......................................................................................................................................... 66
8.3. MYCOTOXINS ........................................................................................................................................... 69
8.4. PESTICIDES AND DISINFECTANTS .................................................................................................................. 71
9. REFERENCES ........................................................................................................................................... 75
ManureEcoMine: Green fertilizer upcycling from manure: Technological, economic and environmental sustainability demonstration (ENV.2013.6.3-2/603744) – Grant agreement no. 603744
4
Deliverable 4.2. Demonstrative operation ES: Performance of the pilot including trace
contaminants with comparison to the NL demonstration results
1. INTRODUCTION
IN this report, the ManureEcoMine (MEM) pilot plant operation in Spain under steady state is
discussed, covering the period from May 2016 to September 2016.
Samples for trace contaminants were taken from the pilot plant and analysed at the LVA, the results
are discussed in section 8 of this report.
Samples of struvite were also collected and analysed by Greenyard Horticulture Belgium (former
Peltracom) and FZJ. The results are discussed and available in deliverables 6.1 and 6.2. Additionally,
struvite samples were sent to Lequia to be analysed by X-Ray Diffraction, the results are presented
along this report.
By the end of the project, data were thoroughly analysed and revised by Ahidra and USC in order to
close the mass balance for the MEM schemes. Results are presented in this report.
2. PILOT OPERATION
2.1. Process overview
In the following subsections, the processes of the anaerobic digestion, decanter centrifuge, membrane
unit and struvite precipitation under steady state conditions are further elaborated upon. During the
Spanish operation, there were two steady state periods. The first period, presented in Figure 1,
consisted on the following steps:
Mesophilic anaerobic digestion
Acidification of digestate
Centrifugation
Acidification of centrate
Ultrafiltration
Struvite precipitation

ManureEcoMine: Green fertilizer upcycling from manure: Technological, economic and environmental sustainability demonstration (ENV.2013.6.3-2/603744) – Grant agreement no. 603744
5
Deliverable 4.2. Demonstrative operation ES: Performance of the pilot including trace
contaminants with comparison to the NL demonstration results
Figure 1. Scenario 1 tested during the SP demo phase.
The second steady state period is depicted in Figure 2 and it consisted on:
Mesophilic anaerobic digestion
Centrifugation
Struvite precipitation

ManureEcoMine: Green fertilizer upcycling from manure: Technological, economic and environmental sustainability demonstration (ENV.2013.6.3-2/603744) – Grant agreement no. 603744
6
Deliverable 4.2. Demonstrative operation ES: Performance of the pilot including trace
contaminants with comparison to the NL demonstration results
Figure 2. Scenario 2 tested during the ES demo phase.
3. MATERIALS AND METHODS
In Deliverable 3.1 materials and methods were discussed for the operation of the digester, the
dewatering and stripping process units.
In Deliverable 3.3, information regarding sampling points and frequency was elaborated.
4. RESULTS AND DISCUSSION
The timeline displayed in Figure 3 describes the main periods during the pilot operation from
December 2015 until September 2016. The time allocated for the pilot operation in Spain was 10
months, starting from December 2015. The optimization period (WP3) was from December 2015 to
April 2016 (5 months), while the steady state operation was from May 2016 until September 2016 (5
months). The current report aims to summarize the findings during the steady state period.

ManureEcoMine: Green fertilizer upcycling from manure: Technological, economic and environmental sustainability demonstration (ENV.2013.6.3-2/603744) – Grant agreement no. 603744
7
Deliverable 4.2. Demonstrative operation ES: Performance of the pilot including trace
contaminants with comparison to the NL demonstration results
Figure 3. Timeline allocated in the DOW to the Spanish operation (optimization and demonstration phases).
4.1. Demonstration stage of mesophilic digestion
Figure 4 displays the timeline along the project, highlighting the theoretical and actual time needed
for optimization (WP3) and pilot demonstration (WP4) of the anaerobic digestion unit. There were two
steady state periods regarding substrates types, substrates quantities and organic loading rate. These
periods correspond to period 3 and 5 of Figure 4.
Figure 4. Timeline regarding optimization and stable operation of the anaerobic digester.
4.1.1. Digester operation under steady state
Feed mixture
Figure 5 depicts the feed proportions fed into the pilot digester. The area which is painted in grey
corresponds to the optimization phase and it has therefore been described along deliverable 3.3
(periods 1, 2, 3).

ManureEcoMine: Green fertilizer upcycling from manure: Technological, economic and environmental sustainability demonstration (ENV.2013.6.3-2/603744) – Grant agreement no. 603744
8
Deliverable 4.2. Demonstrative operation ES: Performance of the pilot including trace
contaminants with comparison to the NL demonstration results
Figure 5. Anaerobic digester feeding proportion
The period that defines the steady state feed mixture corresponds to period 4:
Period 4: from 2/03/2016 to 30/09/2016 (212 days)
As the feed optimization was done, the proportion of cow manure was increased and pig manure
decreased pursuing the maximization of the incoming nutrients into the system, while at the same
time testing the pilot to its maximum operational dry matter (DM) content. This led to the final and
optimised mixture of 52% cow manure, 43% pig manure and 5% segregates. The actual average feed
proportion during this period was 52.0% cow manure, 42.5% pig manure and 5.5% segregates.
Table 1 summarises the average feeding proportions together with the average flow rate fed during
period 4.
0
10
20
30
40
50
60
70
802
2-1
2-1
51
-1-1
61
1-1
-16
21
-1-1
63
1-1
-16
10
-2-1
62
0-2
-16
1-3
-16
11
-3-1
62
1-3
-16
31
-3-1
61
0-4
-16
20
-4-1
63
0-4
-16
10
-5-1
62
0-5
-16
30
-5-1
69
-6-1
61
9-6
-16
29
-6-1
69
-7-1
61
9-7
-16
29
-7-1
68
-8-1
61
8-8
-16
28
-8-1
67
-9-1
61
7-9
-16
27
-9-1
67
-10
-16
17
-10
-16
27
-10
-16
We
igh
t o
f su
bst
rate
s fe
d [
%]
Date
% Cow manure % Pig manure % Segregates

ManureEcoMine: Green fertilizer upcycling from manure: Technological, economic and environmental sustainability demonstration (ENV.2013.6.3-2/603744) – Grant agreement no. 603744
9
Deliverable 4.2. Demonstrative operation ES: Performance of the pilot including trace
contaminants with comparison to the NL demonstration results
Table 1. Average anaerobic digester feeding proportions of the different substrates and average influent feed flow during
demonstration stage.
Average Units Period 4
Cow manure % 51,99
Pig manure % 42,54
Segregates % 5,47
Total feed kg/day 125,0
Individual composition at long term was discussed in deliverable 3.3, and it is presented again in Table
2. The estimated values of the overall feed mixture during steady state are presented in Table 3.

ManureEcoMine: Green fertilizer upcycling from manure: Technological, economic and environmental sustainability demonstration (ENV.2013.6.3-2/603744) – Grant agreement no. 603744
10
Deliverable 4.2. Demonstrative operation ES: Performance of the pilot including trace
contaminants with comparison to the NL demonstration results
Table 2. Long term substrates average
Cow manure Pig manure Buffer Tank 1 Segregates
Average
±
stdev Average
±
stdev Average
±
stdev Average
±
stdev
pH - 7.24 0.15 7.95 0.10 7.54 0.49 3.04 0.09
DM g/kg 131 30 40 20 73 14 92 45
ODM g/kg 110 30 27 16 57 12 87 42
tCOD g/kg *90 13 *28 13 *59 12 154 31
TN mg/L 4.731 878 3.800 713 4.500 840 702 293
N-NH4+ mg/L 1.943 496 2.293 255 2.090 262 60 148
TP mg/L 907 98 798 448 827 223 1.5 0.4
P-PO43- mg/L 588 99 733 408 631 214 1.0 0.3
K+ mg/L 1.172 497 1.964 305 1.990 571 n.d -
Cl- mg/L 2.824 386 1.806 410 2.427 215 93 34
Conductivity mS/cm 12.8 3.1 14.0 1.9 15.7 1.,4 1.3 0.1
Recalculated
tCOD
g/kg 198 - 34 - 75 -
DM: dry matter; ODM: organic dry matter; tCOD: total chemical oxygen demand; TN: total nitrogen; N-NH4+: ammonium
nitrogen; TP: total phosphorus; P-PO43-: orthophosphates; K+: potassium; Cl-: chlorine.

ManureEcoMine: Green fertilizer upcycling from manure: Technological, economic and environmental sustainability demonstration (ENV.2013.6.3-2/603744) – Grant agreement no. 603744
11
Deliverable 4.2. Demonstrative operation ES: Performance of the pilot including trace
contaminants with comparison to the NL demonstration results
Table 3. Overall digester feed mixture composition (52% cow, 43% pig, 5% segregates) calculated from raw data BT1 and BT2
Average ± stdev
pH - 7.31 0.76
DM g/kg 73.8 8
ODM g/kg 58.7 7
tCOD g/kg 79.3 7
TN mg/l 4.310 34
N-NH4+ mg/l 1.988 20
TP mg/l 785 15
P-PO43- mg/l 600 15
K+ mg/l 1.890 24
Cl- mg/l 2.310 16
Conductivity mS/cm 14,93 1,25
Temperature and pH
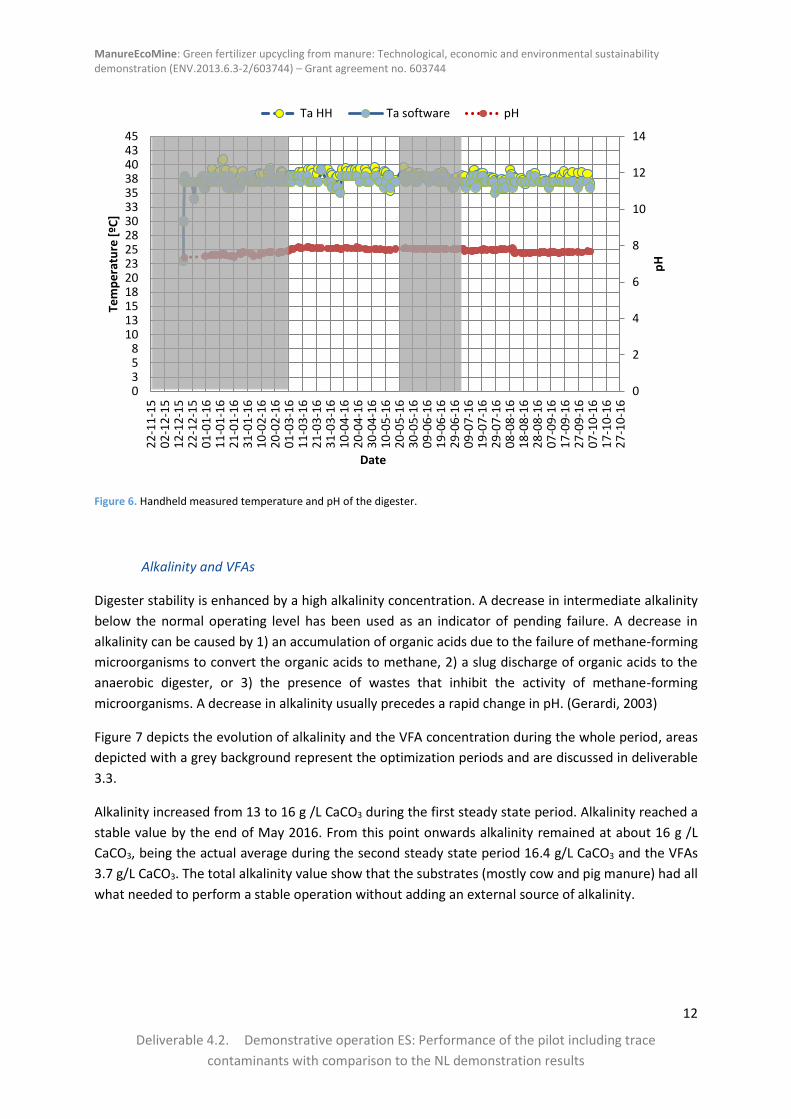
Figure 6 depicts the temperature (recorded by the software and measured externally or hand held, hh)
and pH externally measured at the pilot digester. The area depicted with a grey background
corresponds to the optimization stage and it is therefore discussed along deliverable 3.3.
The temperature manually recorded in the pilot digester during the two steady state periods was in
the range 38-38.5°C. During the first steady state the average temperature was 38.5 ºC while during
the second steady state period it was 37.9 ºC. There were no major temperature variations along the
operation in Spain.
The pilot average pH was 7.8 for the two steady state periods, which was a very stable pH also due to
the stability of alkalinity. This pH value may seem out of the typical stable values, however low-rate
reactors treating animal waste or protein-rich waste often have a stable pH above 7.5-8.0 because of
the high ammonia content (Pind).
The operation of the digester in Spain was characterised by a stationary process, which was achieved
by a slow, step-wise start up, described along deliverable 3.3. As it is possible to see there were no
fluctuations in pH or temperature, being both very stable along the whole operation.
ManureEcoMine: Green fertilizer upcycling from manure: Technological, economic and environmental sustainability demonstration (ENV.2013.6.3-2/603744) – Grant agreement no. 603744
12
Deliverable 4.2. Demonstrative operation ES: Performance of the pilot including trace
contaminants with comparison to the NL demonstration results
Figure 6. Handheld measured temperature and pH of the digester.
Alkalinity and VFAs
Digester stability is enhanced by a high alkalinity concentration. A decrease in intermediate alkalinity
below the normal operating level has been used as an indicator of pending failure. A decrease in
alkalinity can be caused by 1) an accumulation of organic acids due to the failure of methane-forming
microorganisms to convert the organic acids to methane, 2) a slug discharge of organic acids to the
anaerobic digester, or 3) the presence of wastes that inhibit the activity of methane-forming
microorganisms. A decrease in alkalinity usually precedes a rapid change in pH. (Gerardi, 2003)
Figure 7 depicts the evolution of alkalinity and the VFA concentration during the whole period, areas
depicted with a grey background represent the optimization periods and are discussed in deliverable
3.3.
Alkalinity increased from 13 to 16 g /L CaCO3 during the first steady state period. Alkalinity reached a
stable value by the end of May 2016. From this point onwards alkalinity remained at about 16 g /L
CaCO3, being the actual average during the second steady state period 16.4 g/L CaCO3 and the VFAs
3.7 g/L CaCO3. The total alkalinity value show that the substrates (mostly cow and pig manure) had all
what needed to perform a stable operation without adding an external source of alkalinity.
0
2
4
6
8
10
12
14
0358
101315182023252830333538404345
22
-11
-15
02
-12
-15
12
-12
-15
22
-12
-15
01
-01
-16
11
-01
-16
21
-01
-16
31
-01
-16
10
-02
-16
20
-02
-16
01
-03
-16
11
-03
-16
21
-03
-16
31
-03
-16
10
-04
-16
20
-04
-16
30
-04
-16
10
-05
-16
20
-05
-16
30
-05
-16
09
-06
-16
19
-06
-16
29
-06
-16
09
-07
-16
19
-07
-16
29
-07
-16
08
-08
-16
18
-08
-16
28
-08
-16
07
-09
-16
17
-09
-16
27
-09
-16
07
-10
-16
17
-10
-16
27
-10
-16
pH
Tem
pe
ratu
re [
ºC]
Date
Ta HH Ta software pH

ManureEcoMine: Green fertilizer upcycling from manure: Technological, economic and environmental sustainability demonstration (ENV.2013.6.3-2/603744) – Grant agreement no. 603744
13
Deliverable 4.2. Demonstrative operation ES: Performance of the pilot including trace
contaminants with comparison to the NL demonstration results
Figure 7. Anaerobic digester total, partial alkalinity and estimation of VFA
Additionally, specific composition of volatile fatty acids along the whole period was analysed by the
partner Lequia. Results, see table 4, indicated that only acetic acid was present in the VFAs composition
and only on one occasion valeric acid was detected however this was not consistent with previous or
subsequent samples. The average VFA concentration was 236.5 mg/L, considering that most of the
time only acetic acid was present (molecular weight 60.05 mg/meq), this corresponds to an average
composition of 3.94 meq/L and equals to 0.20 g/L CaCO3. From the daily alkalinity data (analysed
through an acid titration), this concentration appeared to be higher; however the values were within
acceptable ranges.
0
0.05
0.1
0.15
0.2
0.25
0.3
0.35
0
2
4
6
8
10
12
14
16
18
22
-11
-15
02
-12
-15
12
-12
-15
22
-12
-15
01
-01
-16
11
-01
-16
21
-01
-16
31
-01
-16
10
-02
-16
20
-02
-16
01
-03
-16
11
-03
-16
21
-03
-16
31
-03
-16
10
-04
-16
20
-04
-16
30
-04
-16
10
-05
-16
20
-05
-16
30
-05
-16
09
-06
-16
19
-06
-16
29
-06
-16
09
-07
-16
19
-07
-16
29
-07
-16
08
-08
-16
18
-08
-16
28
-08
-16
07
-09
-16
17
-09
-16
27
-09
-16
07
-10
-16
17
-10
-16
27
-10
-16
Rip
ley
Ind
ex
Alk
alin
ity
and
VFA
s [g
/l C
aCO
3]
Date
Total alkalinity Partial alkalinity VFA Ripley Index

ManureEcoMine: Green fertilizer upcycling from manure: Technological, economic and environmental sustainability demonstration (ENV.2013.6.3-2/603744) – Grant agreement no. 603744
14
Deliverable 4.2. Demonstrative operation ES: Performance of the pilot including trace
contaminants with comparison to the NL demonstration results
Table 4. Volatile fatty acids detected in the digestate samples
Sampling
date Volatile Fatty acids
Date Acetic Propionic Isobutiric Butiric Isovaleric Valeric
acid acid acid acid acid acid
09/02/2016 115.14 ± 20.98 n.d. n.d. n.d. n.d. n.d.
14/03/2016 53.72 ± 0.27 n.d. n.d. n.d. n.d. n.d.
29/03/2016 125.10 ± 42.92 n.d. n.d. n.d. n.d. n.d.
19/04/2016 252.19 ± 27.03 n.d. n.d. n.d. n.d. n.d.
26/04/2016 189.29 ± 10.57 n.d. n.d. n.d. n.d. n.d.
10/05/2016 1067.76 ± 174.48 45.37 ± 13.02 n.d. n.d. 10.08 n.d.
31/05/2016 214.58 n.d. n.d. n.d. n.d. n.d.
07/06/2016 365.05 ± 29.00 4.63 n.d. n.d. n.d. n.d.
21/06/2016 422.29 8.52 n.d. n.d. n.d. n.d.
12/07/2016 58.20 ± 0.91 n.d. n.d. n.d. n.d. n.d.
26/07/2016 200.61 5.61 n.d. n.d. n.d. 4.23
09/08/2016 82.98 n.d. n.d. n.d. n.d. n.d.
23/08/2016 90.30 n.d. n.d. n.d. n.d. n.d.
06/09/2016 61.68 n.d. n.d. n.d. n.d. n.d.
20/09/2016 392.10 48.06 n.d. n.d. n.d. n.d.
04/10/2016 92.94 n.d. n.d. n.d. n.d. n.d.
Mesophilic Anaerobic Digestion
OLR (organic loading rate), recorded GPR (gas production rate) and the expected GPR are displayed in
Figures 8 and 9. Data used to calculate the expected GPR was presented in deliverable 3.3.
Optimization periods are presented and discussed in deliverable 3.3 (periods 1, 2 and 4).
Operation of the digester consisted on two steady states (periods 3 and 5):
Period 3: from 1/3/16 to 13/05/16 (72 days)
ManureEcoMine: Green fertilizer upcycling from manure: Technological, economic and environmental sustainability demonstration (ENV.2013.6.3-2/603744) – Grant agreement no. 603744
15
Deliverable 4.2. Demonstrative operation ES: Performance of the pilot including trace
contaminants with comparison to the NL demonstration results
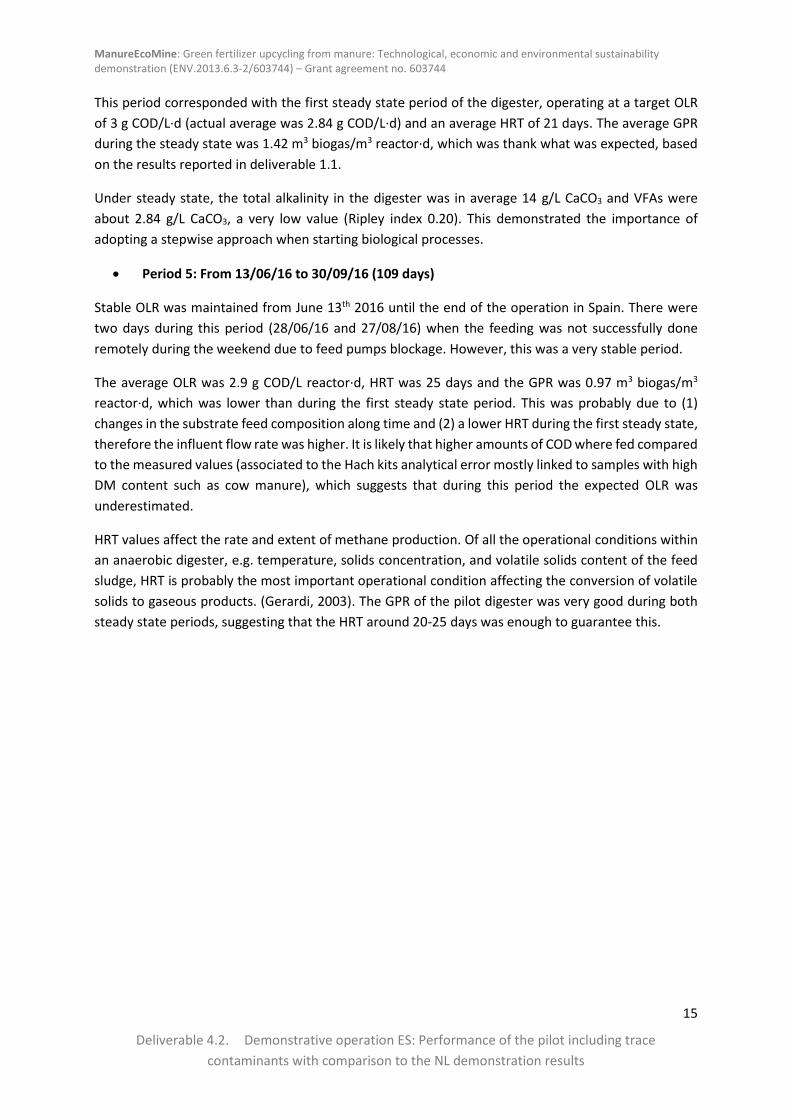
This period corresponded with the first steady state period of the digester, operating at a target OLR
of 3 g COD/L·d (actual average was 2.84 g COD/L·d) and an average HRT of 21 days. The average GPR
during the steady state was 1.42 m3 biogas/m3 reactor·d, which was thank what was expected, based
on the results reported in deliverable 1.1.
Under steady state, the total alkalinity in the digester was in average 14 g/L CaCO3 and VFAs were
about 2.84 g/L CaCO3, a very low value (Ripley index 0.20). This demonstrated the importance of
adopting a stepwise approach when starting biological processes.
Period 5: From 13/06/16 to 30/09/16 (109 days)
Stable OLR was maintained from June 13th 2016 until the end of the operation in Spain. There were
two days during this period (28/06/16 and 27/08/16) when the feeding was not successfully done
remotely during the weekend due to feed pumps blockage. However, this was a very stable period.
The average OLR was 2.9 g COD/L reactor·d, HRT was 25 days and the GPR was 0.97 m3 biogas/m3
reactor·d, which was lower than during the first steady state period. This was probably due to (1)
changes in the substrate feed composition along time and (2) a lower HRT during the first steady state,
therefore the influent flow rate was higher. It is likely that higher amounts of COD where fed compared
to the measured values (associated to the Hach kits analytical error mostly linked to samples with high
DM content such as cow manure), which suggests that during this period the expected OLR was
underestimated.
HRT values affect the rate and extent of methane production. Of all the operational conditions within
an anaerobic digester, e.g. temperature, solids concentration, and volatile solids content of the feed
sludge, HRT is probably the most important operational condition affecting the conversion of volatile
solids to gaseous products. (Gerardi, 2003). The GPR of the pilot digester was very good during both
steady state periods, suggesting that the HRT around 20-25 days was enough to guarantee this.

ManureEcoMine: Green fertilizer upcycling from manure: Technological, economic and environmental sustainability demonstration (ENV.2013.6.3-2/603744) – Grant agreement no. 603744
16
Deliverable 4.2. Demonstrative operation ES: Performance of the pilot including trace
contaminants with comparison to the NL demonstration results
Figure 8. Evolution of organic loading rate (OLR) and hydraulic residence time (HRT).
*OLR was calculated from the COD measured through Hach Lange kits. In deliverable 3.3it is demonstrated that these values
were underestimate due to kits error, reason why real OLR was higher than the values presented in this figure.
Figure 9. Evolution of gas production rate (GPR) and expected GPR production based on (1) deliverable 1.1.
0
20
40
60
80
100
120
140
0.000.250.500.751.001.251.501.752.002.252.502.753.003.253.503.75
22
-11
-15
02
-12
-15
12
-12
-15
22
-12
-15
01
-01
-16
11
-01
-16
21
-01
-16
31
-01
-16
10
-02
-16
20
-02
-16
01
-03
-16
11
-03
-16
21
-03
-16
31
-03
-16
10
-04
-16
20
-04
-16
30
-04
-16
10
-05
-16
20
-05
-16
30
-05
-16
09
-06
-16
19
-06
-16
29
-06
-16
09
-07
-16
19
-07
-16
29
-07
-16
08
-08
-16
18
-08
-16
28
-08
-16
07
-09
-16
17
-09
-16
27
-09
-16
07
-10
-16
17
-10
-16
27
-10
-16
HR
T [d
]
OLR
[g
CO
D/l
·d]
Date
OLR OLR target HRT
0
0.5
1
1.5
2
2.5
22
-11
-15
02
-12
-15
12
-12
-15
22
-12
-15
01
-01
-16
11
-01
-16
21
-01
-16
31
-01
-16
10
-02
-16
20
-02
-16
01
-03
-16
11
-03
-16
21
-03
-16
31
-03
-16
10
-04
-16
20
-04
-16
30
-04
-16
10
-05
-16
20
-05
-16
30
-05
-16
09
-06
-16
19
-06
-16
29
-06
-16
09
-07
-16
19
-07
-16
29
-07
-16
08
-08
-16
18
-08
-16
28
-08
-16
07
-09
-16
17
-09
-16
27
-09
-16
07
-10
-16
17
-10
-16
27
-10
-16
Bio
gas
[ N
m3
/m3
re
acto
r·d
]
Date
Biogas produced Biogas expected f(D1.1)

ManureEcoMine: Green fertilizer upcycling from manure: Technological, economic and environmental sustainability demonstration (ENV.2013.6.3-2/603744) – Grant agreement no. 603744
17
Deliverable 4.2. Demonstrative operation ES: Performance of the pilot including trace
contaminants with comparison to the NL demonstration results
The biogas composition was analysed by the partner Lequia through gas chromatography along the
operation. Results are displayed in Table 5, where it is possible to see that small amounts of oxygen
and nitrogen were detected due to the difficulty in sampling the biogas and storing it in a teddlar bag
to ship it to Lequia. However it is also possible to see that biogas methane composition was always
higher than 50%, in average it was 55% with values up to 65%.
Table 5. Biogas composition through gas chromatography
Biogas composition (%)
Date CH4 CO2 O2 N2
16/03/2016 54.42 ± 0.63 39.34 ± 0.41 1.37 ± 0.23 4.86 ± 0.81
30/03/2016 50.73 ± 0.07 44.64 ± 0.04 0.91 ± 0.02 3.73 ± 0.08
19/07/2016 65.28 ± 12.90 28.29 ± 7.98 2.28 7.63
16/08/2016 51.34 ± 0.14 32.51 ± 0.10 3.66 ± 0.05
12.49 ±
0.18
25/08/2016 56.17 ± 0.37 40.41 ± 0.32 0.78 ± 0.15 2.64 ± 0.54
10/10/2016 54.11 38.16 1.75 6.50
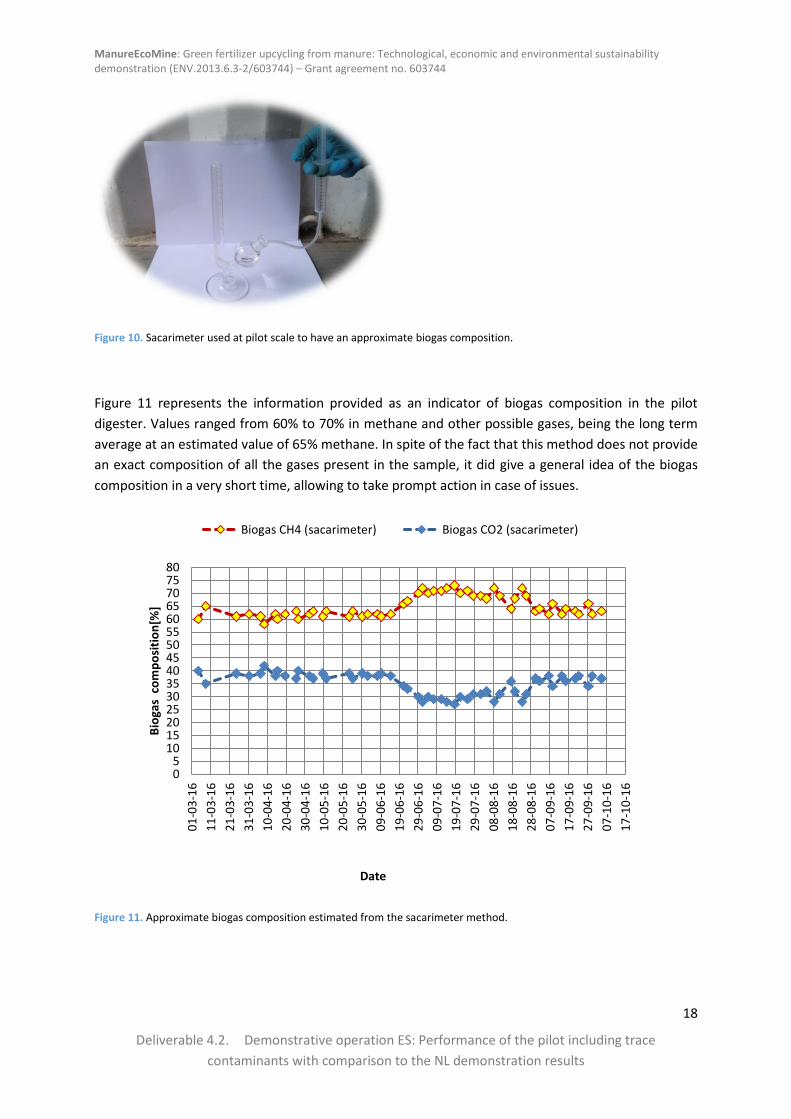
Additionally, the biogas was monitored from the pilot plant through a sacarimeter (Figure 10). This
method consists in taking a biogas sample of 100 mL and inject it in a 10 mL sacarimeter containing a
potassium hydroxide solution (at 25%). When the biogas enters the solution, CO2 reacts with KOH to
produce K2CO3 (aqueous), therefore the remaining gas volume is measured, giving an indication on the
biogas composition.
CO2(g) + KOH(aq) K
2CO
3(aq)+H
2O(l)
ManureEcoMine: Green fertilizer upcycling from manure: Technological, economic and environmental sustainability demonstration (ENV.2013.6.3-2/603744) – Grant agreement no. 603744
18
Deliverable 4.2. Demonstrative operation ES: Performance of the pilot including trace
contaminants with comparison to the NL demonstration results
Figure 10. Sacarimeter used at pilot scale to have an approximate biogas composition.
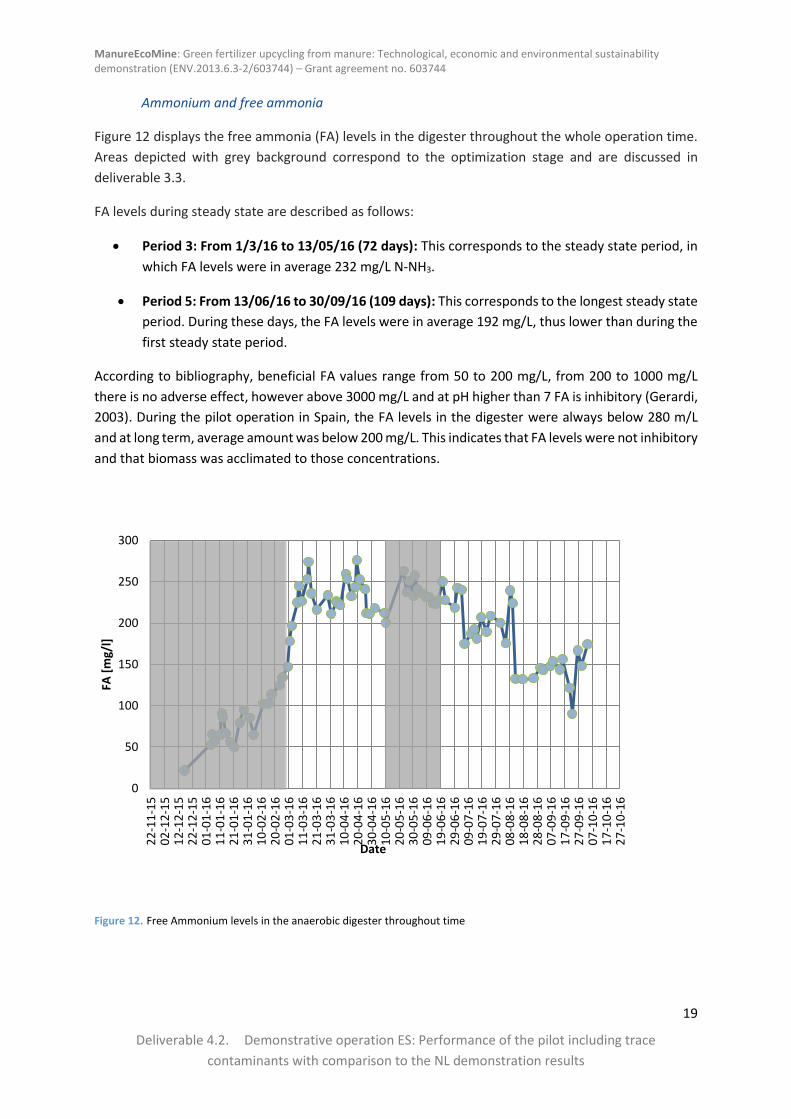
Figure 11 represents the information provided as an indicator of biogas composition in the pilot
digester. Values ranged from 60% to 70% in methane and other possible gases, being the long term
average at an estimated value of 65% methane. In spite of the fact that this method does not provide
an exact composition of all the gases present in the sample, it did give a general idea of the biogas
composition in a very short time, allowing to take prompt action in case of issues.
Figure 11. Approximate biogas composition estimated from the sacarimeter method.
05
101520253035404550556065707580
01
-03
-16
11
-03
-16
21
-03
-16
31
-03
-16
10
-04
-16
20
-04
-16
30
-04
-16
10
-05
-16
20
-05
-16
30
-05
-16
09
-06
-16
19
-06
-16
29
-06
-16
09
-07
-16
19
-07
-16
29
-07
-16
08
-08
-16
18
-08
-16
28
-08
-16
07
-09
-16
17
-09
-16
27
-09
-16
07
-10
-16
17
-10
-16
Bio
gas
co
mp
osi
tio
n[%
]
Date
Biogas CH4 (sacarimeter) Biogas CO2 (sacarimeter)
ManureEcoMine: Green fertilizer upcycling from manure: Technological, economic and environmental sustainability demonstration (ENV.2013.6.3-2/603744) – Grant agreement no. 603744
19
Deliverable 4.2. Demonstrative operation ES: Performance of the pilot including trace
contaminants with comparison to the NL demonstration results
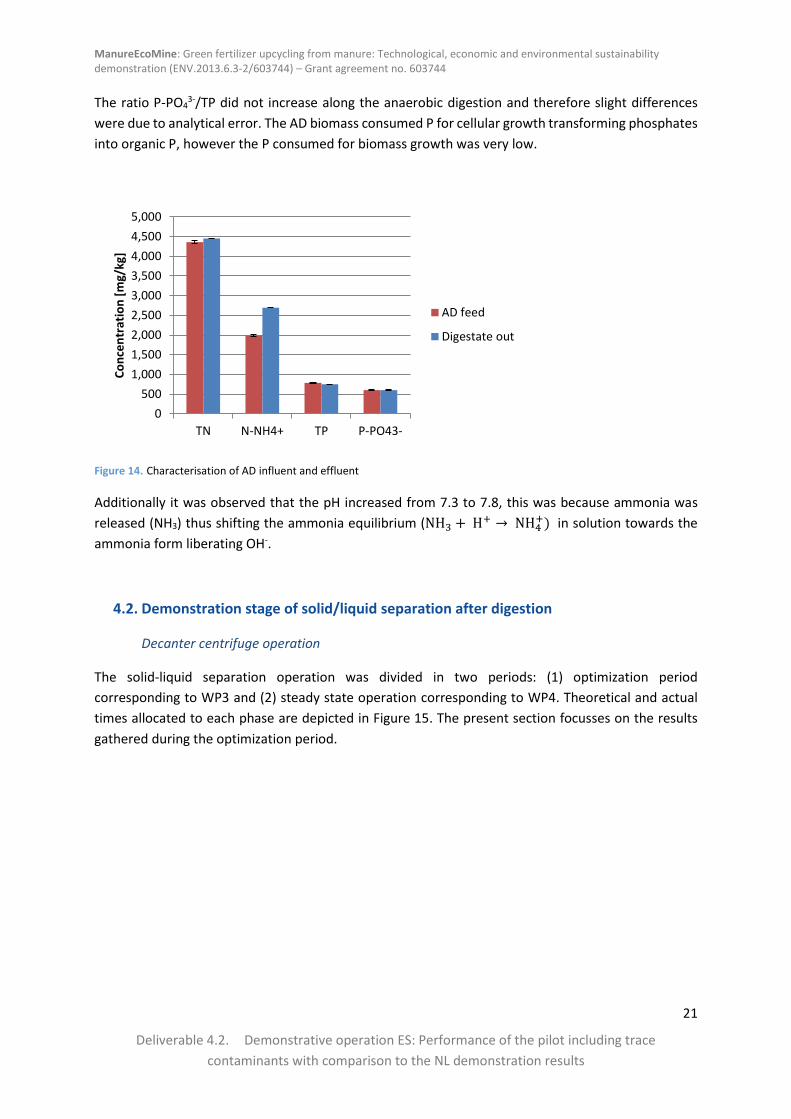
Ammonium and free ammonia
Figure 12 displays the free ammonia (FA) levels in the digester throughout the whole operation time.
Areas depicted with grey background correspond to the optimization stage and are discussed in
deliverable 3.3.
FA levels during steady state are described as follows:
Period 3: From 1/3/16 to 13/05/16 (72 days): This corresponds to the steady state period, in
which FA levels were in average 232 mg/L N-NH3.
Period 5: From 13/06/16 to 30/09/16 (109 days): This corresponds to the longest steady state
period. During these days, the FA levels were in average 192 mg/L, thus lower than during the
first steady state period.
According to bibliography, beneficial FA values range from 50 to 200 mg/L, from 200 to 1000 mg/L
there is no adverse effect, however above 3000 mg/L and at pH higher than 7 FA is inhibitory (Gerardi,
2003). During the pilot operation in Spain, the FA levels in the digester were always below 280 m/L
and at long term, average amount was below 200 mg/L. This indicates that FA levels were not inhibitory
and that biomass was acclimated to those concentrations.
Figure 12. Free Ammonium levels in the anaerobic digester throughout time
0
50
100
150
200
250
300
22
-11
-15
02
-12
-15
12
-12
-15
22
-12
-15
01
-01
-16
11
-01
-16
21
-01
-16
31
-01
-16
10
-02
-16
20
-02
-16
01
-03
-16
11
-03
-16
21
-03
-16
31
-03
-16
10
-04
-16
20
-04
-16
30
-04
-16
10
-05
-16
20
-05
-16
30
-05
-16
09
-06
-16
19
-06
-16
29
-06
-16
09
-07
-16
19
-07
-16
29
-07
-16
08
-08
-16
18
-08
-16
28
-08
-16
07
-09
-16
17
-09
-16
27
-09
-16
07
-10
-16
17
-10
-16
27
-10
-16
FA [
mg/
l]
Date

ManureEcoMine: Green fertilizer upcycling from manure: Technological, economic and environmental sustainability demonstration (ENV.2013.6.3-2/603744) – Grant agreement no. 603744
20
Deliverable 4.2. Demonstrative operation ES: Performance of the pilot including trace
contaminants with comparison to the NL demonstration results
Overall mass balance mesophilic AD
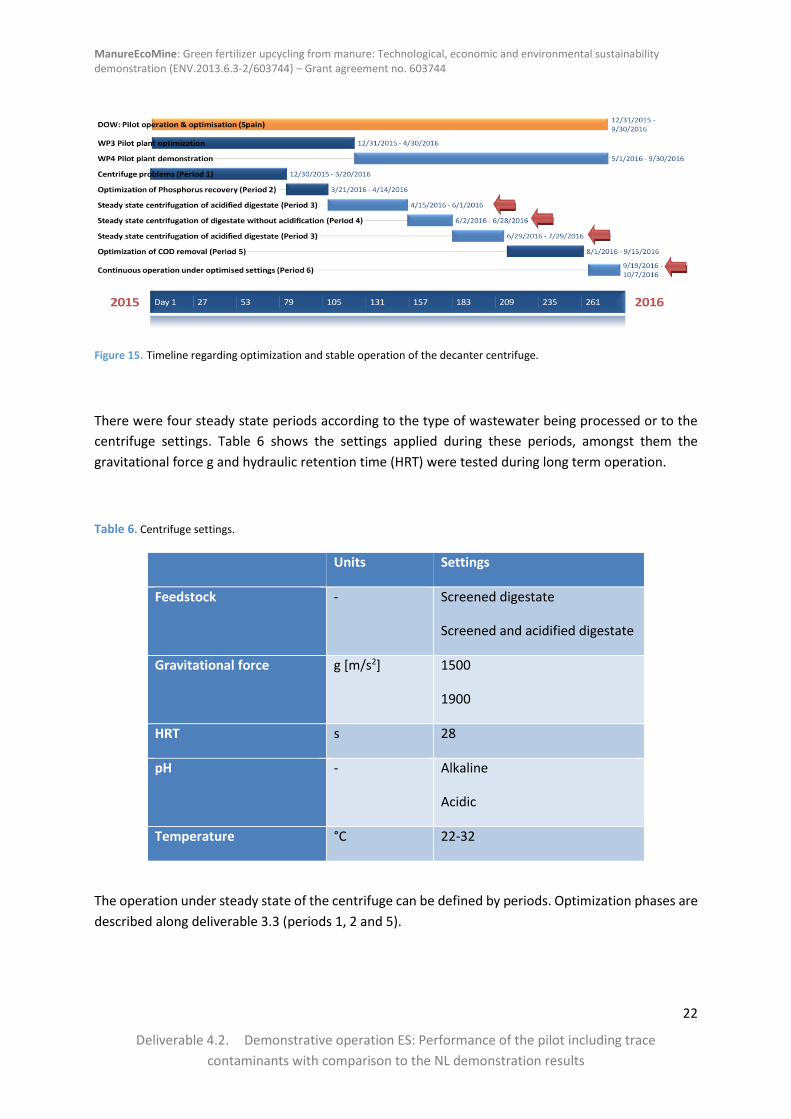
Figure 13 and 14 depict the anaerobic digestion (AD) long term feed composition and the digestate
composition as the result of an average between the two steady state periods. These figures depict
dry matter (DM), organic dry matter (ODM), chemical oxygen demand (COD), total nitrogen (TN),
ammonium nitrogen (N-NH4+), total phosphorus (TP) and orthophosphates (P-PO4
3-).
Although the theoretical OLR was 2.8 g COD/L·d (based on COD measured through Hach Lange kits),
the OLR estimated from the biogas production (2.7 m3/d with a methane composition of 60%) was 3.3
g COD/L·d.
From Figure 13, it is possible to see that the mesophilic anaerobic digestion removed 39% of ODM.
Inorganic compounds were not removed in the digester, therefore the decrease in DM was due to the
decrease in ODM. Considering the ratio COD/ODM before and after the digestion, if compounds were
removed in the same proportions, the ratio would remain stable. However by looking at the ratio
COD/ODM at the feed (1.35) and the digestate (1.18) it is possible to see that a decrease along the
process. For many types of organic waste, the oxidation state of carbon is close to zero (as for glucose)
and in these cases, the COD/VS ratio is close to 1. However, in more reduced compounds such as long-
chain fatty acids and lipids, the oxidation state of carbon is negative and the COD/VS ratio is
significantly higher than 1. This means that 1 g of lipids produce a higher COD wastewater than 1 g of
sugars (Angelidaki I, 2011).
Figure 13. Characterisation of AD influent and effluent
From Figure 14, it is possible to see that the percentage of N-NH4+ over TN increased from 46% (before
digestion) to 61% (after digestion). This matched the values found in bibliography where 10% and 4%
increases were found with pig manure under mesophilic conditions (S. Astals, 2012) and cow manure
under thermophilic conditions (Hamed M. El-Mashad, 2004) respectively.
0
10
20
30
40
50
60
70
80
90
100
DM ODM COD
Co
nce
ntr
atio
n [
g/kg
]
AD feed
Digestate out
ManureEcoMine: Green fertilizer upcycling from manure: Technological, economic and environmental sustainability demonstration (ENV.2013.6.3-2/603744) – Grant agreement no. 603744
21
Deliverable 4.2. Demonstrative operation ES: Performance of the pilot including trace
contaminants with comparison to the NL demonstration results
The ratio P-PO43-/TP did not increase along the anaerobic digestion and therefore slight differences
were due to analytical error. The AD biomass consumed P for cellular growth transforming phosphates
into organic P, however the P consumed for biomass growth was very low.
Figure 14. Characterisation of AD influent and effluent
Additionally it was observed that the pH increased from 7.3 to 7.8, this was because ammonia was
released (NH3) thus shifting the ammonia equilibrium (NH3 + H+ → NH4+) in solution towards the
ammonia form liberating OH-.
4.2. Demonstration stage of solid/liquid separation after digestion
Decanter centrifuge operation
The solid-liquid separation operation was divided in two periods: (1) optimization period
corresponding to WP3 and (2) steady state operation corresponding to WP4. Theoretical and actual
times allocated to each phase are depicted in Figure 15. The present section focusses on the results
gathered during the optimization period.
0
500
1,000
1,500
2,000
2,500
3,000
3,500
4,000
4,500
5,000
TN N-NH4+ TP P-PO43-
Co
nce
ntr
atio
n [
mg/
kg]
AD feed
Digestate out
ManureEcoMine: Green fertilizer upcycling from manure: Technological, economic and environmental sustainability demonstration (ENV.2013.6.3-2/603744) – Grant agreement no. 603744
22
Deliverable 4.2. Demonstrative operation ES: Performance of the pilot including trace
contaminants with comparison to the NL demonstration results
Figure 15. Timeline regarding optimization and stable operation of the decanter centrifuge.
There were four steady state periods according to the type of wastewater being processed or to the
centrifuge settings. Table 6 shows the settings applied during these periods, amongst them the
gravitational force g and hydraulic retention time (HRT) were tested during long term operation.
Table 6. Centrifuge settings.
Units Settings
Feedstock - Screened digestate
Screened and acidified digestate
Gravitational force g [m/s2] 1500
1900
HRT s 28
pH - Alkaline
Acidic
Temperature °C 22-32
The operation under steady state of the centrifuge can be defined by periods. Optimization phases are
described along deliverable 3.3 (periods 1, 2 and 5).
ManureEcoMine: Green fertilizer upcycling from manure: Technological, economic and environmental sustainability demonstration (ENV.2013.6.3-2/603744) – Grant agreement no. 603744
23
Deliverable 4.2. Demonstrative operation ES: Performance of the pilot including trace
contaminants with comparison to the NL demonstration results
Period 3: Steady state centrifugation of acidified digestate, from 15/04/16 to 29/07/16 (105
days)
This period is the result of operating the centrifuge under steady state with acidified screened
digestate. In overall, 36 batches account for the averages and standard deviations obtained during this
period.
The centrifuge was operated with the following settings: weir size 44, g force 1500, differential speed
12 rpm, and hydraulic residence time 28 seconds during all the period.
Digestate was manually sieved through a stainless steel mesh of 3.75 mm, during this process the
digestate cooled from 37ºC to about 36ºC, then it was manually acidified by adding sulphuric acid in
subsequent steps. The amount of acid added during this period was 0.026 g acid 40% w/w per gram of
digestate. To reduce the foam, the mixture was mixed with an industrial blender. Due to the high
amount of foam generated, the acidified digestate was left overnight and processed on the following
day, hence the centrifuge feed was normally at room temperature (in average 26 ºC).
On long term average, pH before acidification was 8.00 and after acidification 6.42. This means that
due to the increasing buffer capacity of the digestate, a higher amount of acid was added to reach a
pH between 4.5-5.0 which was the optimum value to recover P. For this reason, this periods was called
“partially acidified experiments”.
Figure 16 depicts the alkalinity of digestate, acidified digestate and centrate with associated standard
deviations. Alkalinity measures the buffering capacity of the water against changes in pH. Water that
has a high alkalinity can accept large doses of acids or bases without altering the pH significantly.
Waters with low alkalinity can experience a drop in the pH with only a minor addition of acid or base.
In natural waters most of alkalinity is provided by the carbonate/bicarbonate buffering system. Carbon
dioxide (CO2) dissolves in water to form carbonic acid (H2CO3), which dissociates and is in equilibrium
with bicarbonate (HCO3-) and carbonate (CO2
-3), according to equation (2) (Ruth F. Weiner, 2003).
𝐶𝑂2(𝑔𝑎𝑠) ↔ 𝐶𝑂2(𝑑𝑖𝑠𝑠𝑜𝑙𝑣𝑒𝑑) Equation (1)
𝐶𝑂2(𝑑𝑖𝑠𝑠𝑜𝑙𝑣𝑒𝑑) + 𝐻2𝑂 ↔ 𝐻+ + 𝐻𝐶𝑂3− ↔ 2𝐻+ + 𝐶𝑂3
2− Equation (2)
When acid sulphuric is added to the digestate, the hydrogen ion concentration is increased, and this
combines the carbonate and bicarbonate ions, driving the equilibrium to the left, releasing carbon
dioxide into the atmosphere. Only when all the carbonate and bicarbonate ions are depleted, the
addition of acid causes a drop in pH. For this reason, alkalinity was decreased by 80% after acidification,
passing from about 16 g/L CaCO3 to 3.6 g/L CaCO3. Additionally, alkalinity was further decreased in the
centrifuge to values of 2.7 g/L CaCO3, which matched the slight pH increase in the centrate (pH 6.65
and pH 8.18 when processing screened and acidified digestate, respectively). The reason for this might
be a higher carbonate removal.

ManureEcoMine: Green fertilizer upcycling from manure: Technological, economic and environmental sustainability demonstration (ENV.2013.6.3-2/603744) – Grant agreement no. 603744
24
Deliverable 4.2. Demonstrative operation ES: Performance of the pilot including trace
contaminants with comparison to the NL demonstration results
Figure 16. Average alkalinity results of screened digestate, acidified digestate and centrate during period 3 with standard
deviation associated.
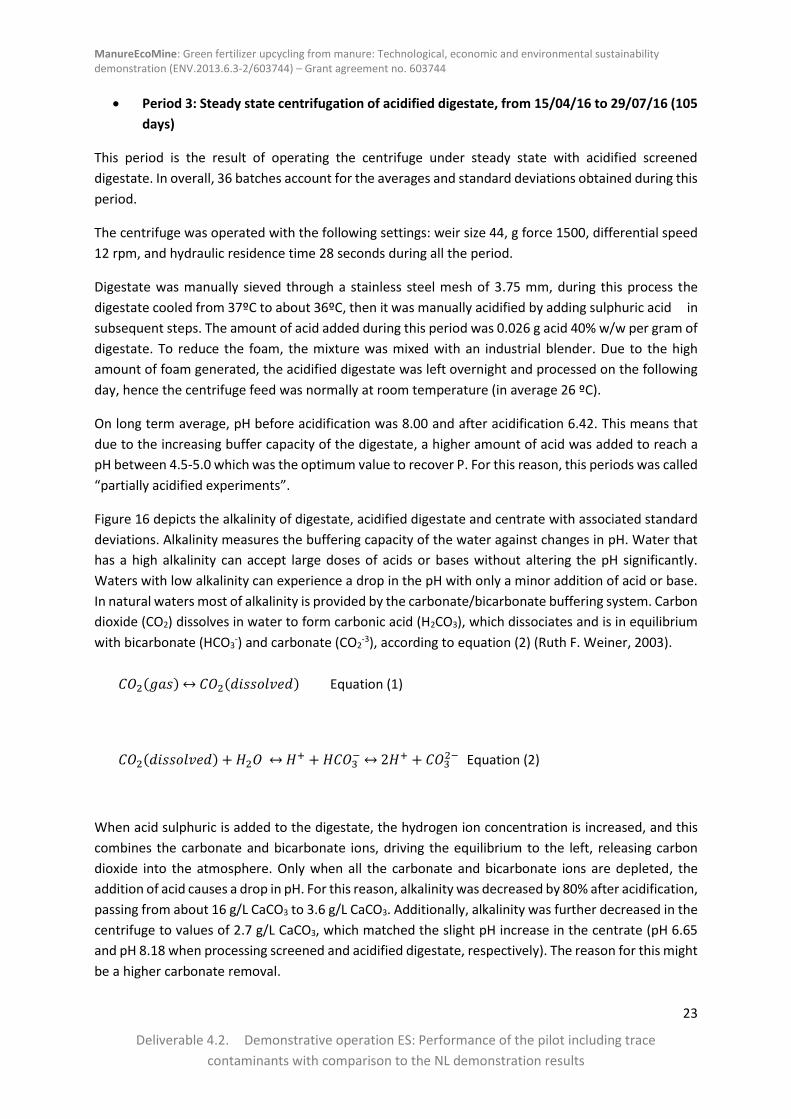
Figures 17 and 18 show the results for the acidification and centrifugation of acidified digestate. As it
is possible to see, with acidification of the digestate, only 30% of the incoming phosphorus
concentration was lost in the solid fraction, the rest was recovered in the centrate. During the
centrifuge optimization phase (period 2, deliverable 3.3), it was demonstrated that higher recovery of
P can be achieved by complete acidification of digestate to pH 4.5-5.0, however with the increasing
alkalinity of the anaerobic digester and the lack of an automatic acidification process it was difficult to
maintain these conditions at long term. Instead, a fixed amount of acid was identified (0.026 g acid/g
digestate) for enabling the daily operation at the pilot plant.
Acidification of digestate seemed to produce a false increase in DM and ODM (Figure 17). As explained
in deliverable 3.3, it is believed that without acidification, a small fraction of dry matter settles at the
bottom of the deposit. However, when acidification was done, the acid was added at the bottom of
this deposit by using a plastic pipe and a funnel. As a consequence, acid was introduced at the bottom,
where the CO2 production started and caused a re-suspension of the settled solids leading to an
apparent DM/ODM increase which was not real. It was hypnotised that the measured DM/ODM of the
digestate was slightly underestimated due to the lack of mixing in the centrifuge influent buffer tank
used during the acidification. For the overall mass balances presented at the end of this report,
acidification was considered to not generate DM and ODM increase.
Centrifugation of acidified digestate produced a significant retention of DM, ODM and COD (between
40-45%) in the solid fraction, very high total suspended solids (TSS) and volatile suspended solids (VSS)
removal (90%), little phosphorus losses (28-30%), low total nitrogen losses (12%) and negligible
ammonium losses (1%), which means that the ratio N-NH4+/TN was lower after centrifugation due to
TN losses. Therefore, a centrate with more DM, ODM and COD than when there is no acidification (see
following section) was obtained, but also significant higher fractions of P and practically no losses of
0
2,000
4,000
6,000
8,000
10,000
12,000
14,000
16,000
18,000
Screened digestate Acidified screeneddigestate
Centrate
Alk
alin
ity
[mg/
l CaC
O3
]
ManureEcoMine: Green fertilizer upcycling from manure: Technological, economic and environmental sustainability demonstration (ENV.2013.6.3-2/603744) – Grant agreement no. 603744
25
Deliverable 4.2. Demonstrative operation ES: Performance of the pilot including trace
contaminants with comparison to the NL demonstration results
ammonium. These results made acidification a promising technology to produce higher amounts of
struvite under controlled pH conditions.
Figure 17. DM, ODM, TSS, VSS and tCOD average results of pre-acidified digestate, acidified digestate (feed), centrate and
solid fraction during period 3, with associated standard deviations.
Figure 18. Chemical average results of pre-acidified digestate, acidified digestate (feed) and centrate during period 3 and
solid fraction, with associated standard deviations. Including Total Nitrogen (TN), Ammonium (N-NH4+), Total Phosphorus (TP)
and phosphates (P-PO43-).
Figure 19 shows the conductivity levels of digestate, acidified digestate and centrate. Conductivity of
acidified digestate (23.96 mS/cm) was slightly higher than the digestate one (19.83 mS/cm), which
0
50
100
150
200
250
DM ODM TSS VSS tCOD
Co
nce
ntr
atio
n [
g/kg
]
Pre-acidification
Feed
Centrate
Solid fraction
0
1,000
2,000
3,000
4,000
5,000
6,000
TN N-NH4+ TP P-PO43-
Co
nce
ntr
atio
n [
mg/
kg]
Pre-acidification
Feed
Centrate

ManureEcoMine: Green fertilizer upcycling from manure: Technological, economic and environmental sustainability demonstration (ENV.2013.6.3-2/603744) – Grant agreement no. 603744
26
Deliverable 4.2. Demonstrative operation ES: Performance of the pilot including trace
contaminants with comparison to the NL demonstration results
might be due to the dissolution of minerals caused by the pH decrease. The acidified slurry had higher
concentrations of dissolved inorganic compounds - compared to untreated slurry- with positive
impacts on its fertilizer value, namely phosphorus (Roboredo, 2012).
Figure 19. Conductivity average results of pre-acidified digestate, acidified digestate (feed) and centrate during period 3
Period 4: Steady state centrifugation of digestate without acidification, from 02/06/16 to
28/06/16 (26 days)
During this period, the centrifuge was operated with the following settings: weir size 44, g force 1500,
differential speed 12 rpm, and hydraulic residence time 28 seconds, which were the same settings
applied during periods 2 and 3, so it was possible to compare different experiments.
The digestate was manually sieved through a stainless steel mesh of 3.75 mm and then directly
processed through the centrifuge. Therefore, less temperature losses were experienced. The average
centrifuge feed temperature during this period was 30ºC and the centrate average temperature was
25ºC.
The pH was not corrected, therefore centrifuge feed had an average pH of 8.00 and the centrate pH
was in average slightly higher (8.2).
Results are presented in Figures 20 and 21. As it is possible to see, centrifugation of screened digestate
without acidification led to higher DM, ODM and COD removal efficiencies than when acidification was
implemented (see previous section), however it caused a phosphorus removal by up to 80% as P-PO43-
which was retained in the solid fraction and thus unavailable for struvite precipitation. Additionally,
ammonium losses of 9% (in average) were observed, suggesting that at high pH values ammonium
precipitation as struvite may take place during centrifugation. Ammonium is completely soluble, and
it is not expected to be removed by separation beyond its partition. Some ammonia was removed as
0
5
10
15
20
25
30
Screened digestate Acidified screeneddigestate
Centrate
Co
nd
uct
ivit
y [m
S/cm
]

ManureEcoMine: Green fertilizer upcycling from manure: Technological, economic and environmental sustainability demonstration (ENV.2013.6.3-2/603744) – Grant agreement no. 603744
27
Deliverable 4.2. Demonstrative operation ES: Performance of the pilot including trace
contaminants with comparison to the NL demonstration results
struvite in what is known as the MAP (magnesium–ammonia–phosphate) process, but the quantity
precipitated was modest compared to the large amounts of magnesium and phosphorous required
(Burton, 2007).
Figure 20. DM, ODM and tCOD results of screened digestate (centrifuge feed), centrate and solid fraction during period 4
TN and ammonium distribution are shown in Figure 21. Considering the N-NH4+/TN ratio, it increased
from 64% to 72% after centrifugation, however ammonium remained practically stable suggesting that
centrifugation of digestate removed a higher fraction of organic nitrogen.
Moreover, TN removal efficiency was very low (2%), however the centrate TN had a very high standard
deviation (about 30%), therefore the average was not representative. In this case, TN removal was not
significantly different from the scenario with acidification (where about 12% TN was removed).
Therefore for the overall mass balances (presented at the end of this report) the removal efficiency of
TN was adjusted according to normal values seen with digestate.
Figure 21. Average chemical results (TN, NH4+, TP and P-PO4
3-) of screened digestate (centrifuge feed) and centrate during
period 4
0
50
100
150
200
250
300
DM ODM tCOD
Co
nce
ntr
atio
n [
g/kg
]
Feed
Centrate
Solid fraction
0
1,000
2,000
3,000
4,000
5,000
6,000
TN N-NH4+ TP P-PO43-
Co
nce
ntr
atio
n [
mg/
kg]
Feed
Centrate

ManureEcoMine: Green fertilizer upcycling from manure: Technological, economic and environmental sustainability demonstration (ENV.2013.6.3-2/603744) – Grant agreement no. 603744
28
Deliverable 4.2. Demonstrative operation ES: Performance of the pilot including trace
contaminants with comparison to the NL demonstration results
Alkalinity is depicted in Figure 22, where it is possible to see that 25% alkalinity was lost during the
centrifugation process, suggesting some CO2 losses during centrifugation, also supported by a slight
pH increase.
Figure 22. Alkalinity of screened digestate (centrifuge feed) and centrate during period 4
Removal efficiencies for COD, DM and ODM obtained in NL were higher than in ES scenario with
acidification. For instance, DM removal was 60% and 47% in NL and ES, respectively. However the
removal efficiencies obtained in NL were with a HRT of 30 s while in ES the HRT was 25 s.
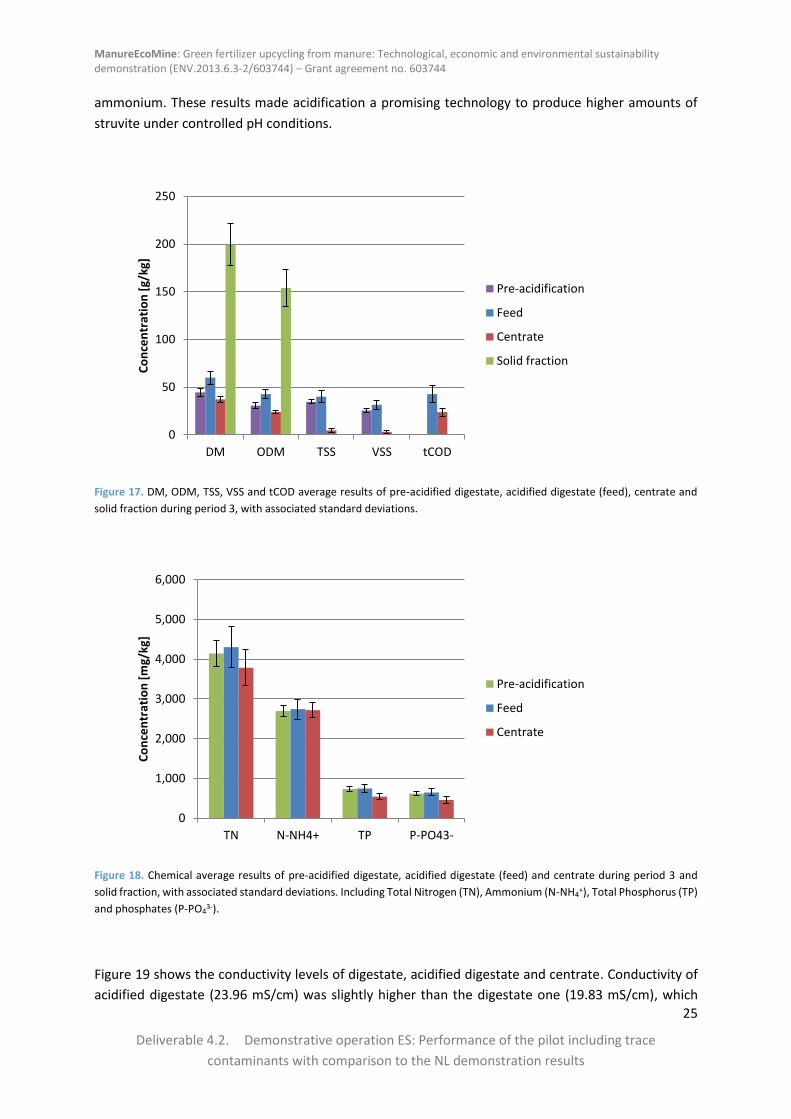
The comparison of periods 3 and 4 is presented in Figures 23, 24 and 25. Summarising the results,
acidification slightly worsened the solids removal efficiency but it treated higher amounts of solids. On
the other hand higher amounts of nutrients were recovered (N and P) with acidification of digestate.
0
500
1,000
1,500
2,000
2,500
3,000
3,500
4,000
Screened digestate Centrate
Alk
alin
ity
[mg/
l CaC
O3
]
ManureEcoMine: Green fertilizer upcycling from manure: Technological, economic and environmental sustainability demonstration (ENV.2013.6.3-2/603744) – Grant agreement no. 603744
29
Deliverable 4.2. Demonstrative operation ES: Performance of the pilot including trace
contaminants with comparison to the NL demonstration results
Figure 23. pH of centrifuge feed and centrate with/without acidification of digestate (periods 3 and 4).
Figure 24. Alkalinity of centrifuge feed and centrate with/without acidification of digestate (periods 3 and 4).
0
1
2
3
4
5
6
7
8
9
Screeneddigestate
Acidifiedscreeneddigestate
Centrate
pH
Acidification
Screened digestate
0
2,000
4,000
6,000
8,000
10,000
12,000
14,000
16,000
18,000
Screened digestate Acidified screeneddigestate
Centrate
Alk
alin
ity
[mg/
l CaC
O3
]

ManureEcoMine: Green fertilizer upcycling from manure: Technological, economic and environmental sustainability demonstration (ENV.2013.6.3-2/603744) – Grant agreement no. 603744
30
Deliverable 4.2. Demonstrative operation ES: Performance of the pilot including trace
contaminants with comparison to the NL demonstration results
Figure 25. Comparative removal efficiencies without acidification or with it (periods 3 and 4).
Period 6: Continuous operation under optimised settings (1900 G-force): from 19/09/2016
to 14/10/2016 (26 days)
During this period, the optimised centrifuge settings were established, aiming to produce stable
centrate to generate stable struvite.
The operational conditions of the centrifuge during this stage were 1900 g force, differential speed 12
rpm and weir size 44, HRT was 28 seconds.
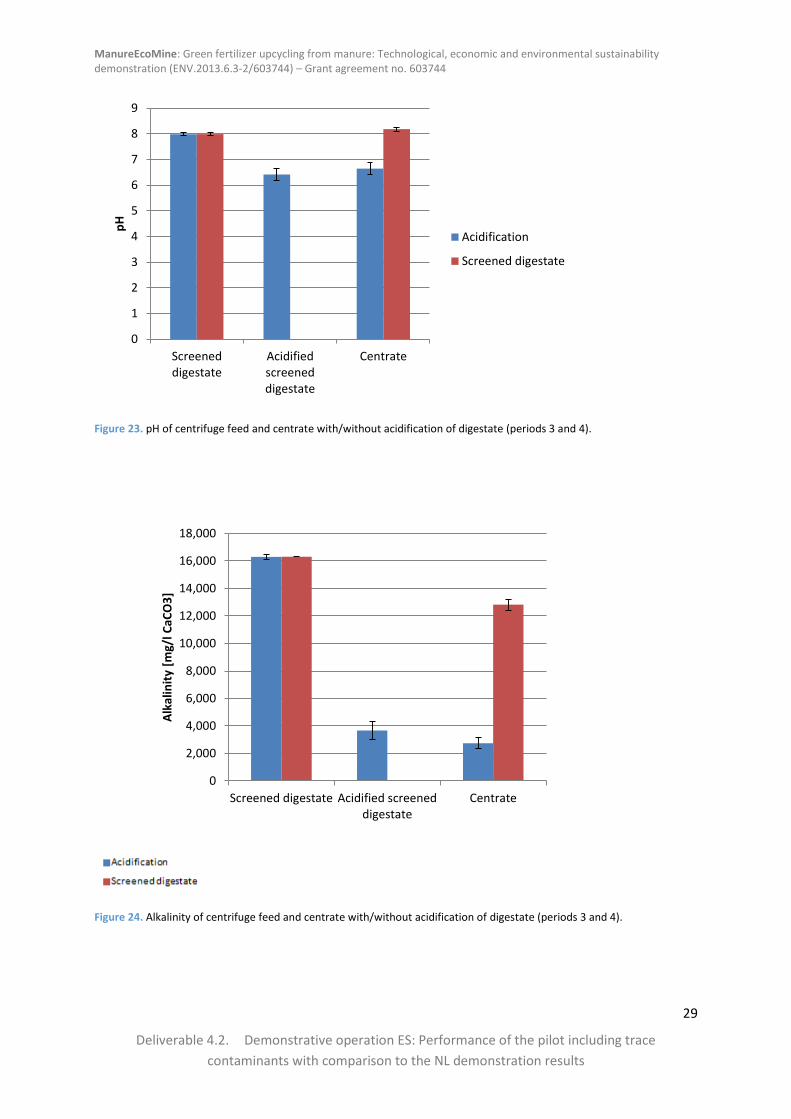
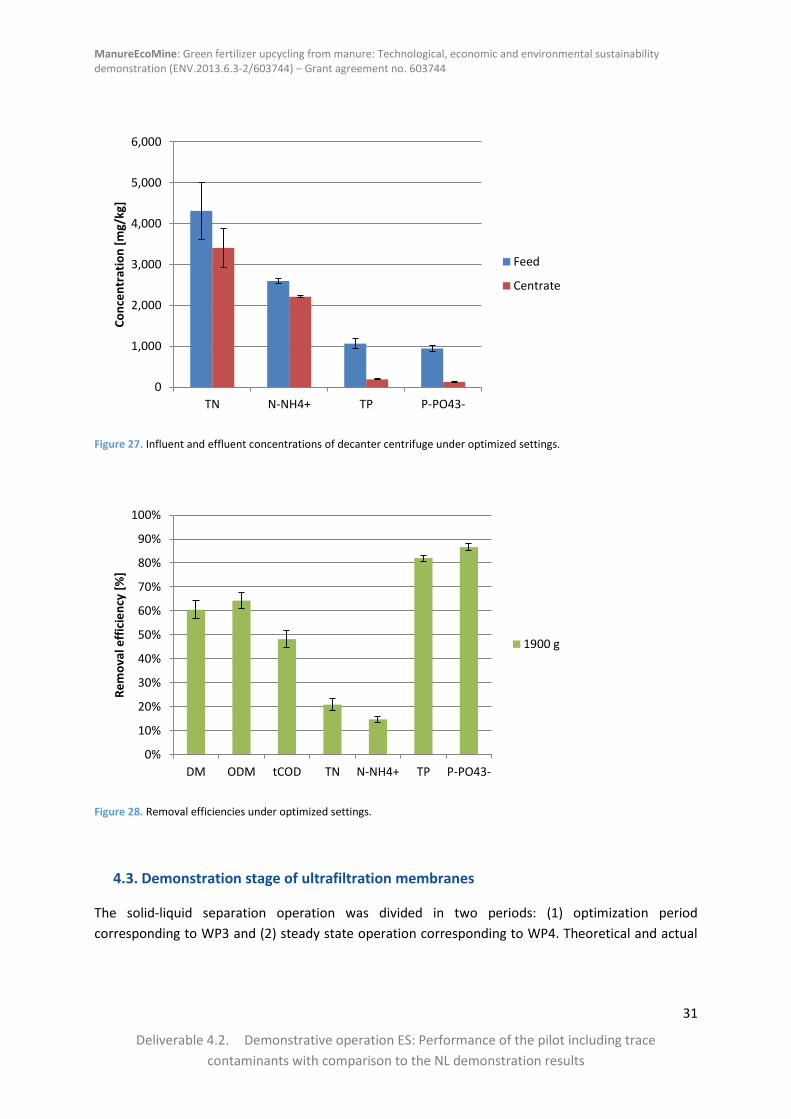
Removal efficiencies of all the parameters are presented along deliverable 3.3 (Figure 28). Figures 26
and 27 also depict the actual values entering and leaving the system.
Figure 26. Influent and effluent concentrations of decanter centrifuge under optimized settings.
0%
10%
20%
30%
40%
50%
60%
70%
80%
90%
Re
mo
val e
ffic
ien
cy
Digestate
Acidified digestate
0
50
100
150
200
250
DM ODM tCOD
Co
nce
ntr
atio
n [
g/kg
]
Feed
Centrate
Solid fraction
ManureEcoMine: Green fertilizer upcycling from manure: Technological, economic and environmental sustainability demonstration (ENV.2013.6.3-2/603744) – Grant agreement no. 603744
31
Deliverable 4.2. Demonstrative operation ES: Performance of the pilot including trace
contaminants with comparison to the NL demonstration results
Figure 27. Influent and effluent concentrations of decanter centrifuge under optimized settings.
Figure 28. Removal efficiencies under optimized settings.
4.3. Demonstration stage of ultrafiltration membranes
The solid-liquid separation operation was divided in two periods: (1) optimization period
corresponding to WP3 and (2) steady state operation corresponding to WP4. Theoretical and actual
0
1,000
2,000
3,000
4,000
5,000
6,000
TN N-NH4+ TP P-PO43-
Co
nce
ntr
atio
n [
mg/
kg]
Feed
Centrate
0%
10%
20%
30%
40%
50%
60%
70%
80%
90%
100%
DM ODM tCOD TN N-NH4+ TP P-PO43-
Re
mo
val e
ffic
ien
cy [
%]
1900 g

ManureEcoMine: Green fertilizer upcycling from manure: Technological, economic and environmental sustainability demonstration (ENV.2013.6.3-2/603744) – Grant agreement no. 603744
32
Deliverable 4.2. Demonstrative operation ES: Performance of the pilot including trace
contaminants with comparison to the NL demonstration results
times allocated to each phase regarding membranes are depicted in Figure 29. The present section
focusses on the results gathered during the demonstration phase.
Figure 29. Time allocated to optimization (WP3) and demonstration (WP4) of UF membranes
Membranes operational parameters results
Membrane performance is evaluated based on permeability and membrane flux. Water permeability
Lp (L/h m2 bar) is an intrinsic characteristic of membrane. Variation of the permeate flux J (L/h m2) with
applied transmembrane pressure ΔP (bar) allows to determinate Lp value for all elaborated membranes
using the following equation: 𝐽=𝐿𝑝×Δ𝑃 (Achiou, 2016).
During filtration, a temperature rise was observed throughout time. Average temperature of the
different filtration experiments is presented in Figure 30, it ranged from 24.4 to 32.5ºC with variations
within global experiments of ±5.6 ºC. For this reason, data was corrected to temperature (25ºC) so
experiments are comparable.

ManureEcoMine: Green fertilizer upcycling from manure: Technological, economic and environmental sustainability demonstration (ENV.2013.6.3-2/603744) – Grant agreement no. 603744
33
Deliverable 4.2. Demonstrative operation ES: Performance of the pilot including trace
contaminants with comparison to the NL demonstration results
Figure 30. Average membranes retentate temperature per type of water being processed.
Figure 31, 32 and 33 depict the permeate flux and permeability in function of time during filtration
operations. Operation of the membranes can be also classified by periods. Periods 1 and 2 are
discussed along the optimization phase in deliverable3.3. Periods during the demonstration phase are
explained as follows:
Period 3: Steady state permeation of pilot centrate generated from partially acidified
digestate (from 19/04/16 to 10/05/16 - 22 days)
This corresponds to the period of steady state filtration of centrate generated from partially acidified
digestate. During this period, the membranes operated for 5 days and the total working time is 34
hours. The average permeate flow rate was 19 L/h.
Figure 31. Filtration results when processing pilot centrate (from partially acidify digestate). Left: Permeability at 25ºC, Right:
Permeate flux at 25 ºC.
0.0
5.0
10.0
15.0
20.0
25.0
30.0
35.0
40.0
Partially acidifiedcentrate
Fully acidifiedcentrate
Centrate withoutacidification
Tem
pe
ratu
re [
C]
0.0
5.0
10.0
15.0
20.0
25.0
0:00 2:24 4:48 7:12
Kat
25
ºC
[L/
hm
2b
ar]
Time [hh:mm]
Centrate from partially acidified digestate
0.0
10.0
20.0
30.0
40.0
50.0
60.0
70.0
80.0
0:00 2:24 4:48 7:12
J at
25
ºC
[L/
hm
2]
Time [hh:mm]
Centrate from partially acidified digestate

ManureEcoMine: Green fertilizer upcycling from manure: Technological, economic and environmental sustainability demonstration (ENV.2013.6.3-2/603744) – Grant agreement no. 603744
34
Deliverable 4.2. Demonstrative operation ES: Performance of the pilot including trace
contaminants with comparison to the NL demonstration results
Period 4: Steady state permeation of pilot centrate generated from fully acidified digestate
(from 25/05/16 to 27/05/16 and from 18/07/16 to 03/08/16 – 20 days)
This corresponds to the period of steady state filtration of centrate generated from completely
acidified digestate. During this period, the membranes operated for 9 days and the total working time
was 59 hours. The average permeate flow rate was 21 L/h.
Figure 32. Filtration results when processing pilot centrate (from fully acidify digestate). Left: Permeability at 25ºC, Right:
Permeate flux at 25 ºC.
Period 5: Steady state permeation of pilot centrate without acidification of digestate (From
13/06/16 to 20/06/16- 8 days)
This corresponds to the period of steady state filtration of centrate without acidification. During this
period, the membranes operated for 3 days and the total working time was 21 hours. The average
permeate flow rate was 16 L/h.
0.0
5.0
10.0
15.0
20.0
25.0
0:00 2:24 4:48 7:12 9:36
Kat
25
ºC
[L/
hm
2b
ar]
Time [hh:mm]
Centrate from fully acidified digestate
0.0
10.0
20.0
30.0
40.0
50.0
60.0
70.0
80.0
0:00 2:24 4:48 7:12 9:36
J at
25
ºC
[L/
hm
2]
Time [hh:mm]
Centrate from partially acidified digestate

ManureEcoMine: Green fertilizer upcycling from manure: Technological, economic and environmental sustainability demonstration (ENV.2013.6.3-2/603744) – Grant agreement no. 603744
35
Deliverable 4.2. Demonstrative operation ES: Performance of the pilot including trace
contaminants with comparison to the NL demonstration results
Figure 33. Filtration results when processing pilot centrate. Left: Permeability at 25ºC, Right: Permeate flux at 25 ºC.
A fairly constant trend in function of time for all operations can be observed in both Figures 32 and 33.
Even after an effective cleaning, the membranes permeability during the filtration process with all
kinds of wastewater was low. By analysing the permeate flows, values varied between 0 and 30 L/hm2
(being 30 the highest value). It also appears that permeability increased when treating more acidic
centrate.
With the aim of comparing all the previous experiments during steady state operation on the same
graph, the average permeability and flow rates for every period was calculated. Within the average,
the first 5 minutes of data acquisition were discarded due to the variability and low representativeness
of these data points at long term. Results are presented in Figure 34.
Figure 34. Average permeate flux (J) and permeability (K) corrected to temperature 25 ºC per each kind of water being
processed through the membranes.
0.0
5.0
10.0
15.0
20.0
25.0
0:00 2:24 4:48 7:12 9:36
Kat
25
ºC
[L/
hm
2b
ar]
Time [hh:mm]
Centrate
0.0
10.0
20.0
30.0
40.0
50.0
60.0
70.0
80.0
0:00 2:24 4:48 7:12 9:36
J at
25
ºC
[L/
hm
2]
Time [hh:mm]
Centrate
0.0
5.0
10.0
15.0
20.0
25.0
30.0
Industrial centrate Pilot centrate(mixture)
Partially acidifiedcentrate
J a 25 ºc [L/m2h]
K a 25 ºC [L/m2hbar]

ManureEcoMine: Green fertilizer upcycling from manure: Technological, economic and environmental sustainability demonstration (ENV.2013.6.3-2/603744) – Grant agreement no. 603744
36
Deliverable 4.2. Demonstrative operation ES: Performance of the pilot including trace
contaminants with comparison to the NL demonstration results
From Figure 34, it is possible to summarize that the average permeability varied between 4.4 and
6 L/m2hbar, and the permeate flux varied between 17 and 23 L/m2·h. Thus permeability increased
when treating acidified centrate with a pH between 4.5 and 5.0, however standard deviation was
high in all cases.
Additionally, the average transmembrane pressure (TMP) per period is presented in Figure 35 with
its standard deviation. As it is possible to see, TMP was practically constant, varying between 3.8
and 3.9 bar with negligible deviation around these values.
Figure 35. Average permeate transmembrane pressure per each kind of water being processed through the membranes.
Feed and recirculation pumps operation
The ultrafiltration unit contains different manometers to ensure that the pumps are controlled within
their operation points and for security reasons. Along deliverable D3.3, the operation curves for the
feed and recirculation pumps are presented.
The feed pump operation must be operated between 3 to 3.3 bar to give a flow rate of approximately
3.4 m3/h. The recirculation pump must be operated of 1.9 bar to obtain a cross flow velocity of 4 m/s.
Figure 36 depicts the actual differential pressures for both pumps during their operation in the Spanish
scenario. The average feed pump pressure was 3.2 bar in all the experiments, which corresponded to
33.64 m of water column and a feed flow rate of 2.2 m3/h. Regarding the recirculation pump, the
average was 2.0-2.1 bar in all experiments, which corresponded to a recirculation flow rate of
approximately 18 m3/h.
The cross flow velocity at the inlet of the membranes was in average 3.6 m/s. Operating at a CFV of
3.6 m/s situated our maximum flux at about 25-50 L/hm2 (Figure 37). This means that permeability flux
could be increased by decreasing the recirculation pump working pressure, for instance down to 1.5
0.0
0.5
1.0
1.5
2.0
2.5
3.0
3.5
4.0
4.5
5.0
Industrial centrate Pilot centrate(mixture)
Partially acidifiedcentrate
TMP
[b
ar]

ManureEcoMine: Green fertilizer upcycling from manure: Technological, economic and environmental sustainability demonstration (ENV.2013.6.3-2/603744) – Grant agreement no. 603744
37
Deliverable 4.2. Demonstrative operation ES: Performance of the pilot including trace
contaminants with comparison to the NL demonstration results
bar, obtaining a recirculation flow of 24 m3/h, which equals to 2.42 m3/h per each of the seven
membranes and an approximate CFV of 4.8 m/s. However, it is recommended to operate at a lower
fluxes than the maximum design flux of 4 m/s, since operating at the maximum limit flux would lead
to increasing TMPs, rapid presence of dirt and capacity losses of the membranes.
Figure 36. Membranes recirculation pump operation curve
Figure 37. Likuid (supplier) analyses of flux along TMP at different CFVs (2,3 and 4 m/s).
0.0
0.5
1.0
1.5
2.0
2.5
3.0
3.5
4.0
Partially acidifiedcentrate
Fully acidifiedcentrate
Centrate withoutacidification
Dif
fere
nti
al p
ress
ure
Pressure loss feed pump [bar]
Pressure loss recirc pump [bar]

ManureEcoMine: Green fertilizer upcycling from manure: Technological, economic and environmental sustainability demonstration (ENV.2013.6.3-2/603744) – Grant agreement no. 603744
38
Deliverable 4.2. Demonstrative operation ES: Performance of the pilot including trace
contaminants with comparison to the NL demonstration results
Cleaning of membranes
The procedures regarding the membranes cleaning and the optimization of this sequence are
presented in deliverable 3.3, the current report focusses on the operation results.
Permeate analysis
Figures 38 to 49 represent the characterisation of the wastewater entering the membrane and the
permeate after filtration during the demonstration phase. The resulting removal efficiencies, taking
into account the recirculated concentrate fraction for DM, ODM, COD, TN, NH4-N, TP and PO4-P, are
displayed in Figures 50 and 51. Periods 1 and 2 correspond to the optimization stage and are discussed
along deliverable 3.3.
Period 3: Steady state permeation of pilot centrate generated from partially acidified
digestate (from 19/04/16 to 10/05/16 -22 days)
The centrate was generated during period 3 of the centrifuge operation, with acidification of the
digestate with an amount of acid of 0.026 g H2SO4 40%/g digestate. As previously explained, these
experiments were called “partially acidified” because the pH of the centrate was still higher (average
6.73) than the optimum point (4.5-5.0). Due to increasing alkalinity of the anaerobic digester
throughout time, a higher amount of acid should be added, however due to operational reasons, it
was decided to set a fix amount of acid which would make it easier to handle. The centrate had a pH
of 6.73 and permeate pH was slightly higher (7.33). General chemical results are presented in Figures
38 to 41.
As it is possible to see, phosphorus was much higher in the centrate (membrane influent) than when
processing centrate with alkaline pH (discussed later on in period 5). TP and P-PO43- were in average
533 and 465 mg/L respectively. When the permeate generated from partially acidified digestate was
processed through the membranes, a higher P proportion remained in the permeate compared to
when processing not acidified permeate (period 5), leaving the permeate with 201 and 184 mg/L of TP
and P-PO43- respectively. This represents a significant improvement compared to experiments without
acidification, where only about 30-40 mg/L TP would remain in the centrate. However, further
optimization needs to be done in order to further maximize the P recovery. For this reason, the
optimization continued with “fully acidified centrate”, as explained in the next period.
At these conditions, about 20% of the ammonium was removed in the membranes, however the
permeate ammonium standard deviation was quite high compared to the stability showed in the feed.
ManureEcoMine: Green fertilizer upcycling from manure: Technological, economic and environmental sustainability demonstration (ENV.2013.6.3-2/603744) – Grant agreement no. 603744
39
Deliverable 4.2. Demonstrative operation ES: Performance of the pilot including trace
contaminants with comparison to the NL demonstration results
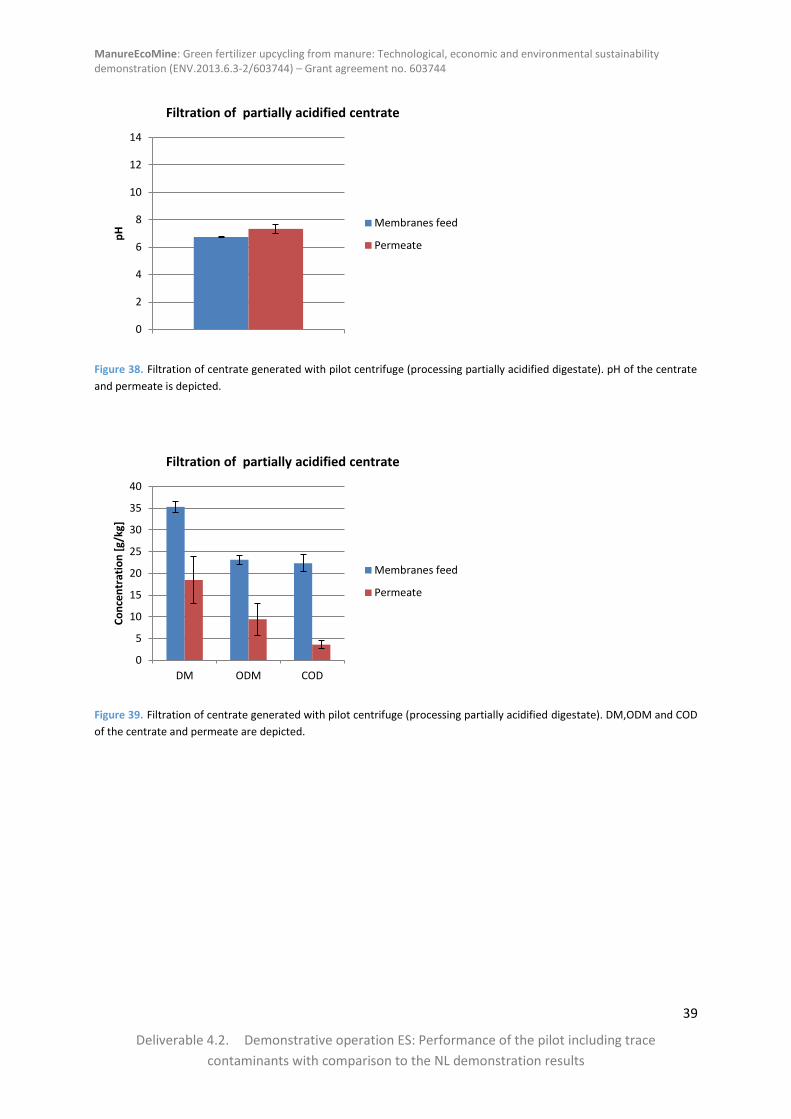
Figure 38. Filtration of centrate generated with pilot centrifuge (processing partially acidified digestate). pH of the centrate
and permeate is depicted.
Figure 39. Filtration of centrate generated with pilot centrifuge (processing partially acidified digestate). DM,ODM and COD
of the centrate and permeate are depicted.
0
2
4
6
8
10
12
14
pH
Filtration of partially acidified centrate
Membranes feed
Permeate
0
5
10
15
20
25
30
35
40
DM ODM COD
Co
nce
ntr
atio
n [
g/kg
]
Filtration of partially acidified centrate
Membranes feed
Permeate

ManureEcoMine: Green fertilizer upcycling from manure: Technological, economic and environmental sustainability demonstration (ENV.2013.6.3-2/603744) – Grant agreement no. 603744
40
Deliverable 4.2. Demonstrative operation ES: Performance of the pilot including trace
contaminants with comparison to the NL demonstration results
Figure 40. Filtration of centrate generated with pilot centrifuge (processing partially acidified digestate). TN and ammonium
of the centrate and permeate are depicted.
Figure 41. Filtration of centrate generated with pilot centrifuge (processing partially acidified digestate). TP and phosphates
of the centrate and permeate are depicted.
Period 4: Steady state permeation of pilot centrate generated from fully acidified digestate
(from 25/05/16 to 27/05/16 and from 18/07/16 to 03/08/16 – 20 days)
As explained in the previous period, further optimisation was needed in order to further improve P
recovery in the system. For this reason, complete acidification of the centrate was done and processed
through the membranes during 20 days.
Results are shown in Figures 42 to 45. It was possible to lower the pH to 5.09 (average centrate pH)
while the permeate pH was slightly higher (5.51) (Figure 42).
0
500
1,000
1,500
2,000
2,500
3,000
3,500
4,000
TN N-NH4+
Co
nce
ntr
atio
n [
mg/
kg]
Filtration of partially acidified centrate
Membranes feed
Permeate
0
100
200
300
400
500
600
TP P-PO43-
Co
nce
ntr
atio
n [
mg/
kg]
Filtration of partially acidified centrate
Membranes feed
Permeate

ManureEcoMine: Green fertilizer upcycling from manure: Technological, economic and environmental sustainability demonstration (ENV.2013.6.3-2/603744) – Grant agreement no. 603744
41
Deliverable 4.2. Demonstrative operation ES: Performance of the pilot including trace
contaminants with comparison to the NL demonstration results
Figure 42. Filtration of centrate generated with pilot centrifuge (processing fully acidified digestate). pH of the centrate and
permeate is depicted.
It is also important to highlight that although a higher P recovery was achieved, higher DM and ODM
contents were found in the permeate. Concerning the COD/ODM, it changed from 1 to 0.3. Typically
similar removal efficiencies are found in all kinds of solid-liquid separation units for COD and ODM.
This indicates that there was an error with the ODM measure in the permeate since COD removal
efficiencies should be similar to ODM removal efficiencies. Based on this, the overall mass balance
presented at the end of this report has taken into account that higher ODM removal efficiencies and
therefore DM removal efficiencies should be expected in the membranes when processing fully
acidified centrate.
Figure 43. Filtration of centrate generated with pilot centrifuge (processing fully acidified digestate). DM, ODM and COD of
the centrate and permeate are depicted.
0
2
4
6
8
10
12
14
pH
Filtration of fully acidified centrate
Membranes feed
Permeate
0
5
10
15
20
25
30
35
40
45
DM ODM COD
Co
nce
ntr
atio
n [
g/kg
]
Filtration of fully acidified centrate
Membranes feed
Permeate

ManureEcoMine: Green fertilizer upcycling from manure: Technological, economic and environmental sustainability demonstration (ENV.2013.6.3-2/603744) – Grant agreement no. 603744
42
Deliverable 4.2. Demonstrative operation ES: Performance of the pilot including trace
contaminants with comparison to the NL demonstration results
TP and P-PO43- in the centrate were in average 540 and 518 mg/L respectively (Figure 45), while the
permeate held 466 and 432 mg/L of TP and P-PO43-, respectively. This demonstrates that lowering the
pH to 4.5-5 is effective for recovering a significantly high proportion of P (86% of TP and 83% of P-PO43-
remained in the permeate), available for struvite precipitation. During this stage, also soluble fractions
of TP and phosphates were evaluated. Results indicated that a 98.7% of the soluble TP and a 89% of
the soluble orthophosphates remained in the permeate.
From Figure 44 it is possible to see that only 7.6% of the ammonium was removed in the membranes.
Figure 44. Filtration of centrate generated with pilot centrifuge (processing fully acidified digestate). TN and ammonium of
the centrate and permeate are depicted.
Figure 45. Filtration of centrate generated with pilot centrifuge (processing fully acidified digestate). TP and phosphates of
the centrate and permeate are depicted.
0
500
1,000
1,500
2,000
2,500
3,000
3,500
4,000
4,500
TN N-NH4+
Co
nce
ntr
atio
n [
mg/
kg]
Filtration of fully acidified centrate
Membranes feed
Permeate
0
100
200
300
400
500
600
TP P-PO43- sTP sP-PO43-
Co
nce
ntr
atio
n [
mg/
kg]
Filtration of fully acidified centrate
Membranes feed
Permeate

ManureEcoMine: Green fertilizer upcycling from manure: Technological, economic and environmental sustainability demonstration (ENV.2013.6.3-2/603744) – Grant agreement no. 603744
43
Deliverable 4.2. Demonstrative operation ES: Performance of the pilot including trace
contaminants with comparison to the NL demonstration results
Period 5: Steady state permeation of pilot centrate without acidification of digestate (from
13/06/16 to 20/06/16- 8 days)
In this period, centrate without acidification was processed at pilot scale in order to generate
comparative results. The permeation of this centrate was not processed for a long period because
results were demonstrated with the 8 days of operation and optimization was already performed.
Therefore there was no need in investing a valuable time in permeating low P content centrate.
The initial pH was 8.19 while the permeate pH was slightly higher (8.48). Permeate with lower DM,
ODM and COD was obtained, but also with considerably less P.
Figure 46. Filtration of centrate generated with pilot centrifuge. pH of the centrate and permeate is depicted.
Both ODM and COD were removed with similar removal efficiencies (79% ODM and 81% COD), which
was reasonable (Figure 47).
0
2
4
6
8
10
12
14
pH
Filtration of centrate
Membranes feed
Permeate
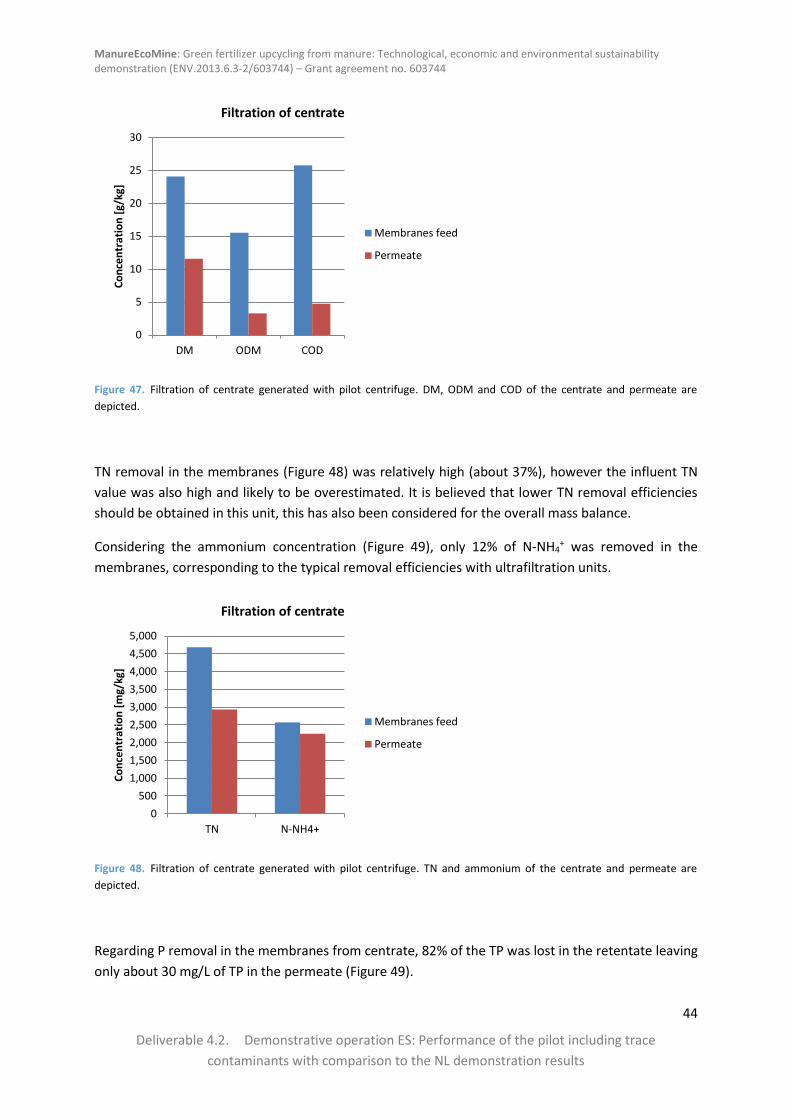
ManureEcoMine: Green fertilizer upcycling from manure: Technological, economic and environmental sustainability demonstration (ENV.2013.6.3-2/603744) – Grant agreement no. 603744
44
Deliverable 4.2. Demonstrative operation ES: Performance of the pilot including trace
contaminants with comparison to the NL demonstration results
Figure 47. Filtration of centrate generated with pilot centrifuge. DM, ODM and COD of the centrate and permeate are
depicted.
TN removal in the membranes (Figure 48) was relatively high (about 37%), however the influent TN
value was also high and likely to be overestimated. It is believed that lower TN removal efficiencies
should be obtained in this unit, this has also been considered for the overall mass balance.
Considering the ammonium concentration (Figure 49), only 12% of N-NH4+ was removed in the
membranes, corresponding to the typical removal efficiencies with ultrafiltration units.
Figure 48. Filtration of centrate generated with pilot centrifuge. TN and ammonium of the centrate and permeate are
depicted.
Regarding P removal in the membranes from centrate, 82% of the TP was lost in the retentate leaving
only about 30 mg/L of TP in the permeate (Figure 49).
0
5
10
15
20
25
30
DM ODM COD
Co
nce
ntr
atio
n [
g/kg
]Filtration of centrate
Membranes feed
Permeate
0
500
1,000
1,500
2,000
2,500
3,000
3,500
4,000
4,500
5,000
TN N-NH4+
Co
nce
ntr
atio
n [
mg/
kg]
Filtration of centrate
Membranes feed
Permeate
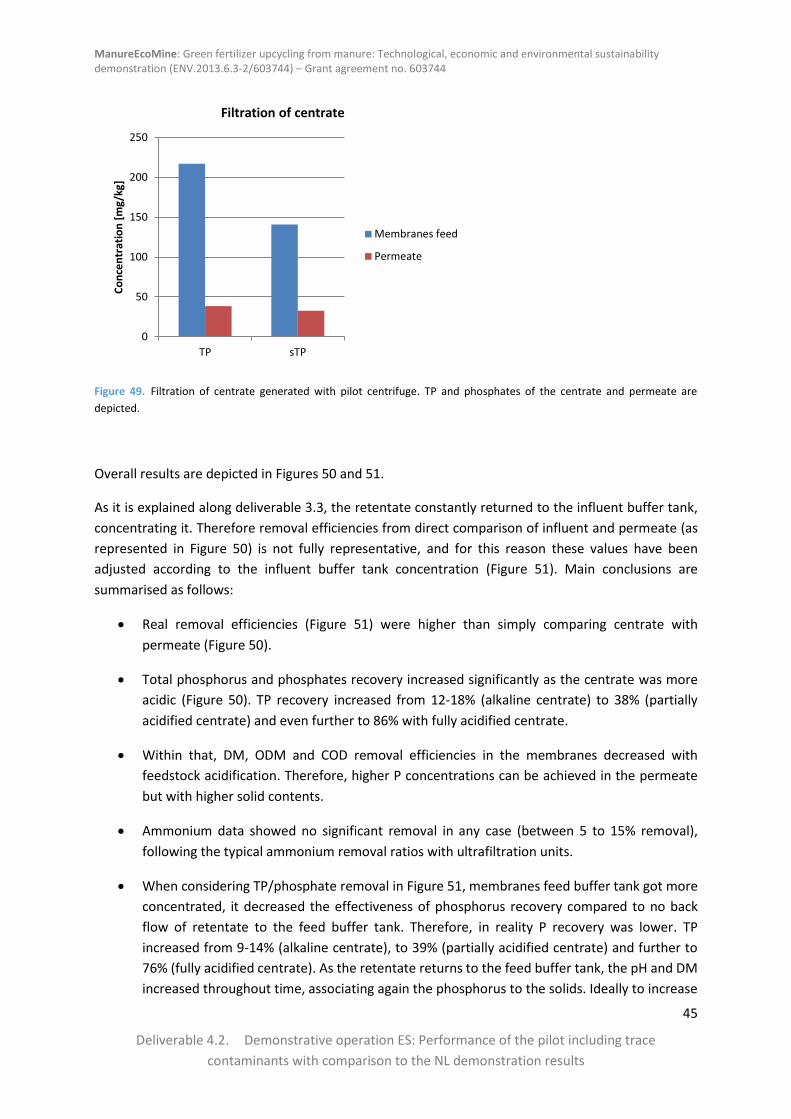
ManureEcoMine: Green fertilizer upcycling from manure: Technological, economic and environmental sustainability demonstration (ENV.2013.6.3-2/603744) – Grant agreement no. 603744
45
Deliverable 4.2. Demonstrative operation ES: Performance of the pilot including trace
contaminants with comparison to the NL demonstration results
Figure 49. Filtration of centrate generated with pilot centrifuge. TP and phosphates of the centrate and permeate are
depicted.
Overall results are depicted in Figures 50 and 51.
As it is explained along deliverable 3.3, the retentate constantly returned to the influent buffer tank,
concentrating it. Therefore removal efficiencies from direct comparison of influent and permeate (as
represented in Figure 50) is not fully representative, and for this reason these values have been
adjusted according to the influent buffer tank concentration (Figure 51). Main conclusions are
summarised as follows:
Real removal efficiencies (Figure 51) were higher than simply comparing centrate with
permeate (Figure 50).
Total phosphorus and phosphates recovery increased significantly as the centrate was more
acidic (Figure 50). TP recovery increased from 12-18% (alkaline centrate) to 38% (partially
acidified centrate) and even further to 86% with fully acidified centrate.
Within that, DM, ODM and COD removal efficiencies in the membranes decreased with
feedstock acidification. Therefore, higher P concentrations can be achieved in the permeate
but with higher solid contents.
Ammonium data showed no significant removal in any case (between 5 to 15% removal),
following the typical ammonium removal ratios with ultrafiltration units.
When considering TP/phosphate removal in Figure 51, membranes feed buffer tank got more
concentrated, it decreased the effectiveness of phosphorus recovery compared to no back
flow of retentate to the feed buffer tank. Therefore, in reality P recovery was lower. TP
increased from 9-14% (alkaline centrate), to 39% (partially acidified centrate) and further to
76% (fully acidified centrate). As the retentate returns to the feed buffer tank, the pH and DM
increased throughout time, associating again the phosphorus to the solids. Ideally to increase
0
50
100
150
200
250
TP sTP
Co
nce
ntr
atio
n [
mg/
kg]
Filtration of centrate
Membranes feed
Permeate

ManureEcoMine: Green fertilizer upcycling from manure: Technological, economic and environmental sustainability demonstration (ENV.2013.6.3-2/603744) – Grant agreement no. 603744
46
Deliverable 4.2. Demonstrative operation ES: Performance of the pilot including trace
contaminants with comparison to the NL demonstration results
the efficiency of the unit, the retentate should flow to another deposit. For this reason, this
stream was considered as if there was a constant retentate stream flowing out of the system,
when assessing the overall mass balance
It is also important to highlight that the feed buffer tank was emptied every time that a new
experiment would begin.
Figure 50. Filtration removal efficiencies along different experiments.
0%
10%
20%
30%
40%
50%
60%
70%
80%
90%
100%
DM ODM COD TN N-NH4+ TP P-PO43-
Re
mo
val e
ffic
ien
cy
wit
ho
ut
con
sid
eri
ng
cen
trat
e B
T
Normal centrate (5)
Partially acidified (3)
Fully acidified (4)
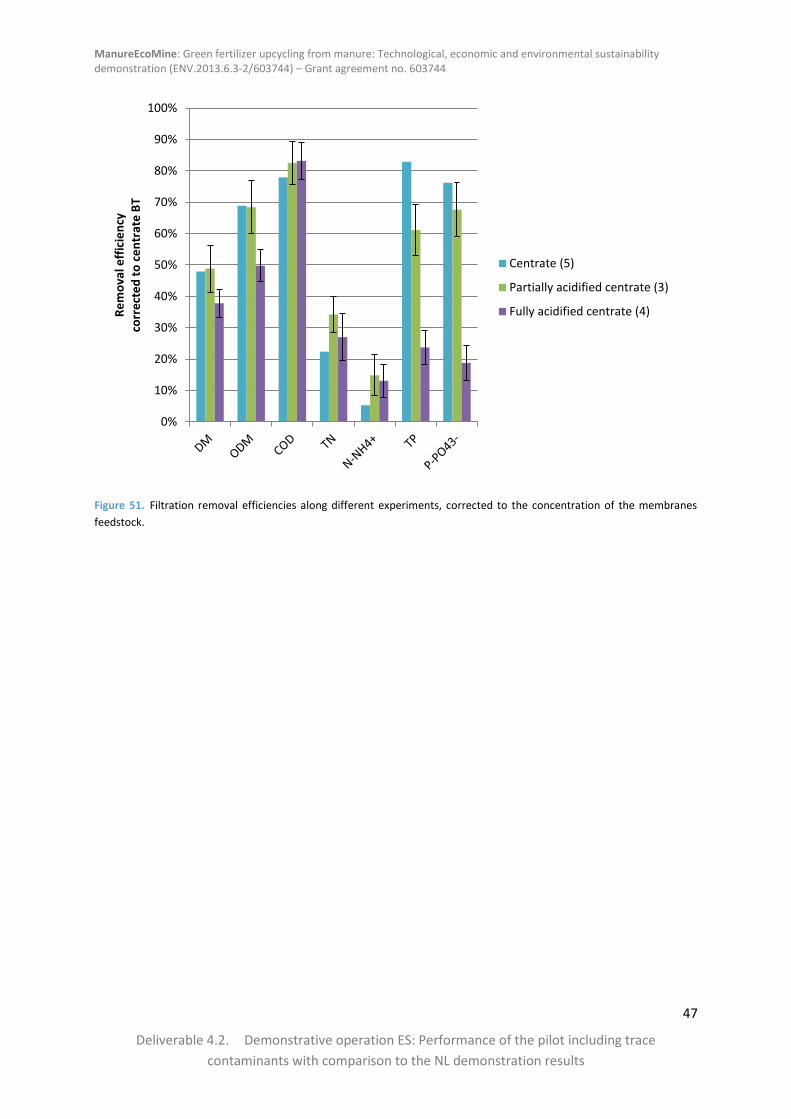
ManureEcoMine: Green fertilizer upcycling from manure: Technological, economic and environmental sustainability demonstration (ENV.2013.6.3-2/603744) – Grant agreement no. 603744
47
Deliverable 4.2. Demonstrative operation ES: Performance of the pilot including trace
contaminants with comparison to the NL demonstration results
Figure 51. Filtration removal efficiencies along different experiments, corrected to the concentration of the membranes
feedstock.
0%
10%
20%
30%
40%
50%
60%
70%
80%
90%
100%R
em
ova
l eff
icie
ncy
co
rre
cte
d t
o c
en
trat
e B
T
Centrate (5)
Partially acidified centrate (3)
Fully acidified centrate (4)

ManureEcoMine: Green fertilizer upcycling from manure: Technological, economic and environmental sustainability demonstration (ENV.2013.6.3-2/603744) – Grant agreement no. 603744
48
Deliverable 4.2. Demonstrative operation ES: Performance of the pilot including trace
contaminants with comparison to the NL demonstration results
4.4. Demonstration stage of phosphorus recovery through struvite precipitation
The struvite reactor operation was divided in two periods: (1) optimization period corresponding to
WP3 and (2) steady state operation corresponding to WP4. Theoretical and actual times allocated to
each phase are depicted in Figure 52. The present section focusses on the results gathered during the
demonstration period (WP4).
Figure 52. Timeline regarding optimization and stable operation of the Struvite unit.
Two steady state periods were considered: (1) struvite precipitation from centrate, (2) struvite
precipitation from permeate generated from acidified digestate. Table 7 shows the settings that were
applied during the operation.
As reported along deliverable 3.3, the values for process settings for struvite precipitation were
determined by the partner Lequia, University of Girona. The pH was measured both online and
manually throughout the operation.
Table 7. Parameters during the crystalliser operation.
Units Settings
Medium - (1) Centrate
(2) Permeate (from acidified digestate)
Flowrate influent L/h Changing depending on P concentration
to maintain HRT
Hydraulic retention time (HRT) h (2) 3.5 hours
(3) 3.5 hours
Air blower L/min 2.5
Mg overdosing % 60

ManureEcoMine: Green fertilizer upcycling from manure: Technological, economic and environmental sustainability demonstration (ENV.2013.6.3-2/603744) – Grant agreement no. 603744
49
Deliverable 4.2. Demonstrative operation ES: Performance of the pilot including trace
contaminants with comparison to the NL demonstration results
The main results are reported in deliverable 3.3, since there were long term comparisons for different
values. The following section aims to summarise the main results under the most optimum conditions
for the two different scenarios considered.
Period 1: Struvite precipitation from centrate without pH control at HRT 3.5 hours.
To maintain the HRT within the optimum value, the influent P concentration was measured at the
beginning of every batch. The MgOH2 flow rate was set to provide a 60% of Mg excess and both influent
and MgOH2 pumps flow rates were adjusted to achieve the desired HRT.
Period 3: Struvite precipitation from permeate (fully acidified digestate) with pH control at
HRT of 3.5 hours.
This study corresponds to the long term study of struvite precipitation from acidified permeate. pH
control was applied by the addition of NaOH 1 M and the control set point was pH 8.5.
Figure 53 summarizes the removal efficiencies of both periods 1 and 3. The main conclusions are
discussed as follows:
Struvite can be recovered both from centrate and permeate.
Relatively low recovery efficiencies were found when producing struvite from centrate (about
54-58% removal of TP and phosphates), leaving still high concentrations of P in the effluent
(TP was approximately 150 mg/L and P-PO43- 100 mg/L).
Significantly higher TP and phosphates recovery was found with acidified permeate (higher
than 90%) compared to centrate (54-58%).
When analysing the overall mass flows for all nutrients, most of the parameters decreased
(DM, ODM, COD) were due to dilution through the Mg(OH)2 addition, which was added at an
average concentration of 2 g/L. When looking at the concentration reduction, with acidified
permeate higher amounts of DM, ODM and COD seemed to be removed, however this was
purely due to dilution effect since higher amount of P was present and therefore higher
volumes of Mg were needed to precipitate struvite. The overall mass flows remained constant
through this unit. However there was a significant P removal and with that a little N removal.
Mg was always added 60% in excess and it was not necessary to increase it.
From X-ray diffraction analyses of the obtained products, discussed in deliverable 3.3, struvite
was detected as the main crystal in both centrate and permeate, however other crystals were
detected such as brucite due to the use of Mg(OH)2 as Mg source for struvite precipitation.
Furthermore, when treating centrate other amorphous compounds were observed, while
treating permeate only crystals were obtained indicating that a higher quality product was
obtained from permeate. This was because ions were retained in the membranes, diminishing
the concentration of interfering ions such as calcium. On the other hand, the centrate
contained higher concentrations of interfering ions, enhancing the precipitation of other
compounds, such as calcium phosphate, usuallly precipitated as amorphous substances.

ManureEcoMine: Green fertilizer upcycling from manure: Technological, economic and environmental sustainability demonstration (ENV.2013.6.3-2/603744) – Grant agreement no. 603744
50
Deliverable 4.2. Demonstrative operation ES: Performance of the pilot including trace
contaminants with comparison to the NL demonstration results
Figure 53. Removal efficiency comparison between (1) permeate with previous acidification step and (2) centrate at the same
HRT of 3.5 hours.
Along deliverable 3.3, samples of the products obtained during the two studies were analysed,
indicating that struvite was detected in the two experiments. Additionally, during period 1 treating
centrate under steady state, frequent samples were taken to identify the precipitated compounds
under the demo phase. Results are presented in Figures 54, 55, 56 and 57. The findings in each sample
are described as follows:
Sample “Num.57”: mostly amorphous compounds are detected, with presence of KCl.
Sample “Num.58”: mostly amorphous compounds are detected, with presence of KCl.
Sample “Num.59”: mostly amorphous compounds are detected, with presence of KCl.
Sample “Num.60”: mostly amorphous compounds are detected, with presence of KCl and
brucite, Mg(OH)2.
From the previous samples under steady state struvite was not detected. However, after this the
reactor was emptied and significant amounts of struvite were found inside the reactor (Figure 58): the
struvite crystals were so big and the effluent pipe diameter was too small that it was not possible for
the crystals to pass through, therefore they accumulated inside the reactor. The X-ray diffraction
analysis of this product is presented in Figure 59, where it is possible to see that no amorphous
compounds were detected and the only crystalline compounds was struvite.
0.00%
10.00%
20.00%
30.00%
40.00%
50.00%
60.00%
70.00%
80.00%
90.00%
100.00%
DM ODM COD TN NH4+ TP
Re
mo
val e
ffic
ien
cy [
%]
Struvite results
100% centrate
Fully acidified, HRT 3,5 hr, pHcontrol
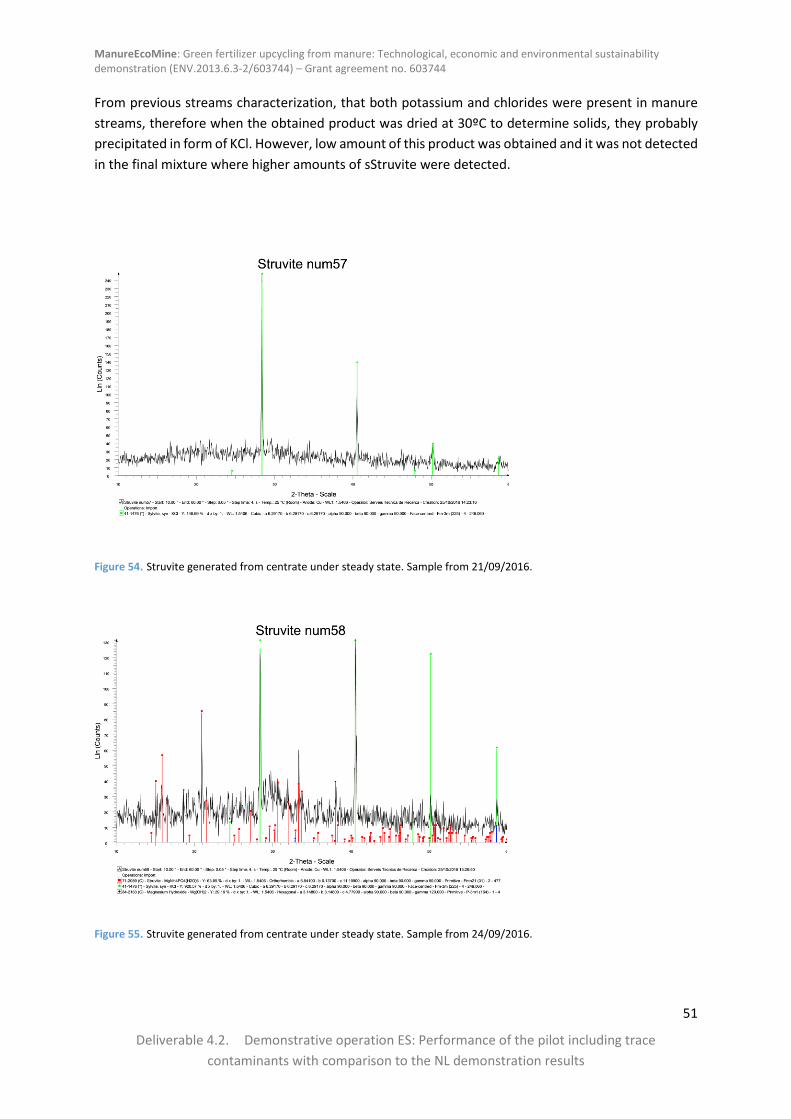
ManureEcoMine: Green fertilizer upcycling from manure: Technological, economic and environmental sustainability demonstration (ENV.2013.6.3-2/603744) – Grant agreement no. 603744
51
Deliverable 4.2. Demonstrative operation ES: Performance of the pilot including trace
contaminants with comparison to the NL demonstration results
From previous streams characterization, that both potassium and chlorides were present in manure
streams, therefore when the obtained product was dried at 30ºC to determine solids, they probably
precipitated in form of KCl. However, low amount of this product was obtained and it was not detected
in the final mixture where higher amounts of sStruvite were detected.
Figure 54. Struvite generated from centrate under steady state. Sample from 21/09/2016.
Figure 55. Struvite generated from centrate under steady state. Sample from 24/09/2016.

ManureEcoMine: Green fertilizer upcycling from manure: Technological, economic and environmental sustainability demonstration (ENV.2013.6.3-2/603744) – Grant agreement no. 603744
52
Deliverable 4.2. Demonstrative operation ES: Performance of the pilot including trace
contaminants with comparison to the NL demonstration results
Figure 56. Struvite generated from centrate under steady state. Sample from 30/09/2016.
Figure 57. Struvite generated from centrate under steady state. Sample from 4/10/2016.

ManureEcoMine: Green fertilizer upcycling from manure: Technological, economic and environmental sustainability demonstration (ENV.2013.6.3-2/603744) – Grant agreement no. 603744
53
Deliverable 4.2. Demonstrative operation ES: Performance of the pilot including trace
contaminants with comparison to the NL demonstration results
Figure 58. Struvite generated from centrate under steady state and accumulated in the reactor and on the walls.
Figure 59. Struvite generated from centrate under steady state, obtained when the reactor was emptied for pilot disassembly
at the end of the project. Sample from 11/10/2016.

ManureEcoMine: Green fertilizer upcycling from manure: Technological, economic and environmental sustainability demonstration (ENV.2013.6.3-2/603744) – Grant agreement no. 603744
54
Deliverable 4.2. Demonstrative operation ES: Performance of the pilot including trace
contaminants with comparison to the NL demonstration results
4.5. Demonstration stage of nitrogen removal through a biological process
As discussed along deliverable 3.3, the biological nitrogen removal (BNR) reactor operation in Spain
consisted only on an optimization phase since steady state operation was not achieved. Theoretical
and actual times allocated to each phase within WP3 and WP4 are depicted in Figure 60, where it is
shown that there was no time allocated to WP4 with this unit.
Figure 60. Timeline regarding optimization and stable operation of the biological nitrogen removal reactor.
The biggest challenge with the BNR operation was the aeration. The original design included two
blowers of 100 L/min for the high rate activated sludge (HRAS) reactor and another blower of 150
L/min for the partial nitritation/Anammox (PNA) operation, however the oxygen mass transfer
efficiency in the reactor was very poor. Although modifications to the original design were
implemented along the Spanish scenario, this was not to be enough for the selected BNR removal
process as Nitritation-Denitritation. In parallel, experiments at laboratory scale were done by UGent-
CMET, demonstrating that under steady state and controlled conditions, nitrogen removal efficiencies
above 98-99% were attained with little or negligible amounts of nitrates and nitrites in the effluent.
Furthermore, a lab campaign for NOx gases was done by UGent-CMET under steady state, proving that
it was possible to minimize the production of N2O greenhouse gas to negligible values by optimizing
the operation cycles with special emphasis on feeding sequences, aeration control and external carbon
dosage.

ManureEcoMine: Green fertilizer upcycling from manure: Technological, economic and environmental sustainability demonstration (ENV.2013.6.3-2/603744) – Grant agreement no. 603744
55
Deliverable 4.2. Demonstrative operation ES: Performance of the pilot including trace
contaminants with comparison to the NL demonstration results
5. OVERALL MASS BALANCES
From the data gathered along the demonstration phase, the partners Ahidra and USC collaborated for
validating the data and create an overall mass balance from the data gathered at the pilot plant in ES.
There were two mass balances according to the two different scenarios generated along this study,
which are presented in Figures 61 and 62. Since data used to build up these mass balances is real, there
is an associated error of 10-15% for all of them.
Regarding the struvite production flow rate, this was estimated from the orthophosphate removal in
the struvite reactor and by assuming stoichiometric production yields. However, the partner Lequia
demonstrated that in reality lower production rates are expected.
Regarding the biological nitrogen removal, the effluent characterisation was based on the studies
carried out by the partner UGent-CMET at laboratory scale, since the BNR operation at pilot scale did
not reach a steady state operation.
The objective behind this section was to compare the individual and overall performance of the
processes and establish the two optimal schemes which are used as basis for the environmental and
economical assessment.

ManureEcoMine: Green fertilizer upcycling from manure: Technological, economic and environmental sustainability demonstration (ENV.2013.6.3-2/603744) – Grant agreement no. 603744
56
Deliverable 4.2. Demonstrative operation ES: Performance of the pilot including trace contaminants with comparison to the NL demonstration results
Figure 61. Mass balance for scenario 1 during ES operation

ManureEcoMine: Green fertilizer upcycling from manure: Technological, economic and environmental sustainability demonstration (ENV.2013.6.3-2/603744) – Grant agreement no. 603744
57
Deliverable 4.2. Demonstrative operation ES: Performance of the pilot including trace contaminants with comparison to the NL demonstration results
Figure 62. Mass balance for scenario 2 during ES operation
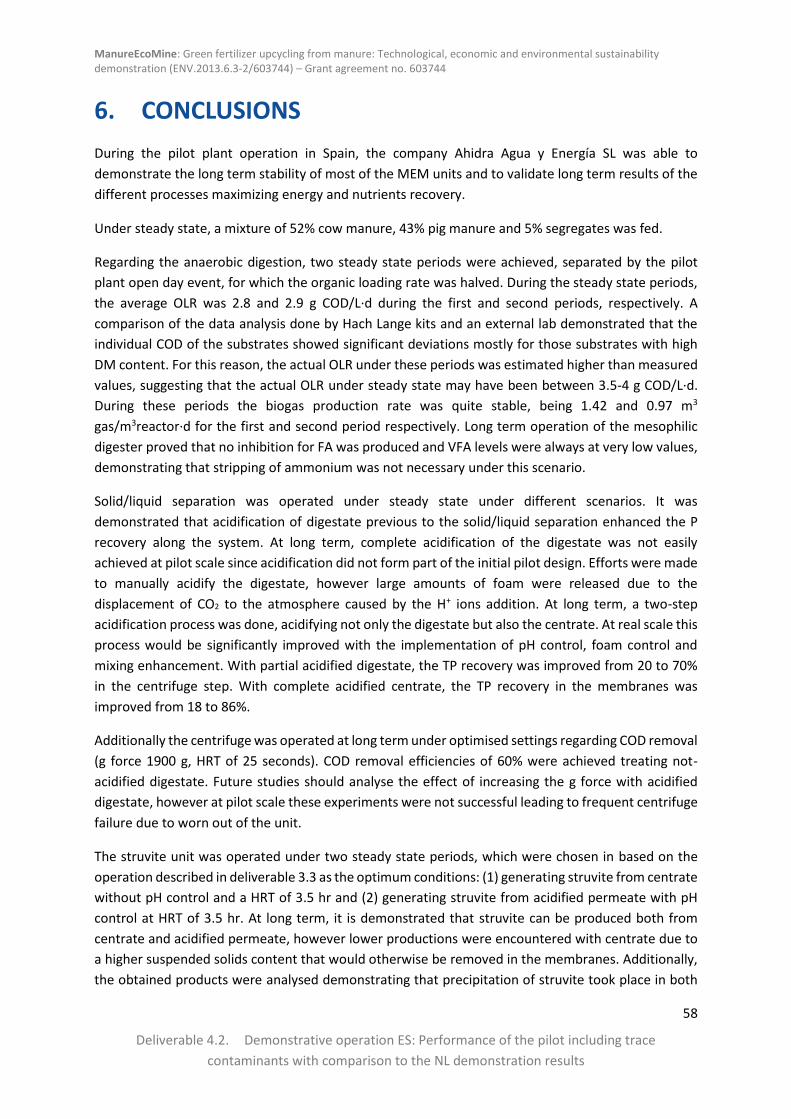
ManureEcoMine: Green fertilizer upcycling from manure: Technological, economic and environmental sustainability demonstration (ENV.2013.6.3-2/603744) – Grant agreement no. 603744
58
Deliverable 4.2. Demonstrative operation ES: Performance of the pilot including trace
contaminants with comparison to the NL demonstration results
6. CONCLUSIONS
During the pilot plant operation in Spain, the company Ahidra Agua y Energía SL was able to
demonstrate the long term stability of most of the MEM units and to validate long term results of the
different processes maximizing energy and nutrients recovery.
Under steady state, a mixture of 52% cow manure, 43% pig manure and 5% segregates was fed.
Regarding the anaerobic digestion, two steady state periods were achieved, separated by the pilot
plant open day event, for which the organic loading rate was halved. During the steady state periods,
the average OLR was 2.8 and 2.9 g COD/L·d during the first and second periods, respectively. A
comparison of the data analysis done by Hach Lange kits and an external lab demonstrated that the
individual COD of the substrates showed significant deviations mostly for those substrates with high
DM content. For this reason, the actual OLR under these periods was estimated higher than measured
values, suggesting that the actual OLR under steady state may have been between 3.5-4 g COD/L·d.
During these periods the biogas production rate was quite stable, being 1.42 and 0.97 m3
gas/m3reactor·d for the first and second period respectively. Long term operation of the mesophilic
digester proved that no inhibition for FA was produced and VFA levels were always at very low values,
demonstrating that stripping of ammonium was not necessary under this scenario.
Solid/liquid separation was operated under steady state under different scenarios. It was
demonstrated that acidification of digestate previous to the solid/liquid separation enhanced the P
recovery along the system. At long term, complete acidification of the digestate was not easily
achieved at pilot scale since acidification did not form part of the initial pilot design. Efforts were made
to manually acidify the digestate, however large amounts of foam were released due to the
displacement of CO2 to the atmosphere caused by the H+ ions addition. At long term, a two-step
acidification process was done, acidifying not only the digestate but also the centrate. At real scale this
process would be significantly improved with the implementation of pH control, foam control and
mixing enhancement. With partial acidified digestate, the TP recovery was improved from 20 to 70%
in the centrifuge step. With complete acidified centrate, the TP recovery in the membranes was
improved from 18 to 86%.
Additionally the centrifuge was operated at long term under optimised settings regarding COD removal
(g force 1900 g, HRT of 25 seconds). COD removal efficiencies of 60% were achieved treating not-
acidified digestate. Future studies should analyse the effect of increasing the g force with acidified
digestate, however at pilot scale these experiments were not successful leading to frequent centrifuge
failure due to worn out of the unit.
The struvite unit was operated under two steady state periods, which were chosen in based on the
operation described in deliverable 3.3 as the optimum conditions: (1) generating struvite from centrate
without pH control and a HRT of 3.5 hr and (2) generating struvite from acidified permeate with pH
control at HRT of 3.5 hr. At long term, it is demonstrated that struvite can be produced both from
centrate and acidified permeate, however lower productions were encountered with centrate due to
a higher suspended solids content that would otherwise be removed in the membranes. Additionally,
the obtained products were analysed demonstrating that precipitation of struvite took place in both
ManureEcoMine: Green fertilizer upcycling from manure: Technological, economic and environmental sustainability demonstration (ENV.2013.6.3-2/603744) – Grant agreement no. 603744
59
Deliverable 4.2. Demonstrative operation ES: Performance of the pilot including trace
contaminants with comparison to the NL demonstration results
scenarios, however co-precipitation of other crystals such as brucite was found. Interestingly, with
centrate other amorphous co-precipitated products were detected, while with permeate only
crystalline products were found, indicating that the higher solids caused interferences in the
precipitation of struvite.
Finally, the biological nitrogen reactor was operated as a Nitritation-Denitritation system, however due
to design limitations, it was not possible to achieve the steady state operation of this unit. It is expected
from lab results that BNR operation as Nitritation-Denitritation system would be efficient at real scale
in degrading the N levels present in the ManureEcoMine effluent, with N-NH4+ removal efficiencies
higher than 99% and an improved control system for minimising NOx gases emissions.
In overall, the pilot operation in Spain demonstrated that it is possible to transform manure into “green
energy” maximising the nutrients recovery into valuable fertilisers with positive effects on plant
growth and generating irrigation water.

ManureEcoMine: Green fertilizer upcycling from manure: Technological, economic and environmental sustainability demonstration (ENV.2013.6.3-2/603744) – Grant agreement no. 603744
60
Deliverable 4.2. Demonstrative operation ES: Performance of the pilot including trace
contaminants with comparison to the NL demonstration results
7. FINAL REMARKS OPTIMIZATION OF PILOT PLANT NL
VS. ES SCENARIO
Feed mixture (ES vs. NL)
Under steady state, the substrates in NL consisted on pig manure (84%) and Ecofrit (16%), while the
substrates in ES consisted on a mixture of cow (52%) and pig (43%) manure and segregates (5%) during
demo stages. In both scenarios, manure was sieved before introducing it in the buffer tanks. In NL
Ecofrit was also sieves, however in ES segregates was not sieved since its consistency was very different
(gel-like).
In NL the pig manure was collected at several farms nearby the test location while in ES, both cow and
pig manure were produced in Raurell´s farm. Nevertheless, the selection of both feeding substrates
scenarios was useful since it was year-round available. The overall composition of the feed mixture for
NL and ES was presented in deliverable 3.3.
Anaerobic Digestion (ES vs. NL)
Operation in the NL under the demo stage consisted on a thermophilic anaerobic digestion (50-51ºC)
while operation in ES consisted on a mesophilic anaerobic digestion (37-38ºC).
The thermophilic AD operated under demo stage for 150 days after the re-inoculation. During this
period OLR was steadily increased from 0.8 to the final value of 4.6 g COD/L·d with a final HRT of 22
days. GPR varied accordingly. The stable period was selected from days 285 to 295 with a stable OLR
of 3.9 g COD/L·d and a HRT of 32 days, the GPR was 1.3 m3 biogas/m3 reactor·day.
In contrast, during the ES operation under demo stage, the OLR was constant during two steady state
periods. The total steady state time was 181 days. The estimated average OLR was 3.3 g COD/L·d and
HRT of 23 days, with an average GPR production of 0.9 m3 biogas/m3 reactor·day.
It is believed that the biogas production rate would have been higher in NL, if there had been more
time for bacteria adaptation and stabilization, however due to the initial acidification of the digester
and the problems associated to the operation of the stripping-scrubber units, there was limited
amount of time for a long term demonstrative operation of this unit.
Stripping of ammonia (ES vs. NL)
Operation in NL consisted on a thermophilic AD coupled with a stripping process. From day 204
stripped digestate was returned to the digester, which resulted in an stabilization of ammonium levels
and FAN levels below inhibitory values of 3.4 g/L N-NH4+ and 0.47 g N-NH3/L. About 40% of the N-NH4+
was effectively stripped during the steady state period (day 285 to 295). Side stripping appeared to be

ManureEcoMine: Green fertilizer upcycling from manure: Technological, economic and environmental sustainability demonstration (ENV.2013.6.3-2/603744) – Grant agreement no. 603744
61
Deliverable 4.2. Demonstrative operation ES: Performance of the pilot including trace
contaminants with comparison to the NL demonstration results
an effective way to counteract the possible FA inhibition and to recover N in form of ammonium
sulphate.
Under mesophilic AD conditions, coupling the stripping unit was not justified since bacteria do not
normally present FA inhibition problems under mesophilic conditions, provided they were correctly
acclimatised. During the ES scenario the main objective consisted on having a steady state operation
in the AD which would allow stabilizing the following processes maximizing the nutrients recovery.
Solid-liquid centrifuge (ES vs. NL)
In NL, solid/liquid separation optimization took place during the demo phase. During this period g force
was further investigated. The operational settings for the centrifuge operation were selected as 1,500
g force, HRT 46 s, which resulted in a removal efficiency of: 50% DM, 58% ODM, 63% COD, 29% TN,
10% N-NH4+, 84% TP and 88% P-PO4
3-. Only 15% of the TP passed to the centrate, leaving very low
amounts of P to produce struvite.
In ES, operation of the dewatering unit took place under different wastewater conditions: (1) treating
digestate, (2) treating acidified digestate and (3) treating digestate under optimised settings.
From studies during demo phase (3), the selected operational conditions of the centrifuge for optimum
COD removal efficiencies were 1900 g force, differential speed 12 rpm and weir size 44, HRT was 28
seconds. Processing digestate under these conditions resulted in a removal efficiency of: 60% DM, 64%
ODM, 48% COD, 21% TN, 15% N-NH4+, 82% TP and 87% P-PO4
3-, which were very similar to the NL
results. From these results it was demonstrated that high amounts of P were retained in the solid
fraction.
Additional studies during the demo phase in ES demonstrated that acidification of digestate caused a
higher P recovery in the centrate fraction. The centrifuge was operated at 1500 g and HRT 25 s and the
obtained removal efficiencies during this period were: 38% DM, 44% ODM, 44% COD, 12% TN, 1% N-
NH4+, 28% TP and 29% P-PO4
3-. With partial acidification of digestate higher amounts of P were present
in the centrate, however more solids were found under these conditions due to increasing influent DM
content caused by the re-suspension of the settled solids through the acidification process.
UF membranes (SP vs. NL)
During the demo phase in NL, the membranes were operated treating centrate from normal digestate.
The removal efficiencies were 40% DM, 52% ODM, 56% COD, 29% TN, 30% N-NH4+, 57% TP and 50%
P-PO43-. This after the decanter centrifuge, led to high losses of TP (>90%).
During the demo phase in ES, the membranes were operated treating centrate from (1) normal
digestate, but also (2) from partially acidified digestate and (3) from fully acidified digestate. Total
phosphorus and phosphates recovery increased significantly as the centrate was more acidic. TP
recovery increased from 12%-18% (alkaline centrate) to 38% (partially acidified centrate) and even
ManureEcoMine: Green fertilizer upcycling from manure: Technological, economic and environmental sustainability demonstration (ENV.2013.6.3-2/603744) – Grant agreement no. 603744
62
Deliverable 4.2. Demonstrative operation ES: Performance of the pilot including trace
contaminants with comparison to the NL demonstration results
further to 86% with fully acidified centrate. Higher P recovery rates were coupled with higher solids
and COD values in the obtained permeate.
Precipitation of Struvite (ES vs. NL)
During the demo operation in NL, N struvite precipitation was demonstrated after ultrafiltration on
permeate. This was not possible on the centrate since residual solids were hindering the precipitation.
During the demo operation in ES, precipitation of struvite from both centrate and permeate generated
through acidification of digestate were tested at longer term. It was demonstrated that it is possible
to produce struvite from the two types of water, however lower P removal efficiencies were
encountered with centrate (about 60% recovery). Additionally, during the long term ES operation, the
struvite product was analysed in terms of crystals determination through X-ray Diffraction, concluding
that struvite was present in the main samples. With centrate amorphous compounds were also
present.
Biological N removal (ES vs. NL)
In NL, there was insufficient time to start up the BNR process due to delays in the pilot operation
optimisation.
During the ES operation, the biological nitrogen removal reactor was operated as a Nitritation-
Denitritation system. It was demonstrated that in spite of design limitations, it was possible to operate
the BNR via nitrite leading to lower oxygen and therefore energy demand than a conventional
nitrification-denitrification system. Overall removal efficiencies are about 65% removal of N-NH4+,
however the demo phase was not reached.

ManureEcoMine: Green fertilizer upcycling from manure: Technological, economic and environmental sustainability demonstration (ENV.2013.6.3-2/603744) – Grant agreement no. 603744
63
Deliverable 4.2. Demonstrative operation ES: Performance of the pilot including trace
contaminants with comparison to the NL demonstration results
8. COMPARISON OF TRACE CONTAMINATION AND
MIGRATION AT THE PILOT PLANT IN THE NETHERLANDS
AND IN SPAIN
8.1. Antibiotics
Raw manure contamination
The main results of the input screening yielded the following differences:
- In Spain a mix of cow manure and pig manure were applied, in the Netherlands pig manure
was applied only.
- In Spain the screening resulted in 6 antibiotics detected, in the Netherlands 9 antibiotics were
detected above the limit of quantitation (LOQ).
- The total daily mass of all antibiotics in ES (approximately 2g/d) exceeded the total daily mass
in NL (approximately 0.2 g/d) by factor 8 considering the difference of hydraulic load.
- In both cases Doxycycline was the major component.
- In ES Lyncomycin showed very high concentrations.
- In NL Oxytetracycline showed relatively high concentrations.
Further details are given in Table 8.
Table 8. Concentration and mass flow of the antibiotics in NL and ES.
Process
Mass Flow Design Estimation kg/d 150 85% 127.5 kg/d 125 95% 118.75
Inp
ut
Min
.
Max
.
Ave
rage
Me
dia
n
Inp
ut
Min
.
Max
.
Ave
rage
Me
dia
n
Veterinary drugs (µg/kg) LOD
LOQ
µg/
d
µg/
kg
µg/
kg
µg/
kg
µg/
kg
µg/
d
µg/
kg
µg/
kg
µg/
kg
µg/
kg
Chlortetracyclin 1 5 144 1.13 1.13 1.13 1.13
Doxycyclin 1 5 151939 203 2578 1192 794 1502363 4957 25752 12651 7246
Enrofloxacin 5 10 179.8 1.41 1.41 1.41 1.41 43132 160.0 566.5 363 363.2
Flumequin 1 5 6193 17.8 87.1 48.6 40.7
Lincomycin 0.5 1 1470 1.19 30.3 11.5 3.07 459478 391.8 10180 3869 1036
Oxytetracyclin 1 5 14901 14.9 436 117 36.9 6044 6.8 99.9 50.9 46.0
Marbofloxacin 1 5 1036 3.8 13.6 8.7 8.7
Sulfadiazin 0.5 1 726 1.62 11.2 5.698 5.54 129 0.8 1.4 1.1 1.1
Sulfadoxin 0.5 1 115 0.85 0.96 0.91 0.91
Tetracyclin 1 5 6292 49.4 49.4 49.4 49.4
Sample Name MANURE
ESNL
MANURE MIX
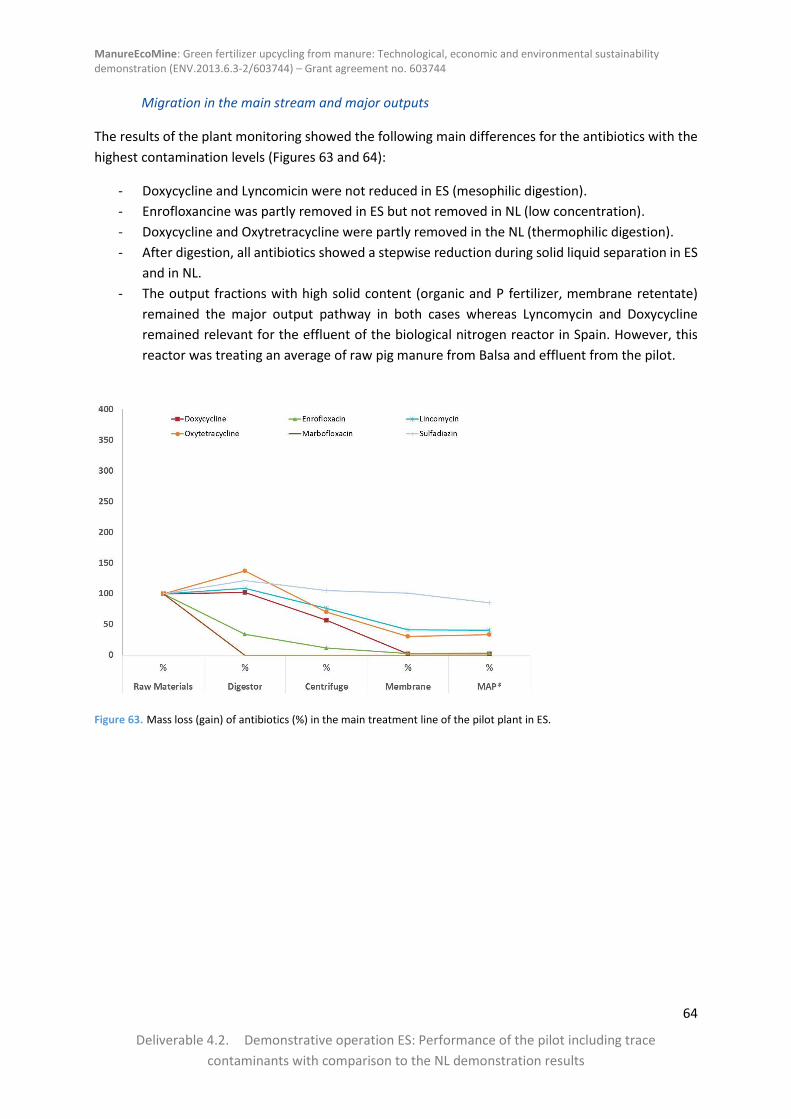
ManureEcoMine: Green fertilizer upcycling from manure: Technological, economic and environmental sustainability demonstration (ENV.2013.6.3-2/603744) – Grant agreement no. 603744
64
Deliverable 4.2. Demonstrative operation ES: Performance of the pilot including trace
contaminants with comparison to the NL demonstration results
Migration in the main stream and major outputs
The results of the plant monitoring showed the following main differences for the antibiotics with the
highest contamination levels (Figures 63 and 64):
- Doxycycline and Lyncomicin were not reduced in ES (mesophilic digestion).
- Enrofloxancine was partly removed in ES but not removed in NL (low concentration).
- Doxycycline and Oxytretracycline were partly removed in the NL (thermophilic digestion).
- After digestion, all antibiotics showed a stepwise reduction during solid liquid separation in ES
and in NL.
- The output fractions with high solid content (organic and P fertilizer, membrane retentate)
remained the major output pathway in both cases whereas Lyncomycin and Doxycycline
remained relevant for the effluent of the biological nitrogen reactor in Spain. However, this
reactor was treating an average of raw pig manure from Balsa and effluent from the pilot.
Figure 63. Mass loss (gain) of antibiotics (%) in the main treatment line of the pilot plant in ES.

ManureEcoMine: Green fertilizer upcycling from manure: Technological, economic and environmental sustainability demonstration (ENV.2013.6.3-2/603744) – Grant agreement no. 603744
65
Deliverable 4.2. Demonstrative operation ES: Performance of the pilot including trace
contaminants with comparison to the NL demonstration results
Figure 64. Mass loss (gain) of antibiotics (%) in the main treatment line of the pilot plant in NL.
Mass balances
The details on the mass balances for antibiotics in ES and NL are presented in the Tables 9 and 10. The
input mass at the MAP stage in ES showed inconsistencies in comparison to the preceding steps
(centrifuge /membrane). To be able to estimate migration behaviour in ES as presented above, the
MAP stage results have been normalized and the resulting reductions have been added as % changes
to the preceding steps.
Table 9. Mass balance for the antibiotics in ES.
Process Feed
Flow Input Stream Balance Output Stream Balance Input Stream Balance Input Output Output Balance in struvite
Sam
ple
Raw
Mat
eri
als
Dig
est
ate
Cak
e
Ce
ntr
ate
Pe
rme
ate
Stru
vite
Effl
ue
nt
Vet drugs µg/d µg/d % µg/d µg/d % µg/d % µg/d µg/d %
Chlortetracycline 1376 0.00 -100 0.00 0.00 0 0.00 0.00 0 0.00 0.00 0.00 0 0
Ciprofloxacin 23635 0.00 -100 660 0.00 0 0.00 0.00 0 0.00 0.00 0.00 0 0
Doxycycline 1427259 1458917 2 371046 972752 -33.3 817002 29936 -96 1227444 5203 1317286 7 -0.4
Enrofloxacin 40975 13904 -66 8140 4518 -67.5 4902 1052 -79 5585 299 6861 23 -5.3
Flumequin 3312 0.00 -100 0.00 0.00 0 0.00 0.00 0 0.00 0.00 0.00 0 0
Lincomycin 436504 476024 9 57149 300815 -36.8 332346 180623 -46 136649 1819 134661 -1 -1.3
Oxytetracycline 5742 7882 37 4372 3602 -54.3 4041 1763 -56 3136 0.00 3424 9 0
Marbofloxacin 984 0.00 -100 0.00 0.00 0 0.00 0.00 0 0.00 0.00 0.00 0 0
Sulfadiazin 122 148 21 0.00 0.00 -100 129 123 -4 1941 0.00 1640 -16 0
Sulfadoxin 0 0 0 0 0 0 0 0 0 0 0 0 0 0
Tetracyclin 0 0 0 0 0 0 0 0 0 0 0 0 0 0
Digestion Centrifuge Membrane MAP
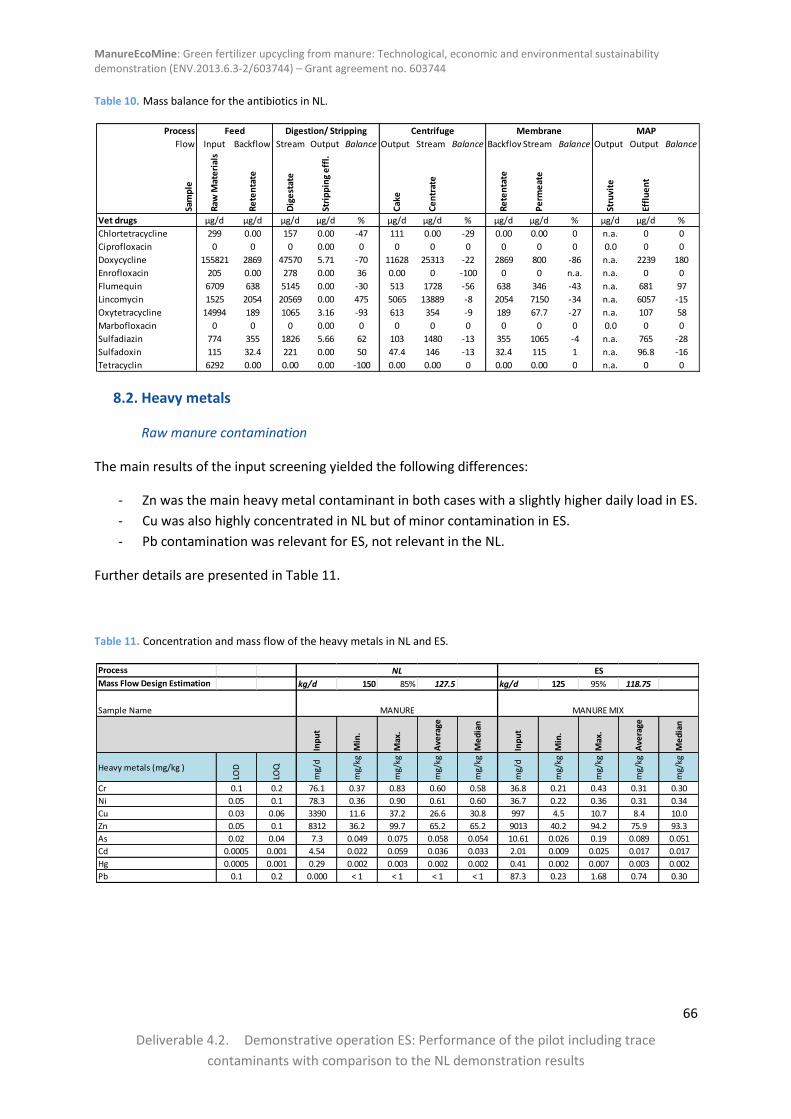
ManureEcoMine: Green fertilizer upcycling from manure: Technological, economic and environmental sustainability demonstration (ENV.2013.6.3-2/603744) – Grant agreement no. 603744
66
Deliverable 4.2. Demonstrative operation ES: Performance of the pilot including trace
contaminants with comparison to the NL demonstration results
Table 10. Mass balance for the antibiotics in NL.
8.2. Heavy metals
Raw manure contamination
The main results of the input screening yielded the following differences:
- Zn was the main heavy metal contaminant in both cases with a slightly higher daily load in ES.
- Cu was also highly concentrated in NL but of minor contamination in ES.
- Pb contamination was relevant for ES, not relevant in the NL.
Further details are presented in Table 11.
Table 11. Concentration and mass flow of the heavy metals in NL and ES.
Process
Flow Input Backflow Stream Output Balance Output Stream Balance BackflowStream Balance Output Output Balance
Sam
ple
Raw
Mat
eri
als
Re
ten
tate
Dig
est
ate
Stri
pp
ing
eff
l.
Cak
e
Ce
ntr
ate
Re
ten
tate
Pe
rme
ate
Stru
vite
Effl
ue
nt
Vet drugs µg/d µg/d µg/d µg/d % µg/d µg/d % µg/d µg/d % µg/d µg/d %
Chlortetracycline 299 0.00 157 0.00 -47 111 0.00 -29 0.00 0.00 0 n.a. 0 0
Ciprofloxacin 0 0 0 0.00 0 0 0 0 0 0 0 0.0 0 0
Doxycycline 155821 2869 47570 5.71 -70 11628 25313 -22 2869 800 -86 n.a. 2239 180
Enrofloxacin 205 0.00 278 0.00 36 0.00 0 -100 0 0 n.a. n.a. 0 0
Flumequin 6709 638 5145 0.00 -30 513 1728 -56 638 346 -43 n.a. 681 97
Lincomycin 1525 2054 20569 0.00 475 5065 13889 -8 2054 7150 -34 n.a. 6057 -15
Oxytetracycline 14994 189 1065 3.16 -93 613 354 -9 189 67.7 -27 n.a. 107 58
Marbofloxacin 0 0 0 0.00 0 0 0 0 0 0 0 0.0 0 0
Sulfadiazin 774 355 1826 5.66 62 103 1480 -13 355 1065 -4 n.a. 765 -28
Sulfadoxin 115 32.4 221 0.00 50 47.4 146 -13 32.4 115 1 n.a. 96.8 -16
Tetracyclin 6292 0.00 0.00 0.00 -100 0.00 0.00 0 0.00 0.00 0 n.a. 0 0
Feed Digestion/ Stripping Centrifuge Membrane MAP
Process
Mass Flow Design Estimation kg/d 150 85% 127.5 kg/d 125 95% 118.75
Inp
ut
Min
.
Max
.
Ave
rage
Me
dia
n
Inp
ut
Min
.
Max
.
Ave
rage
Me
dia
n
Heavy metals (mg/kg )
LOD
LOQ
mg/
d
mg/
kg
mg/
kg
mg/
kg
mg/
kg
mg/
d
mg/
kg
mg/
kg
mg/
kg
mg/
kg
Cr 0.1 0.2 76.1 0.37 0.83 0.60 0.58 36.8 0.21 0.43 0.31 0.30
Ni 0.05 0.1 78.3 0.36 0.90 0.61 0.60 36.7 0.22 0.36 0.31 0.34
Cu 0.03 0.06 3390 11.6 37.2 26.6 30.8 997 4.5 10.7 8.4 10.0
Zn 0.05 0.1 8312 36.2 99.7 65.2 65.2 9013 40.2 94.2 75.9 93.3
As 0.02 0.04 7.3 0.049 0.075 0.058 0.054 10.61 0.026 0.19 0.089 0.051
Cd 0.0005 0.001 4.54 0.022 0.059 0.036 0.033 2.01 0.009 0.025 0.017 0.017
Hg 0.0005 0.001 0.29 0.002 0.003 0.002 0.002 0.41 0.002 0.007 0.003 0.002
Pb 0.1 0.2 0.000 < 1 < 1 < 1 < 1 87.3 0.23 1.68 0.74 0.30
NL ES
MANURE MANURE MIXSample Name

ManureEcoMine: Green fertilizer upcycling from manure: Technological, economic and environmental sustainability demonstration (ENV.2013.6.3-2/603744) – Grant agreement no. 603744
67
Deliverable 4.2. Demonstrative operation ES: Performance of the pilot including trace
contaminants with comparison to the NL demonstration results
Migration in the main stream and major outputs
The results of the pilot plant monitoring showed the following main differences for the heavy metals
with the highest contamination levels (Figures 65 and 66):
- Despite a reduction of Zn and Cu after digestion of about 10% (data uncertainties) it can be
assumed that they remained in the main stream during this step.
- Cr showed some accumulation effect in the digester but at relatively low concentration levels,
probably again biased by data uncertainties.
- The solid/liquid separation led to a stepwise reduction in both cases, again pointing at the solid
streams as main output fraction.
- The final effluent contamination seemed to be higher for some of the compounds in ES than
in the NL, this could be attributed to a certain mobilisation by acidification.
Figure 65. Mass losses (gain) of heavy metals (%) in the main treatment line of the pilot plant in ES.

ManureEcoMine: Green fertilizer upcycling from manure: Technological, economic and environmental sustainability demonstration (ENV.2013.6.3-2/603744) – Grant agreement no. 603744
68
Deliverable 4.2. Demonstrative operation ES: Performance of the pilot including trace
contaminants with comparison to the NL demonstration results
Figure 66. Mass losses (gain) of heavy metals (%) in the main treatment line of the pilot plant in NL.
Mass balances
The details on the mass balances for heavy metals in ES and the NL are presented in the Tables 12 and
13.
Table 12. Mass balance for the heavy metals in ES.
Process Feed
Flow Input Stream Balance Output Stream Balance Input Stream Balance Input Output Output Balance in struvite
Sam
ple
Raw
Mat
eri
als
Dig
est
ate
Cak
e
Ce
ntr
ate
Pe
rme
ate
Stru
vite
Effl
ue
nt
Heavy metals mg/d mg/d % mg/d mg/d % mg/d % mg/d mg/d %
Cr 35 64.2 84 59.7 29.1 -55 39.5 5.78 -85 57.2 5.69 46.0 -20 -10
Ni 35 36.7 5 31.4 23.3 -37 21.6 13.0 -40 24.2 4.11 21.1 -13 -17
Cu 947 837.3 -12 285.7 425.9 -49 427 15.4 -96 315 68.7 322 2 -22
Zn 8574 7480 -13 2133 4540 -39 3213 702.1 -78 2200 378 1916 -13 -17
As 10 5.54 -45 2.05 2.49 -55 2.60 0.00 -100 3.52 2.86 3.98 13 -81
Cd 2 2.10 10 0.68 1.17 -44 1.15 0.00 -100 0.73 0.15 0.70 -4 -20
Hg 0 0.36 -9 0.22 0.27 -24 0.28 0.00 -100 0.083 0.051 0.20 137 -61
Pb 83 53.8 -35 26.6 20.8 -61 20.3 0.00 -100 19.3 5.24 20.3 5 -27
Digestion Centrifuge Membrane MAP
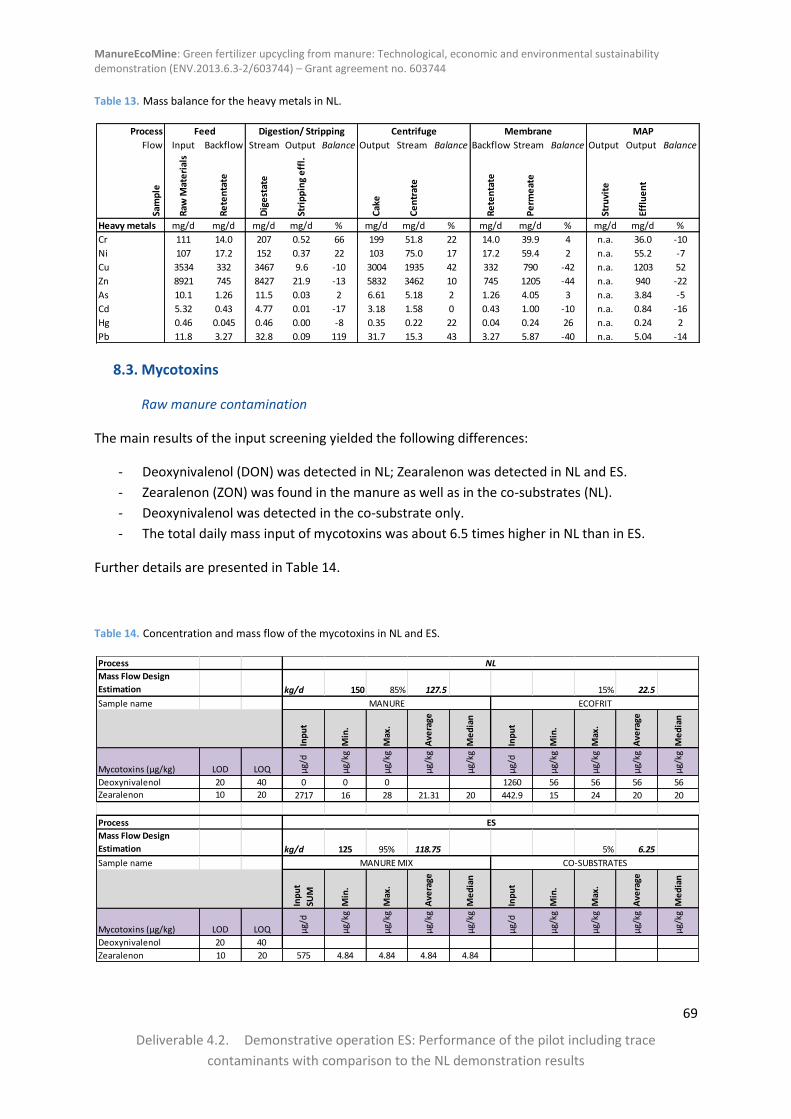
ManureEcoMine: Green fertilizer upcycling from manure: Technological, economic and environmental sustainability demonstration (ENV.2013.6.3-2/603744) – Grant agreement no. 603744
69
Deliverable 4.2. Demonstrative operation ES: Performance of the pilot including trace
contaminants with comparison to the NL demonstration results
Table 13. Mass balance for the heavy metals in NL.
8.3. Mycotoxins
Raw manure contamination
The main results of the input screening yielded the following differences:
- Deoxynivalenol (DON) was detected in NL; Zearalenon was detected in NL and ES.
- Zearalenon (ZON) was found in the manure as well as in the co-substrates (NL).
- Deoxynivalenol was detected in the co-substrate only.
- The total daily mass input of mycotoxins was about 6.5 times higher in NL than in ES.
Further details are presented in Table 14.
Table 14. Concentration and mass flow of the mycotoxins in NL and ES.
Process
Flow Input Backflow Stream Output Balance Output Stream Balance Backflow Stream Balance Output Output BalanceSa
mp
le
Raw
Mat
eri
als
Re
ten
tate
Dig
est
ate
Stri
pp
ing
eff
l.
Cak
e
Ce
ntr
ate
Re
ten
tate
Pe
rme
ate
Stru
vite
Effl
ue
nt
Heavy metals mg/d mg/d mg/d mg/d % mg/d mg/d % mg/d mg/d % mg/d mg/d %
Cr 111 14.0 207 0.52 66 199 51.8 22 14.0 39.9 4 n.a. 36.0 -10
Ni 107 17.2 152 0.37 22 103 75.0 17 17.2 59.4 2 n.a. 55.2 -7
Cu 3534 332 3467 9.6 -10 3004 1935 42 332 790 -42 n.a. 1203 52
Zn 8921 745 8427 21.9 -13 5832 3462 10 745 1205 -44 n.a. 940 -22
As 10.1 1.26 11.5 0.03 2 6.61 5.18 2 1.26 4.05 3 n.a. 3.84 -5
Cd 5.32 0.43 4.77 0.01 -17 3.18 1.58 0 0.43 1.00 -10 n.a. 0.84 -16
Hg 0.46 0.045 0.46 0.00 -8 0.35 0.22 22 0.04 0.24 26 n.a. 0.24 2
Pb 11.8 3.27 32.8 0.09 119 31.7 15.3 43 3.27 5.87 -40 n.a. 5.04 -14
Feed Digestion/ Stripping Centrifuge Membrane MAP
Process
Mass Flow Design
Estimation kg/d 150 85% 127.5 15% 22.5
Sample name
Inp
ut
Min
.
Max
.
Ave
rage
Me
dia
n
Inp
ut
Min
.
Max
.
Ave
rage
Me
dia
n
Mycotoxins (µg/kg) LOD LOQ µg/
d
µg/
kg
µg/
kg
µg/
kg
µg/
kg
µg/
d
µg/
kg
µg/
kg
µg/
kg
µg/
kg
Deoxynivalenol 20 40 0 0 0 1260 56 56 56 56
Zearalenon 10 20 2717 16 28 21.31 20 442.9 15 24 20 20
Process
Mass Flow Design
Estimation kg/d 125 95% 118.75 5% 6.25
Sample name
Inp
ut
SUM
Min
.
Max
.
Ave
rage
Me
dia
n
Inp
ut
Min
.
Max
.
Ave
rage
Me
dia
n
Mycotoxins (µg/kg) LOD LOQ µg/
d
µg/
kg
µg/
kg
µg/
kg
µg/
kg
µg/
d
µg/
kg
µg/
kg
µg/
kg
µg/
kg
Deoxynivalenol 20 40
Zearalenon 10 20 575 4.84 4.84 4.84 4.84
MANURE ECOFRIT
NL
CO-SUBSTRATES
ES
MANURE MIX
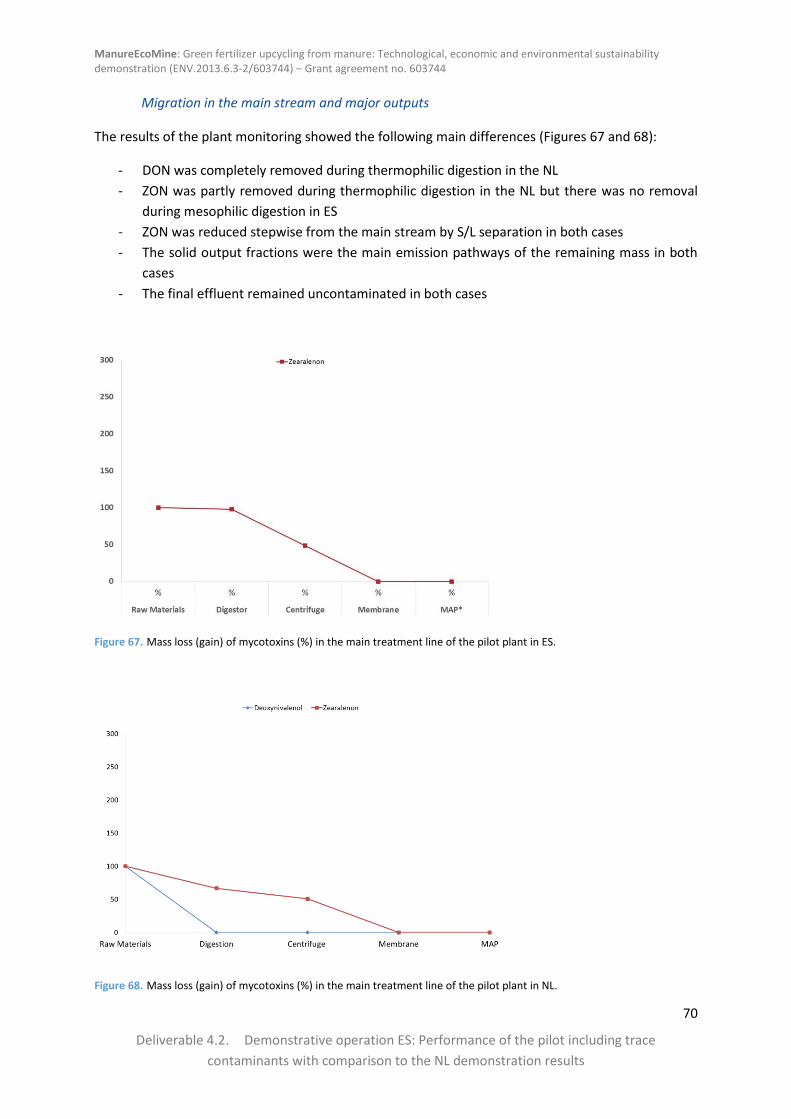
ManureEcoMine: Green fertilizer upcycling from manure: Technological, economic and environmental sustainability demonstration (ENV.2013.6.3-2/603744) – Grant agreement no. 603744
70
Deliverable 4.2. Demonstrative operation ES: Performance of the pilot including trace
contaminants with comparison to the NL demonstration results
Migration in the main stream and major outputs
The results of the plant monitoring showed the following main differences (Figures 67 and 68):
- DON was completely removed during thermophilic digestion in the NL
- ZON was partly removed during thermophilic digestion in the NL but there was no removal
during mesophilic digestion in ES
- ZON was reduced stepwise from the main stream by S/L separation in both cases
- The solid output fractions were the main emission pathways of the remaining mass in both
cases
- The final effluent remained uncontaminated in both cases
Figure 67. Mass loss (gain) of mycotoxins (%) in the main treatment line of the pilot plant in ES.
Figure 68. Mass loss (gain) of mycotoxins (%) in the main treatment line of the pilot plant in NL.

ManureEcoMine: Green fertilizer upcycling from manure: Technological, economic and environmental sustainability demonstration (ENV.2013.6.3-2/603744) – Grant agreement no. 603744
71
Deliverable 4.2. Demonstrative operation ES: Performance of the pilot including trace
contaminants with comparison to the NL demonstration results
Mass balances
The details on the mass balances for mycotoxins in ES and the NL are given in the Tables 15 and 16.
Table 15. Mass balance for the mycotoxins in ES.
Table 16. Mass balance for the mycotoxins in NL.
8.4. Pesticides and disinfectants
Raw manure contamination
The main results of the input screening yielded the following differences:
- Whereas in ES only disinfectants (BAC and DDAC) were detected, the NL Monitoring showed
additionally also three different pesticides.
- The load of disinfectants in the NL was about two times higher than in ES.
Further details are given in Table 17.
Process Feed
Flow Input Stream Balance Output Stream Balance Input Stream Balance Input Output Output Balance in struvite
Sam
ple
Raw
Mat
eri
als
Dig
est
ate
Cak
e
Ce
ntr
ate
Pe
rme
ate
Stru
vite
Effl
ue
nt
Vet drugs µg/d µg/d % µg/d µg/d % µg/d % µg/d µg/d %
Zearalenon 546 534 -2 333 0 -100 265 0 -100 0 0 0 0 0.0
Digestion Centrifuge Membrane MAP
Process Total
Flow Input Stream Stream Output Balance Output Stream Balance Backflow Stream Balance Output Output Balance Balance
Sam
ple
Raw
Mat
eri
als
Re
ten
tate
Dig
est
ate
Stri
pp
ing
eff
l.
Cak
e
Ce
ntr
ate
Re
ten
tate
Pe
rme
ate
Stru
vite
Effl
ue
nt
Mycotoxins µg/d µg/d µg/d µg/d % µg/d µg/d % µg/d µg/d % µg/d µg/d %
Deoxynivalenol 2100 0 0,0 0,0 -100 0,0 0,0 0 0 0 0 n.a. 0 0 -100
Zearalenon 5267 1100 4248 692 -22 1697 3239 16 1100 0 -66 n.a. 0 0 -55
Total 7367 1100 4248 692 -42 1697 3239 16 1100 0 -66 n.a. 0 0 -68
Centrifuge Membrane MAPDigestion/ StrippingFeed

ManureEcoMine: Green fertilizer upcycling from manure: Technological, economic and environmental sustainability demonstration (ENV.2013.6.3-2/603744) – Grant agreement no. 603744
72
Deliverable 4.2. Demonstrative operation ES: Performance of the pilot including trace
contaminants with comparison to the NL demonstration results
Table 17. Concentration and mass flow of the pesticides and disinfectants in NL and ES.
Migration in the main stream and major outputs
The results of the plant monitoring showed the following main differences (Figures 69 and 70):
- BAC and DDAC were slightly reduced during thermophilic digestion (NL) but remained
unchanged during mesophilic digestion (ES)
- The disinfectants were completely removed from the main stream in ES by S/L separation; a
small fraction remained in the main stream in NL
- The main pesticide detected in the NL plant (Piperonylbutoxid) was stepwise reduced during
all treatment stages in NL
- The solid products presented the main output stream of the remaining mass of disinfectants
and pesticides; the NL results showed some remaining contamination in the final effluent.
Process
Mass Flow Design
Estimation kg/d 150 85% 127.5 15% 22.5
Inp
ut
Min
.
Max
.
Ave
rage
Me
dia
n
Inp
ut
Min
.
Max
.
Ave
rage
Me
dia
n
Pesticides/QAC (mg/kg) LOD
LOQ
mg/
d
mg/
kg
mg/
kg
mg/
kg
mg/
kg
mg/
d
mg/
kg
mg/
kg
mg/
kg
mg/
kg
Total BAC 0.003 0.010 25.7 0.12 0.30 0.20 0.18 22.1 0.72 1.47 0.98 0.87
Chlorpropham 0.003 0.010 1.15 0.009 0.009 0.009 0.009 3.67 0.029 0.53 0.16 0.047
Cyprodinil 0.003 0.010 0.51 0.004 0.004 0.004 0.004
DDAC 0.003 0.010 23.6 0.018 0.34 0.18 0.17 11.2 0.38 0.68 0.50 0.47
Piperonylbutoxid 0.003 0.010 2.51 0.009 0.026 0.020 0.024 5.33 0.097 0.54 0.24 0.16
Process
Mass Flow Design
Estimation kg/d 125 95% 118.75 kg/d 5% 6.25
Inp
ut
Min
.
Max
.
Ave
rage
Me
dia
n
Inp
ut
Min
.
Max
.
Ave
rage
Me
dia
n
Pesticides/QAC (mg/kg) LOD
LOQ
mg/
d
mg/
kg
mg/
kg
mg/
kg
mg/
kg
mg/
d
mg/
kg
mg/
kg
mg/
kg
mg/
kg
Total BAC 0.003 0.010 9.50 0.080 0.080 0.080 0.080 3.51 0.26 0.86 0.56 0.56
Chlorpropham 0.003 0.010
Cyprodinil 0.003 0.010
DDAC 0.003 0.010 14.1 0.035 0.18 0.12 0.14
Piperonylbutoxid 0.003 0.010
MANURE MIX CO-SUBSTRATES
NL
ES
Sample Name
Sample Name MANURE ECOFRIT

ManureEcoMine: Green fertilizer upcycling from manure: Technological, economic and environmental sustainability demonstration (ENV.2013.6.3-2/603744) – Grant agreement no. 603744
73
Deliverable 4.2. Demonstrative operation ES: Performance of the pilot including trace
contaminants with comparison to the NL demonstration results
Figure 69. Mass loss (gain) of pesticides and disinfectants (%) in the main treatment line of the pilot plant in ES.
Figure 70. Mass loss (gain) of pesticides and disinfectants (%) in the main treatment line of the pilot plant in NL.

ManureEcoMine: Green fertilizer upcycling from manure: Technological, economic and environmental sustainability demonstration (ENV.2013.6.3-2/603744) – Grant agreement no. 603744
74
Deliverable 4.2. Demonstrative operation ES: Performance of the pilot including trace
contaminants with comparison to the NL demonstration results
Mass balances
The details on the mass balances for pesticides and disinfectants in ES and the NL are given in the
Tables 18 and 19.
Table 18. Mass balance for the pesticides and disinfectants in ES.
Table 19. Mass balance for the pesticides and disinfectants in NL.
Process Feed
Flow Input Stream Balance Output Stream Balance Input Stream Balance Input Output Output Balance in struvite
Sam
ple
Raw
Mat
eri
als
Dig
est
ate
Cak
e
Ce
ntr
ate
Pe
rme
ate
Stru
vite
Effl
ue
nt
Vet drugs mg/d mg/d % mg/d mg/d % mg/d % mg/d mg/d %
Total BAC 9.20 8.85 -4 4.16 3.56 -60 7.13 0.00 -100 0.000 0.11 0.00 0 0.0
DDAC 13.4 12.34 -8.1 6 4.86 -61 6.48 0.00 -100 0.82 0.19 0.00 -100 -22.7
Digestion Centrifuge Membrane MAP
Process Total
Flow Input Backflow Stream Output Balance Output Stream Balance Backflow Stream Balance Output Output Balance Balance
Sam
ple
Raw
Mat
eri
als
Re
ten
tate
Dig
est
ate
Stri
pp
ing
eff
l.
Cak
e
Ce
ntr
ate
Re
ten
tate
Pe
rme
ate
Stru
vite
Effl
ue
nt
Pesticides mg/d mg/d mg/d mg/d % mg/d mg/d % mg/d mg/d % mg/d mg/d % %
BAC-C12 56,7 15,8 57,5 0,0 -21 24,5 28,5 -8 15,8 5,6 -25 n.a. 11,9 111 -35,8
BAC-C14 22,8 6,2 20,5 0,0 -29 12,6 12,1 21 6,2 2,7 -26 n.a. 9,2 239 -4,0
Total BAC 79,8 22,0 78,0 0,0 -23 37,6 40,6 0 22,0 7,5 -27 n.a. 16,5 122 -32,2
Chlorpropham 8,0 3,6 27,3 0,1 136 15,9 6,4 -19 3,6 1,6 -20 n.a. 1,5 -3 117,5
Cyprodinil 0,9 0,0 1,3 0,0 47 0,2 0,7 -25 0,0 0,5 -39 n.a. 0,5 11 -17,6
DDAC 58,0 9,6 48,6 0,0 -28 31,8 20,5 8 9,6 5,9 -24 n.a. 0,0 -100 -45,2
Piperonylbutoxid 13,1 1,5 5,8 0,0 -60 4,2 2,5 16 1,5 0,0 -41 n.a. 0,0 0 -68,0
Total 239 59 239 0,1 -20 127 111 0 59 24 -26 n.a. 40 67 -30
Centrifuge Membrane MAPDigestion/ StrippingFeed
ManureEcoMine: Green fertilizer upcycling from manure: Technological, economic and environmental sustainability demonstration (ENV.2013.6.3-2/603744) – Grant agreement no. 603744
75
Deliverable 4.2. Demonstrative operation ES: Performance of the pilot including trace
contaminants with comparison to the NL demonstration results
9. REFERENCES
Angelidaki I, K. D. (2011). Biomethanation and its potential. Pubmed , 494:327.
Astals, S. V. N.-A.-A. (2012). Anaerobic co-digestion of pig manure and crude glycerol at mesophilic
conditions: Biogas and digestate. Bioresource Technology , 63–7Burton, C. (2007). The potential
contribution of separation technologies to the management of livestock manure. Livestock science ,
208–216.
Gerardi, M. H. (2003). The Microbiology of Anaerobic Digesters. New Jersey: Wiley-Interscience.
Hamed M. El-Mashad, G. Z. (2004). Effect of temperature and temperature fluctuation on thermophilic
anaerobic digestion of cattle manure. Bioresource Technology , 191–201.
Pind, P. F. Monitoring and control of anaerobic reactors.
Roboredo. (2012). Phosphorus dynamics in soils amended with acidified pig slurry and derived solid
fraction. Geoderma , 328–333.
Weiner R., Matthews, R. F. (2003). Environmental Engineering. Butterworth-Heinemann.