green efforts - cordis.europa.eu · green efforts green and effective operations at terminals and...
TRANSCRIPT

GREEN EFFORTS
Green and Effective Operations at Terminals and in Ports
FP7-285687
Deliverable 12.1
Recommendations Manual for Terminals
Organisation name of lead contractor for this deliverable: [Fraunhofer CML]
Due date of deliverable: [30/06/2014]
Actual submission date: [02/10/2014]
Call (part) identifier: FP7-SST-2011-RTD-1
Funding Scheme: Collaborative Project
Start date of project: 01/01/2012 Duration: 30 months
Revision: final
Project co-funded by the European Commission within the Seventh Framework Programme
(2007-2013)
Dissemination Level
PU Public X
PP Restricted to other programme participants (including the Commission Services)
RE Restricted to a group specified by the consortium (including the Commission Services)
CO Confidential, only for members of the consortium (including the Commission Services)

GREEN EFFORTS
EC Contract No. FP7-285687
Document Code: GREEN EFFORTS DELIVERABLE 12.1 Recommendations Manual for
Terminals
Date: [02/10/2014] Page 2
DOCUMENT INFORMATION
D 12.1
Recommendations Manual for Terminals
Contributing
Partners / Authors Consortium
Author(s): COMPILED AND EDITED BY JENS FROESE, SVENJA TÖTER, ILKNUR ERDOGAN
Issuing entity: JACOBS UNIVERSITY, FRAUNHOFER CML
Document Code: GREEN EFFORTS DELIVERABLE 12.1 Recommendations Manual for
Terminals
Date of Issue: 02/10/2014
Status: final
Revision:

GREEN EFFORTS
EC Contract No. FP7-285687
Document Code: GREEN EFFORTS DELIVERABLE 12.1 Recommendations Manual for
Terminals
Date: [02/10/2014] Page 3
RECORD OF CHANGES
This is a controlled document for any changes and amendments done for the deliverable.
Amendment shall be by whole document replacement.
Version Status Date Authorized by
1 Final 02.10.2014 JUB
Disclaimer The content of the publication herein is the sole responsibility of the publishers and it does not necessarily represent the views expressed by the European Commission or its services. While the information contained in the documents is believed to be accurate, the authors(s) or any other participant in the Green EFFORTS consortium make no warranty of any kind with regard to this material including, but not limited to the implied warranties of merchantability and fitness for a particular purpose. Neither the Green EFFORTS Consortium nor any of its members, their officers, employees or agents shall be responsible or liable in negligence or otherwise howsoever in respect of any inaccuracy or omission herein. Without derogating from the generality of the foregoing neither the Green EFFORTS Consortium nor any of its members, their officers, employees or agents shall be liable for any direct or indirect or consequential loss or damage
caused by or arising from any information advice or inaccuracy or omission herein.

GREEN EFFORTS
EC Contract No. FP7-285687
Document Code: GREEN EFFORTS DELIVERABLE 12.1 Recommendations Manual for
Terminals
Date: [02/10/2014] Page 4
Introduction The GREEN EFFORTS project, co-funded by the European Commission, after 30 months was concluded end of June 2014. There were very comprehensive terms of
reference which can be simplified by stating “GREEN EFFORTS aimed at making terminals and ports a better place to work and to live with” as carbon footprint mitigation was the objective specified by the European Commission.
The project was a true challenge for mainly two reasons:
Port sustainability was and is an objective well supported by policy makers, the
industry, administrations and the public but there is some fuzziness how this
could be achieved in detail and ideas sometimes were quite divergent.
There is a tremendous lack of statistical process information.
The project, however, was very lucky to find industrial partners to cooperate, not only in Europe but especially in South America. At a later project stage United Nations
Economic Commission for Latin America and the Caribbean (UN ECLAC) in Santiago de Chile coordinated the support resulting in a large collection of consumption data.
As the focus of interests of ports and terminals, depending on the port model, usually
is different, also involvement of ports was searched for and mainly found in Singapore, Los Angeles and the European Ports of Antwerp and Hamburg. The RoRo
Port of Trelleborg and the inland navigation Port of Riesa (upper river Elbe) as consortium partners represented their special operational profile. However the majority of the project work aimed at container terminals as these are the biggest
representatives of the industry with the highest energy consumption.
Carbon footprint mitigation at terminals and in ports directly depends on energy
consumption. Not every port and terminal manager might be equally motivated to reduce the carbon footprint, being concerned of the costs this might cause. It is, however, much easier to find fellow campaigner for greener ports and terminals once
energy savings and mitigation costs can become positively balanced. The economy of potential solutions therefore was a constant requirement during the course of the
project.
The wide scope of GREEN EFFORTS did not allow for in depth research as resources
were restricted. However the project was able to deliver a rather comprehensive overview of opportunities to achieve improved energy-efficiency and hence to provide a useful platform to focus further research according to industrial needs, available
solutions and political objectives.
This report is a compilation of the project deliverables and shall serve as a navigation
tool to identify areas of interest without being forced to dig through big piles of paper. Provided references then guide further into the details of interest.
There is currently a high uncertainty amongst the terminal operators to find the most
promising direction into the future. Terminal handling equipment requires high investments and should produce revenues for about 20 years. Staying with diesel-
GREEN EFFORTS
EC Contract No. FP7-285687
Document Code: GREEN EFFORTS DELIVERABLE 12.1 Recommendations Manual for
Terminals
Date: [02/10/2014] Page 5
fuelled equipment or consequently aiming at a full electric terminal therefore is a very crucial issue for terminal planning. GREEN EFFORTS recommends the European terminal industry to raise the level of pre-competitiveness and increase data
exchange. Of course there is a fierce competition amongst the terminals but they all would gain if this could commence at a higher level of knowledge and experience. A
data bank collecting all operational experiences would immediately multiply the development speed not forcing everybody to start from scratch. It also would support joint working groups to negotiate the course of future development with the
equipment manufacturers to lead both parties to a win-win result. After so many years with relatively slow technical developments, current automation requirements
are powerful innovation drivers shifting the focus from mechanics to information and (data) communication technologies.
Also port authorities are searching for their future profile in relation to energy-efficiency and emissions. Optimum solutions to exploit regenerative energies and to manage port smart grids requires orchestration activities currently not part of the
portfolio of most authorities.
The GREEN EFFORTS project ended far from solving all problems but it hopefully rose
the awareness for both, emission problems and energy-saving opportunities. Europe does not call the tune when it comes to size of terminal operators but why not targeting to be the innovation leader?

GREEN EFFORTS
EC Contract No. FP7-285687
Document Code: GREEN EFFORTS DELIVERABLE 12.1 Recommendations Manual for
Terminals
Date: [02/10/2014] Page 6
Content ENERGY CONSUMPTION ........................................................................................... 7
SIMULATION ...................................................................................................... 15
ENERGY SUPPLY .................................................................................................. 19
ENERGY MANAGEMENT .......................................................................................... 33
CONTEXT TO TRANSPORT CHAIN .............................................................................. 43
VISION OF ENERGY-EFFICIENT TERMINALS .................................................................. 48
RECOMMENDATIONS FOR STANDARDISATION - CALCULATION AND DECLARATION OF ENERGY CONSUMPTION AND
GHG EMISSIONS ON TERMINALS ......................................................................................................... 53

Energy Consumption
Juergen Moser, Indah Lengkong, Harry Geerlings, Ron van Duin, Tiuri van Rossum, Robert Heij, Jens
Froese

Page ii
Table of Contents
LIST OF ABBREVIATIONS /GLOSSARY ........................................................................... ii
1 Container Terminal Consumers ...................................................................... 1
1.1 Measures to reduce energy consumption ...................................................... 2
2 A methodology to calculate the CO2 ............................................................... 3
2.1 Outcomes ................................................................................................. 5
LIST OF ABBREVIATIONS /GLOSSARY
AGV(s) Automated Guided Vehicle(s)
CEN European Committee for Standardization (French: Comité Européen de Normalisation)
CO2 Carbon dioxide
ECH Empty Container Handler
EU European Union
GHG Greenhouse Gas(es)
H Hydrogen
Hr Hour(s)
IMF International Monetary Fund
kWh Kilowatt hour (measure of electrical energy over one hour)
LED Light emitting diode
LNG Liquid Natural Gas
Lt Liter Diesel
M Meter(s)
OECD Organisation for Economic Co-operation and Development
QC Quay Crane (= Ship-to-Shore crane)
RMG Rail Mounted Gantry
RMS Reefer Monitoring system
RS Reach Stacker
RTG Rubber Tyred Gantry
TJ Terajoule(s)
VC Van Carrier (= Straddle Carrier)
W Watt(s)
YT Yard Tractor (=Terminal Tractor)
Page 1
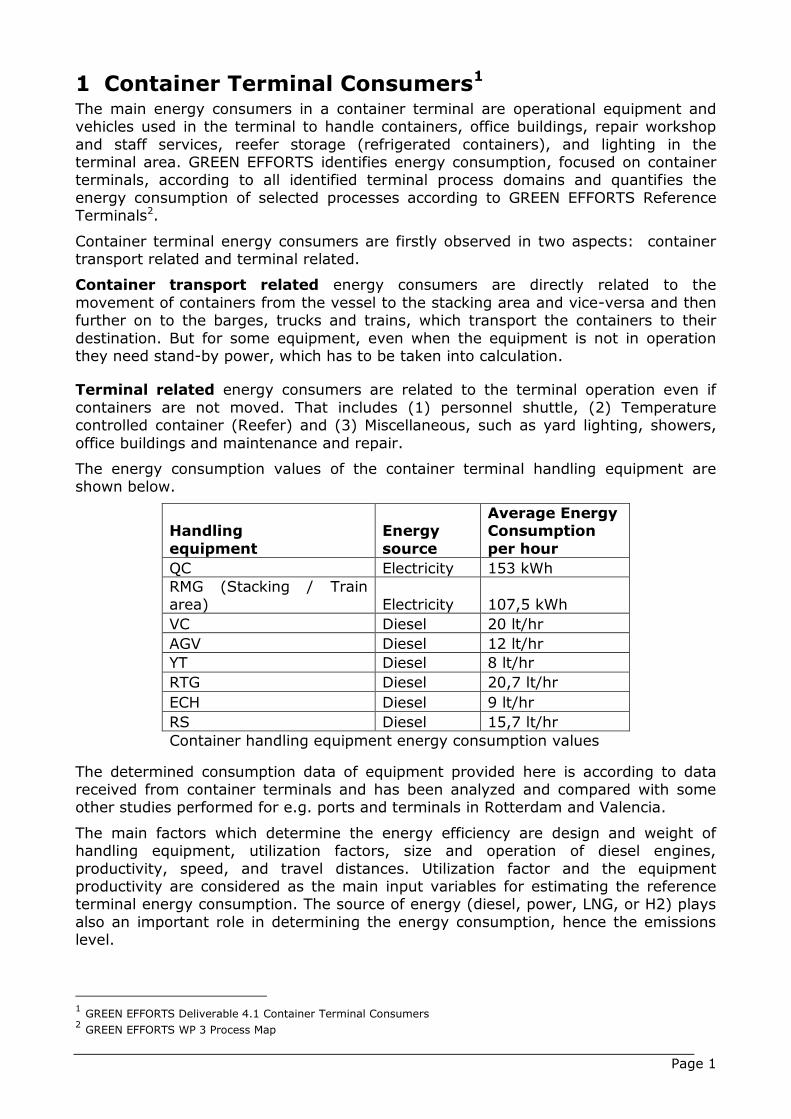
1 Container Terminal Consumers1 The main energy consumers in a container terminal are operational equipment and vehicles used in the terminal to handle containers, office buildings, repair workshop
and staff services, reefer storage (refrigerated containers), and lighting in the terminal area. GREEN EFFORTS identifies energy consumption, focused on container terminals, according to all identified terminal process domains and quantifies the
energy consumption of selected processes according to GREEN EFFORTS Reference Terminals2.
Container terminal energy consumers are firstly observed in two aspects: container transport related and terminal related.
Container transport related energy consumers are directly related to the
movement of containers from the vessel to the stacking area and vice-versa and then further on to the barges, trucks and trains, which transport the containers to their
destination. But for some equipment, even when the equipment is not in operation they need stand-by power, which has to be taken into calculation.
Terminal related energy consumers are related to the terminal operation even if
containers are not moved. That includes (1) personnel shuttle, (2) Temperature controlled container (Reefer) and (3) Miscellaneous, such as yard lighting, showers,
office buildings and maintenance and repair.
The energy consumption values of the container terminal handling equipment are shown below.
Handling
equipment
Energy
source
Average Energy Consumption
per hour
QC Electricity 153 kWh
RMG (Stacking / Train
area) Electricity 107,5 kWh
VC Diesel 20 lt/hr
AGV Diesel 12 lt/hr
YT Diesel 8 lt/hr
RTG Diesel 20,7 lt/hr
ECH Diesel 9 lt/hr
RS Diesel 15,7 lt/hr
Container handling equipment energy consumption values
The determined consumption data of equipment provided here is according to data received from container terminals and has been analyzed and compared with some other studies performed for e.g. ports and terminals in Rotterdam and Valencia.
The main factors which determine the energy efficiency are design and weight of handling equipment, utilization factors, size and operation of diesel engines,
productivity, speed, and travel distances. Utilization factor and the equipment productivity are considered as the main input variables for estimating the reference terminal energy consumption. The source of energy (diesel, power, LNG, or H2) plays
also an important role in determining the energy consumption, hence the emissions level.
1 GREEN EFFORTS Deliverable 4.1 Container Terminal Consumers 2 GREEN EFFORTS WP 3 Process Map
Page 2
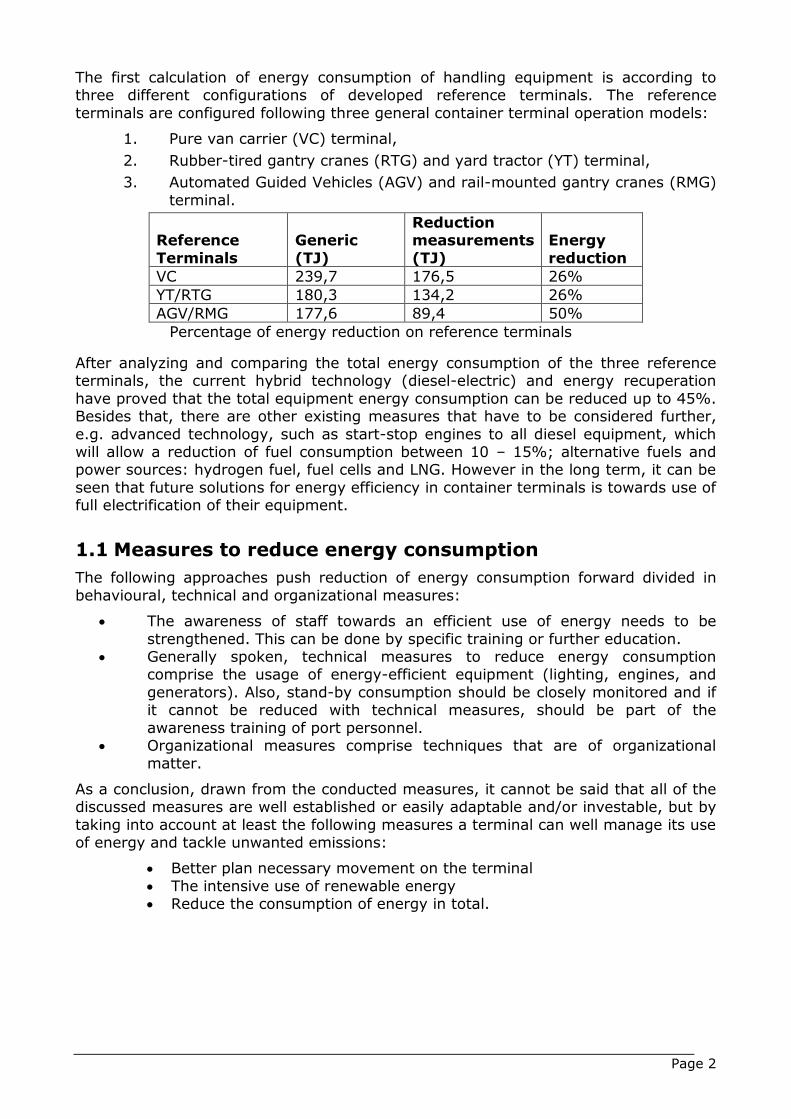
The first calculation of energy consumption of handling equipment is according to three different configurations of developed reference terminals. The reference
terminals are configured following three general container terminal operation models:
1. Pure van carrier (VC) terminal,
2. Rubber-tired gantry cranes (RTG) and yard tractor (YT) terminal,
3. Automated Guided Vehicles (AGV) and rail-mounted gantry cranes (RMG)
terminal.
Reference
Terminals
Generic
(TJ)
Reduction measurements
(TJ)
Energy
reduction
VC 239,7 176,5 26%
YT/RTG 180,3 134,2 26%
AGV/RMG 177,6 89,4 50%
Percentage of energy reduction on reference terminals
After analyzing and comparing the total energy consumption of the three reference terminals, the current hybrid technology (diesel-electric) and energy recuperation
have proved that the total equipment energy consumption can be reduced up to 45%. Besides that, there are other existing measures that have to be considered further,
e.g. advanced technology, such as start-stop engines to all diesel equipment, which will allow a reduction of fuel consumption between 10 – 15%; alternative fuels and power sources: hydrogen fuel, fuel cells and LNG. However in the long term, it can be
seen that future solutions for energy efficiency in container terminals is towards use of full electrification of their equipment.
1.1 Measures to reduce energy consumption
The following approaches push reduction of energy consumption forward divided in
behavioural, technical and organizational measures:
The awareness of staff towards an efficient use of energy needs to be
strengthened. This can be done by specific training or further education. Generally spoken, technical measures to reduce energy consumption
comprise the usage of energy-efficient equipment (lighting, engines, and
generators). Also, stand-by consumption should be closely monitored and if it cannot be reduced with technical measures, should be part of the
awareness training of port personnel. Organizational measures comprise techniques that are of organizational
matter.
As a conclusion, drawn from the conducted measures, it cannot be said that all of the discussed measures are well established or easily adaptable and/or investable, but by
taking into account at least the following measures a terminal can well manage its use of energy and tackle unwanted emissions:
Better plan necessary movement on the terminal
The intensive use of renewable energy Reduce the consumption of energy in total.
Page 3
2 A methodology to calculate the CO23 Within the GREEN EFFORTS project a new method is introduced for assessing energy
consumption from container terminals and in extension the CO2-emissions. First, a methodology to calculate the energy consumption has been constructed, and then the method has been applied to generic terminal equipment.
It is an innovative top-down approach to calculate the CO2-emissions of terminals. This methodology is named ‘the 6-step-approach’. This approach can be considered
as an easy applicable tool to get a brief and coherent overview of the total energy consumption of a terminal.
The methodology consists of 6 steps: 1- Operations on the terminal (what is actually happening?)
2- Construction of an analytical model of activities 3- Development of an algorithm based on the analytical model 4- Application of the model (preferably with real data, presently mostly based on
estimations) 5- Valorization of the outcomes of the model
6- Policy recommendations The structure of the’6-step-approach’ is based on three clusters of sub-modules of
processes that cover more than 95% of all energy consumption at the terminal. Each cluster is supported by a software tool and a data base which makes it possible to
calculate the energy consumption of one specific terminal or to benchmark more terminals in a systematic way. The three modules combined are presented in figure below:
3 GREEN EFFORTS deliverable 4.2 A top-down methodology to calculate the CO2—footprint for terminal operations;
the 6-step approach
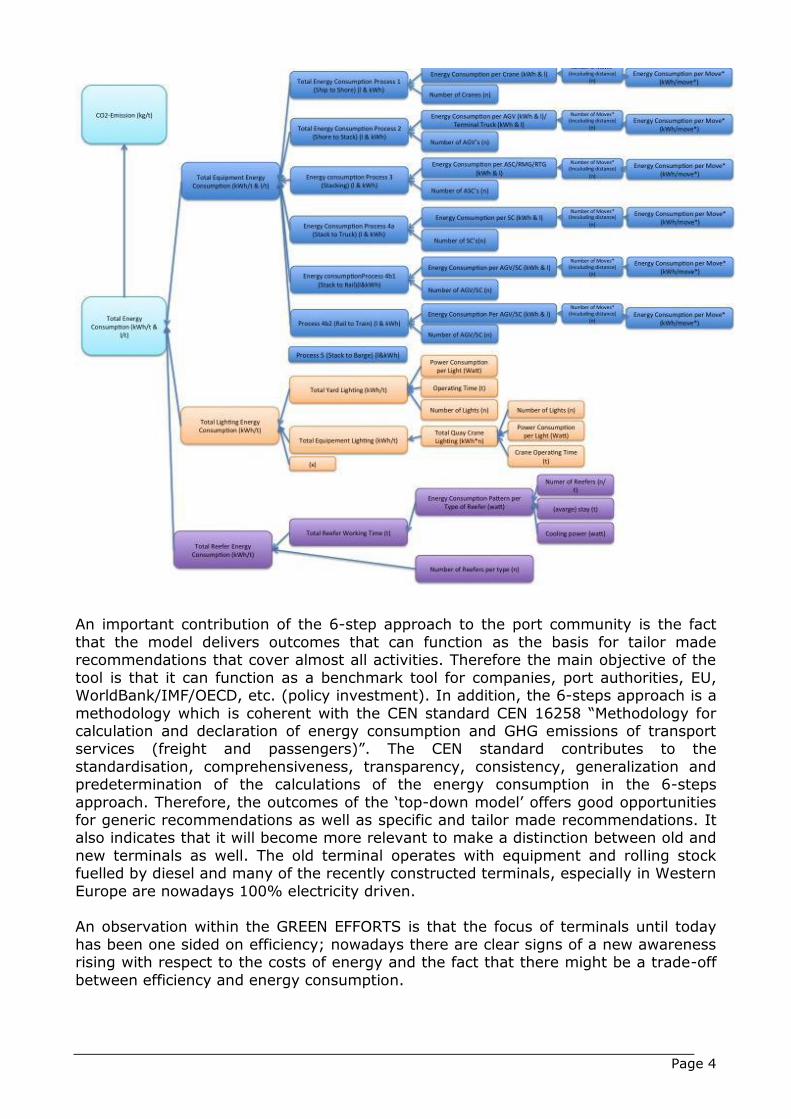
Page 4
An important contribution of the 6-step approach to the port community is the fact
that the model delivers outcomes that can function as the basis for tailor made recommendations that cover almost all activities. Therefore the main objective of the
tool is that it can function as a benchmark tool for companies, port authorities, EU, WorldBank/IMF/OECD, etc. (policy investment). In addition, the 6-steps approach is a
methodology which is coherent with the CEN standard CEN 16258 “Methodology for calculation and declaration of energy consumption and GHG emissions of transport services (freight and passengers)”. The CEN standard contributes to the
standardisation, comprehensiveness, transparency, consistency, generalization and predetermination of the calculations of the energy consumption in the 6-steps
approach. Therefore, the outcomes of the ‘top-down model’ offers good opportunities for generic recommendations as well as specific and tailor made recommendations. It also indicates that it will become more relevant to make a distinction between old and
new terminals as well. The old terminal operates with equipment and rolling stock fuelled by diesel and many of the recently constructed terminals, especially in Western
Europe are nowadays 100% electricity driven. An observation within the GREEN EFFORTS is that the focus of terminals until today
has been one sided on efficiency; nowadays there are clear signs of a new awareness rising with respect to the costs of energy and the fact that there might be a trade-off
between efficiency and energy consumption.

Page 5
2.1 Outcomes
The 6-step approach is applied to three clusters, namely equipment, reefers and lighting and summary of outcomes and recommendations are as below:
Equipment Consumption:
Using alternative fuels. Blending biofuels can reduce the emissions of diesel fuel. But using electricity has the most potential. Electricity cannot only be
generated in a more clean way, but can also be recuperated by equipment. This makes the use of electricity a more energy efficient way of operating
equipment.
It is also recommended more efficient use of equipment. This means that idle
runs have to be minimized. One of the developments on this process is the use of double loading cycles of Quay Cranes.
This brings us also to the human factor in terminal operations. Most equipment
is still operated by humans and the way in which equipment is operated is
directly connected to the energy consumption of equipment. Therefore, good and regular driver training can make changes in driving behaviour.
Using energy management systems to operate load shifting and energy
balancing in smart grids can balance the energy consumption throughout the
terminal in a way that energy is used in an efficient way.
Reefer: Consumption of reefers depends on
Nature of cargo resulting in a closed cooling air system as e.g. for deep frozen
cargo or an air exchange process as e.g. for fruits
Setpoint temperature providing the required carriage temperature
Return air temperature resulting from cargo temperature and hence governing
the cooling demand to reach the carriage temperature
Ambient temperature
Sun radiation resulting in reefer body surface temperature higher than ambient
temperature
Reefer size, the consumption of a 40’ container is about double that of a 20’
container
Reefer technology
Reefer status including airtightness of doors and ventilation openings and clean
ventilator systems.
Potential measures to reduce energy consumption
Reefer technology, which however can only be improved by the owners of the
reefers, i.e. shipping lines and leasing companies. Technical measures include
o Improved insulation, however insulation material must be certified for
global use
o Compressor systems with adaptive control
o Air fan systems with adaptive control
Sun protection roofs, preferably combined with photovoltaic panels, to avoid
direct sun radiation

Page 6
Minimizing unplugged periods during transhipment to avoid bigger differences
between setpoint temperature and return air temperature
Not accepting “hot cargo”, i.e. reefers not sufficiently pre-cooled and with cargo
not yet cooled down to carriage temperature
Opportunity to exploit regenerative energy once available
Regenerative energies are often volatile and not available once operation would
need it. For deep frozen reefers the time gap between availability and demand
can become bridged by “advanced cooling” i.e. lowering the setpoint
temperature by a few degrees during periods of availability and switch it back
to normal once regenerative energy supply ceases. This results in no energy
demand for the compressor for a longer period. The air fans will of course need
to operate. This procedure requires a suitable reefer monitoring system (RMS)
with the opportunity to apply computer-supported control of setpoint
temperatures according to availability of regenerative energies. The ideal
solution is to integrate the RMS into a terminal smart grid solution providing
optimized management of all electrical energy demand and supply on site.
Yard Lightning
More energy efficient lights should be used in terminals. Switching to LED
lighting can make significant progresses. LED’s can generate the same amount of light as conventional lights but use far less energy. A real case calculation for
the inland navigation terminal Riesa conventional lighting by High Pressure Sodium (HPS) floodlight resulted in a necessary power input of 24.600 W. The LED alternative calculated for a minimum light intensity of 20 lumen at a
maximum height of light posts of 37m resulted in energy savings of 57%4.
Improvements can also be made on organizational levels. Nowadays most terminals are fully illuminated which cost a lot of energy. It is recommended to make differentiations in the lighting of different areas, for instance only full
illumination for areas with work activities or sensor based lighting. This recommendation may interfere with security requirements but there can be
tailor made solutions like combining visible lighting with infrared lighting for monitoring.
References
GREEN EFFORTS, Dec 2013, Deliverable 4.1: Container Terminal Consumers
GREEN EFFORTS, Jul 2014, Deliverable 4.2: A top-down methodology to calculate the
CO2—footprint for terminal operations; the 6-step approach GREEN EFFORTS, 2012-2013, Work Package 3: Process Map
GREEN EFFORTS, Aug 2014, White Paper #08 Cool Roofs
GREEN EFFORTS, May 2014, White Paper #02a LED Technology for CT Riesa – Estimate of Saving Potential compared to HPS
4 GREEN EFFORTS White Paper #02a LED Technology for CT Riesa – Estimate of Saving Potential compared to HPS

Simulation
Reiner Buhl, Anne Schwientek, Svenja Toeter, Jens Froese

Page ii
Table of Contents
Simulation ........................................................................................................ 1
List of Abbreviations
KPI Key Performance Indicator
ED Enterprise Dynamics Developer
TOS Terminal Operating System
CHE Container Handling Equipment
ETA Estimated Time of Arrival
Page 1
Simulation The increasing need for information regarding terminals carbon footprint calculations as well as the lack of information on correlation between key performance indicators
(KPI) and parameters / decision are the key drivers in this field of research. So far, various approaches have been applied for simulating container terminals. Those have been used to validate decisions during late stages of planning processes. The high
complexity and the high computational effort of micro-simulations, in combination with the required number of simulation runs to statistically validate such analyses,
prevented extensive large scale studies. Additionally, the diversity of cargo RoRo / Ferry as well as Inland Waterway terminals are facing, has to be considered in the
simulation model as well.
Creating a mathematical model for complete terminal environments can be regarded as a highly complex process. In practice, such projects are usually implemented to
validate strategic decisions. In order to gain applicable results those models are tailored to the specific terminal requiring a tremendous amount of data.
To facilitate the process of determining a terminals carbon footprint as well as developing measures to reduce the terminals emissions, simulation models were developed in GREEN EFFORTS.
For Simulation, the Software Enterprise Dynamics Developer (ED) was used. The reason is that ED is widely used in the industry and developing models in ED is more
economic. Three micro-simulation models of port terminals were developed to answer different questions which are relevant for the industry: First, for the RoRo Port of Trelleborg, the amount of carbon dioxide emissions produced by external vehicles in
ferry port was determined. Second, the best dispatching strategy for horizontal transport and respective vehicle configuration was identified weighing financial,
operational and environmental criteria against each other for a non-existing example RTG Container terminal. In this case, significant saving or wasting potential was identified. Third, for an inland container terminal with restricted pre gate area the
amount of container trucks that can be handled per hour was determined. For the existing ports, recommendations are provided for future port development decisions.
To enhance validity, several trace analyses were conducted during the modelling processes to lower the probability of errors. Visualisation helped to track the behaviour of the simulation model during experiments.
It could be shown that with various measures energy consumption and resulting emissions can be reduced in port terminals. A very good way would be to include
modules for measuring and managing energy consumption in the used Terminal Operating System (TOS).
No container terminal could operate without the support of a TOS and the systems
currently in use are rather mature and offer various functionalities. However, there is still room for improvement to enhance energy efficiency and hence reduce costs and
emissions.
The GREEN EFFORTS catalogue for improvement comprises the following items
• Interoperability (not integration!) with container handling equipment (CHE)
tracking system to minimize traveling distances of vehicles and adjust speed of operation (“operation speed kills fuel economy”) according to actual needs
• Interoperability with berth planning system to stack containers to minimize re-stacking and movement distances over the whole box stay on the yard,
continuously adjusting to changes of estimated time of arrival (ETA) of vessels
• Forecast of cost of resources (container handling equipment , staff, time)

Page 2
• Real-time availability of information required for decision-making and disturbance-management
• Performance analysis to learn from conducted operation to improve yard and equipment strategy (reverse engineering).
Optimization of yard operation of course depends on working rules. When e.g. there is a “gang” system per crane in place, it is not possible to send a straddle carrier or
tractor where it is required most. The enhancement of TOS and the extension of interoperability with related systems usually require early involvement of job stewards and union representatives.
References
GREEN EFFORTS, Sep 2014, Deliverable 5.4: Report on modelling of energy consumption

Energy supply
Juergen Moser, Yogesh Agarwal, Reiner Buhl, Dania Hasberg, Habtamu Gebrewold, Juergen Sorgenfrei,
Diana Illing, Werner Bergholz, Alexander Baal

Page 1
Table of Contents
Introduction ...................................................................................................... 2
1 External supply of regenerative energies ......................................................... 3
2 Production of regenerative energy on site ........................................................ 4
3 Exploitation of Liquefied Natural Gas ............................................................... 8
3.1 LNG for ships and ports .............................................................................. 8
3.2 Alternative use of LNG in ports .................................................................... 9
4 Shore-based power supply ............................................................................ 9
4.1 Onshore electrical power supply ................................................................ 10
4.2 Vision: The integrated solution .................................................................. 12
List of Abbreviations
°C Grad Celsius
AGO Automobile Gas Oil (Diesel AGO)
C Carbon
CAPEX Capital Expenditure
CH4 Methane
CO2 Carbon dioxide
DF Dual-fuel
EU European Union
H Hydrogen
HFO Heavy Fuel Oil
HSFO High Sulphur Fuel Oil
HVDC High Voltage Direct Current
IEC International Electrotechnical Commission
IEEE Institute of Electrical and Electronics Engineers
IMO International Maritime Organization
ISO International Standards Organization
LNG Liquid Natural Gas
M Meter(s)
M2 Square Meter(s)
MDO Marine Diesel Oil (Diesel-like bunker fuel for ships)
NOx Nitrogen oxides
OPS Onshore power supply
PM Particulate matter
PV Photovoltaics
SOx Sulphur oxides

Page 2
Introduction
In this chapter regenerative energy has been elaborated in terms of external supply and possibilities to produce on site. Regenerative energy is a concept where the energy that would likely have been a waste (in form of sun, wind, geothermal, tidal,
etc.) is reused to minimize the dependency of fossil fuels. It is available in nearly all European states. What is important is that to negotiate with the power suppliers for
contracts with increased amount of regenerative power which will decrease directly the emissions of the terminals. Bundling of different consumers to create a common big consumer and building up a local distribution network are the key factors to
consider when it is about external supply of regenerative energy. Furthermore, there are several regenerative energies that can be produced onsite and then used in
terminals and ports. Different types of regenerative energies are detailed according to technical feasibility, maturity and efficiency.
Exploitation of LNG increased significantly throughout the last decades, is highly supported by the European policy and expected to become a significant market share.
Apart from being an alternative fuel for ships LNG can also be used as energy source for electric engines, running turbines, since the potential for electrification of port and terminal processes is considerably high with consideration to Methane that produces
considerably lower emissions than other fossil fuels but has a global warming potential about 23 times more than of carbon dioxide. Therefore, a 100% combustion is
essential which usually is only possible in gas turbines and not in piston motors.
A vision for an integrated solution of shore based power supply for berthed ships is presented: In a fully electric terminal with regenerative power generation on the
terminals wherever possible and a combined cycle power plant onshore fed by LNG/Methane. The surplus of regenerative power, which cannot be utilized, will be
transformed to Hydrogen and on to Methane, which can be stored and used for feeding the gas turbine when regenerative production is too weak. Therefore, the question for future is not whether LNG technique or electrical onshore power but an
integrated LNG technique and electrical onshore power supply.
The research and findings on energy supply has contributed to the development of
comprehensive and intelligent energy demand and supply management at terminals and in ports which shows opportunities of terminals and ports as power supply
providers to other (port) industries and to ships berthed.
Page 3
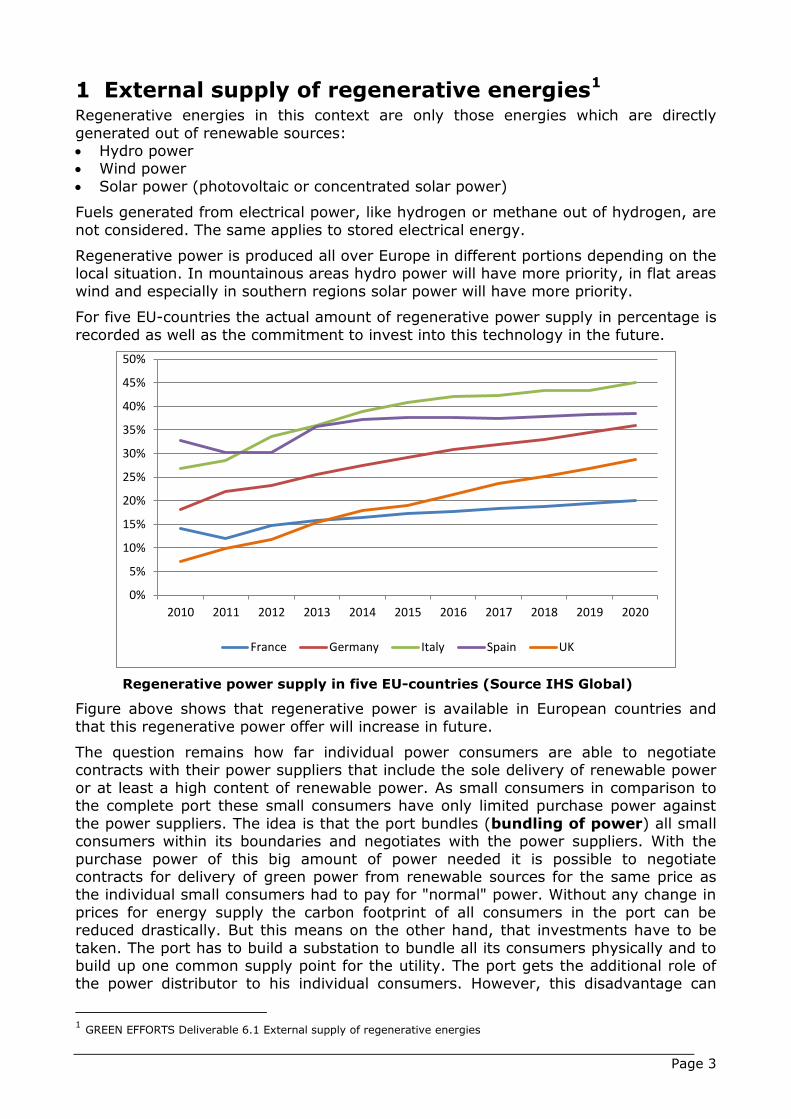
1 External supply of regenerative energies1 Regenerative energies in this context are only those energies which are directly
generated out of renewable sources: Hydro power Wind power
Solar power (photovoltaic or concentrated solar power)
Fuels generated from electrical power, like hydrogen or methane out of hydrogen, are
not considered. The same applies to stored electrical energy.
Regenerative power is produced all over Europe in different portions depending on the local situation. In mountainous areas hydro power will have more priority, in flat areas
wind and especially in southern regions solar power will have more priority.
For five EU-countries the actual amount of regenerative power supply in percentage is
recorded as well as the commitment to invest into this technology in the future.
Regenerative power supply in five EU-countries (Source IHS Global)
Figure above shows that regenerative power is available in European countries and
that this regenerative power offer will increase in future.
The question remains how far individual power consumers are able to negotiate contracts with their power suppliers that include the sole delivery of renewable power
or at least a high content of renewable power. As small consumers in comparison to the complete port these small consumers have only limited purchase power against
the power suppliers. The idea is that the port bundles (bundling of power) all small consumers within its boundaries and negotiates with the power suppliers. With the
purchase power of this big amount of power needed it is possible to negotiate contracts for delivery of green power from renewable sources for the same price as the individual small consumers had to pay for "normal" power. Without any change in
prices for energy supply the carbon footprint of all consumers in the port can be reduced drastically. But this means on the other hand, that investments have to be
taken. The port has to build a substation to bundle all its consumers physically and to build up one common supply point for the utility. The port gets the additional role of the power distributor to his individual consumers. However, this disadvantage can
1 GREEN EFFORTS Deliverable 6.1 External supply of regenerative energies
0%
5%
10%
15%
20%
25%
30%
35%
40%
45%
50%
2010 2011 2012 2013 2014 2015 2016 2017 2018 2019 2020
France Germany Italy Spain UK

Page 4
turn into an advantage in regard to emission reductions when different consumers start to generate own regenerative power. The production of regenerative energy is
fluctuating and often does not match with the power needs of the individual consumers. The port as power distributor can exchange this surplus of power to other
consumers, which at other times can deliver back their surplus of generated renewable power. So any surplus of green renewable power can be used inside the
port boundaries and in total reduces the overall emissions.
2 Production of regenerative energy on site2 In order to reduce the carbon footprint of container terminals, the on-site generation of electrical energy from renewable energy resources constitutes a
significant additional reduction potential, in addition to the strategy to increase the energy efficiency of the consumers of energy.
In ports and terminals, usage of fossil fuels by equipment and excessive reliance on power grids have increased dramatically because of the rise of global trade and with the aging of equipment; leading to the need to deploy alternative measures in form of
regenerative energies to counter the effect on environment and tariff bills (fuel and electrical) for the terminals. Thus, regenerative energy is a concept where the energy
that would likely have been a waste (in form of sun, wind, geothermal and tidal) is reused to minimize the dependency of fossil fuels. There are several regenerative energies that can be produced onsite and then used in terminals and ports.
The below given list of regenerative energy sources clearly shows that photovoltaic in areas with sufficient is a must, wind generators are recommended, however there are
doubts that it is terminal business, therefore the ports should deal with it. Furthermore biogas can be considered once condition and circumstances allow for a convincing business model.
Brief explanations about these regenerative energy sources are given below:
Photovoltaic3
In terms of ease of installation and maintenance, photovoltaics (PV) are clearly the most convenient way to generate renewable electric energy.
The only available “real estate” for the installation of PV modules is roofs in the
terminal, since other locations would be obstacles for container terminal operation. For the virtual reference terminal of the Green EFFORTS project these are, in the first place, the administration buildings and the maintenance building for the straddle
carriers, as displayed in below figure:
2 GREEN EFFORTS Deliverable 6.2 3 GREEN EFFORTS White paper#1, May 2014

Page 5
Admin buildings of the virtual container terminal with PV modules on the roofs. The maintenance building for the straddle carries is also suitable to a limited extent (modules not shown), since the shadow of the middle elevated roof part puts constrictions on to where PV modules can be installed (total area approx. 12 700 m2).
In addition it is feasible to install roofs over the space for the Reefer containers as
seen in below figure.
The reefer container area (white, approx 6000 m2) on the left in this picture is not covered by a roof. Installation of the roof would reduce the electric energy consumption for cooling because the containers would be shaded and additional space for the installation of PV modules would be available. There is also small existing roof (1998m2) near the reefer containers (far side of the block of containers)
PV technology is a convenient option to reduce the carbon footprint of a container
terminal. The unique property of Photovoltaics compared to all other renewable energy source is that it is virtually maintenance free and produces electrical energy
directly. Furthermore, it is environmentally benign (noise, looks, emissions, energy pay-back time). Moreover, it does not consume any real estate but can be installed on roofs that either exist or would make sense to construct in addition to existing roofs.
The question of choice regarding which of the renewable energy sources is the preferred one on a container terminal has been answered in the sense that due to the
reduction in the volatility of the renewable energy generation by using a combination of several renewable energy sources there may be a direct positive financial impact due to peak shaving (high peak power demand is expensive). Also, using more than
one source maximizes the reduction of the carbon footprint. Moreover, due to the decrease of the prices for PV modules and systems and the
increase in the prices for electric energy purchased from utility companies it can be safely predicted that the time for return of invest will get shorter and shorter.
Wind Energy4
Wind energy is defined as the energy that is obtained from kinetic energy of the wind
that moves across the earths’ surface. Wind then is converted into usable electrical energy in the wind turbine. The energy of motion (kinetic energy) of the air flow is an indirect form of solar energy and thus belongs to renewable energies. It is now almost
exclusively utilized by wind turbines. A rotor is set in rotation by the air flow, which in turn drives a power generator using the rotary axis. The use of wind energy especially
in coastal areas and in upland areas has risen steadily in recent years5.
Below factors needs to be taken into account when deciding to erect a wind power plant on ports’ or terminals’ premises:
Port engineering aspects; such as navigation and hydraulic aspects, structural, environmental and operational constraints
Electrical aspects; such as cabling and connection to the grid Economic and financial aspects; such as efficiency of the systems
4 GREEN EFFORTS White paper#10, December 2013 5 www.umweltdatenbank.de

Page 6
The advantages of wind energy production within the ports’ premises or directly next
to it that can be counted include: Comparatively strong and regular wind
Located near areas of industrial concentration, with advantages from the perspective of systems and communications
Easy delivery and transport of materials to the construction site Comparatively few problems such as noise and vibrations6.
Already existing wind power plants on port premises can be found in New York / New Jersey, San Diego, San Francisco, Baltimore and Long Beach. Furthermore, Port of
Hamburg and Port of Rotterdam cater (at least partly) for themselves with self-produced electricity.
To install wind energy generation capacity in a port or container terminal takes a significant amount of time, planning, knowledge, land, large investments with an ROI
of typically 7 years to finalize a wind power plant. In this process, it is essential for port authorities, their tenants and potential stakeholders to cooperate closely. Seeing to the fact that wind is widely available and sea ports are often located at exposed
shore side locations, network charges can be saved and the good and green image a wind turbine brings to the premises. It can be concluded that a wind turbine often
classifies as a very good investment for ports. It was shown by EUROGATE in Hamburg that installing an onshore wind power plant for own purposes on the terminal pays off and is very future-oriented as well for the port itself as for the
society in general.
Biogas7
Biogas is produced by the fermentation of organic substances, which can also serve as renewable energy sources. It falls under the category of renewable energy, because it
is largely made of renewable materials. Changing from conventional energy sources to energy that is made of renewable sources can be seen as an approachable investment
in the future. Biogas is an important pillar of the future energy supply, because it can be stored, used flexibly and is baseload-capable, so it can supply electric energy (and heat) at times when there is neither sun nor wind.
Generally, for the production of biogas a biogas plant is needed. A biogas plant, however, is a very complex and rather individual facility. Therefore, a number of
considerations have to be taken into account in order to become a biogas plant operator:
Type of substrate to be used
Source of the material (the port itself (i.e. wood used for cargo securing in containers, grass from dykes and other lawn areas), farm, commercial, food
industry) State of the substrate (liquid/solid) The quantity that’s planned to be used (unit; i.e. tons per week / year)
Availability of the substrate (continuous or seasonal)
Main tasks in a port and terminal are to provide space and infrastructure, handle goods, store them temporarily and possibly transport them further or between points
of interests on the terminal. But, since ports and terminal operators are economic entities that think in economic principles, they can be interested in becoming a biogas
6 http://www.mlit.go.jp/english/2006/k_port_and_harbors_bureau/13_windpower/ 7 GREEN EFFORTS White paper#11, November 2013

Page 7
plant operator if the circumstances are favourable and cost-effective. If the image is uplifted because of engagement in green technologies, then it is even more
favourable. However, it should only be seen as an add-on, not as the core point for decision-making.
Geothermal Energy8
Geothermal energy is the energy stored within the different layers of the earth. It
occurs in the form of hot rock, hot liquid or in steam form. The idea of geothermal technology is to use this terrestrial heat to generate electric power9. Beside the
electric power supply, several companies offer systems to use the geothermal energy for heating and cooling of houses and office buildings. The advantage compared to
other renewable energy sources is the permanent access to the energy source. An additional benefit of geothermal energy is the independency of weather conditions and day time10. Furthermore, the cascading effect can be used. The cascading effect leads
to a stream of geothermal hot water or steam to perform successive tasks requiring lower and lower temperatures. Cascading effects in energy environment imply the use
of energy in one step and give the energy in a lower level to the next part in the chain. By using this effect the efficiency of energy using system can be improved to a higher percentage11.
Geothermal energy usage can be divided into two segments12: on the one hand side, the near-surface geothermal energy applications and on the other side the geothermal
power plants, which use deeper layers of ground. The main difference of the concepts is determined by the different drilling depths. Analyzing the different systems leads to the conclusion that the high initial investment of deep geothermal power plants makes
these systems rather unattractive for a terminal application. Especially, the drilling process has a high impact on the necessary capital for these systems. In contrast,
near surface applications might be feasible on a port and terminal environment because of their lower investment cost. The generated energy could be used to heat or cool warehouses and office buildings within a container terminal or parts of the
terminal area, as well as railway points.
Ocean Energy13
Ocean energy refers to the energy carried by ocean waves, tides, salinity, and ocean
temperature differences. The movement of water in the world’s oceans creates vast store of kinetic energy.
One of the important considerations, while harnessing ocean energy at terminals, is to ensure avoidance of obstruction in movement of ships. There are several techniques of harnessing tidal and wave power. But most of them are not feasible in terminals
because of the large area requirement in case of tidal barrage and lagoons, and also because of creation of obstruction within the terminals. The installation of turbines
under water, apart from economics, involves several legal jurisdiction approvals, and special consideration needs to be placed on the impact of marine ecology.
8 GREEN EFFORTS White paper#6, October 2013 9 http://www.lfu.bayern.de/geologie/geothermie/index.htm 10 http://www.lfu.bayern.de/geologie/geothermie/index.htm 11 http://energyalmanac.ca.gov/renewables/geothermal/types.html 12 http://www.geothermie.de/wissenswelt/geothermie/einstieg-in-die-geothermie.html 13 GREEN EFFORTS Deliverable 6.2 Opportunities of regenerative energy production on site
Page 8
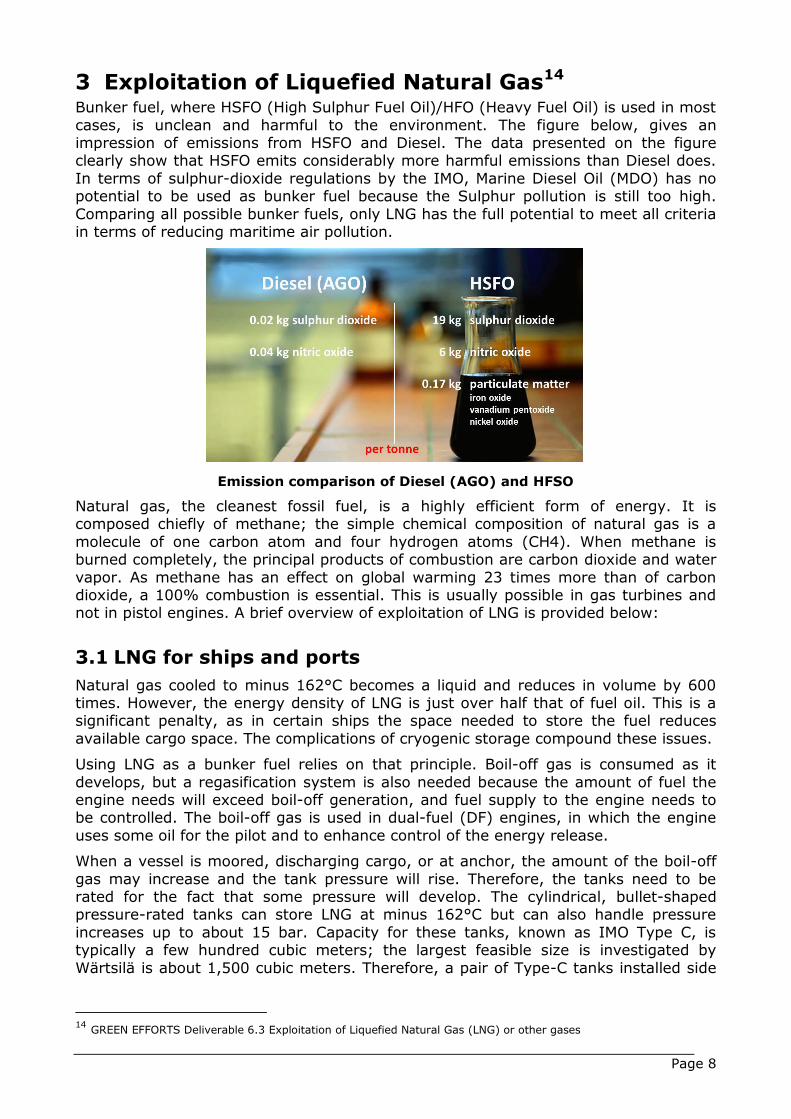
3 Exploitation of Liquefied Natural Gas14 Bunker fuel, where HSFO (High Sulphur Fuel Oil)/HFO (Heavy Fuel Oil) is used in most
cases, is unclean and harmful to the environment. The figure below, gives an impression of emissions from HSFO and Diesel. The data presented on the figure clearly show that HSFO emits considerably more harmful emissions than Diesel does.
In terms of sulphur-dioxide regulations by the IMO, Marine Diesel Oil (MDO) has no potential to be used as bunker fuel because the Sulphur pollution is still too high.
Comparing all possible bunker fuels, only LNG has the full potential to meet all criteria in terms of reducing maritime air pollution.
Emission comparison of Diesel (AGO) and HFSO
Natural gas, the cleanest fossil fuel, is a highly efficient form of energy. It is composed chiefly of methane; the simple chemical composition of natural gas is a
molecule of one carbon atom and four hydrogen atoms (CH4). When methane is burned completely, the principal products of combustion are carbon dioxide and water
vapor. As methane has an effect on global warming 23 times more than of carbon dioxide, a 100% combustion is essential. This is usually possible in gas turbines and not in pistol engines. A brief overview of exploitation of LNG is provided below:
3.1 LNG for ships and ports
Natural gas cooled to minus 162°C becomes a liquid and reduces in volume by 600 times. However, the energy density of LNG is just over half that of fuel oil. This is a significant penalty, as in certain ships the space needed to store the fuel reduces
available cargo space. The complications of cryogenic storage compound these issues.
Using LNG as a bunker fuel relies on that principle. Boil-off gas is consumed as it
develops, but a regasification system is also needed because the amount of fuel the engine needs will exceed boil-off generation, and fuel supply to the engine needs to be controlled. The boil-off gas is used in dual-fuel (DF) engines, in which the engine
uses some oil for the pilot and to enhance control of the energy release.
When a vessel is moored, discharging cargo, or at anchor, the amount of the boil-off
gas may increase and the tank pressure will rise. Therefore, the tanks need to be rated for the fact that some pressure will develop. The cylindrical, bullet-shaped pressure-rated tanks can store LNG at minus 162°C but can also handle pressure
increases up to about 15 bar. Capacity for these tanks, known as IMO Type C, is typically a few hundred cubic meters; the largest feasible size is investigated by
Wärtsilä is about 1,500 cubic meters. Therefore, a pair of Type-C tanks installed side
14 GREEN EFFORTS Deliverable 6.3 Exploitation of Liquefied Natural Gas (LNG) or other gases
Page 9
by side could store up to 3,000 cubic meters; but this is still inadequate for most oil tankers, bulk carriers, or container ships.
Currently, Type C tanks have been installed in both new ships and in conversions, because they allow a simpler system without the need for cryogenic pumps. Other
tank types, such as Type A and Type B, operate at less than 0.7 bar, Because they are not required to hold pressure, they can be designed in prismatic shapes and hence be
more space efficient. There is no clear consensus about the use of prismatic tanks, but without acceptance of these type of tanks, use of LNG for larger vessels and longer voyages is unlikely to be economical.
For safety, in case of a collision, LNG tanks must be set further back from the hull edge than for conventional bunker fuels, which restricts tank sizes for some ships.
Classification societies also agree that tanks should not be under crew accommodations or impact ship evacuation routes; other design issues include placement of LNG piping through the ship, from the tanks to the engines.
3.2 Alternative use of LNG in ports
LNG has, apart from being used as fuel, the possibility to be used as energy source for electric engines and running turbines. The potential for electrification of port and terminal processes is considerably high. All the infrastructure of existing and planned
ports and terminals may take benefit of a low cost energy source, because of a relatively high capital expenditure (CAPEX) for electrified solutions.
Natural gas´ advantages over other fuels include the following: it has fewer impurities, it is less chemically complex, and its combustion generally results in less pollution. In most applications, using natural gas produces less of the following
substances than oil or coal: carbon dioxide (CO2), which is the primary greenhouse gas; sulphur dioxide, which is the primary precursor of acid rain; nitrogen oxides,
which is the primary precursor of smog; and particulate matter, which can affect health and visibility; than oil or coal.
4 Shore-based power supply15 A ship also needs a considerable amount of energy for several functions on board,
amongst others for lighting, maintaining on-board appliances like computers, navigation and communication equipment, etc. Cruise vessels need by far the highest
amount of energy to supply on-board appliances for the large number of passengers who spend their holidays on board of a cruise ship and demand all the comfort that upper class hotels usually provide.
Currently it is common practice to generate the energy demanded by the vessel with on-board diesel generators. Vessels which produce their energy with on-board diesel
generators using Low Sulphur Fuel Oil (LSFO) emit remarkable amount of different gases, especially when considered that they are multiplied with the large power
requirements some vessels need, particularly container, especially reefers, and cruise ships.
To enhance the efforts of lowering emissions in ports, the vessels should preferably be
supplied with the lowest-emission power that is available. Clearly, this power could be generated with renewable energy resources, like wind, solar power, etc. A second best
possibility with regard to emissions is the use of onshore power supply fed from conventional sources because local emissions in the harbour are cut to zero. The third
15 GREEN EFFORTS Deliverable 6.4 Shore based power supply for berthed ships
Page 10
best solution in regard to emissions only could be the use of fuels with fewer emissions in the harbour. Hence LNG can be a possible energy source.
The strongest incentive for installing onshore power supply (OPS) is to reduce the costs that occur to the shipping companies. The price gap between electricity and low
sulphur fuel is therefore crucial. Onshore power supply is also a very political topic. The interest of social welfare, which is lower emissions of NOx, SOx, CO2 and PM, can
clearly conflict with the interests of shipping companies that seek to lowest costs wherever possible.
On the other side, investments costs of OPS depend very strongly on the individual
conditions of an onshore power supply arrangement. Consequently there is no general value for an onshore power supply. An example of an average onshore power supply
is calculated and the result showed a return on investment between 3 and 7 years.
On the industry side, there is widespread acceptance of OPS. As mentioned above, the acceptance of the industry depends on the cost savings OPS can generate compared
to conventional fuels. Currently, there are number of ports providing OPS for all types of vessels, e.g. Gothenburg, Antwerp, Long Beach, Los Angeles, Trelleborg,
Vancouver, Zeebrugge among others. Many more ports are considering installing OPS, e.g. Amsterdam, Barcelona, Bergen, Hong Kong, Houston, Kaohsiung, Le Havre, Tallinn, Tokyo, Yokohama among others. Last but not least, there are currently more
than 25 shipping lines which use OPS and the trend is upwards. More than 300 ships with OPS are in operation or currently on order.
When it comes to connection standards, the onshore power supply system is standardized in IEC, ISO and IEEE 80005-1, which is in force since August 2012. Plugs and sockets for the onshore power supply are regulated in IEC 62613-2, which exactly
states, how the plugs and sockets shall look like.
Energy loss is an important aspect to consider as well. Energy losses of the energy
transmission vary widely. It depends on the voltage of the transmission line and on the power transmitted. Overhead lines have smaller losses than cables and each transformer which is located between energy producer and energy consumer has
additional losses. If offshore wind parks are taken into consideration the losses of the power lines are nearly negligible due to the small distances of the receiving point
onshore and the port. Taking into consideration the conversion losses of the power electronic converters which are necessary for High Voltage Direct Current (HVDC), the complete losses can be estimated with 2 to 3 % from wind park to onshore power
supply. If frequency conversion is necessary for the onshore power supply additional losses occur. The frequency converter itself has losses of about 4 to 5%. With
frequency conversion the total losses sum up to 6 to 8%.
4.1 Onshore electrical power supply
Electrical power is fed to the vessel with a cable. Though this method requires certain safety measures (like other methods as well) it has the significant advantage that the
power supplied can be generated from several energy sources, for example regenerative power.
The advantage of electrical onshore power supply compared to LNG is that emissions
in the harbour are decreased to zero (see figure below). On-board generators are completely shut down during lay days. In addition to zero emissions the harbour
vicinity gains:
Zero noise from on-board generators
Zero vibrations from on-board generators

Page 11
People working in the harbour area or living in the vicinity of a harbour are no longer exposed to unhealthy or toxic gases which will increase the state of health
in harbour cities and on the other hand decrease costs related to health care in that regions.
Emission reductions using onshore power supply compared to LNG
Source: ENTEC, Siemens
The power consumed on-board a vessel must be produced somewhere onshore. This will definitively generate emissions since "green power" is not yet established in whole
Europe. However, still the emissions from onshore power supplies are generally lower than those from on-board production. This can be seen in the below figure. The reason for that is that power generation onshore
is done in larger power units with higher efficiency than the small units on-board
uses a different fuel burning process than on-board generators
has enough space to utilize considerably waste gas treatment
utilizes in addition emission free power sources like water, solar or wind
in some countries is produced by nuclear power plants, which have no gaseous
emissions
Emission reductions using onshore power supply compared to diesel
Source: ENTEC, Siemens
Reduction of emissions
0%
20%
40%
60%
80%
100%
120%
CO2 CO N2O NOx VOC PM
Emissions
Rela
tive r
ed
ucti
on
s
Emissions onboard Emissions onshore
Reduction of emissions
0%
20%
40%
60%
80%
100%
120%
CO2 CO N2O NOx VOC PM
Emissions
Rela
tive r
ed
ucti
on
s
Emissions onboard Emissions onshore
Page 12
The advantage of utilising LNG as an energy source which is primarily methane (CH4)
is that it has the highest hydrogen (H) to carbon (C) ratio compared to other fuels. When methane is burned the hydrogen part produces energy without emitting CO2.
Due to this fact the CO2 emissions are reduced by 12% compared to diesel and by 25% compared to petrol.
However, LNG driven engines emit unburned methane, a greenhouse gas, which is 25
times as climate-damaging as CO2. The emission of this unburned methane is called methane slip.
Gas turbines rather than piston engines can overcome the technical problem of the methane slip. The problem of flame extinguishing does not exist in gas turbines like in piston engines. Gas turbines for electricity generation offer a convenient back-up
solution for periods where no energy from renewable sources (wind, solar, water) is available. More information on the amount of methane slip in different engine types
can be found in D 6.4.
If onshore power is completely generated from renewable sources all emission reductions can be increased to 100%.
4.2 Vision: The integrated solution
In our research it is found out that it is reasonable to give the highest priority to electric power produced from renewable sources which allows to develop a vision of an integrated energy concept for the port that is not only applicable for the energy
supply to berthed ships but also to nearly all other electrical applications in the port like lighting, automated guided vehicles, cranes, etc. This concept can be summarized
as below.
Integrated energy concept for the port 1) Wind energy is generated by the wind park, which is directly connected to the
local port grid.
2) Surplus electricity, which is not used at times of production is saved in batteries
and is conducted to the port located power to gas facility. This surplus electricity is converted into gas, preferably methane because of the possibility
of unlimited feeding-in into the local gas grid and the port located LNG infrastructure
3) The port located gas grid is connected to the regional gas grid, hence full
flexibility in satisfying internal and external demand of methane is given.
4) LNG storage tanks are provided with LNG by LNG tankers.
5) In times of no electricity supply by the renewables (wind, solar, tidal, etc.) the port located small / medium scale gas turbine power station produces the electricity
6) Batteries can provide an additional backup for an undisturbed electricity supply.
7) The electric power produced by the port located energy generation system is
used to supply the berthing ships with the energy needed to maintain onboard applications.

Page 13
References
GREEN EFFORTS, Mar 2014, Deliverable 6.1: External supply of regenerative energies
GREEN EFFORTS, Sep 2014, Deliverable 6.2: Opportunities of regenerative energy production on site
GREEN EFFORTS, June 2014, Deliverable 6.3: Exploitation of Liquefied Natural Gas (LNG) or other gas
GREEN EFFORTS, May 2014, Deliverable 6.4: Shore based power supply for berthed ships
GREEN EFFORTS, May 2014, White paper#1, Reduction of the CO2 Footprints of
Container Terminals by Photovoltaics
GREEN EFFORTS, Oct 2013, White paper#6, Geothermal energy and heat for ports
and terminals
GREEN EFFORTS, Dec 2013, White paper#10, Wind Energy
GREEN EFFORTS, Nov 2013, White paper#11, Biogas

Energy management of terminals and ports
Liang Tao, Hui Guo

Page ii
TABLE OF CONTENTS
TABLE OF CONTENTS .............................................................................................. ii
LIST OF ABBREVIATIONS /GLOSSARY .......................................................................... iii
Executive summary ............................................................................................ 1
1 Power factor correction options for harbour terminals ....................................... 2
2 Load shedding measures for harbour terminals ................................................ 3
3 Smart grid applications for harbour terminals .................................................. 4
4 Additional potentials and prospects of harbour energy management ................... 6
References ........................................................................................................ 7
Page iii
LIST OF ABBREVIATIONS /GLOSSARY
AGV Automated Guided Vehicle
CCHP Combined Cooling, Heating, and Power
CHP Combined Heat and Power
CPP Critical Peak Pricing
DEMS Decentralized Energy Management Systems
DLC Direct Load Control
DPLS Dynamic Power-based Load Shedding
DR Demand Response
DRMS Demand Response Management System
FBLS Frequency-based Load Shedding
FPLS Fast Power-based Load Shedding
HP Horse Power
ICT Information and Communication Technology
IL Interruptible Load
MDM Meter Data Management
MSC Mechanically switched capacitors
PEMA Port Equipment Manufacturers Association
PV Photovoltaic
RTP Real-Time Pricing
PTR Peak Time Rebate
RTG Rubber Tyred Gantry
STATCOM Static Synchronous Compensator
SVC Static VAR Compensators
TOU Time-of-Use
WT Wind Turbines
VPP Virtual Power Plant

Page 1
Executive summary
This chapter summarizes the whole work with the focus on energy management and smart grid for terminals and ports, and gives an outlook on the future research work on developing green smart terminals and ports.
Page 2
1 Power factor correction options for harbour
terminals
Analysis of measurement data1 has revealed that in a typical harbour terminal, reefer
units have lead to almost half of the terminal’s reactive power consumption, with STS cranes ranking just behind it. Under low load condition, terminal power factor falls in general between 0.65 and 0.8; whereas under high load condition, the lower bound of
terminal power factor deteriorates down to 0.5 in extreme cases. This overall power factor value range of harbour terminals obviously falls below general utility
expectation of 0.8 or higher with regard to industrial and commercial customers. Therefore, onsite reactive power compensation should be deployed to minimize potential penalty charges from utility side.
Two general reactive power compensation approaches are available for harbour terminals, namely dedicated compensation and ‘complimentary’ compensation. With
the dedicated option, harbour operators must purchase and install standalone devices to improve terminal power factor; whereas the ‘complimentary’ option allows harbour operators to control the reactive power output of power conversion devices (i.e.
inverters or converters) found in various electric appliances, which are already installed to server other purposes in terms of active power usage.
Dedicated reactive power compensation measures can be roughly classified into three categories, namely: mechanical switched devices, thyristor switched devices, and VSI (voltage source inverter) based devices. As harbour terminals are typically in need of
capacitive reactive power, the most suitable compensation options under these three categories are respectively MSC (mechanically switched capacitors), SVC (static VAR
compensators), and STATCOM (static synchronous compensator) solutions. The MSC option proves to be the most economic one despite its limited controllability and low response speed, whereas both SVC and STATCOM could serve as fast-acting
compensators to counteract short-term reactive power fluctuations.
The ‘complimentary’ source of reactive power compensation in harbour terminals can
be generally obtained from the power conversion devices found with shore-to-ship power supplies, battery storage devices, as well as full-converter type of wind turbines
(WT) and photovoltaic (PV) generation units. As these modern DC / AC and AC / AC converters have the built-in capability of decoupling the control of active power and reactive power on AC line side, the reactive power output of these converters can be
separately regulated to compensate for the needs of other terminal loads. Restrictions do arise, however, from both apparent power ratings of the inverters / converters and
the upper-limit and lower-limit of interface voltage. This means the reactive power delivery capability of these ‘complimentary’ compensation devices are dependent—to a certain degree—on both simultaneous active power output and system voltage.
Considering the pros and cons of both dedicated and ‘complimentary’ power factor correction measures, the most appropriate solution for harbour terminals is probably a
hybrid approach. By deploying MSC to cover ‘base load’ part of total reactive power demand and resorting to ship-to-shore / storage / WT / PV converters for fast compensation of peak reactive power consumption, both economics and technical
performance of the solution can be optimized to the maximum extent.
1 GREEN EFFORTS Deliverable 7.1 Maximizing of power factor for terminals
Page 3
2 Load shedding measures for harbour terminals
Although load shedding schemes can be adopted to address a wide range of issues for
both utilities and industries alike, their most reasonable application use case under a harbour terminal context is peak shaving due to the economic potentials of arriving at a demand response (DR) agreement between utility and harbour sides. Here the term
peak shaving refers to constraint of peak demands for only prescribed periods in critical days via means of real-time load shedding, as opposed to energy efficiency
measures, which can be seen as a one-time equipment upgrade or overhaul effort that leads to persistent load reduction credits without subsequent interference needs.
The filtering-down of potential load shedding targets in harbour terminals has been
performed on the basis of a real-time load composition study2, which identifies reefers and (office) air conditioners as the most promising candidates for load shaving
programs. STS and RTG cranes have been excluded mainly due to potential safety hazards and logistic disorders that may occur as a consequence of sudden interruption of crane operation. UPS-interfaced office loads are generally not recommended for
load shedding as frequent discharge of battery would easily lead to premature ageing of the UPS equipment. Both yard lightings and office fridges are good load shaving
candidates, although their contributions to overall harbour load peak are normally too small to make any visible impact.
In general, automatic load shedding schemes can be categorized into three types:
frequency-based load shedding (FBLS), dynamic power-based load shedding (DPLS), and fast power-based load shedding (FPLS). FBLS solutions are normally adopted by
industry consumers that have either no connection to utility grid or choose to run in islanded mode with onsite generation, in which case shedding of non-critical loads in a timely manner as soon as frequency sags below a defined limit is the most effective
measure for maintaining system stability. The DPLS solutions are normally initiated by utilities rather than end consumers, where the utility sets a certain threshold on an
industrial client’s allocated spinning reserve (i.e. idling capacity from hot standby units or rotating generators that are not working at full output level)—when it is breached, certain power appliances at the customer’s site will be automatically shut down with
remote control from utility side. Finally, the DPLS solution stands out as the most appropriate choice for peak shaving applications, as it directly adopts local power
consumption level as the main load shedding decision criteria—i.e., once a certain upper threshold of electric usage is reached, a few pre-arranged electric loads or
power consumption devices will be shut down under a prescribed order.
Demand response (DR) can be seen as a special case of peak shaving application with strong focus on the business case realization towards a win-win situation for both
utility and end consumer. According to tariff design, DR programs can be categorized into six major forms: TOU (Time-of-Use), CPP (Critical Peak Pricing), PTR (Peak Time
Rebate), RTP (Real-Time Pricing), DLC (Direct Load Control), and IL (Interruptible Load). In order to maximize DR appeal to harbour operators, hybrid programs such as TOU + CPP and CPP + PTR are normally recommended, which are normally enabled
by aggregation platforms such as a demand response management system (DRMS).
2 GREEN EFFORTS Deliverable 7.2 Load shedding for terminals

Page 4
3 Smart grid applications for harbour terminals
Smart grid in general refers to the practice of integrating modern ICT (information
and communication technology) and automation solutions into power systems to enhance operation reliability, economics, and sustainability etc. Specifically, in most EU nations, smart grid concept is closely linked to the improvement of power grids’
capability for hosting intermittent renewable resources (e.g. PV and WT), for which new power generation and delivery paradigms such as Microgrid and virtual power
plant (VPP) have been devised to resolve potential problem associated with renewable resources via adoption of energy storage devices and intelligent dispatch programs.
Under the context of a harbour terminal, the deployment of smart grid technology can
be explained by three major aspects, namely: installation of onsite generation and storage devices, adoption of new communication and automation measures, and
finally optimal management of all active resources in the grid.
Firstly, the unique geographic setting and logistic demand of a harbour terminal have excluded a lot of onsite renewable generation possibilities, save for PV and WT
technologies. Conversion of retired diesel engines into onsite CHP (combined heat and power) or CCHP (combined cooling, heating, and power) units could potentially help
harbours to reduce its carbon footprint even further, but their practical applicability are generally constrained by limited onsite heating demand (for CHP) and immature technology status quo (for CCHP). As for electric storage, the most meaningful use
case in harbour terminals—under both short-term and long-term time settings—is the power balancing application, which achieves peak shaving and valley filling in the
mean time as an attempt to ‘flatten’ demand curve. Supercaps and Li-Ion / flow batteries are respectively the best technology choices for short-term balancing tasks and long-term demand ‘flattening’ tasks.
The successful transition of a traditional harbour terminal toward an energy efficient, ‘smart’ paradigm will rely heavily on the implementation of one or more of the
following three aspects to form a backbone information system, namely: substation automation, advanced meter data management system, and condition monitoring. The advancement of substation automation allows more intelligent control at local
sub-station level such as fast load shedding and short-term energy balancing tasks, as well as the merging of local protection system and control system into one integral
platform. A meter data management (MDM) system, on the other hand, plays the key role of aggregating individual energy consumption devices into a transparent and
manageable information system. Finally, condition monitoring provides utility or consumer access to the operating status of not only generation or load devices, but also local distribution equipments.
For an intelligent harbour terminal, a decentralized energy management systems (DEMS) is normally needed to control local generation, storage and demand in an
optimized manner. A DEMS typically comprise of three core functionalities: forecasting of generation and non-controllable demand, planning of optimized unit commitment schedule, as well as real-time monitoring and control of available resources during
operation. The forecasting module provides load and renewable generation forecast on the basis of weather information acquired either from a remote service or local
measurement data. The unit commitment module will decide switching states and operating points of local generators by committing them at increasing cost until generation cost reaches market price (i.e. until any MWh produced more will decrease
profit). Finally, the real time supervision module runs cyclically in online mode to ensure minimum deviation of all controlled devices’ working status from signalled
control targets—in case large deviations do occur, spontaneous re-dispatch will be carried out to reallocate available resources to counteract any potential problems.

Page 5
A scenario-based smart grid benefit analysis has also been performed to quantify potential technical, economic and environmental credits of a paradigm shift towards
‘smart’ harbour terminals3. The ‘smart’ transition efforts consist primarily of two aspects: power-based peak shaving measures and energy-based onsite generation
measures. The peak shaving measures are supposed to be covered by installation of a battery storage unit (rather than load shedding due to the latter option’s limited
effectiveness), whereas the onsite generation measures mainly refer to self-owned WT and / or PV generation assets (CHP units are not included in simulation due to negligible electrical rating in ratio to overall harbour demand). Both communication /
information architectures and online decentralized resource dispatch systems are assumed to be in place so as to enable smart grid control possibilities.
Based on the analysis of active power consumption data, a cascaded series of smart grid scenarios have been proposed based on variations of four sensitivity factors, namely: (1) generation configuration, (2) storage dimension, (3) weather condition,
and (4) economic assumption. The generation configuration parameter consists of four scenarios, which covers the potential cases when there are (1) no PV or WT, (2) only
WT, (3) only PV, and (4) both PV and WT. The storage dimension parameter considers four stages of power- and energy-ratings ranging from zero to highest values that could cover more than two hours of peak terminal demand. The weather condition
parameter decides, for daily simulations, the output levels and curve shapes of WT and PV generation—three options are made available as high output, mid output, and
low output. Finally, the economic assumption parameter covers both energy-and power-tariffs from utility side, and the installation costs of generation and storage assets; again three variations haven been proposed respectively as optimistic (high
utility tariff and low installation cost), medium, and pessimistic (low utility tariff and high installation cost) as input for analysis.
The evaluation of terminal smart grid performance for each examined scenario starts from an energy balance simulation that takes daily load and generation profiles as input data and delivers both storage operation patterns and a ‘flattened’ terminal
demand profile as output after applying a peak shaving and valley filling algorithm. PV / WT size and type have been revealed by this step to shed critical impact over the
peak shaving effectiveness of storage units. Then economic and environmental evaluations can be performed by comparing the RES- and storage-modified terminal demand to the original one, where avoided capacity- and energy-charges and reduced
CO2 emission levels can be respectively identified as economic and environmental credits of smart grid implementation. Study results show that medium cost levels
have already lead to positive business cases, and maximized generation scenario with both PV and WT leads to highest emission reduction credits for the harbour terminal.
3 GREEN EFFORTS Deliverable 7.3 Smart grid technology for terminals and ports
Page 6
4 Additional potentials and prospects of harbour
energy management
The potentials of energy management in harbour terminals have been discussed as a
standalone issue viewed from a power system perspective, focusing primarily on the status quo and imminent electrical consumption needs of most harbour terminals in Europe. This approach has exhibited conspicuous advantages in terms of exploring
detailed aspects of the (electrical) energy management topic such as reactive power compensation, load shedding, and the deployment of smart grid technologies etc.
However, a major opportunity of inter-disciplinary integration of electrical energy management and port logistic management systems has been largely overlooked so far.
As the operators of modern harbours are mostly already working with a port management system that monitors and remotely controls the operations of cranes,
trucks, and even berthing and departing actions of ships, the least-cost way of implementing a localized energy management system would be naturally to build the energy management functions on the basis of existing ICT architectures from the port
management system. In addition to this sharing of information and communication platform, the merging of both systems can also facilitate fast transfer of measurement
data and control commands between logistic and electrical sub-systems, thereby creating new prospects for optimal management of both landside and maritime processes and tasks.
Firstly, when viewed from the landside perspective, a local energy management system can potentially optimize the battery swap and charging operation patterns of a
fully-automated container transportation system, in which battery-driven automated guided vehicles (AGV) completely replace the role of traditional trucks or short-distance trains for transferring containers between quay-side operational area and the
terminal stacking yard. In this case, the charging process of swapped-out AGV batteries can be potentially controlled to compensate for sudden load peaks from
(power) grid-connected STS (ship-to-shore) and RTG (rubber tyred gantry) cranes, thereby fulfilling the role of an energy storage device without dedicated investment.
Of course, successful implementation of this operation mode relies heavily on the timely transfer of logistic information to the energy management system, as well as a solid understanding of the operation routines of both cranes and container vehicles.
On the other hand, the sharing of logistic and electrical information can also lead to significant performance enhancements for maritime operations. For example, as STS
and RTG cranes contribute to a significant proportion of instantaneous terminal load, a most economic way of minimizing this type of load spikes is to ‘interleave’ the operation patterns of multiple cranes, such that the next crane always starts hoisting
operation as soon as the previous one begins to lower down its container unit, thereby creating a partial cancel-off effect while ensuring that no more than two cranes with
opposite vertical movement directions are in operation at any time. In addition, the integration of type and size information from berthed ships into energy management system will serve as the main (electric) load estimation criteria when a shore-to-ship
power connection is established to replace onboard diesel power generation units.
Finally, it should be noted that the quantitative modelling and analysis performed
have been considerably simplified due to limited availability of measurement data in terms of source diversification, time resolution, and content coverage. This means more comprehensive studies could be performed in future when, for example,
measurement data from a large assortment of different types of harbour terminals are made available, such that the ‘typical’ harbour load composition can be extended to a
large number of representative cases corresponding to salient regional and

Page 7
geographical features. Similarly, the energy balancing study can also be extended from the current long-term scope (15-min resolution) to short-term scope (smaller
than 1-s resolution) for supercap design, if load data in corresponding time frame can be obtained beforehand. Finally, the outcomes could also be collectively exemplified in
one application case if a representative harbour distribution network can be built on the basis of realistic data, thereby illustrating the impacts of reactive power
compensation, load shedding, and smart grid technology deployment by a series of load flow calculations. Last but not least, all these possibilities could serve as very good starting points for future research work towards developing and realizing green
smart terminals & ports.
References
GREEN EFFORTS April 2014, Deliverable 7.1: Maximizing of power factor for terminals
GREEN EFFORTS, April 2014 Deliverable 7.2: Load shedding for terminals
GREEN EFFORTS, April 2014, Deliverable 7.3: Smart grid technology for terminals and ports
Context to Transport Chain
Diana Illing, Lorenz Kleist, Julia Pahl

Page ii
Table of Contents
Introduction ...................................................................................................... 1
1. What matters for the port ........................................................................... 2
2. Energy Management in Transport Sectors ..................................................... 2
List of Abbreviations
GHG Greenhouse Gas

Page 1
Introduction
Although many standards and guidelines for carbon footprint calculations exist, special
guidelines transport hubs like ports are missing. A process related approach is
introduced and discussed why it is considered to be the most favourable and the most
practical way for doing carbon footprint calculations in ports. It is distinguished
between emissions that are climate-relevant under the Greenhouse Gas (GHG)
Protocol and other air pollutants and has come up with an approach suggestion for
each of the emission kinds. It is suggested to use a process-related approach for
carbon footprint calculations and a separate, area-related approach, for all harmful
emissions relevant in ports and transportation in general.
Whilst the main focus of GREEN EFFORTS is the energy efficiency of ports and
terminals, transport sector has also been investigated to enable comparison of energy management. A comparison between ports and airport has shown that there are many
similarities in activates undertaken as well as some differences in the consumption areas. Although every transportation mode has its specific characteristics which can
lead to very specific technical solutions for each mode, some of the energy efficiency and emission saving measures are common in most modes of transportation. Prominent examples are hydrogen-powered vehicles and e-mobility, recuperation
technics, the use of electricity from renewable energy sources like wind energy and photovoltaic or the introduction of environmental zones where stricter emission
regulations apply. It can be said that a broad implementation of these measures will help to effectively reduce transport-related emissions at reasonable costs1.
1 GREEN EFFORTS Deliverable 8.3 Comparison of energy management in transport in general and in the port sector

Page 2
1. What matters for the port2
The Carbon Footprint is a worldwide known and the most widely used measure to
identify impacts on the climate and environment due to human actions. It contains the measurement of climate relevant greenhouse gases, like CO2, methane and others.
Two kinds of air pollutions are directly interesting for the port and its processes. On
the one side the carbon footprint is an issue for ports like it is for any other business. How the carbon footprint for ports can be calculated is currently not finally decided.
Some open questions such as defining limits of port processes or geographical borders are still to be solved. Emissions that are included in carbon footprint calculations have a global impact on the greenhouse gas (GHG) effect independently of where they
occur.
On the other hand other air pollutants that result from the port businesses and
processes and that have an local effect are of interest as ports are very often located in densely populated areas, e.g. close to cities. As many of the air pollutants have a harmful effect on human health and the environment, efforts exist to minimize these
emissions. Therefore, the local emissions of these substances are of interest and have to be measured.
As explained above the measurement of GHG emissions and the measurement of other air pollutants that are especially of local interest are two different concepts. It is suggested to apply two separate approaches that account for the differences in the
concepts, namely a process-related approach for carbon footprint calculations and a separate, area-related approach for all harmful emissions relevant in ports and
transportation in general.
2. Energy Management in Transport Sectors3
While GREEN EFFORTS aimed at exploring the reduction of energy consumption and improving a clear energy mix in seaports and terminals, it has also been investigated
how the energy efficiency issue is being tackled by transport sector other than ports. The results have been compared to other fields of interest, e.g., airport energy
reduction measurements.
These results show that there are many similarities of activities undertaken in the
ports and terminal sector as well as the airport sector. For instance, the replacement of equipment driven by diesel with equipment running on electricity or hybrid systems is an issue taken into account by both sectors.
Differences in activities are mainly due to the infrastructure of airports including large airport terminals that need cooling/heating systems. These are very energy intensive.
Therefore, the main focus of energy management activities of airports is in improving the technological infrastructure of buildings. This includes the production of energy as well rendering airport terminal building energy independent creating autonomous,
intrinsic systems.
2 GREEN EFFORTS Deliverable 8.1 Transfer (interfaces) of carbon footprint responsibility between terminal, port and
transport modes 3 GREEN EFFORTS Deliverable 8.2 Energy Management in Transport Sectors other than Ports

Page 3
References
GREEN EFFORTS, Jul 2014, Deliverable 8.1: Transfer (interfaces) of carbon footprint
responsibility between terminal, port and transport modes
GREEN EFFORTS, Aug 2014, Deliverable 8.2: Energy Management in Transport
Sectors other than Ports
GREEN EFFORTS, Jul 2014, Deliverable 8.3: Comparison of energy management in
transport in general and in the port sector
Vision of Energy-Efficient Terminals
LORENZ KLEIST, REINER BUHL, SVENJA TOETER, JENS FROESE

Page ii
Table of Contents
1. GREEN EFFORTS Wiki ................................................................................. 1
2. Port and Terminal Knowledge Landscape (PTKL) ............................................ 1
3. Vision of an energy-efficient terminal (Video) ................................................ 3
List of Abbreviations
PTKL Port and Terminal Knowledge Landscape

Page 1
1. GREEN EFFORTS Wiki The GREEN EFFORTS Wiki provides easy access to key results of the GREEN EFFORTS project. In addition to quantitative data it contains elucidations and graphics on the
topics and port elements covered in order to require only a minimum of background knowledge for the interested reader. As a Wiki, it allows also to dig deeper into specific topics by following the links to more detailed information. The Wiki also
includes the GREEN EFFORTS Glossary hosted at the Green Efforts Homepage (www.green-efforts.eu).
A wiki is in principal a dynamic tool to provide content. GREEN EFFORTS Wiki allows thus for the option to be extended to include more topics and details in the framework
of possible future projects.
The following graphic is a screen shot of the main page of the Wiki created. The Wiki is a living document that is extended as new project results are delivered.
Screenshot of the Main Page of the GREEN EFFORTS Wiki developed for D10.1
2. Port and Terminal Knowledge Landscape
(PTKL) The purpose of PTKL is to ease the access to project research results related to terminals. Visualization is used as tool to enable non-experts to understand research
results and to reach broader audiences. The visualization bases on a 3D scene model. The file format is very flexible and provides many possibilities for extended
developments and interaction with the model. One of three options is the usage of a standard PC mouse, a so called space mouse or a touch screen. The model is presented using Instant Reality player. The 3D scene model consists of numerous
objects which are combined to represent the newly planned inland navigation container terminal of Riesa (Germany), a planned sea port container terminal and the
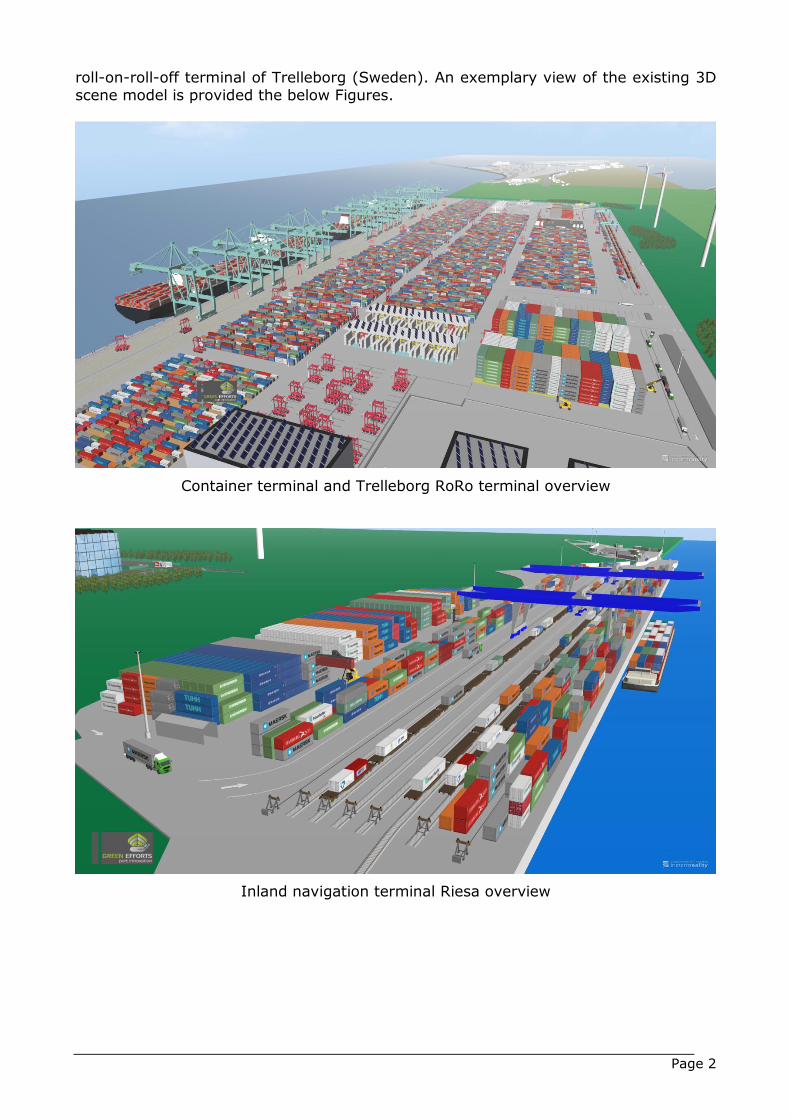
Page 2
roll-on-roll-off terminal of Trelleborg (Sweden). An exemplary view of the existing 3D scene model is provided the below Figures.
Container terminal and Trelleborg RoRo terminal overview
Inland navigation terminal Riesa overview

Page 3
A straddle carrier container terminal with information boxes
3. Vision of an energy-efficient terminal (Video) The key issue of the visualisation of project achievements is to provide quick and easy
understanding by visualization without blurring the perception by too much detailed information but also not hiding these once an interested party wants to dig deeper.
Video of ‘GREEN EFFORTS Overview and Outcomes’ serves the above mentioned purpose and can be found under below given links:
https://www.youtube.com/watch?v=mISQ57wpbU4&feature=youtu.be
http://green-efforts.eu/
References
GREEN EFFORTS, Feb 2014, Deliverable 10.1: Visualisation of project achievements
GREEN EFFORTS, Sep 2014, Deliverable 10.2: Visualisation of reasonable future solutions
GREEN EFFORTS, Sep 2014, Deliverable 10.3: Vision of an energy-efficient terminal

Recommendations for Standardisation Calculation and Declaration of Energy Consumption and GHG
Emissions on Terminals
Jens Froese
Page 2
Table of Contents Definitions and Abbreviations ...................................................................................................... 3
Abstract ................................................................................................................................................ 4
1. Introduction ............................................................................................................................ 4
2. Terminal Boundaries ............................................................................................................ 5
3. Related Standards ................................................................................................................ 5
4. Methodology – Current Gaps and Recommendations ............................................ 6
5. Allocation to Product Level (analogous to CEN EN 16258) ............................................... 7
6. Comprehensive Management of Energy Consumption and Carbon Footprint
8
8. Conclusion ............................................................................................................................. 10
Page 3
Definitions and Abbreviations CNG compressed natural gas (methane, CH4)
CO2-eq carbon dioxide equivalent, a metric measure to compare the emis-sions from
various greenhouse gases on the basis of their global-warming po-tential (GWP) by converting amounts of other gases to the equiva-
lent amount of carbon dioxide with the same global warming poten-tial, commonly expressed as million metric tonnes of carbon dioxide equivalents, abbreviated as MMTCDE
CEN European Committee for Standardization
CHE container handling equipment
EEI energy efficiency indicator (according to ISO 50001)
Empty pl. empties, terminal jargon for empty containers
GHG greenhouse gases, contributing to global warming according to the
Kyoto Protocol (1997), are the non-fluorinated gases carbon dioxide (CO2), methane (CH4) and nitrous oxide (N2O) and the fluorinated gases hydrofluorocarbons (HFCs), perfluorocarbons (PFCs) and sul-
phur hexafluoride (SF6)
GWP global warming potential of greenhouse gases
IMO International Maritime Organisation, an entity of the United Nations
KPI key performance indicator
LNG liquid natural gas (methane, CH4 )
PM particulate matter, microscopic carcinogen solid or liquid matter
suspended in the earth's atmosphere
Reefer refrigerated container to carry temperature controlled cargo
RMS reefer monitoring system
SME small and medium enterprise
Spreader device to lift containers by container handling equipment such as ship-to-shore cranes or straddle carriers
TEU twenty foot equivalent unit (20’ standard container), a 40’ container equals 2 TEU
TEU-factor the ratio of TEU to number of containers showing the size split be-
tween 20’ and 40’/45’ containers, depending on trade. For European container terminals currently around 1,62
TOS terminal operating system, software tool to organize yard operations

Page 4
Abstract Current standards applicable for transport provide guidance to capture and re-
port carbon dioxide emissions on a global level. Recent development aims at
product-based allocation of emissions as described in CEN EN 16258 [CEN
16258] but restricted to carriers. In a next step transhipment centres shall be-
come included.
GREEN EFFORTS developed a methodology for sea and inland navigation termi-
nals characterised by a top-down approach from total terminal emissions to
product level, hence using only real data, no default data, and by integrating the
management of energy-efficiency and mitigation of emissions. An example for a
container terminal elucidates the approach.
1. Introduction Numerous standards, guidelines and recommendations aim at energy efficiency
and carbon footprint mitigation. The purpose of this paper is to recommend an
approach to comprehensively capture and report energy consumption and CO2-
eq emissions and to allocate the results to a single “product”. To prevent from
becoming too bulky, referenced standards are not explained and must be viewed
separately.
Considering the total carbon dioxide emissions of terminals the established and
proven GHG Protocol [GHG 2004] and the standard ISO 14064 [ISO 14064] pro-
vide adequate guidance to capture and report the total carbon footprint of a ter-
minal. Allocation of total emissions to “products”, i.e. the cargo handled, howev-
er is currently not covered by a standard. CEN EN 16258 “Methodology for calcu-
lation and declaration of energy consumption and GHG emissions of transport
services (freight and passengers)” [CEN 16258] provides guidelines for transport
carriers such as trucks, ships, railways and airplanes resulting in a carbon foot-
print figure per consignment. Within the introduction to CEN EN 16258 it is stat-
ed:
„It is anticipated that future editions of the standard may have a broader scope
boundary, to include additional aspects such as, transport terminals, tranship-
ment activities, and other phases of the lifecycle.“
This paper aims at contributing to further standard development covering alloca-
tion of terminal emission to product level as it is required by CEN EN 16258 [CEN
16258] for transport carriers and announced to come for transhipment centres.
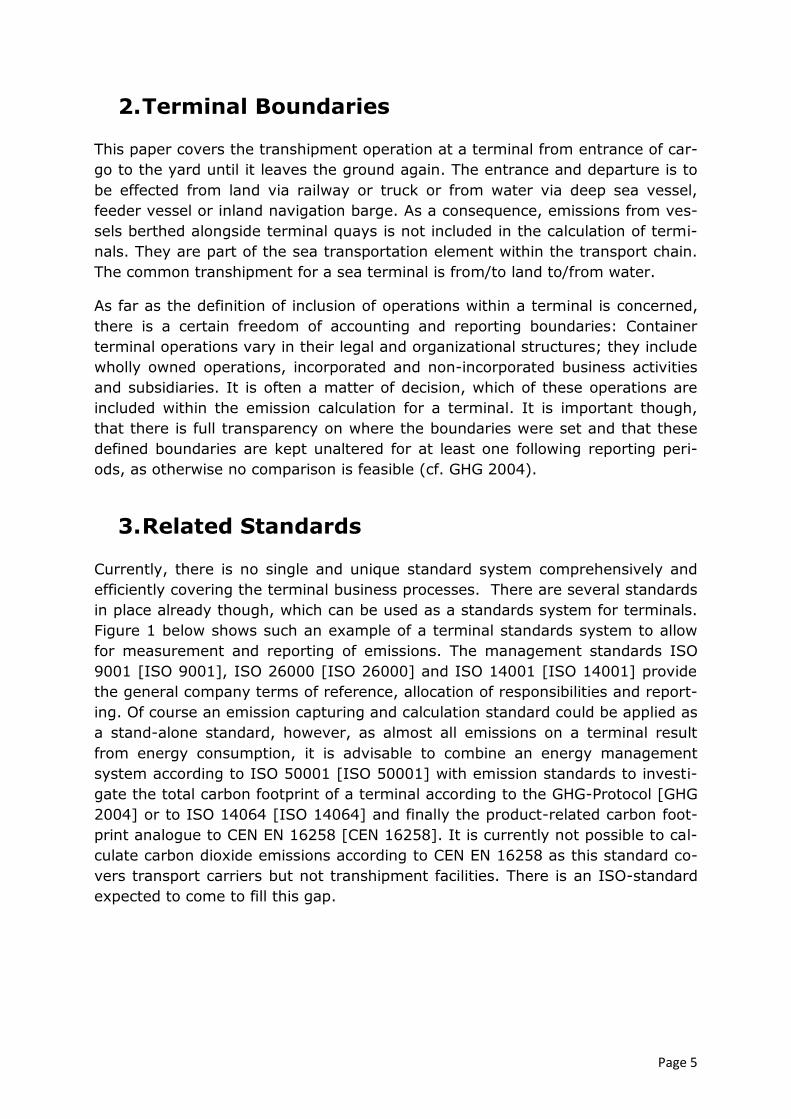
Page 5
2. Terminal Boundaries
This paper covers the transhipment operation at a terminal from entrance of car-
go to the yard until it leaves the ground again. The entrance and departure is to
be effected from land via railway or truck or from water via deep sea vessel,
feeder vessel or inland navigation barge. As a consequence, emissions from ves-
sels berthed alongside terminal quays is not included in the calculation of termi-
nals. They are part of the sea transportation element within the transport chain.
The common transhipment for a sea terminal is from/to land to/from water.
As far as the definition of inclusion of operations within a terminal is concerned,
there is a certain freedom of accounting and reporting boundaries: Container
terminal operations vary in their legal and organizational structures; they include
wholly owned operations, incorporated and non-incorporated business activities
and subsidiaries. It is often a matter of decision, which of these operations are
included within the emission calculation for a terminal. It is important though,
that there is full transparency on where the boundaries were set and that these
defined boundaries are kept unaltered for at least one following reporting peri-
ods, as otherwise no comparison is feasible (cf. GHG 2004).
3. Related Standards Currently, there is no single and unique standard system comprehensively and
efficiently covering the terminal business processes. There are several standards
in place already though, which can be used as a standards system for terminals.
Figure 1 below shows such an example of a terminal standards system to allow
for measurement and reporting of emissions. The management standards ISO
9001 [ISO 9001], ISO 26000 [ISO 26000] and ISO 14001 [ISO 14001] provide
the general company terms of reference, allocation of responsibilities and report-
ing. Of course an emission capturing and calculation standard could be applied as
a stand-alone standard, however, as almost all emissions on a terminal result
from energy consumption, it is advisable to combine an energy management
system according to ISO 50001 [ISO 50001] with emission standards to investi-
gate the total carbon footprint of a terminal according to the GHG-Protocol [GHG
2004] or to ISO 14064 [ISO 14064] and finally the product-related carbon foot-
print analogue to CEN EN 16258 [CEN 16258]. It is currently not possible to cal-
culate carbon dioxide emissions according to CEN EN 16258 as this standard co-
vers transport carriers but not transhipment facilities. There is an ISO-standard
expected to come to fill this gap.

Page 6
Figure 1 Example of Terminal Standard Cluster to Capture and Report Emission
4. Methodology – Current Gaps and Recommen-
dations As a fair and consistent emission inventory must cover all relevant processes and
activities required to achieve business objectives, GREEN EFFORTS recommends
a top-down approach, i.e. determination of the total CO2-eq-emissions of a ter-
minal according to the GHG-Protocol/ISO 14064 and then allocate the result to
processes, activities or products. It is much easier to capture emission data for a
whole business unit than for processes and products. The advantage of such a
top-down approach is that there are reliable comprehensive data for the total
carbon footprint, whereas allocation might not always be possible and will some-
times require estimated data. Preciseness of allocation can become improved as
measuring and tracking devices will be available. Summing up all allocated emis-
sions must again result in the company’s total carbon footprint.
A further advantage of the top-down approach is, that the carbon dioxide inven-
tory can become combined with an energy management system according to ISO
50001 as for a terminal energy consumption and emissions depend on each oth-
er. ISO 50001 requires an “energy efficiency indicator (EEI)” and it appears fea-
sible to determine the energy consumption per “product” as EEI and then convert
this to CO2-eq as the principal emissions KPI.
For an optimised management of application energy and carbon footprint it is
recommended to integrate ISO 50001, GHG-Protocol/ISO 14064 and the idea of
CEN EN 16258 (emissions on product level) into one consistent management
system, adapted to the needs of an individual terminal.

Page 7
5. Allocation to Product Level
(analogous to CEN EN 16258) The “product” of a container terminal is an appropriately handled container and
the relevant carbon footprint share per individual container requires a product-
based carbon footprint calculation. It will neither be feasible nor reasonable to
capture the “true” value for each container. An individual consideration of each
container would result in different carbon footprints for similar containers. E.g. a
container not having been moved during the dwell time on the yard will result in
a lower carbon footprint than a similar box re-stacked several times to access
containers stacked below. Therefore a generalized average approach is recom-
mended to ensure fairness and manageability. The accumulation of all averaged
values, however, must again result in the true total carbon footprint of the com-
pany. Default values provided by others therefore cannot be used.
Of course one cannot simply divide the total carbon footprint of a terminal by the
number of containers handled to achieve the individual share because the con-
tainers are not all equally “energy-hungry”.
The crucial question is to what detail the container operations need to be broken
down. Small differences of energy consumption, which usually cannot be cap-
tured anyway, should not be taken into account but only significant ones.
Currently it does not make sense to differentiate emission allocations according
to accurate container weights because in most cases the weight is not available
and the energy consumption of e.g. a crane will not differ too much just because
of relatively small weight differences. As an example, recently measured con-
tainer weights (laden containers) at a northern European container terminal re-
sulted in following weights:
Container Size Feet
Export t
Import t
Average t
20’ 19,6 16,5 18,0
40’ 21,0 16,4 18,7
45’ 21,5 20,8 21,0
Table 1 Container Weights
The total average results in 19,2 t. For a first step it appears reasonable to treat
all boxes equally. Container weights are not accurately captured. The cargo doc-
uments contain the booking weight which can considerably differ from the true
weight and not all cranes have weighting devices. It is however currently dis-
cussed by IMO to make container weighting mandatory and then it can be ex-
pected that container weights are captured automatically.
In all asymmetric trades as e.g. between Europe and Asia, empty containers
(“empties”) have to be handled, too. The weights of empty containers are

Page 8
20’ t
40’ t
45’ t
2,4 4,0 4,8
Table 2 Weights of Empty Containers
The average results in 3,7 t. As the spreader to grab a container weights already
about 16 t, it appears reasonable to also treat all empty containers equally for
the time being and refine the capturing system once appropriate measuring and
recording devices are installed.
Assuming an average weight of 19,2 t for laden containers and 3,7 t for empties,
the weight ratio is about 1 : 5,2 in this example. However there is no linear de-
velopment between energy consumption and weight because of horizontal
movements and system losses (friction etc.), thus in this case is seems reasona-
ble to estimate a factor of 3, i.e. handling of a laden container requires 3-times
the energy of handling an empty one. Again, for higher accuracy onsite measures
are required in the future in order to achieve further accuracy.
Reefer containers are contributing significantly to a terminal’s energy consump-
tion. Deep frozen cargo and chilled cargo (fruits, vegetables) results in significant
differences in energy consumption.
Reefer monitoring systems (RMS) technically have the potential to measure indi-
vidual energy consumption of each reefer stacked on a yard, however, this po-
tential is currently not offered by RMS-manufacturers. As long the individual con-
sumption values per box cannot be captured and recorded it is recommended to
exclude reefer consumption and hence carbon footprint from allocation. Of
course the carbon footprint caused by handling of a reefer at a terminal is cap-
tured and included in the allocation scheme.
6. Comprehensive Management of Energy Con-
sumption and Carbon Footprint Energy consumption data will serve for various monitoring and decision-making
processes on a terminal. An approach where captured data are organised, pro-
cessed and used consistently will prevent from errors and allow streamlining of
administrative management. Figure 2 elucidates the comprehensive approach
recommended by GREEN EFFORTS.
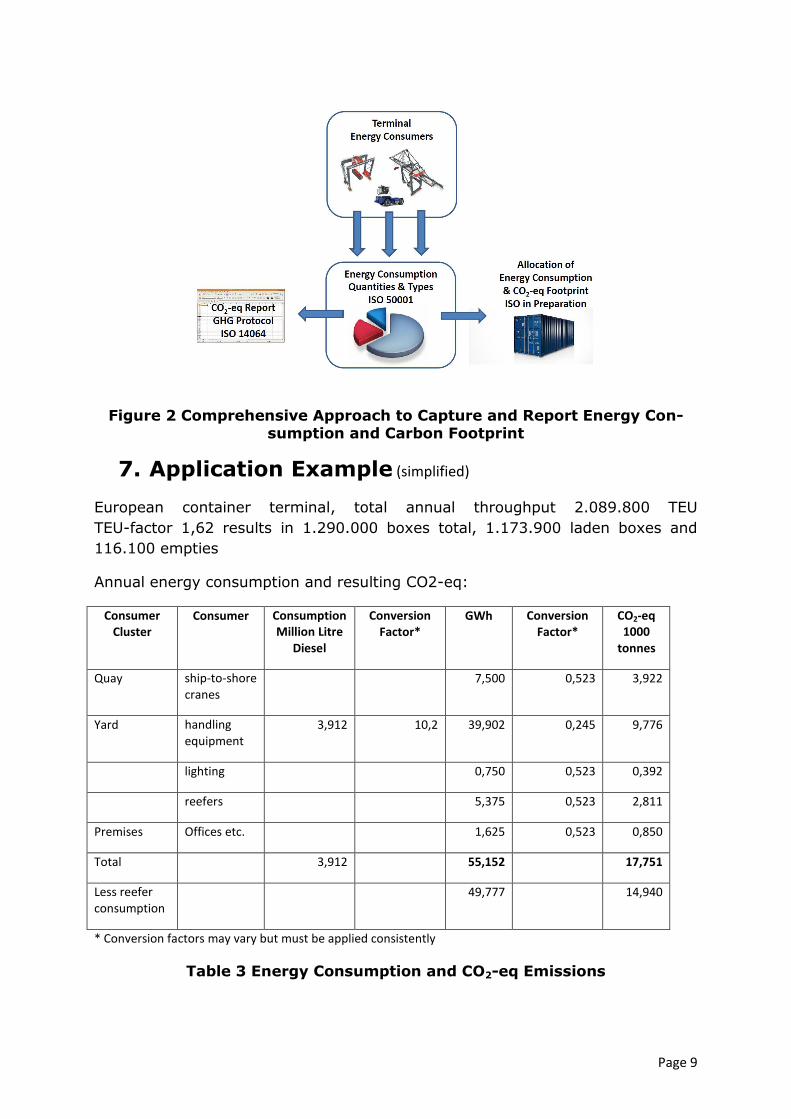
Page 9
Figure 2 Comprehensive Approach to Capture and Report Energy Con-sumption and Carbon Footprint
7. Application Example (simplified)
European container terminal, total annual throughput 2.089.800 TEU
TEU-factor 1,62 results in 1.290.000 boxes total, 1.173.900 laden boxes and
116.100 empties
Annual energy consumption and resulting CO2-eq:
Consumer Cluster
Consumer Consumption Million Litre
Diesel
Conversion Factor*
GWh Conversion Factor*
CO2-eq 1000
tonnes
Quay ship-to-shore cranes
7,500 0,523 3,922
Yard handling equipment
3,912 10,2 39,902 0,245 9,776
lighting 0,750 0,523 0,392
reefers 5,375 0,523 2,811
Premises Offices etc. 1,625 0,523 0,850
Total 3,912 55,152 17,751
Less reefer consumption
49,777 14,940
* Conversion factors may vary but must be applied consistently
Table 3 Energy Consumption and CO2-eq Emissions

Page 10
The terminal total energy consumption results in 55,152 GWh equalling 17.751 t
CO2-eq
For allocation of these energy consumptions and emissions to the terminal prod-
uct, the container handled, the total sum is deducted by the reefer consumption,
resulting in 49,777 GWh
The energy consumption of a laden container is being estimated as three times
as high as of an empty one.
49,777 GWh annual consumption must be allocated to 1.173.900 laden boxes
and 116.100 empties resulting in 41,0 kWh for a laden container and 13,7 kWh
for an empty one.
On a TEU-basis (TEU-factor 1,62) this results in 25,3 kWh for a TEU laden and
8,5 kWh for an empty one.
Either based on containers or on TEU, this result can be used as energy efficiency
indicator for ISO 50001 Energy Management. Furthermore, it can be used as a
basis for future comparisons thus providing an indicator of improvement or loss
in energy efficiency.
Assumed the same ratio of carbon footprint distribution for laden and empty con-
tainers as for the energy consumption, the carbon footprint results are 12,3 kg
CO2-eq for a laden container 4,1 kg CO2-eq for an empty container respectively
7,6 kg CO2-eq for a TEU laden and 2,5 kg CO2-eq for a TEU empty.
It must be kept in mind that in this example the energy consumption of the reef-
ers had been excluded from allocation (but not the handling and it is also includ-
ed in the total carbon footprint of the terminal) as there is currently no possibility
to achieve a fair solution. This can only be improved once measuring and record-
ing of each individual reefer will become a standard on terminals.
8. Conclusion The first steps in establishing a CO2-eq inventory and allocation scheme to prod-
uct level are cumbersome and challenging because a structured energy measur-
ing system must be developed and installed and the capturing system must be
comprehensive. Details overlooked in the base year prevent from qualified com-
parisons in the follow-up years. Capturing the total energy consumption of a
terminal and derived emissions should not be too difficult, however, for allocation
on product level the devil lies in the details. Usually a terminal is more complex
than it appears in this paper and there can be subcontractors making it difficult
to decide about operations and processes to be calculated or excluded.
Many detailed data will not be available at the beginning, either because there is
no measure device or because lack of process tracking, therefore the paper rec-
ommends to apply a top-down approach allowing for future increase of accuracy
by maintaining the overall approach and methodology.

Page 11
This paper is restricted to container terminals but for other types of terminal the
energy management will be similar, only the allocation methodology must differ
as the “product” differs. Instead of allocating CO2-eq to containers, it must be
distributed to tons of dry cargo or barrels of oil. Only multi-purpose terminals are
more challenging because there all kind of cargo is being handled. According to
the nature of cargo and energy demand for handling a reference system combin-
ing weight and volume might be required.
References
CEN 16258
CEN EN 16258: Methodology for calculation and declaration of energy consump-
tion and GHG emissions of transport services (freight and passengers)
GHG 2004
The Greenhouse Gas Protocol: A corporate accounting and reporting standard,
Revised edition March 2004, The World Business Council for Sustainable Devel-
opment (WBCSD) & The World Resources Institute (WRI)
GHG 2013
Greenhouse Gas Protocol: Required Greenhouse Gases in Inventories, Accounting
and Reporting Standard Amendment, February 2013, The World Business Council
for Sustainable Development (WBCSD) & The World Resources Institute (WRI)
ISO 9001
ISO 9001:2008: Quality management systems – Requirements
ISO 10368
ISO 10368:2006: Freight thermal containers - Remote condition monitoring
ISO 14001
ISO 14001:2004: Environmental management systems - Requirements with
guidance for use
ISO 14064
ISO 14064-1:2006: Greenhouse gases - Part 1: Specification with guidance at
the organization level for quantification and reporting of greenhouse gas emis-
sions and removals
ISO 26000
ISO 26000:2010: Guidance on social responsibility
ISO 50001
ISO 50001:2011: Energy management systems - Requirements with guidance
for use