green bonds report - cbd · figure 22: process flow for issuance of green bonds ... • low tenure...
TRANSCRIPT

Reprinted in February 2015This report is made possible by the support of the American People through the United States Agency for International Development (USAID). The contents of this report are the sole responsibility of Nexant, Inc. and do not necessarily reflect the views of USAID or the United States Government. This report was prepared under Contract Number AID-386-C-12-00001.
Issue Paper: Green Bonds in India
Partnership to Advance Clean Energy-Deployment (PACE-D)Technical Assistance Program


Partnership to Advance Clean Energy-Deployment (PACE-D)Technical Assistance Program
Issue Paper: Green Bonds in India
Reprinted in February 2015This report is made possible by the support of the American People through the United States Agency for International Development (USAID). The contents of this report are the sole responsibility of Nexant, Inc. and do not necessarily reflect the views of USAID or the United States Government. This report was prepared under Contract Number AID-386-C-12-00001.


Table of Contents
Executive Summary ....................................................................................................... 1
1. Introduction & Background ................................................................................. 5
2. Global Market Trends – Green Bonds ................................................................ 11
3. Issuance of Green Bonds In India ...................................................................... 21
4. Recommendations for Improvement of Flow of Green Bonds In India ........... 27
5. Annexes ............................................................................................................. 29

List of Figures
Figure 1: Benefits of Green Bonds for Different Stakeholder ................................................ 29
Figure 2: Historical Issuance of Green Bonds ............................................................................ 3
Figure 3: Financing Conveyor Belt – Access to Capital at Various Development Stages.............. 7
Figure 4: Green Bonds as Growth Capital ................................................................................ 88 Figure 5: Historical Issuance of Green Bonds ............................................................................... 11
9 Figure 6: Green Bond Issuances: Minimum Size USD 500 m ..................................................... 12
10 Figure 7: Category of PRI Signatories - Financial Institutional ..................................................... 12
Figure 8: PRI Signatories in Various Geographies (FIs) ................................................................. 1311
Figure 9: Issuer Types for Green Bonds ........................................................................................ 1312 Figure 10: Diversification of Issuer Type ........................................................................................ 14
13 Figure 11: Investors (Type) Participation in Green Bonds .............................................................. 15
14 Figure 12: Rates and Tenure for Similar Rated Green Bonds ........................................................ 1615
Figure 13: Rates and Tenure for Similar Currency Green Bonds (AAA Rated) ............................. 16
Figure 14: Percentage Issuance of Green Bonds at Various Ratings ............................................ 17
Figure 15: Percentage Issuance of Green Bonds for Various Geographies ................................. 17
Figure 16: Percentage Issuance of Green Bonds at Various Tenures ........................................... 17
Figure 17: Percentage Issuance of Green Bonds at Various Currencies ...................................... 17
Figure 18: Underwriters - Issuance Volume ................................................................................... 18
Figure 19: Types of Green Bonds .................................................................................................... 21
Figure 20: Structure of Corporate Bonds ........................................................................................ 23
Figure 21: Structure of Portfolio Bonds ........................................................................................... 24
Figure 22: Process Flow for Issuance of Green Bonds ................................................................... 2517
Figure 23: Estimating 'Cost' of Green Bonds for Borrowers .......................................................... 27
Figure 24: Assistance Provided by the PACE-D TA Program for Green Bonds Issuance
in India ............................................................................................................................ 28
Table 1: Top Green Bond Issuance in 2014 and Lead Underwriters .......................................... 18

ACRONYMS
Acronyms Definition
ABS
ADB
AFD
AUM
BAML
CBI
CBSB
CSR
DBS
DISCOMs
ECB
EIB
ESG
EUR
EVI
FI
FiT
GOI
GW
IFC
INR
IPP
KfW
MIGA
NAPCC
NBFC
NIB
NY
OPIC
PACE-D
PPA
PV
RBI
RE
SAI
SCA
SEB
SPVUSAID
USAID-DCA
asset-backed securities
Asian Development Bank
African Development Bank
assets under management
Bank of America Merrill Lynch
Climate Bond Initiative
Climate Bond Standards Board
corporate social responsibility
Development Bank of Singapore
Distribution Companies
external commercial borrowing
European Investment Bank
environmental, social and governance
Euro
Emergent Ventures India
financial institution
feed-in tariff
Government of India
gigawatt
International Finance Corporation
Indian Rupee
independent power producer
Kreditanstalt Für Wiederaufbau
Multilateral Investment Guarantee Agency
National Action Plan On Climate Change
Non-Banking Financial Company
Nordic Investment Bank
New York
Overseas Private Investment Corporation
Partnership to Advance Clean Energy – Deployment
power purchase agreement
photovoltaic
Reserve Bank of India
renewable energy
Statement of Additional Information
Svenska Cellulosa AB
Skandinaviska Enskilda Banken
special purpose vehicles
United States Agency for International Development
USAID Development Credit Authority


ACK NOWLED G EMENTS
This report was prepared under the Partnership to Advance Clean Energy-Deployment (PACE-D) Technical Assistance Program, which is funded by the United States Agency for International Development (USAID).
The PACE-D Technical Assistance Program would like to express its sincere appreciation to the numerous experts including Sean Kidney, Climate Bond Initiative and Evelyn P. Hartwick, International Finance Corporation who provided useful information on their experience and insights on Green Bonds. The team would particularly like to thank Upendra Tripathy, Secretary and Tarun Kapoor, Joint Secretary, Ministry of New and Renewable Energy; and K. S. Popli, Chairman and Managing Director, Indian Renewable Energy Development Agency for their guidance.
USAID Program ManagersAnurag MishraApurva Chaturvedi
Principal AuthorsVinod Kala Vivek Garg
Technical TeamNithyanandam Yuvaraj Dinesh BabuRonnie KhannaAalok Awalikar
Editorial TeamKavita Kaur Rahul Kumar

EXECUTIVE SUMMARY
1. Asset-liability mismatch:1. Asset-liability mismatch: This limits project financing tenure to 5-7 years except in cases of institutions such as
2. High interest rates:2. High interest rates: It is estimated that higher interest rates and inferior terms of debt in India raise the cost of
3. Sector limits:3. Sector limits: With renewable energy categorized under the power sector by the banks, there is an increased
The Need for RE Investment
India's renewable energy (RE) potential is estimated to exceed 3,000 GW, yet currently only a fraction of this
amount—32.8 GW, equating to little over 1 percent—has been harnessed. The government aims to dramatically
increase the amount of installed RE, and has set a target of 165 GW of additional RE capacity installation by 2022. The
government focus is currently on methods of arranging and facilitating the needed capital investment to achieve this
target, which is estimated at USD 200 billion.
However, even with the variety of project financing mechanisms for RE that are prevalent in India, there are some
fundamental challenges for RE developers in the financial marketplace:
1. Asset-liability mismatch: This limits project financing tenure to 5-7 years except in cases of institutions such as
Indian Renewable Energy Development Agency (IREDA), PTC Financial Services, etc., which have access to lines 1of credit from multi-lateral and bi-lateral agencies with longer tenures .
2. High interest rates: It is estimated that higher interest rates and inferior terms of debt in India raise the cost of 2renewable energy by 24-32 percent compared to similar projects financed in the U.S. or Europe.
3. Sector limits: With renewable energy categorized under the power sector by the banks, there is an increased
competition for RE projects to access capital vis-à-vis thermal power projects.
In this context, innovative financing mechanisms are required for the development of the RE sector in India. To address
these challenges, the USAID Partnership to Advance Clean Energy – Deployment (PACE-D) Technical Assistance (TA) 3 Program prepared comprehensive reviews of financing mechanisms for renewable energy and energy efficiency in
2013. Green Bonds were identified as one of the key financial instruments that can provide Indian RE project developers
with access to scalable, long-term, low-cost debt capital from institutional investors.
The Promise of Green Bonds
Green Bonds are standard, fixed-income financial instruments (bonds) where the proceeds are exclusively utilized for
financing climate change mitigation or adaptation related projects or programs. Currently, there is no standard
international definition for what projects/programs qualifies for Green Bonds. They are commonly issued as either self-
labeled corporate bonds, asset-backed securities, green project bonds, supranational/international bonds,
government and municipal bonds, etc. for climate change related programs/projects. Some of the key benefits of Green
Bonds for various stakeholders associated with renewable energy are shown in Figure 1.
1 Currently, IREDA provides project financing of tenures up to 12 years based on long term capital it obtains from DFIs2 Climate Policy Initiative: Meeting India's Renewable Energy Targets: The Financing Challenge3 The reports, Financing Renewable Energy in India and Financing Energy Efficiency in India, were published in October 2013 and can be
accessed at www.pace-d.com
1 Issue Paper: Green Bonds in India
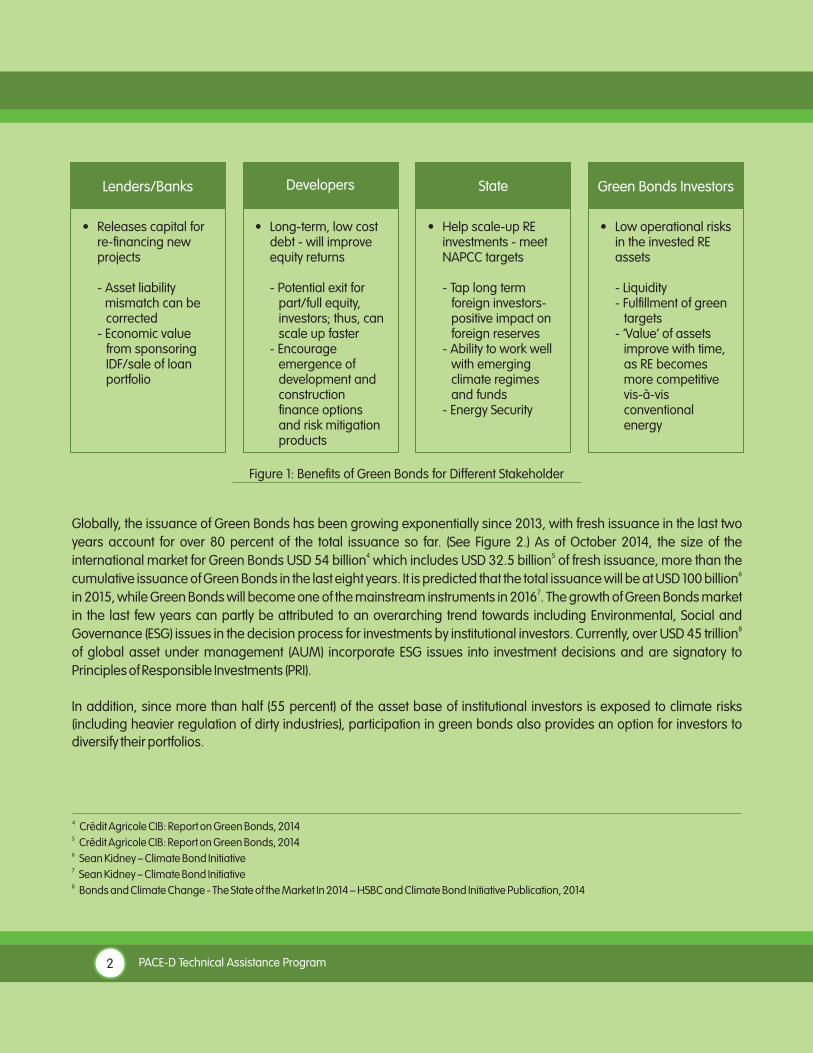
Globally, the issuance of Green Bonds has been growing exponentially since 2013, with fresh issuance in the last two
years account for over 80 percent of the total issuance so far. (See ) As of October 2014, the size of the Figure 2.4 5international market for Green Bonds USD 54 billion which includes USD 32.5 billion of fresh issuance, more than the
6cumulative issuance of Green Bonds in the last eight years. It is predicted that the total issuance will be at USD 100 billion 7in 2015, while Green Bonds will become one of the mainstream instruments in 2016 . The growth of Green Bonds market
in the last few years can partly be attributed to an overarching trend towards including Environmental, Social and 8Governance (ESG) issues in the decision process for investments by institutional investors. Currently, over USD 45 trillion
of global asset under management (AUM) incorporate ESG issues into investment decisions and are signatory to
Principles of Responsible Investments (PRI).
In addition, since more than half (55 percent) of the asset base of institutional investors is exposed to climate risks
(including heavier regulation of dirty industries), participation in green bonds also provides an option for investors to
diversify their portfolios.
Figure : Benefits of Green Bonds for Different Stakeholder1
Lenders/Banks Developers State Green Bonds Investors
• Releases capital for re-financing new projects
- Asset liability mismatch can be corrected - Economic value from sponsoring IDF/sale of loan portfolio
• Long-term, low cost debt - will improve equity returns
- Potential exit for part/full equity, investors; thus, can scale up faster - Encourage emergence of development and construction finance options and risk mitigation products
• Help scale-up RE investments - meet NAPCC targets
- Tap long term foreign investors- positive impact on foreign reserves - Ability to work well with emerging climate regimes and funds - Energy Security
• Low operational risks in the invested RE assets
- Liquidity - Fulfillment of green targets - ‘Value’ of assets improve with time, as RE becomes more competitive vis-à-vis conventional energy
4 Crédit Agricole CIB: Report on Green Bonds, 20145 Crédit Agricole CIB: Report on Green Bonds, 20146 Sean Kidney – Climate Bond Initiative7 Sean Kidney – Climate Bond Initiative8 Bonds and Climate Change - The State of the Market In 2014 – HSBC and Climate Bond Initiative Publication, 2014
2 PACE-D Technical Assistance Program

The Indian Context
In the Indian context, there are certain challenges for the issuance of Green Bonds in the international markets. These
include high currency hedging costs; poor sovereign ratings (currently at BBB-); and low tenure (currently, Green Bond
tenures are mainly concentrated between 3-10 years, with only some issuances reaching or exceeding 15 years tenure).
However, there are opportunities for Indian entities to participate in Green Bonds at this nascent stage —though on a
smaller scale issuance, ranging between USD 150-250 million. Such an early participation could provide an opportunity
to Indian entities to capture attention of investors (in a yet uncluttered Green Bonds market), potentially leveraged for
future issuances, thereby enabling better terms (due to expected low risk perception by international investors)) for
prospective similar issuances.
Further, for enabling the initial issuance of Green Bonds by Indian entities, the following measures could be undertaken
to reduce the cost of capital raised:
• Credit enhancement through donor agencies (a readily available facility from agencies such as
International Finance Corporation (IFC), Agence Française de Développement (AFD), United States
Agency for International Development (USAID), etc.)
9 Crédit Agricole CIB – Report on Green Bond Market, 2014
Figure 2 9: Historical Issuance of Green Bonds
USD
mill
ion
USD
mill
ion
3 Issue Paper: Green Bonds in India

• Low tenure bond issuance (for example 3-5 years) could reduce costs; serving the purpose of
making an early entry to the market
• Issuance for high performing, low risk portfolio of existing projects rather than projects under development,
wherein the perceived risks can be higher
• Developers can use excessive capital (due to bullet payments at maturity of bonds rather than monthly
installments) as equity to expand installed capacity; in this regards, Green bonds can be treated as low cost
equity capital for developers.
As a long term policy measure, it is recommended that the Government of India could announce the following steps to
reduce costs associated with Green Bonds for Indian entities:
• Development of an exchange risk liquidity facility through foreign reserves for a range bound period to entities
participating in the Green Bonds
• Seek support of the Green Climate Fund (GCF) to provide risk mitigation products such as partial credit
guarantees, risk guarantees or hedging products, etc.
• Reduction in hedging risks through policy measures such as indexing electricity tariffs to inflation rates or
to foreign currency in export oriented facilities/zones
International Market Trends and Issues for India
There are a number of issues that are critical to understand, for an effective participation by Indian institutions in the
Green Bonds market. These issues as outlined below are important, since Indian financial institutions have high
expectations from Green Bonds:
Interest arbitrage against normal bonds does not exist: Currently, the Green Bond market is at its infancy in India, but it is
rapidly maturing, and reaching a critical mass with a larger investor participation. The current market trend indicates
that while a demand and supply gap exists, it is yet to be reflected as a pricing advantage for Green Bonds.
Green Bond investments are not social funds: All issuers should view Green Bond issuance competing with other bond
issuances. Irrespective of the mandate for ESG, investors will not allow climate change to take precedence over the
risk/reward equation. At the same time, investors prefer Green Bonds over normal bonds that offer similar risk/reward
terms.
The bond tenures are still low against requirement: Currently, Green Bonds issuances have low tenure, in the range
between 3-10 years; however, there are issuances that have occurred with maturities of over 15 years. In the Indian
context, it is suggested that Indian financial institutions proceed with Green Bond issuances with shorter tenures. With
development of an international reputation in the bond market, subsequent issuances by Indian financial institutions
can be of longer tenure.
4 PACE-D Technical Assistance Program

India is planning to reset its RE capacity addition target to 165 GW by 2022, in view of the significant RE potential in the
country, estimated at ~ 3,000 GW. While the substantially higher capacity target will ensure greater energy security,
improved energy access and enhanced employment opportunities, it will require higher capital investments, estimated
at around USD 200 billion, over the coming years.
Based on the huge projected capital and investment requirements, it is widely accepted that current project financing
sources namely Scheduled Commercial Banks (SCB) lending, Non-banking Finance Company (NBFC) sponsored project
financing, multi-lateral and bi-lateral lines of credit to financial institutions (FIs), domestic bond issuances, etc., which are
prevalent in the Indian market would be inadequate to meet the financing requirements for capacity addition. There is a
need to introduce new means of financing and innovative financial instruments that can leverage a wider investor base
such as pension funds, sovereign wealth funds, insurance companies, etc. (estimated to manage over USD 80 trillion)
that can invest in the RE sector.
Another driving factor for the introduction of new sources of financing and instruments is the high cost and low tenure of
project financing currently available for RE projects in India. At present, NBFCs and commercial banks are the main
sources of debt financing in India. However, these organizations typically face difficulties in providing long-term funding 1for infrastructure projects due to asset-liability mismatch and the relatively higher cost of borrowing. In addition, banks
2have to deal with internally set sector limits (Power sector limits vary as per SCB guidelines). As such, instruments that
can help tap long-term, low-cost debt from investor classes such as insurance, pension funds, and other long-term
investors, (both domestic and foreign), to refinance bank debt for infrastructure projects are critical to meet the financing
requirement for capacity addition. Further, since equity investments from various investor classes are dependent on the
depth of debt markets, improvements in debt market need to be targeted first.
1.1 Requirement for Alternate Financial Instrument for RE Sector in India
While the capital demand from the sector has been low in past two to three years due to policy changes and economic
slowdown, it is widely accepted that India needs to diversify its sources of capital to meet its capacity addition targets.
The country's domestic debt market does not offer sufficient depth or flexibility from its capital markets and this will be a
key limitation as the demand for debt financing is expected to rise in the near future. As such, instruments that allow
financial institutions and independent power producers (IPPs) to access capital at suitable terms are critical. The
following sectionhighlights the key issues constraining RE financing in India:
• It is estimated that higher interest rates and unattractive termsHigh general interest rate environment in India:3 under which debt is available in India, raise the cost of renewable energy by 24-32 percent compared to
similar projects being financed in the U.S. or Europe.
1 INTRODUCTION & BACKGROUND
5 Issue Paper: Green Bonds in India
1 An asset-liability mismatch occurs in a situation where the bank has substantial long-term assets (such term loans) but short-term liabilities, such
as deposits2 In order to diversify their risk across sectors, banks internally set lending limits for each sector3 Climate Policy Initiative: Meeting India's Renewable Energy Targets: The Financing Challenge

6 PACE-D Technical Assistance Program
• SCBs in India are generally comfortable with debt tenure of five to seven Non-availability of longer tenure debt:
years due to short-term nature of the funds which these banks raise. According to the Reserve Bank of India (RBI) 4 estimates, nearly 79 percent of 2009-10 bank deposits have an average maturity of less than three years. While
some infrastructure projects, including RE projects, have been able to procure ten year tenures they are
significantly limited in number.
• In India, loans commonly have variable, rather than fixed, interest rates, primarily Fixed interest rate debt is rare:
due to the short-term lending by the banks (asset-liability mismatch) and the near-absence of bond markets.
Long-term hedging instruments (term-swaps and bonds), are typically unavailable due to the lack of maturity in
the financial markets and risks related to a growing economy. Variable rate debt makes cash flows to equity
holders (which include project cash flows minus the interest payments to debt holders) less certain as they are
subject to changing interest expenses.
• The SCBs have a defined sector limit, which limits exposure to any one market, sector, or Sectorial limits of SCBs:
technology. The RE sector comes under the overall power sector limit, which typically does not have the depth
required for large-scale RE funding. With increase in RE deployment, more banks will reach and cross their
sector exposure limits for the power sector, leaving RE projects without adequate bank financing.
• A large section of financiers shy away from Limited financing from other public/private sector financing sources:
lending to the RE sector due to lack of awareness, limited understanding of technologies, and uncertainty of
regulations.
Thus, it is concluded that to meet the need of the huge deployment of RE in the country, the financial market will need to
bring in instruments and mechanisms which meet the specific requirements of the sector such as long tenure, high
infusion of funds, and active participation of a variety of investors.
As part of its clean energy finance component, the USAID PACE-D TA Program has identified seven potential innovative 5financing mechanisms that can help accelerate RE deployment in India. The program held several discussions with key
stakeholders including MNRE, FIs, private entities and finance experts to deliberate on the mechanisms and determine if
the proposed mechanisms can address the existing financing challenges and subsequently be launched in India.
Based on the stakeholder feedback, it was established that Green Bonds should be explored to tap scalable long-term,
low-cost debt from institutional and market investors.
1.2 What are Green Bonds
Green bonds are standard fixed-income financial instruments (bonds) where the proceeds are exclusively utilized for
financing climate change related projects or programs. Currently, green bonds are popularly issued as corporate self
labeled bonds, green asset-backed securities, green project bonds, supranational/international bonds, government
and municipal bonds, etc.
With increasing focus on environmentally sustainable and green infrastructure, investments in the sector have
increasingly been adopted as part of social and corporate responsibility by investors. Green Bonds, in this regards,
provide means to unlock private capital flows into projects that support such purposes. Currently, there is no definition of
what qualifies as green; however areas such as RE, EE, waste, water, sustainable transport, afforestation, etc. qualify as
green. Green Bond issuers generally specify the usage of proceeds from the bond issuance such that investors may take
a call whether the proceeds are being used for green projects. Standards, such as Green Bond Principles, are also being
developed in order to standardize the definition and governance of these instruments.

ConstructionAssetAggregation Public MarketsDeployment Post
Construction
• Promoters• Private Equity• NBFCs
• OEMs• Supplier’s Exim Finance• NBFCs• Private equity
• Banks• Green Bonds• Pvt Equity- large wealth funds, pension funds, hedge funds
• Banks• Green Bonds or equivalent instruments• NBFCs• Pvt Equity
• Share listing• Listed Debt• Trusts• Mutual Funds
1.3 Potential Impact of Green Bonds in India
With implementation of Green Bonds, there is a multiplier effect (towards deployment of RE in India) due to lower costs,
increased capital inflow, and access to finance at various stages of the project lifecycle. These include:
• Low cost-long term debt: With low financing cost, there is a direct impact in reduction of cost of generation from
RE. With reduction in the cost of power generation, there is larger adoption of RE projects from stakeholders
such as consumers, IPPs, technology manufacturers, and distribution companies.
• Increased capital access: With Green Bonds being tradable instruments, there is improved liquidity; hence exit
for investors during any point of time post investment is possible, thus allowing for flexibility in managing
liquidity requirements on a short term basis. Such flexible instruments attract a larger pool of investors to the RE
sector. Some of the key investor pools that can be attracted towards participation in Green Bonds for RE are:
o Pension funds
o Insurance companies
o Sovereign wealth funds
• Green Bonds facilitate access to capital various development Financing across development stages: can for
stages (pre-construction, construction and post commissioning) for IPPs and project developers (as shown in
Figure 3), thus leading to larger implementation of projects.
7 Issue Paper: Green Bonds in India
Figure 3: Financing Conveyor Belt – Access to Capital at Various Development Stages
No exits, sector limits, NPAs, ALMCurrent option - Bank Finance
Green Bonds - allow exits
Promoter's funds + limited private equity;NBFCs; few exits yet, hence the financebelt seems to be stalling

1.4 Green Bonds – Benefits for Stakeholders
The benefits associated with Green Bonds have been evaluated from the perspective of four key stakeholders: Financial Institutions (Bankers/Lenders), Developers, Green Bond Investors and the State.
1.4.1 Key Benefits for Financial Institutions
1. Overcome challenge of sector limits: FIs in India have self imposed limits which restrict exposure to a particular sector. With Green Bonds, FIs have an option to offload holding assets through RE portfolio issuance, thereby allowing the institutions to adhere to the sector limits, while deploying bond proceeds into new projects.
2. Ability to manage asset liability mismatch: A key challenge faced by mainstream SCBs in India is the asset-
liability mismatch as deposits are largely short-term. The lack of long-term liquidity in the system does not allow
banks (barring specific institutions such as IREDA, PTC Financial Services, etc., which have access to long term
capital from multi-lateral and bi-lateral agencies) to procure long-term lending to the sector. Green Bonds
address this challenge as they allow FIs to raise long-term capital from the market. In addition, they provide an
exit option to FIs via securitization of projects portfolios at certain stage of maturity to overcome asset liability
mismatch.
3. Ability to obtain premium on performing assets through issuances: Due to roll out of “mature” projects portfolio
through Green Bonds, FIs can command risk premiums via pricing arbitrage that may exist during issuance of
Green Bonds due to low risk portfolio and potentially higher ratings in open markets.
1.4.2 Key Benefits for Developers
1. Access to capital at attractive terms: Project developers currently have limited options of approaching FIs in India who offer low tenures and high rates. Green Bonds will allow developers to access international capital at attractive terms.
Developers can generate surplus cash flow through longer tenure 2. Excessive cash flow for capacity expansion:
and bullet payment structures for bonds that allows access to capital to expand capacity without proportional
equity infusion. Based on PACE-D TA Program analysis, it is estimated that redeployment of excessive cash flow
can allow for 30-50 percent faster growth rates per year for the same equity base. Figure 4 depicts Green Bonds
leveraged for provisioning growth capital for developers.
8 PACE-D Technical Assistance Program
Additional cash for growth
High cost equity partlyreplaced by low cost debt
Access to Debt,can be non-recourse
If tenures can increase from 10 yrs – say 18-20 yrs, there is additional cash available for growth
Equity cost 18%; debt costs (post tax) ~ 10.5%. Overall cost of capital falls. Hence even if costs are higher, if higher debt can be used it is beneficial
If initial issuances do well, access to capital is superior from a bond market for fast growing corporates
Can Improve the potential growth rate by 30-50%/a for the same equity base
Very valuable for 'aggregators' in capital hungry infrastructure businesses
Valuable for fast growing NBFCs supporting RE Sector
Figure 4: Green Bonds as Growth Capital

1.4.3 Key Benefits for Green Bonds Investors
While some institutional investors are promoting climate-friendly business practices, others are diversifying their investment portfolio to hedge the risks associated with climate change. Green bonds can help investors on both fronts. The long-term competiveness of green assets, higher liquidity associated with the bond market, and low operational risk offer institutional investors an attractive basket of investment through the use of Green Bonds.
1.4.4 Key Benefits for the State
With an aggressive target of 165 GW of installed RE by 2022, the Government of India will require large investments for the RE sector. For this, it is important to explore options beyond the traditional sources of funds. Green Bonds, in this regards, will enable India to attract capital and consequently scale its RE investments and meet the target set under the National Action Plan on Climate Change. Large-scale foreign capital inflow into the country will also expand foreign reserves while offsetting India's energy import and enhancing energy security.
9 Issue Paper: Green Bonds in India


2.1 Global Investments in Green Bonds
Green Bonds have been growing exponentially since 2013, with fresh issuances in last two years accounting for over 80
percent of the total outstanding. As shown in , the total outstanding investments in Green Bonds as on October Figure 5
2014 is USD 54 billion, which includes USD 32.5 billion of fresh issuances, more than cumulative issuance of Green
Bonds the last eight years. In the third quarter of 2014, the total number of Green Bonds issued was 28 with total over6 7value at USD 9.2 billion . Green bonds are expected to become mainstream financing instrument in 2016 , with total
issuance expected to reach USD 100 billion by 2015.
2 GLOBAL MARKET TRENDS – GREEN BONDS
11 Issue Paper: Green Bonds in India
6 Press Release - Climate Bond Initiative 7 Sean Kidney – Climate Bond Initiative8 Crédit Agricole CIB – Report on Green Bond Market, 2014
Figure 5 8: Historical Issuance of Green Bonds
As shown in Figure 6, the size of bond issuances has been steadily increasing – over 31 bonds were issued in the last two years which grossed over USD 500 million each, in comparison to seven such issues over the period 2006-2011, indicating increased market base for Green Bonds.
USD
mill
ion
USD
mill
ion

The significant growth of the Green Bond markets over the last few years can partly be attributed to an overarching trend
towards including environmental, social and governance (ESG) issues into the decision process for investments by
institutional investors. Currently, over USD 45 trillion of Global “Asset under Management (AUM)” incorporate ESG issues
into investment decisions and are signatory to Principles of Responsible Investments. Figure 7 shows the number of
number of FIs signatory to the PRI, while Figure 8 indicates the geographical spread of the FIs (that are signatory to PRI)
across the globe.
12 PACE-D Technical Assistance Program
10Figure 7: Category of PRI Signatories - Financial Institutional
9Figure 6: Green Bond Issuances: Minimum Size USD 500m
Nu
mb
er
of I
ssu
an
ces
9 Crédit Agricole CIB – Report on Green Bond Market, 201410 Crédit Agricole CIB – Report on Green Bond Market, 2014

11 Crédit Agricole CIB – Report on Green Bond Market, 2014
On the other hand, observing the large demand for Green Bonds in the market, the sell-side group (originally formed by Citi Group, Bank of America Merrill Lynch, JP Morgan and Crédit Agricole CIB and currently comprising of over 13 members) launched the Green Bond Principles with the aim of providing greater clarity and transparency to Green Bonds issuers and investors. The voluntary principles describe the processes for designating, disclosing, managing and reporting on Green Bonds. They were developed by group of banks in consultation with IFC, the World Bank, and other Green Bond issuers and investors to promote “ring-fenced” Green Bond model for corporate bonds.
2.2 Participation Trends in Green Bonds – Issuers and Investors
In the initial years, Green Bonds were niche products, pioneered by a handful of development banks. However, with
growing market appetite for such bonds there is increasing diversification of issuers and investors participating in Green
Bonds.
Over the past two years, the issuance of Green Bonds has witnessed exponential growth led by a new class of issuers--
corporates, commercial banks and municipalities--as highlighted in Figure 9. Such issuances thereby indicate a
tremendous opportunity for developers and financial institutions to access the market directly, thereby opening doors for
the sector to access a larger pool of capital directly instead of depending on traditional sources of funding/financing
such as deposits, domestic markets, donor agencies, etc.
13 Issue Paper: Green Bonds in India
Canada21
US23
PuertoReco1
Brazil17
SouthAfrica5Namibia1
New Zealand8
Australia33
Indonesia1
SouthKorea1
Japan5Spain7 Italy5Switzerland6
Austria1 France11Ireland1
Iceland3Denmark3
UK40
Norway6Sweden15
Finland10
Germany19Netherlands37
Luxembourg2
Liechtenstein1
11Figure 9: Issuer Types for Green Bonds
Figure 8: PRI Signatories in Various Geographies (FIs)

The diversification trend is not just limited to issuers, but has also been observed for investor base participation in Green
Bonds.
With the initial Green Bonds issuances, the investor participation was limited to public sector institutions such as the
California State Teachers' Pension Fund and Sweden's AP Pension Fund, etc. However, with the general consensus
building up towards socially responsible investing amongst the investment community, in November 2013, IFC's USD 1
billion Green Bond offering observed a new set of investors such as the Ford Motor Company, Microsoft, and the central
banks of Brazil and Germany. Further, in January 2014, the World Bank's floating rate Green Bond attracted large
institutional investors such as BlackRock, TIAA-Cref and Goldman Sachs Private Wealth Management in addition to
other pension funds and sustainable investors. In the same period, Zurich Insurance announced USD 1 billion
commitment towards Green Bonds.
Asset owners and managers are increasigly focussing on Green Bonds. The primary economic consideration by
insitutional investors for such participation is that 55 percent of their assets are exposed to climate risks (including
heavier regulation of dirty industries); hence, participation in Green Bonds helps offset such risks. As per Skandinaviska
Enskilda Banken (SEB), a Swedish bank that is the largest underwriter of Green Bonds, more than 250 institutional
investors have bought at least one Green Bond, up from a handful two years ago. Such large investor participation can
be validated with recent oversubscription pattern for some of the popular corporate/commercial bank Green Bonds
issuances that were oversubsribed: GDF Suez (3x); EDF (2x); Unibail-Rodamco (3.4x); Korea Export Import Bank (3x).
Some of the other interesting observations in regards to a larger pool of investor participation towards Green Bonds
include:
- Unilever issued a EUR 250 million (USD 416 million) Green Bond in March 2014, in which 40 percent of
investor participation was from outside Britain—an uncommon response to a Sterling bond.
14 PACE-D Technical Assistance Program
12Figure 10: Diversification of Issuer Type
12 Crédit Agricole CIB – Report on Green Bond Market, 2014
USD
mill
ion

- Historically, AfDB benchmark bonds are mainly (average of 75 percent) bought by central banks and other
official bodies; however, with issuance of Green Bonds by AfDB, over 70 percent of investor participation was
from asset managers, insurers and pension funds.
- In South Korea, Green Bonds outperformed less colorful bonds. Last year, the yield on most South Korean bonds
rose 0.6 percent in response to tensions with North Korea. However, Green Bonds issued by South Korea's Exim
Bank rose by only 0.1 percent. As such, Green Bondholders proved more resilient than others.
With rising interest of investors, the market has witnessed a strong demand for new types of issuers and bond structures:
1. Asset-backed securities (ABS) – example, Toyota for hybrid and electric vehicle loans, etc.
2. Corporate bonds – example, Unilever for internal water and energy targets; Unibail-Rodamco, Vasakronan,
Regency Centres for green building portfolios, etc.
However, in most cases, increased demand for Green Bonds has not yet translated into pricing differences - pricing
remains largely in line with similar other category bonds. Figure 11 highlights the class of investors participating currently
in the Green Bond market.
15 Issue Paper: Green Bonds in India
13Figure 11: Investors (Type) Participation in Green Bonds
2.3 Terms of Issuance – Bond Rating, Coupon Rates, Tenure
Based on the recent issuance of Green Bonds, provides a scattered plot for comparison of trends in Figure 12relation to ratings, interest rates and tenure of Green Bonds.
13 Crédit Agricole CIB – Report on Green Bond Market, 2014

16 PACE-D Technical Assistance Program
12Figure 10: Diversification of Issuer Type
14Figure 12: Rates and Tenure for Similar Rated Green Bonds
14 The Currency of Green bonds issuance included at USD, EUR, GBP, CHF, SEK – Please refer Annexure I for details15 Supranational Bonds Issuances
15Figure 13: Rates and Tenure for Similar Currency Green Bonds (AAA Rated)
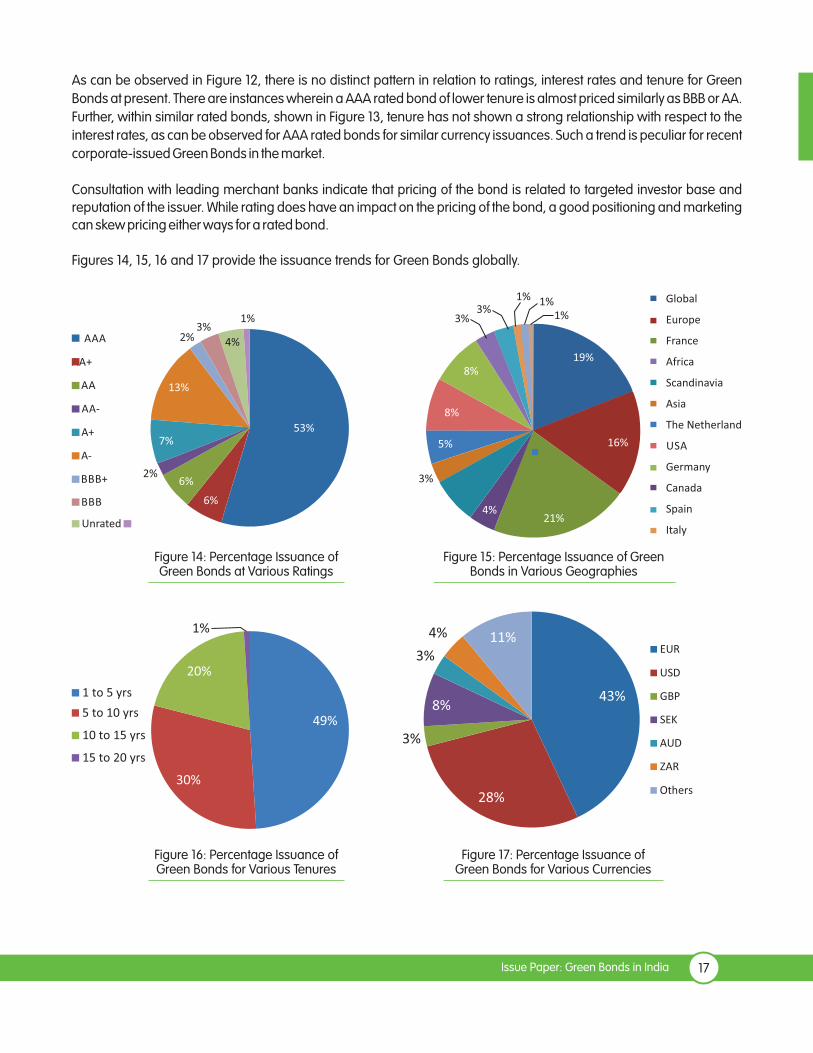
As can be observed in Figure 12, there is no distinct pattern in relation to ratings, interest rates and tenure for Green
Bonds at present. There are instances wherein a AAA rated bond of lower tenure is almost priced similarly as BBB or AA.
Further, within similar rated bonds, shown in Figure 13, tenure has not shown a strong relationship with respect to the
interest rates, as can be observed for AAA rated bonds for similar currency issuances. Such a trend is peculiar for recent
corporate-issued Green Bonds in the market.
Consultation with leading merchant banks indicate that pricing of the bond is related to targeted investor base and
reputation of the issuer. While rating does have an impact on the pricing of the bond, a good positioning and marketing
can skew pricing either ways for a rated bond.
Figures 14, 15, 16 and 17 provide the issuance trends for Green Bonds globally.
17 Issue Paper: Green Bonds in India
Global
Europe
France
Africa
Scandinavia
Asia
The Netherland
USA
Germany
Canada
Spain
Italy
8%
8%
5%
3%7%
4%21%
16%
19%
1%1%1%
3%3%
3%2% 4%
1%
13%
7%
2%6%
6%
53%
AAA
AA+
AA
AA-
A+
A-
BBB
Unrated
BBB+
Figure 14: Percentage Issuance ofGreen Bonds at Various Ratings
Figure 15: Percentage Issuance of GreenBonds in Various Geographies
Figure 16: Percentage Issuance ofGreen Bonds for Various Tenures
Figure 17: Percentage Issuance ofGreen Bonds for Various Currencies

2.4 Merchant Bankers – Active in Green Bonds
Merchant bankers have assisted various institutions in underwriting Green Bonds globally. As shown in , Crédit Figure 18
Agricole CIB, BAML and SEB are the main drivers of growth of Green Bonds.
18 PACE-D Technical Assistance Program
Figure 18: Underwriters - Issuance Volume
During the third quarter of 2014, Crédit Agricole CIB was the lead underwriter (in terms of value) of Green Bonds, followed narrowly by Bank of America Merrill Lynch (BAML) with issuance of over USD 140 million by each of the banks. Further, Crédit Agricole CIB was the lead underwriter on four of the top five deals of the quarter, including EUR 1.5 billion bond issuance by KfW. New merchant banker participation this quarter included Raiffeisen Bank International, National Financial Bank, Bank of Nova Scotia, Jefferies International Ltd., DBS Bank, Swedbank and ABG Sundal Collier. Table 1 provides details of top Green Bonds issuances in 2014.
Table 1: Top Green Bond Issuance in 2014 and Lead Underwriters
Issuer
KfW
AFD
EIB
NRG Yield
NIB
Size Lead Underwriters
EUR 1.5 billion (USD 2.04 billion)
EUR 1 billion (USD 1.3 billion)
EUR 500 million (USD 645 million)
USD 500 million
USD 500 million
CACIB, DB and SEB
BAML, BNPPAR, CACIB and HSBC
CACIB, DZK, RABO and Raiffeisen Bank International
BAML, CITI, GS, RBC
BAML, CACIB, SEB
2.5 Green Bonds – Key Learnings from International Market Trends
It is important to understand the international market trends while exploring Green Bonds for the Indian market. The key
learnings from the international market include:
Interest arbitrage against normal bonds does not exist: Currently, the Green Bonds market is at its infancy but it is rapidly
maturing and reaching a critical mass with larger investor participation. Therefore, current market trends indicate that
USD
mill
ion

while demand and supply gap exists, such a gap has not still reflected into pricing advantage for Green Bonds.
Green Bond investments are not social funds: All issuers should view Green Bond issuance to be competing with other
normal bonds. Irrespective of the mandate for ESG, investors will not allow climate change take precedence over the
risk/reward equation. On the contrary, investors prefer Green Bonds over normal bonds falling into similar risk/reward
equation.
The bond tenures are still low against requirement: The recently issued Green Bonds have low tenure mainly
concentrated between 3-10 years; however, there are issuances that have occurred for maturity of over 15 years. For the
Indian market, it is suggested to undertake shorter tenure Green Bonds issuance in the initial stage and go for longer
tenure after the international reputation in the bond market develops.
19 Issue Paper: Green Bonds in India


3.1 Structures for Green Bonds
Green Bonds can be structured in four ways. These are shown in Figure 19.
3 ISSUANCE OF GREEN BONDS IN INDIA
21 Issue Paper: Green Bonds in India
1. Green Use of Proceeds Bonds
Green Bonds Types
2. Green Use of Proceeds Revenue Bonds
3. Green Project Bond
4. Green Securitized Bond
‘Recourse’ to the Issuer, use of proceeds to a sub portfolio of green projects.
Issuer defines the usage and sets up an internal process to track and report. Also sometimes cited as Corporate Green Bonds.
'Non-Recourse' to the issuer. Normally cited as Portfolio Bonds.
Bond holders have recourse to pledged cash-flows, revenue streams, fees, taxes, etc. of selected projects.
Use of proceeds may go to related/ unrelated green projects. Usage declared and tracked by the issuer.
For a single or multiple Green Project(s) for which the investor has direct exposure to the risk of the project(s) with or without potential recourse to the issuer.
A bond collateralized by one or more specific projects, including but not limited to covered bonds, ABS, and other structures.
The first source of repayment is generally the cash flows of the assets. This type of bond covers, for example, asset-backed securitizations of rooftop solar PV and/or energy efficiency assets.
Use of Proceeds Bonds (Corporate Green Bonds): The issuance, under this structure, is undertaken by the corporate
entity and proceeds from the bonds is allocated for a sub-portfolio of green projects under the corporate. The issuer sets
up internal processes to track the usage of proceeds and reports the same to investors on regular intervals. This
structure allows for complete recourse to the issuer.
Figure 19: Types of Green Bonds
In June 2014, Hera Group, one of the largest utilities in Italy, issued EUR 500 million Green Bonds at coupon rate of
2.375 percent and tenure of 10 years. The structure for the bonds issuance was corporate bonds, with proceeds to

be utilized to refinance current portfolio of green projects and further expand company's green assets. The areas of
investments included RE (EUR 54 million), Energy Efficiency (EUR 282 million), Clean Water (EUR 37 million), and
Waste Management (EUR 57 million).
These Green Bonds, which received a rating of BBB by S&P and Baa1 by Moody's, were oversubscribed by three
times. Investors with ESG investment criteria accounted for 69 percent of the total demand, with over 75 percent of
investors being non-Italian asset managers. From the proceeds, total current asset refinanced was estimated at
EUR 503 million and new pipeline investment estimated at EUR 108 million. Post issuance, the company could
either finance/refinance the declared eligible green projects.
Use of Proceeds Revenue Bonds (Portfolio Bonds): This structure allows bond holders to have recourse to pledged cash-
flows, revenue streams, fees, taxes, etc. of selected projects ring-fenced for the bonds. However, use of proceeds may
go to related/unrelated green projects. The usage of the proceeds is declared and tracked by the issuer.
In 2013, Hannon Armstrong Sustainable Infrastructure issued USD 100 million Green Bonds through securitization
of assets at coupon of 2.79 percent. The bonds were backed by contracted cash flows generated from 100
individual wind energy, solar energy, and energy efficiency infrastructure installations valued at approximately
USD 110 million. Details of the underlying assets such as investment-grade credit quality of the obligor, the quality of
the equipment, the strength of the contracts, and the sound project structures were shared with the investors
during the issuance of the bonds.
Green Securitized Bond: A bond collateralized by one or more specific projects, including but not limited to covered
bonds, ABS, and other structures. The first source of repayment is generally the cash flows of the assets. This type of bond
covers, for example, asset-backed securitizations of rooftop solar PV and/or energy efficiency assets.
22 PACE-D Technical Assistance Program
In 2014, Toyota Financial Services (TFS) issued USD 1.75 billion asset-backed Green Bonds, wherein, the proceeds
from the bonds are used to fund new retail finance contracts, while the issued bonds are backed from the
proceeds of the car loan portfolio of TFS.
Green Project Bond: For single or multiple Green Project(s) for which the investor has direct exposure to the risk of the project(s) with or without potential recourse to the issuer.
In 2014, the Overseas Private Investment Corporation (OPIC) issued USD 47.3 million Green Project Bonds with
interest rate at 3.28 percent and tenor of 15 years for the Luz del Norte solar project (141 MW) in Chile. The coupon
payments for the bond are streamed from the revenue of the project. As an additional safety for the investors, OPIC
offered a guarantee of payment to investors in case of default on payment from the project proceeds. Such
guarantee allowed for lower risk perception by the investors and hence OPIC was able to raise the bonds at a
lower coupon rate.

Portfolio of operating assets/under development assets can be built in two ways:
3.1.1 Aggregate Assets from Project Developers
Under this method, IPPs will constitute a portfolio of high quality operating/underdeveloped assets from their current projects or pipeline. The IPPs thereon issue Green Bonds for this portfolio. Special Purpose Vehicles (SPV) could be used to ring-fence the cash flows of the portfolio. Proceeds of Green Bonds can thereon be used to retire loans from domestic FIs.
This structure is also known as Corporate Bonds or Green Project Bonds. ts this structure.Figure 20 highligh
23 Issue Paper: Green Bonds in India
Figure 20: Structure of Corporate Bonds
3.1.2 Aggregate Assets from Lenders
Under this method, FIs constitute a portfolio from their current/prospective loans into a ring-fenced SPV. FIs issue Green Bonds on the portfolio and the SPV channel the cash flows of the portfolio for repayments. Based on the terms and tenure of the Green Bonds, FIs can renegotiate the terms of loans with RE developers.
This structure is also called Portfolio Bonds or Green Securitized Bonds. this structure. Figure 21 highlights

24 PACE-D Technical Assistance Program
Financial Ins�tu�on
Figure 21: Structure of Portfolio Bonds
3.2 Process Flow for Issuance of Green Bonds
A typical Green Bond issuance by an agency involves the following steps:
1. Structure of Green Bonds and risk mitigation: There are multiple ways to structure Green Bonds (as described in
Figure 19). However, the key consideration for selecting a structure should be to minimize risks associated with
the underlying bond issuing agency. Measures such as insurance, currency hedge, etc. can be further
undertaken to reduce risks associated with the underlying issuing agency and its asset pool.
2. Credit enhancement: Based on the ratings, which will be capped by sovereign ratings, further measurements
of partial guarantee by internationally AAA rated agencies such as IFC, ADB, USAID, AFD, etc. can be
undertaken to upgrade the ratings beyond the sovereign ratings which can lead to reduction in cost of capital
raised through the instrument.
3. Ratings and green certification: Based on the above, agencies can get ratings by international agencies such as
FITCH. Green certification can also be obtained through standard bodies such as the Climate Bond Initiative.
4. Issuance of Green Bonds: Such issuances can be undertaken by international merchant bank(s) that can
thereon assist in processes such as exchange listing, roadshows, etc.

A general process flow for issuance of Green Bonds in the market is shown in Figure 22.
25 Issue Paper: Green Bonds in India
Figure 22: Process Flow for Issuance of Green Bonds
Identify High QualityAssets
Mitigate ResidualRisks
Enhance CreditRating
Get GreenCertification
Select AppropriateListing
Resource risks
Stable operatingperformance vis-a-visdesign performance
PPA quality
OEM quality
Low regulatory risksin the states whereassets are located
Additional insurancecovers, forunmitigated risks-such as RE Resourceor Plant Performance
Currency Hedge
OPIC. MIGA orequivalent covers forregulatory risks in thecountry, for bondholders
The Bondsmay be listedor unlisted-issued to afew QualifiedFinancialInvestors
LondonLuxembourgNY areproven placesfor listing
DFIs such as WBor ADB may givesuch creditenhancement atsome cost.
Design securitizationmode (pledges,mortgages, cash-low charge, SPVetc)
For ex: ClimateBond StandardsBORD (CBSB) orClimate BondsInitiative (CBI)
Green BondPrinciples (2014)announced by aconsortium of leadingbanks outlinesprinciples ofdesigning, disclosing,managing andreporting
3.3 Key Challenges for Indian Entities
The following challenges are considered key risk elements for issuance of Green Bonds for Indian entities. Please note
that the PACE-D TA Program is currently focused on evaluating such risks in greater details.
• Hedging costs: Currently, hedging costs are very high (estimated at 8 percent and above for 10 year tenure)
and hence take away the cost advantage for foreign currency financing in India. There is a need to explore
instruments/methods that can enable reduction of such costs.
India's current sovereign rating of BBB- is not attractive to risk-averse investors. Thus credit• Credit ratings:
enhancement, offered by multiple agencies such as IFC, AFD, and USAID-DCA, can help enhance credit
rating. However, there are costs associated with such credit enhancement services. Such costs vis-à-vis
potential benefits of interest rates reduction are required to be analysed.
The external commercial borrowing (ECB) guidelines pose certain challenges for the usage of• Regulations:
proceeds from Green Bonds. Viable solutions could include:
o Refinancing SPVs by IPPs that issue corporate bonds in foreign currency
o On-lending possibility for SPV of Infrastructure Finance Company created for issuance of Green
Bonds
o Issuances of Green Bonds by an overseas SPV of a domestic FI
o Only 25 percent of ECBs are allowed to refinance existing loans. Remaining 75 percent should be
used for development of new construction, which poses a challenge for launching Green Bonds for
operational assets.

26 PACE-D Technical Assistance Program
Some of the key applicable ECB norms include:
Category
Automatic Approval under ECB norms
Withholding Tax
On-lending
Norms
1. Maximum USD 750 million per transaction
2. Minimum maturity of five years
3. Interest rates have to be < 300 bps+ Libor for 3-5 years
tenure and 500 bps+ Libor for higher tenures
1. 5%
1. Only Infrastructure Finance Companies (IFCs) can use ECBs
for on-lending with 75% of currency hedging
• Double taxation: 16Interest on ECBs may be subject to double taxation, first locally and then in the resident
country of the SPV issuing the bonds. Issuing bonds while avoiding double taxation will make green bonds
more attractive. However an intermediate structure through a tax efficient domicile could be required to
bring funds from foreign investors.
16 Withholding tax

At present, the biggest challenge for Indian entities to participate in Green Bond issuances in foreign currencies is the high cost of hedging and low sovereign credit ratings. In this regards, the impact of such factors can have a cost escalation of 100-250 basis points as shown in Figure 23.
4 RECOMMENDATIONS FOR IMPROVEMENTOF FLOW OF GREEN BONDS IN INDIA
27 Issue Paper: Green Bonds in India
Based on the existing challenges and market analysis, the program recommends the following steps to promote Green Bonds in India. See Figure 24 for details on assistance provided by the PACE-D TA Program for Green Bonds.
• The Government of India can provide such facility through its reserves for aExchange risk liquidity facility: range bound period especially when there is larger fluctuation in currency, which leads to higher costs.
• The sovereign rating for India is BBB-, while rating of AA onwards will Seek support of Green Climate Fund (GCF):
be required to attract large pension funds, insurance companies, etc. to offer favorable rates and tenure.
Hence, India should seek support from Green Climate Fund to provide risk mitigation products such as partial
credit guarantees, risk guarantees or hedging products for entities issuing Green Bonds. Such instruments will
enable issuing entities to overcome the sovereign ratings cap.
17 Nov 2014; IMF Estimate, CPI, ISB report 2014
rated bonds
13.3%
10.5%-11.6%
17Figure 23: Estimating 'Cost' of Green Bonds for Borrowers
Sta
ck u
p o
f Pre
sen
t Co
st o
f Bo
rro
win
g
Po
ten
tial R
ed
uct
ion
in th
e C
ost
of B
orr
ow
ing
-FIs
interest ratelower
Green Bonds

28 PACE-D Technical Assistance Program
• Reduction in hedging risks: Currency risks can also be mitigated through the following measures:
o Indexing electricity tariffs to inflation rates (will act as an exchange risk liquidity facility)
o Indexing tariff for export oriented facilities/zones to foreign currency (for example, USD) such that that utilities
can buy corresponding power linked to the foreign currency and the generators can thereby borrow in the
same denomination
o Re-financing restrictions for well rated issuers/portfolios could be relaxed.
Figure 24: Assistance Provided by the PACE-D TA Program for Green Bonds Issuance in India
The PACE-D TA Program is providing assistance to IPPs, corporates, and financial Institutions in evaluating Green Bonds as a financing option. It is currently in talks with institutions such as IREDA and welcomes other stakeholders to initiate a dialogue to evaluate the possibility of issuing Green Bonds in India. The following support activities are been undertaken by the program.

5 ANNEXES
29 Issue Paper: Green Bonds in India
5.1 Case Studies
5.1.1 Case Analysis - Corporate Green Bonds Issuance for RE Companies
Iberdrola, a Spanish renewable energy company, issued green bonds in 2014 that was oversubscribed by four times with investors with ESG investment criteria accounting for 57 percent of the total demand. The structure for the bonds issuance was corporate bonds, with proceeds to be utilized to refinance current portfolio and further expand company's green assets. The projects included in the area of RE, transmission and distribution that connect renewable energy, and smart grids.
The different investor participation ratio for the issuance was as follows: fund managers – 68 percent; insurance and pension funds – 21 percent, bank – 7 percent, and others – 4 percent. The geographical participation included Germany and Austria – 28 percent, France – 24 percent, Iberia – 17 percent, UK – 14 percent, Benelux – 8 percent, and Switzerland – 3 percent.
5.1.2 Case Analysis - Green Bonds Issuance for Banks/Financial Institutions
NRW Bank, Germany based regional commercial bank, raised EUR 250 million in November 2013 to fund environment friendly water and energy projects through Green Bonds. Green Bonds were rated AAA and carry coupon rate of 0.75 percent and tenure of four years. Encouraged with the success of the first issuance, the bank followed it up with another offering in October 2014 for EUR 500 million worth of Green Bonds. These bonds received a rating of AAA carrying coupon rate of 0.25 percent and tenure of four years. The offering got oversubscribed by two times. About 50 percent of the investors were SRI investors.
Year ofIssuances:2013, 2014
InterestRate: 0.75%,
0.25%
Tenure: 4years each
Ra�ng: AAA
Amount:EUR250 mn,EUR 500 mn

30 PACE-D Technical Assistance Program
The proceeds from the issuance were declared for usage both for refinancing portfolio and financing new projects.
Further, in 2013, NRW Bank did not get second party opinion on its green credentials; however in 2014, the bank obtained
second opinion, which lent more transparent declaration for bond proceeds usage--a case that potentially may have
impacted bond cost reduction for the second issuance.
5.1.3 Case Analysis - Green Bonds Issuance for Banks/Financial Institutions
Greenko Group, an India based IPP with diversified portfolio of about 700MW operational RE assets and 300MW of RE
projects pipeline recently issued bonds for USD500mn in Singapore with a coupon rate of 8% and tenure of 5 years
pipeline. While the issuance was not classified as Green Bonds; however, the green asset backed bonds was
oversubscribed 2 times over, while its ratings was at ‘B’ as per Standard & Poor (S&P).
The company issued bonds from fully owned offshore subsidiary Greenko Dutch BV in USD and Greenko Dutch BV on
lend Rupee term loans to SPVs to refinance debt from local banks and NBFCs. This structure allowed Greenko Group to
refinance local debt with debt raised from foreign market and pay higher interest for foreign debt than allowed by RBI
under ECB norms.
Currently RBI is seeking clarification from the company on the structure of the issued bonds and indicators are that RBI
may restrict further issuances under similar structures.
5.2 List of Green Bond Issuance
5.2.1 Supra-National Green Bond Issuance
Issuer
African Development Bank
MaturityIssue DateAmt. O/S(in US$)
Currency Coupon
Mar-14
Oct-13
Feb-14
Aug-10
Mar-10
Oct-10
Oct-10
Asian Development Bank
$157.0
$500.0
$153.8
$11.5
$77.4
$70.0
$38.4
SEK
USD
SEK
AUD
NZD
AUD
NZD
1.75%
0.75%
0.933%
0.5%
4.52%
4.8%
3.71%
Mar-19
Oct-16
Feb-19
Sep-20
Mar-14
Oct-14
Oct-14
Aug-10
Aug-10
Aug-10
Aug-10
$73.0
$107.6
$19.9
$44.7
BRL
AUD
BRL
TRY
0.5%
4.35%
7.02%
0.5%
Sep-17
Sep-14
Sep-14
Sep-17
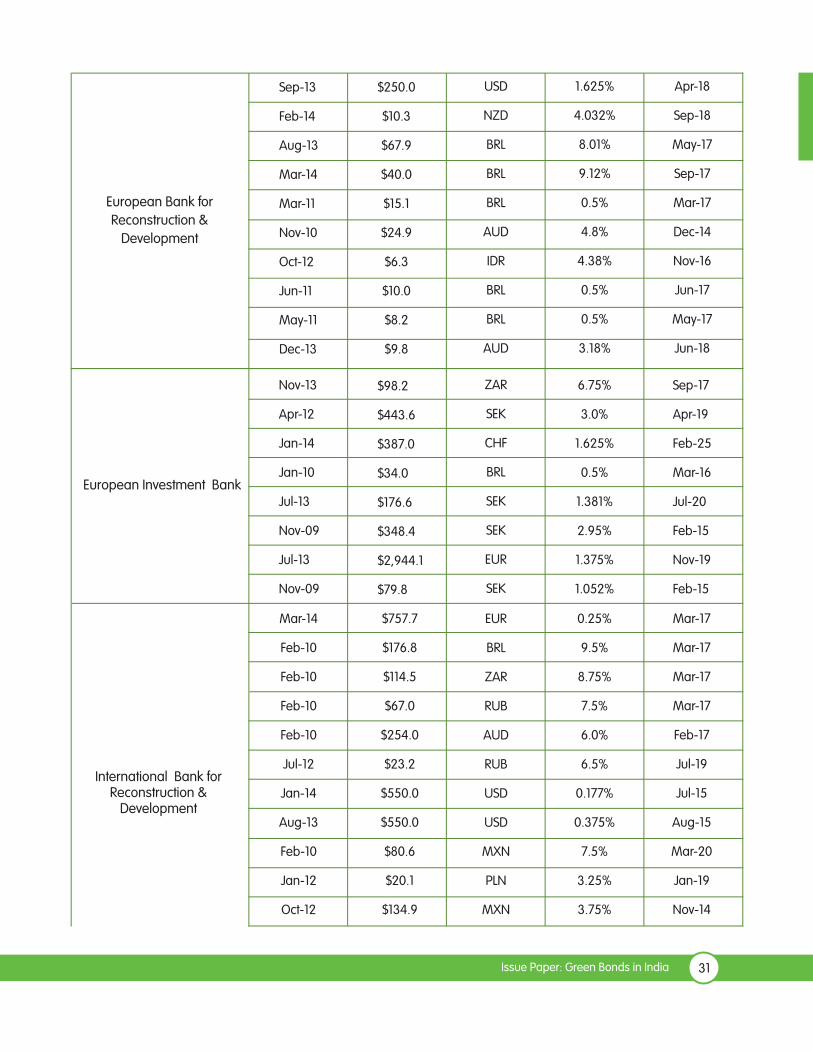
European Investment Bank
Nov-13
Apr-12
Jan-14
Jan-10
Jul-13
Nov-09
Jul-13
Nov-09
$98.2
$443.6
$387.0
$34.0
$176.6
$348.4
$2,944.1
$79.8
ZAR
SEK
CHF
BRL
SEK
SEK
EUR
SEK
6.75%
3.0%
1.625%
0.5%
1.381%
2.95%
1.375%
1.052%
Sep-17
Apr-19
Feb-25
Mar-16
Jul-20
Feb-15
Nov-19
Feb-15
Mar-14
Feb-10
Feb-10
Feb-10
Feb-10
Jul-12
Jan-14
Aug-13
Feb-10
Jan-12
Oct-12
International Bank forReconstruction &
Development
31 Issue Paper: Green Bonds in India
$757.7
$176.8
$114.5
$67.0
$254.0
$23.2
$550.0
$550.0
$80.6
$20.1
$134.9
EUR
BRL
ZAR
RUB
AUD
RUB
USD
USD
MXN
PLN
MXN
0.25%
9.5%
8.75%
7.5%
6.0%
6.5%
0.177%
0.375%
7.5%
3.25%
3.75%
Mar-17
Mar-17
Mar-17
Mar-17
Feb-17
Jul-19
Jul-15
Aug-15
Mar-20
Jan-19
Nov-14
European Bank for
Reconstruction &
Development
Sep-13
Feb-14
Aug-13
Mar-14
Mar-11
Nov-10
Oct-12
Jun-11
May-11
Dec-13
$250.0
$10.3
$67.9
$40.0
$15.1
$24.9
$6.3
$10.0
$8.2
$9.8
USD
NZD
BRL
BRL
BRL
AUD
IDR
BRL
BRL
AUD
1.625%
4.032%
8.01%
9.12%
0.5%
4.8%
4.38%
0.5%
0.5%
3.18%
Apr-18
Sep-18
May-17
Sep-17
Mar-17
Dec-14
Nov-16
Jun-17
May-17
Jun-18

32 PACE-D Technical Assistance Program
Jan-13
Jul-12
Oct-10
Jul-11
Jan-10
Dec-12
Aug-11
Oct-10
Dec-10
Jul-11
May-11
Jan-12
Feb-12
Jan-11
Mar-11
Apr-11
May-11
Feb-10
Feb-11
$9.2
$5.0
$3.9
$28.3
$106.8
$7.5
$7.7
$15.1
$10.0
$10.1
$2.1
$10.0
$50.0
$30.0
$10.0
$10.0
$10.0
$1.4
$10.0
ZAR
USD
MYR
EUR
NZD
MYR
USD
SEK
USD
CAD
USD
USD
USD
USD
USD
USD
USD
JPY
USD
0.5%
1.5%
1.375%
2.25%
5.23%
2.5%
2.5%
3.5%
2.0%
3.0%
0.236%
0.84%
0.92%
2.135%
2.2%
2.18%
1.71%
0.875%
2.34%
Jan-18
Jul-22
Nov-15
Jul-16
Jan-15
Dec-19
Aug-21
Nov-20
Oct-16
Aug-21
May-21
Feb-17
Jun-15
Apr-16
Mar-16
Apr-16
Jun-16
Mar-20
Feb-16
Feb-10
Feb-10
Feb-10
Feb-10
Nov-08
Feb-10
Feb-10
Feb-10
Jun-13
Jul-12
$91.0
$48.8
$67.5
$34.7
$415.7
$218.7
$2.7
$11.1
$16.1
$10.0
COP
TRY
NOK
NZD
SEK
SEK
EUR
HUF
RUB
USD
8.0%
10.0%
3.75%
5.625%
3.5%
3.25%
2.5%
5.5%
6.75%
0.625%
Mar-20
Mar-17
May-17
Mar-17
Nov-14
Dec-17
May-17
May-17
Jun-23
Jul-17

5.2.2 Government Agency - Green Bond Issuance
Issuer
Region of Ile de France
Region of Nord-Pas deCalais France
Region of Provence AlpesCote d' Azur France
MaturityIssue DateAmt. O/S(in US$)
Currency Coupon
Mar-12
Sep-12
Jul-12
Kommunalbanken AS
$466.8
$103.2
$145.8
EUR
EUR
EUR
3.625%
3.42%
3.6%
Mar-24
Oct-24
Jul-24
Nov-13
Nov-13
$500.0
$500.0
USD
USD
0.75%
0.75%
Nov-16
Nov-16
33 Issue Paper: Green Bonds in India
May-11
Oct-13
Oct-13
Sep-13
Feb-14
Aug-12
Oct-11
Sept-14
$25.6
$203.3
$20.9
$77.8
$54.6
$75.5
$120.1
EUR1bn
ZAR
BRL
AUD
SEK
EUR
SEK
ZAR
EUR
6.1%
8.14%
3.51%
2.413%
0.241%
2.75%
4.9%
1.37%
May-14
Oct-16
Oct-18
Sep-18
Feb-19
Sep-32
Nov-15
Sept-24Agence Française de
Dévelopement
Feb-11
Nov-10
Jun-10
Jun-10
International Finance Corp
$30.0
$29.2
$3.1
$3.2
USD
AUD
MXN
ZAR
2.0%
5.4%
6.15%
7.2%
Feb-16
Nov-15
Jun-15
Jun-15
Nov-13
Apr-12
Feb-13
Apr-10
May-11
May-11
$1,000.0
$500.0
$1,000.0
$200.0
$22.7
$44.0
USD
USD
USD
USD
EUR
AUD
0.625%
0.5%
0.5%
2.25%
1.43%
4.75%
Nov-16
May-15
May-16
Apr-14
May-14
May-14

34 PACE-D Technical Assistance Program
Feb-11
Feb-11
Feb-11
$4.7
$7.2
$13.5
INR
AUD
BRL
5.0%
5.0%
0.5%
Mar-15
Mar-15
Mar-15
City of Gothenburg SwedenSep-13
Sep-13
Jan-14
Feb-13
SEK
SEK
USD
USD
2.915%
1.439%
3.25%
3.42%
5%
0.875%
1.75%
1.75%
4.81
2.13%
Oct-19
Oct-19
Dec-28
Nov-31
Nov-23
Jan-17
Feb-18
Oct-39
100 yrs
Oct-39
Connecticut
Hawaii State
East CentralWastewater - Florida
Export Development Canada
Export-Import Bank of Korea
Province of Ontario
District of Columbia Water
Commonwealth ofMassachusetts
$39.4
$39.4
$60.0
$150
$86.6
$300.0
$500.0
$500.0
$350
$350
Nov-14
Jan-14
Feb-13
Oct-14
Sept-14
Sept-14
USD
USD
USD
CAD
USD
USD
5.2.3 Commercial – Green Bond Issuance
Issuer
Credit Agricole Corporate& Investment Bank SA
MaturityIssue DateAmt. O/S(in US$)
Currency Coupon
Dec-13
Jan-13
Oct-13
Jun-13
Dec-13
Sep-13
Jun-13
Oct-13
May-13
$52.0
$3.6
$136.2
$0.4
$53.6
$54.7
$1.2
$20.0
$5.5
Dec-18
Aug-16
Oct-17
Jul-20
Dec-18
Sep-20
Jul-18
Nov-18
Dec-17
Nov-13
Nov-13
Nov-13
Issuer Type
USD
BRL
JPY
BRL
AUD
JPY
JPY
MXN
MXN
2.01%
6.0%
0.35%
2.0%
4.54%
0.68%
4.8%
4.22%
0.5%
Commercial Bank
Commercial Bank
Commercial Bank
Commercial Bank
Commercial Bank
Commercial Bank
Commercial Bank
Commercial Bank
Commercial Bank
NRW Bank
Bank of America Corp
Electricite de France
$339.9
$500.0
$1,899.8
EUR
USD
EUR
0.75%
1.35%
2.25%
Nov-17
Nov-16
Apr-21
Commercial Bank
Commercial Bank
Private Corporation

35 Issue Paper: Green Bonds in India
Vasakronan AB
Mar-14
Nov-13
Nov-13
$55.1
$152.3
$45.7
SEK
SEK
SEK
2.473%
1.315%
1.774%
Mar-19
May-16
May-16
Private Corporation
Private Corporation
Private Corporation
5.2.4 Private Corporations – Green Bond Issuance
Issuer Bond Name Rating Tenure IssuanceAmount
RateYear
2014
2014
2014
2014
2014
2014
2014
2014
2014
2014
2014
2014
2014
2014
2014
2014
Toyota
BNG
Münchener
Hypothekenbank
NIB
Region Ile de France
Unilever
Unibail-Rodamco
Lloyds Bank
GDF Suez
SCA
Iberdrola
Skanska
Regency Centers
Vornado
HERA
Abengoa
AAA
AAA
AAA
AAA
AA
A+
A
A
A
A-
BBB+
BBB
BBB
BBB
BBB
B
2/3/5
5
5
7
12
4
10
4.5
6/12
5
8
5
10
5
10
5
$1,084m
EUR500m
EUR 300m
USD500m
EUR 600m
GBP 250m
EUR 750m
GBP250m
EUR 2,500m
SEK 1,500m
EUR 750m
SEK 850m
USD 250m
USD 450
EUR500m
EUR265m
0.375
0.375
2.25
3.625
2.0
2.5
1.895
2.5
2.5
3.75
2.5
2.375
6.5
2014
2014
2014
2014
2014
Martha's VineyardLand Bank
Spokane
Verbund AG
NTE
NTE
Auto ReceivablesGreen ABS
Sustainable Bond
Unilever GreenSustainability Bond
Green Bond
Green Bond
Green Bond
Green Bond
Green Bond
Green Bond
Green Bond
Green Bond
Green Bond
Green Bond
ESG (sustainable)
Pfandbrief
EnvironmentalBond
Green SustainabilityBond
Green Bond - Water/Sewers
Green Bonds – Hydro/Wind
Green Bonds
Green Bonds – Hydro
Green Bonds – Hydro
AA
BBB+
AA+
1-20
10
5-20
5
3
USD181
EUR500
USD35
NOK400
NOK100
3-5
1.5
3.25-5
NIBOR+67bps
NIBOR+48bps

36 PACE-D Technical Assistance Program
2014
2014
2014
2014
2014
2014
NTE
Stockland TrustManagement Ltd
Innovatec SpA
Orebro kommun
Fastighets ABFörvaltarenAdvanced
SemiconductorEngineering
Green Bonds – Hydro
Green Bonds – Waste/Water/Energy/Green Building
Green Bonds - Efficiency
Green Bonds – MunicipalPrograms
Green Bonds- Hydro
Green Bonds – LowCarbon Transition
A-
AA+
AA-
BBB
7
7
6
5
5
3
NOK300
EUR300
EUR10
SEK750
SEK400
USD300
NIBOR+79bps
1.50
8.125
5
5.2.5 Potential Green Bonds Issuer in India
Developers
ONGC
Renew Power
Azure Power
Panama Wind
NTPC
Bharat Light and Power
Hero Future Energy
NSL Renewable
Greenko
Green Infra
Tata Power
NALCO
Greenko
Green Infra
Tata Power
NALCO
Financial Institutions
IREDA
REC
Yes Bank
PFC
Punjab National Bank
Axis Bank
IIFCL
L&T Infrastructure
ICICI
IDFC
Bank of Baroda
HDFC Bank
PTC Financial
SBI
Sriram Capital
IL&FS
Union Bank of India
ING Vysya
Tata Capital
ICICI
SREI
IDBI
Central Bank of India
Kotak Mahindra

Notes

Notes


U.S. Agency for International Development1300 Pennsylvania Avenue, NW
Washington, DC 20523
Tel: (202) 712-0000
Fax: (202) 216-3524
www.usaid.gov