greater cambridge partnership joint assembly …
TRANSCRIPT

Democratic Services Contact Officer: Democratic Services 03450 450 500 [email protected]
9 January 2018
To: Members of the Greater Cambridge Partnership Joint Assembly: Councillor Kevin Price Cambridge City Council (Chairperson) Councillor Tim Wotherspoon Cambridgeshire County Council (Vice Chairperson)
Councillor David Baigent Cambridge City Council Councillor Tim Bick Cambridge City Council Councillor Noel Kavanagh Cambridgeshire County Council Councillor John Williams Cambridgeshire County Council Councillor Grenville Chamberlain South Cambridgeshire District Council Councillor Kevin Cuffley South Cambridgeshire District Council Councillor Bridget Smith South Cambridgeshire District Council Sir Michael Marshall Marshall Group Mark Robertson Cambridge Regional College Claire Ruskin Cambridge Network Helen Valentine Anglia Ruskin University Dr John Wells Cancer Research UK Cambridge Institute Andy Williams AstraZeneca Dear Sir / Madam You are invited to attend the next meeting of GREATER CAMBRIDGE PARTNERSHIP JOINT ASSEMBLY, which will be held in the KRIES VIERSEN ROOM, SHIRE HALL, CAMBRIDGE on THURSDAY, 18 JANUARY 2018 at 2pm. Requests for a large print agenda must be received at least 48 hours before the meeting.
AGENDA SUPPLEMENT
PAGES 9. Appendix A - Our Big Conversation Key Findings 1 - 14

This page is left blank intentionally.
1
Our Big COnversatiOn - Key FindingsSummary report of the Greater Cambridge Partnership’s public
engagement and surveys September – November 2017
Page 1
Agenda Item
9

2 3
MethOdOlOgy
introduction
‘Our Big Conversation’ in Autumn 2017 was a chance for the Greater Cambridge Partnership to talk and listen to your views on the Greater Cambridge growth story – the current challenges you face and your ideas for the future.
Cambridge and South Cambridgeshire together remains one of the fastest growing places in the UK, with Cambridge set to be the UK’s fastest growing city in 2018*.
To remain competitive in a post-Brexit economy – whilst continuing to offer a good quality of life for our local communities – it is vital we invest now for our future success.
To ensure a dynamic and thriving economy, Greater Cambridge needs to maintain the right balance of jobs, housing and a well-connected transport network.
The Greater Cambridge Partnership, the local delivery body for a city-based growth deal with central Government, is in a unique position to make a real difference. With access to funding of more than £500 million, the Partnership has the drive and determination to accelerate growth in a way that means more people can benefit from it across a wider area, as well as playing a vital role in the UK economy overall.
Our Big Conversation generated more than 10,000 individual responses and comments including at 38 public events from community pop-ups at supermarkets, workplaces and transport hubs, to business workshops and Councillor briefings.
Your wide-ranging feedback will now be used by our decision-makers to inform how the Greater Cambridge Partnership prioritises and invests future funding to ensure long-term benefits for existing and future generations.
Thank you for taking the time to share your views with us.
Rachel Stopard Chief executive Officer greater Cambridge Partnership
* Source: UK Powerhouse Report, Irwin Mitchell and CEBR
Our Big Conversation was delivered as an integrated campaign between september 25 and november 20 2017*. Objectives:
1. Generate a quantitative and qualitative evidence-base to help inform development of the Greater Cambridge Partnership’s Future Investment Strategy in 2018
2. Raise public awareness of the Greater Cambridge growth story and the role of GCP in supporting this
3. Generate dialogue and promote active involvement in the development of long-term solutions across the GCP work-streams of transport, housing, skills and Smart.
The campaign also served to provide wider context-setting for early GCP schemes and forthcoming consultations in 2017/18.
Quantitative and qualitative data
The campaign used three mechanisms for seeking and recording public feedback:
1. Our Big Conversation general dialogue, including individual comments, paper and online surveys, to capture views on challenges/potential solutions to growth, transport, housing, skills and technology (GCP Communications and Engagement Team) 484 survey responses/770 comments recorded.
2. Targeted Computer Aided Telephone Interview (CATI) travel survey of a representative sample of 1,021 Cambridge and South Cambridgeshire residents (systra).
3. Self-selecting and targeted residents’ and commuter travel survey (travel for Cambridgeshire). 7,635 survey responses/250 comments recorded.
*Feedback from two additional public events at Cambridge Guildhall and Papworth Hospital, held on December 6 and 7 respectively, are incorporated into the results.
audience & Channels
The campaign targeted the following key audiences:
• Residents
• Commuters
• Students
• Employers - Employees
• Elected members
Traditionally under-represented groups were targeted in the travel survey exercise to capture a broad and representative range of views from local residents.
COntents
2 Introduction
3 Methodology
4-5 Campaign Impact
6-7 Findings (theme 1): We are traffic!
8-9 Findings (theme 2): Rock, Paper, Scissors (Bike, Bus, Train)
10-11 Findings (theme 3): Cost and Benefits
12-13 Findings (theme 4): Ticket to Ride/Up all Night
14-15 Findings (theme 5): Love the Bus
16-17 Findings (theme 6): Love the Bicycle
18-19 Findings (theme 7): Access for all
20-21 Findings (theme 8): The Trouble with Housing
22-23 Findings (theme 9): Skills and Learning
24 Feedback – Stakeholder views
25 Further information
authors:
Beth Durham, GCP Head of Communications
Michael Soper, Performance and Research Manager, Cambridgeshire County Council
Aaron Rowinski, Business Intelligence Analyst, Cambridgeshire County Council
Audience
Advertising
Soci
al m
edia
chan
nels
Direct
Sponsorship
Earne
d m
edia
E-mail marketingPrint material
Digital m
edia
Page 2

4 5
CaMPaign iMPaCt
A detailed campaign impact report, with sources where applicable, can be found at www.greatercambridge.org.uk/the-big-conversation
Channels
Our Big Conversation provided information and opportunity for engagement across the following channels:
PuBliC eventsCommunity pop-upsBusiness workshopsCouncillor briefingsYouth events
MarKeting MaterialsOur Big Conversation leafletsGreater Cambridge Travel Surveys
digital & sOCialGCP WebsiteE-mailsTwitterFacebookLinkedInYouTube
Media rePOrtsPrintBroadcast
Partner uPdatesE-mailsNewsletters
advertisingNewspapersResidents’ newslettersProgrammes
79,393Opportunities to see +
2,912interactions with
members of the public at
38face-to-face events
Print materials
75,161 Opportunities to see from
5,000 owned leaflets +
800 feedback forms distributed
69,361 travel surveys
distributed leading to
9,140survey responses
2,883 recorded comments
social media
We posted over
100 times across social media platforms,
generating more than
129,761impressions
events
675,661 Opportunities to see from
15media mentions
1,863individual comments
submitted
3 videos watched
385 times
2,384 unique page views from
37 web pages and
news stories
gCP website
505,812 Opportunities to see from
27 earned partner communications updates
Partner communications
Media advertising
123,017 Opportunities to
see from paid-for advertising
4 5
Page 3

Hig
h de
nsity
hou
sing and houses
Par
ents
driv
ing their
of m
ultip
le o
ccupancy in
child
ren
to sc
hool.
6 7
theMe 1 – We are traFFiC! theMe 1 (data) – We are traFFiC!
A significant number of those who took part in the Big Conversation acknowledged that traffic and congestion were a problem. The Systra Travel Survey identified that over 57% of people travel in and around Cambridge five or more times week and over 87% of people travelled around the area at least once a week: however, most people talked about the behaviour of others and how that needed to change rather than identifying what they could do differently. Respondents also identified significant cultural change as a result of the rate of growth.
Results show a significant difference in frequency of travel by journey purpose: 86.5% of commuters travel in and around Cambridge five or more times a week, significantly higher than both leisure travellers (57.7%) and those who travel on business/personal business (55.5%).
Commuters were more likely than those travelling for other purposes to say they could make their car/van journeys by bicycle (34.8% compared to 27.7% of leisure travellers and 22.9% of those travelling for business/personal business); and, less likely to say they could do so by bus, minibus or coach services (26.1% compared to 35.3% of leisure travellers and 32.4% of those travelling for business/personal business).
20%
50%
40%
70%
10%
30%
60%
0%
Cost o
f alte
rnativ
es to th
e car
Safety
of a
ltern
atives t
o
the ca
r e.g
. cyc
ling
Lack o
f public
transp
ort
Reliabilit
y of p
ublic tr
ansport
Cost /
availa
bility o
f Park
ing
Traffi
c and co
ngestio
n
slow
ing y
our journ
ey
What are the biggest challenges for you when travelling around the Cambridge area? Big Conversation 2017
target issues that are changing the
culture of the area
target groups identified within
the Big Conversation for travel choice
change
the
cent
re of th
e City.
on cars.
Redevelopm
ent of parts
Commuters from outsid
e
of Cam
bridge.
Cambridge relying
students and o
ther
vis
itors
.
travel choices a
s the
y m
ove.
numbers of t
ouris
ts,
new housin
g ch
angi
ng
Incre
ased
Resid
ents
in
and work in the area.
Leisure visitors to the City.
nature of em
ployment
The changing
Frequency of journey by journey purpose – systra alternative modes
Respondents who indicated that they use a car/van to make journeys in and around Cambridge were subsequently asked if they could make these journeys using any other mode. Whilst nearly a third (31.9%) of these respondents stated that bus, minibus or coach services were available to them, two in five respondents (39.0%) said they had no other modes of transport they could use.
alternative MOdes availaBle PerCentage
Other bus, minibus or coach services 31.9%
Bicycle 25.0%
Park & Ride bus services 11.7%
Taxi 10.8%
Walking/Running 6.8%
Train 6.4%
Motorcycle/Moped/Scooter 1.8%
Other 0.1%
None of the above 39.0%
Don't Know/ prefer not to say 0.6%
Base 681
Commuting
Business Total
Leisure
5 or more times a week
Once a weekLess than once a week, but at least once a month
Never
2-4 times a week
Page 4

8 9
theMe 2 – rOCK, PaPer, sCissOrs, (BiKe, Bus, train)
The majority of respondents to the qualitative question from the Big Conversation, “What would be the one thing that would improve travel in and around Greater Cambridge?”, felt that their transport issues could be solved through some form of public transport improvements, either bus or train, or through improvements to the cycle network (59.63%).
Fewer respondents discussed cars or road-building in relation to solving transport problems (19.53%). According to the Systra survey, most residents travel alone by car/van (37.7%) followed by travel by bicycle (19.5%). There was notable differences between the primary mode of transport between Cambridge and South Cambridgeshire, with Cambridge more likely to use a bicycle (34.6% compared to 5.9%
in South Cambridgeshire) and South Cambridgeshire more likely to be the driver of a car/van (49.7% compared to 24.5% in Cambridge).
There is also a difference in perception of modes of transport for those with different working statuses. Those with higher incomes are more likely to use a car or rail and those with lower incomes are more likely to use a bus. The use of bicycles is similar across income brackets. For respondents there was a cost/benefit towards transportation use based on travel time and cost, which currently favours personal vehicle use.
theMe 2 (data) - rOCK, PaPer, sCissOrs, (BiKe, Bus, train)
“A coherent, reliable, clean, low emission, aspirational, extensive, integrated public transport system combining rail, bus and rapid transit elements with cross ticketing. This needs to be subsidised to ensure sufficient rural coverage and low ticket prices by a work place parking levy or other road user charge.”
“Get cars off the road especially in City Centre - improve Buses and trains to Cambridge not forgetting the smaller villages (even if you have smaller buses/mini buses that pick people up from villages and take them to the nearest Park & Rides it will dramatically reduce the number of cars, help people get to work / out and about. Villages always suffer with reduction in bus timetables and Villagers need these buses the most.”
“Percentages of Qualitative responses to travel improvements
20.84%
20.84%
19.53%
11.35%
27.44%
Car related improvements
Rail
Buses
Cycling
Other improvements
Highest income level
Car Bus Surface rail Other
Fourth level
Third level
Second level
Lowest income level
aB: Higher & intermediate managerial, administrative, professional occupations.
C1C2: Supervisory, clerical & junior managerial, administrative, professional occupations or skilled manual occupations.
de: Semi-skilled & unskilled manual occupations, unemployed and lowest grade occupations.
Table 4 from Systra survey
Figure (#): Average miles travelled, by household income quintile and mode: National Travel Survey: England, 2015 [NTS0705]
all MOdes OF transPOrt aB C1C2 de all
Car/Van (as a driver, travelling alone) 58.6% 51.6% 40.0% 54.5%
Car/Van (as a driver, with passenger/s) 40.8% 42.9% 25.3% 40.1%
Bicycle 40.3% 27.2% 45.0% 36.1%
Other bus, minibus or coach services 23.5% 28.6% 27.4% 25.7%
Walking/Running 18.1% 21.4% 22.4% 19.7%
Park & Ride bus services 13.1% 10.8% 7.6% 11.8%
Taxi 5.1% 6.3% 11.3% 6.1%
Car/Van (as a passenger) 4.4% 6.3% 3.0% 4.9%
Train 6.0% 3.4% 1.1% 4.6%
Motorcycle/Moped/Scooter 2.2% 2.3% 0.0% 2.0%
Other 0.0% 0.3% 0.0% 0.1%
Base 498 315 81 893
Page 5
10 11
theMe 3 – COsts and BeneFits theMe 3 – COsts and BeneFits
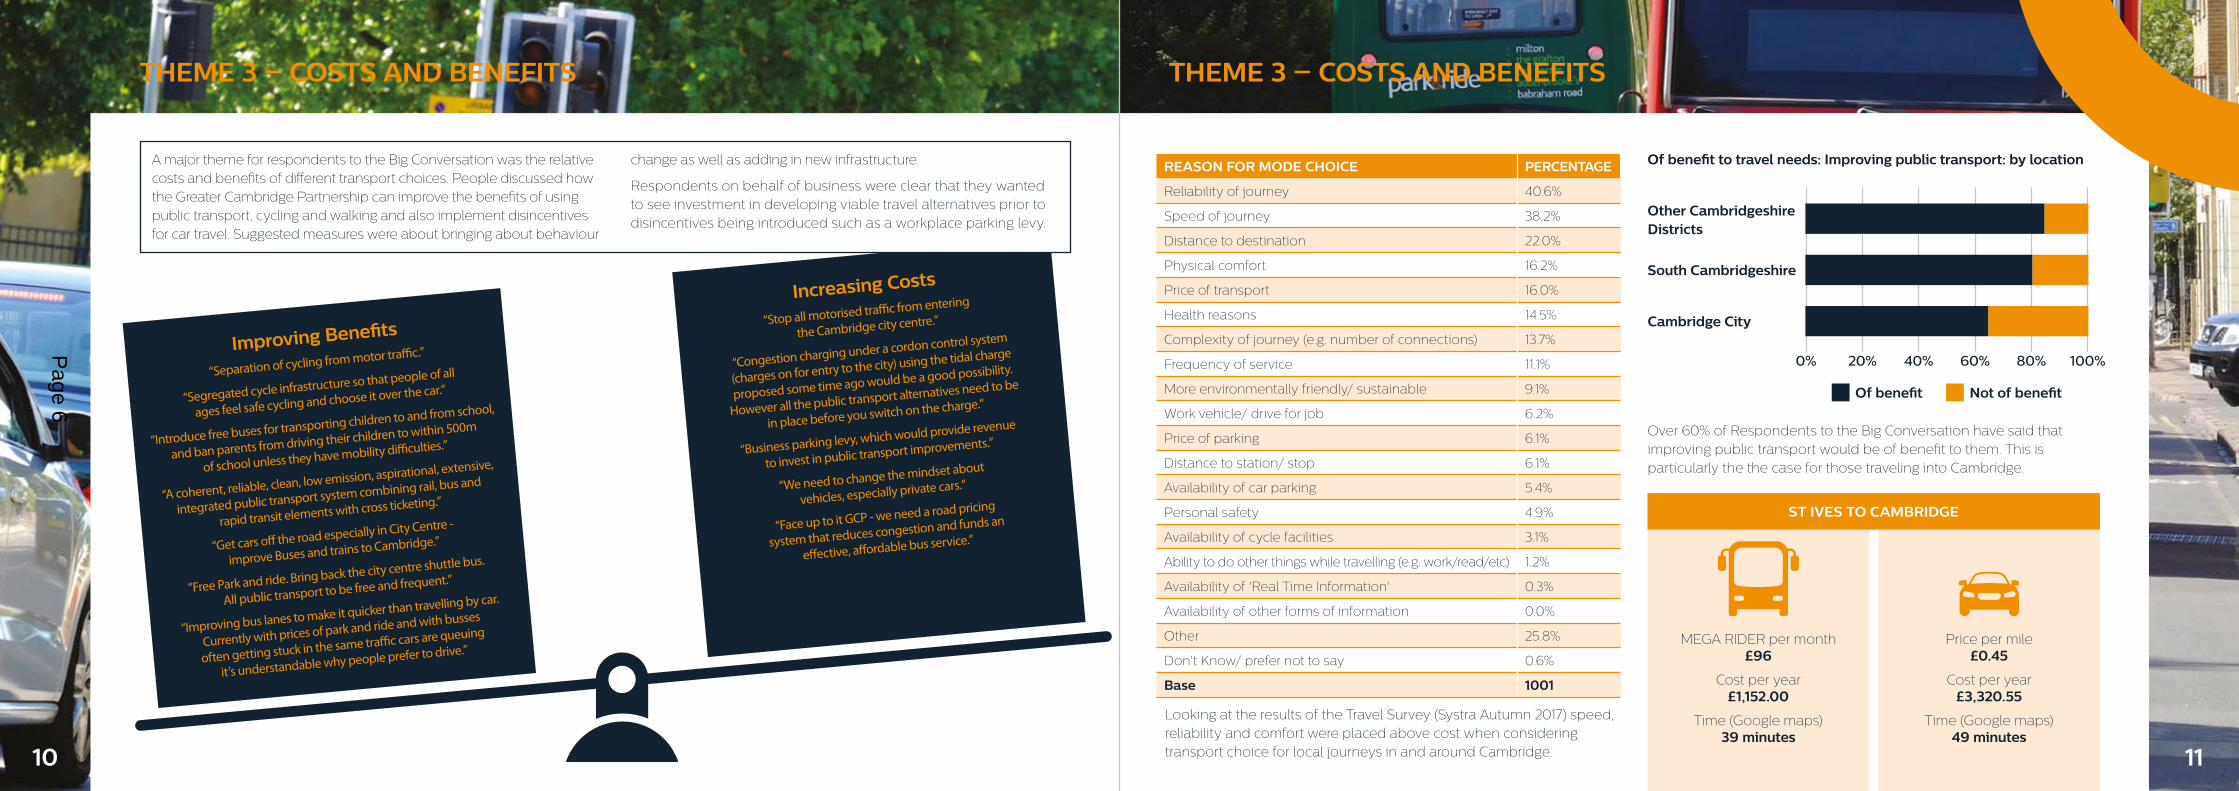
Looking at the results of the Travel Survey (Systra Autumn 2017) speed, reliability and comfort were placed above cost when considering transport choice for local journeys in and around Cambridge.
Over 60% of Respondents to the Big Conversation have said that improving public transport would be of benefit to them. This is particularly the the case for those traveling into Cambridge.
MEGA RIDER per month£96
Cost per year£1,152.00
Time (Google maps)39 minutes
Price per mile£0.45
Cost per year£3,320.55
Time (Google maps)49 minutes
Of benefit to travel needs: improving public transport: by location
Other Cambridgeshire districts
south Cambridgeshire
Cambridge City
0% 20% 40% 60% 80% 100%
Of benefit not of benefit
reasOn FOr MOde ChOiCe PerCentage
Reliability of journey 40.6%
Speed of journey 38.2%
Distance to destination 22.0%
Physical comfort 16.2%
Price of transport 16.0%
Health reasons 14.5%
Complexity of journey (e.g. number of connections) 13.7%
Frequency of service 11.1%
More environmentally friendly/ sustainable 9.1%
Work vehicle/ drive for job 6.2%
Price of parking 6.1%
Distance to station/ stop 6.1%
Availability of car parking 5.4%
Personal safety 4.9%
Availability of cycle facilities 3.1%
Ability to do other things while travelling (e.g. work/read/etc) 1.2%
Availability of 'Real Time Information' 0.3%
Availability of other forms of information 0.0%
Other 25.8%
Don't Know/ prefer not to say 0.6%
Base 1001
st ives tO CaMBridge
improving Benefits
“Separation of cycling from motor traffic.”
“Segregated cycle infrastructure so that people of all
ages feel safe cycling and choose it over the car.”
“Introduce free buses for transporting children to and from school,
and ban parents from driving their children to within 500m
of school unless they have mobility difficulties.”
“A coherent, reliable, clean, low emission, aspirational, extensive,
integrated public transport system combining rail, bus and
rapid transit elements with cross ticketing.”
“Get cars off the road especially in City Centre -
improve Buses and trains to Cambridge.”
“Free Park and ride. Bring back the city centre shuttle bus.
All public transport to be free and frequent.”
“Improving bus lanes to make it quicker than travelling by car.
Currently with prices of park and ride and with busses
often getting stuck in the same traffic cars are queuing
it’s understandable why people prefer to drive.”
increasing Costs
“Stop all motorised traffic from entering
the Cambridge city centre.”
“Congestion charging under a cordon control system
(charges on for entry to the city) using the tidal charge
proposed some time ago would be a good possibility.
However all the public transport alternatives need to be
in place before you switch on the charge.”
“Business parking levy, which would provide revenue
to invest in public transport improvements.”
“We need to change the mindset about
vehicles, especially private cars.”
“Face up to it GCP - we need a road pricing
system that reduces congestion and funds an
effective, affordable bus service.”
A major theme for respondents to the Big Conversation was the relative costs and benefits of different transport choices. People discussed how the Greater Cambridge Partnership can improve the benefits of using public transport, cycling and walking and also implement disincentives for car travel. Suggested measures were about bringing about behaviour
change as well as adding in new infrastructure.
Respondents on behalf of business were clear that they wanted to see investment in developing viable travel alternatives prior to disincentives being introduced such as a workplace parking levy.
Page 6

12
theMe 4 – tiCKet tO ride / uP all night theMe 4 (data) tiCKet tO ride / uP all night
theme 4a – up all nightMany respondents focused on how the public transport system did not match their work pattern so they had to rely on personal transport to get to and from work. Reference was made to the operating hours for Park and Ride services ending early evening so not being suitable for those who worked as part of the night-time service economy in Cambridge. Similarly services didn’t support those working shifts at major employers such as Addenbrookes Hospital.
theme 4b – ticket to rideRespondents also focused on how the ticketing on public transport in the Cambridge area worked. Discounts on ticket costs were felt to be
how far do you support our strategy aims: expand Park & ride services, both in scale and use. Source: Big Conversation
Considering your travel needs, which of these would benefit you the most? to expand on Park & ride services, both in scale and use. Source: Big Conversation
strongly support support
0%
40%
20%
60%
10%
50%
30%
70%
80%
90%
100%
Cambridge City respondents respondents from outside Cambridge
Of great benefit Of some benefit
0%
40%
20%
60%
10%
50%
30%
70%
80%
90%
100%
Cambridge City respondents respondents from outside Cambridge
focused on those who commuted 5 days a week to the disadvantage of those worked from home some of the time or who worked part-time. There was strong demand for an ‘Oyster’ card style system where people could pay for their travel across different forms of public transport as well as demand for ‘cross-ticketing’ (the same ticket being valid for different types of public transport).
Across both themes people wanted a ‘Smarter’ design for the operation of the public transport system. This qualitative information provides very useful context to the contrast between people’s support for the expansion of Park & Ride services (70% Strongly Support or Support) within the city compared to the proportion of people from outside Cambridge that say this would be of great benefit for them (33%).
transport infrastructure investment needs to reflect the difference in travel needs for different groups within the population…
regular commuter from outside Cambridge coming into the City 5 times a week at peak time
shift worker, travelling into the City outside of peak travel time
Parent on the school run from south Cambridgeshire into Cambridge City
regular commuter from within Cambridge crossing the City 5 times a week at peak-time
Older person making a leisure journey into or around Cambridge
Other travel personas based upon data from the Big Conversation…
41% of people responding to the Systra survey said that longer operating hours would encourage them to switch to public transport.
The Systra survey also identifies interesting patterns of transport when comparing working status with non-working status. The use of more sustainable forms of transport (apart from the bicycle) is much more common amongst those who don’t work (generally people aged 65+) compared to those who do.
usual mode of transport by working status.Source: Systra travel survey, Autumn 2017
20%
50%
40%
10%
30%
0%
Oth
er
Walk
ing/R
unning
Oth
er bus,
min
ibus o
r
coach
serv
ices
Car/Van (a
s a d
river,
with
pass
enger/s
)Bicy
cle
Car/Van (a
s a d
river,
trave
lling
alone)
Park &
Rid
e bus s
ervice
s
not working Working
13
Page 7

14 15
theMe 5 – lOve the Bus theMe 5 (data) – lOve the Bus
Overall 40% of people from Cambridge and 56% of people from south Cambridgeshire told us during the Big Conversation that ‘significantly improving the public transport network in terms of availability, capacity, and reliability and, as far as possible, affordability’ would be of great benefit to them.
When discussing bus transport people had a list of improvements that needed to be made to get them to transfer to bus transport or make use of buses more (as their main form of transport).
improvements to Park & ride sites removing disincentives Connectivity of the Bus network
“I travel into Cambridge every day. The issue is not public transport but road links to the public transport
- P&R sites. This does not get enough attention.”
“I spend 90 minutes every day commuting. I use the P&R at Madingley, but this has been built in the wrong location, with traffic from the A428 to the P&R site meaning the journey takes at
least 30 minutes in the morning.”
“I know that one cannot get into the city centre until about 10:30 by Park and Ride or local service bus because the traffic between my home and the Park & Ride site is frequently seriously clogged up.”
“There is a lack of cross county buses. Nearly all buses terminate in Cambridge so you have to catch another bus if you want to travel to the
other side from where you live.”
“I live in in one of Cambridge’s satellite villages where the only practical travel option is my car. It’s
too far to cycle in & out of Cambridge and public transport is not regular enough, run early enough
in mornings or late enough in evenings/night.”
“I live in a village with no effective public transport provision at all which is only
12 miles from Cambridge.”
“Our bus service (Girton to Cambridge) is unreliable, and the service has been reduced
from 3 buses per hour to two, which is tiresome and inconvenient.”
“The Park & Ride option is expensive and I object strongly to the decisions taken by the local authority to introduce a parking charge.”
“We have a good bus route across town (the U) but journey times to station vary from 15-40
mins & impossible to plan.”
The research by Systra found variation in use of bus transport by age, work status and by social class (income). Of particular note was that bus usage amongst people of social classes C, D and E was double that of people in classes A and B. Use of cycling as a usual mode of transport was strong across all social groupings.
The data from Systra demonstrates that there is potential to grow the numbers of people using buses within the region with 32% of people usually using car/van saying that buses provide a viable alternative. In answer to this question a further 39% of people said that there wasn’t currently any viable alternative to their car use. These people represent the target audience for the introduction of new public transport infrastructure.
self-reported alternative modes of transport available to car/van users.Source: Systra travel survey, Autumn 2017
usual mode of transport by social classification (level of income is higher for class aB and lower for class de). Source: Systra travel survey, Autumn 2017
32% of car/van drivers say that existing buses do provide an alternative to their car use (note that people could chose more than one alternative).
Other bus, minibus or coach services
Park & Ride bus services
Motorcycle/Moped/Scooter
Walking/Running
None of the above Taxi
Other
Train
Don’t know/ prefer not to say
Bicycle
Bicycle Bus Walking/running
0%
20%
10%
30%
5%
25%
15%
35%
aB C1C2 de
Page 8
16 17
theMe 6 – lOve the BiCyCle theMe 6 (data) lOve the BiCyCle
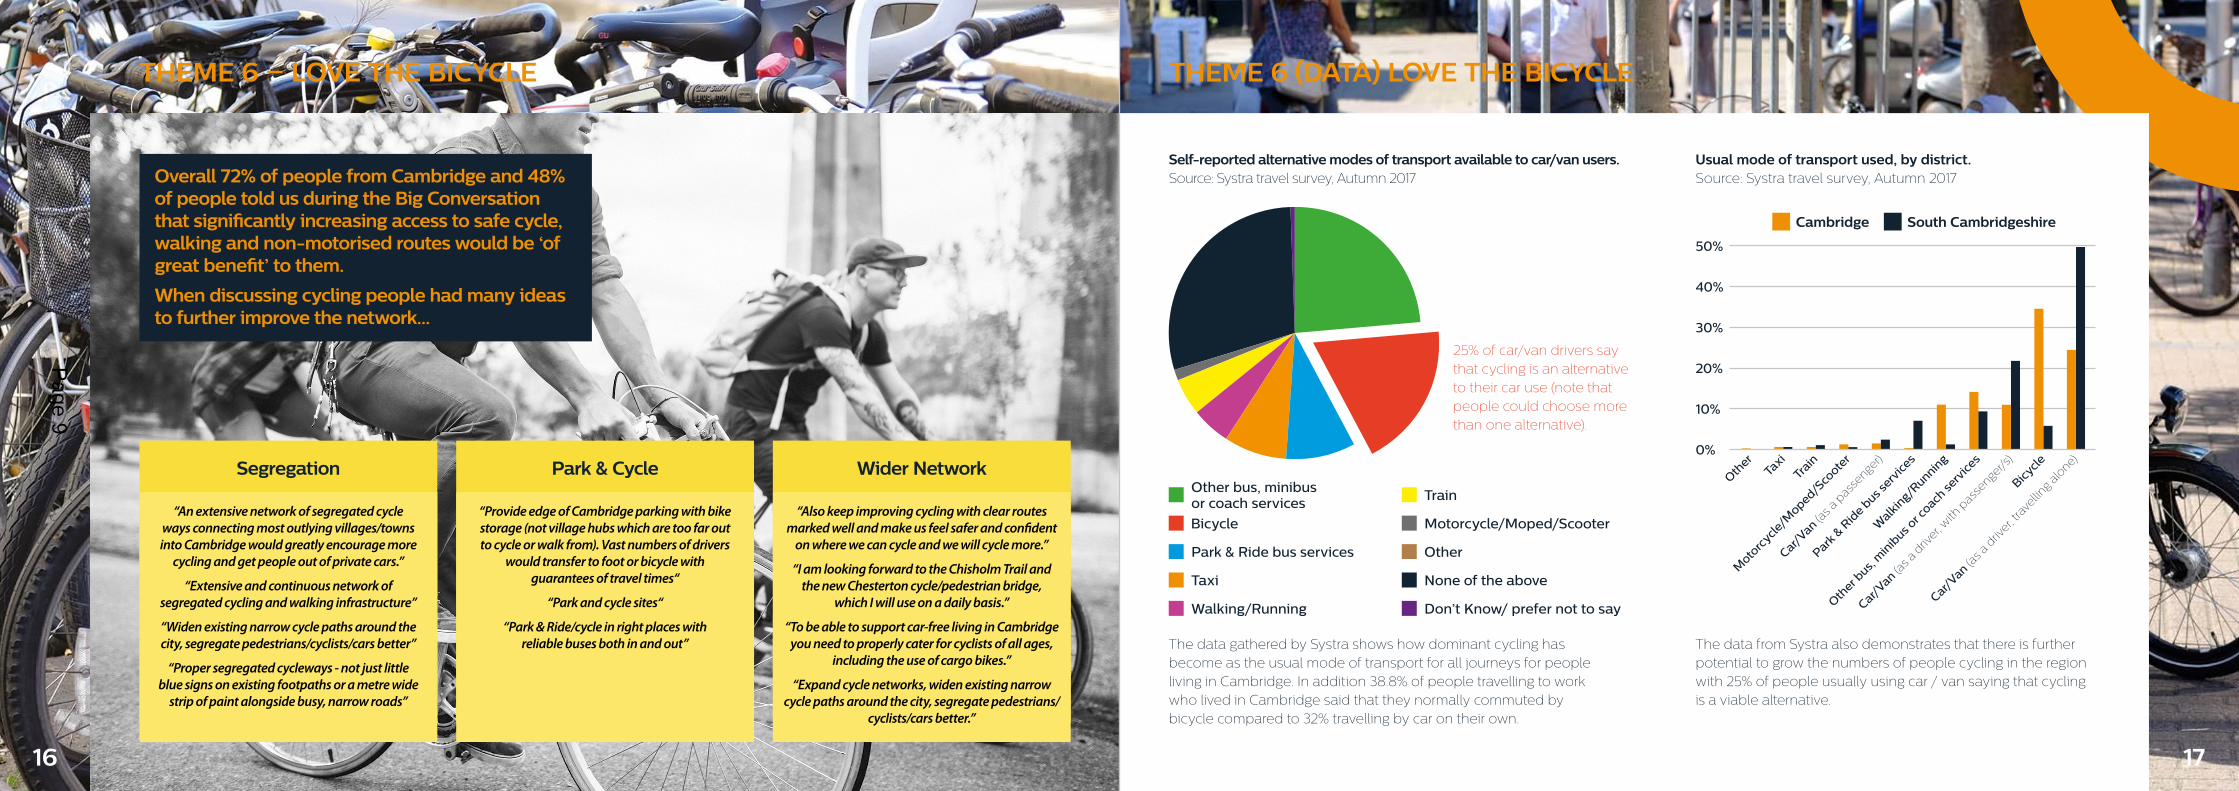
Overall 72% of people from Cambridge and 48% of people told us during the Big Conversation that significantly increasing access to safe cycle, walking and non-motorised routes would be ‘of great benefit’ to them.
When discussing cycling people had many ideas to further improve the network…
segregation Park & Cycle Wider network
The data gathered by Systra shows how dominant cycling has become as the usual mode of transport for all journeys for people living in Cambridge. In addition 38.8% of people travelling to work who lived in Cambridge said that they normally commuted by bicycle compared to 32% travelling by car on their own.
The data from Systra also demonstrates that there is further potential to grow the numbers of people cycling in the region with 25% of people usually using car / van saying that cycling is a viable alternative.
“An extensive network of segregated cycle ways connecting most outlying villages/towns into Cambridge would greatly encourage more
cycling and get people out of private cars.”
“Extensive and continuous network of segregated cycling and walking infrastructure”
“Widen existing narrow cycle paths around the city, segregate pedestrians/cyclists/cars better”
“Proper segregated cycleways - not just little blue signs on existing footpaths or a metre wide
strip of paint alongside busy, narrow roads”
“Also keep improving cycling with clear routes marked well and make us feel safer and confident
on where we can cycle and we will cycle more.”
“I am looking forward to the Chisholm Trail and the new Chesterton cycle/pedestrian bridge,
which I will use on a daily basis.”
“To be able to support car-free living in Cambridge you need to properly cater for cyclists of all ages,
including the use of cargo bikes.”
“Expand cycle networks, widen existing narrow cycle paths around the city, segregate pedestrians/
cyclists/cars better.”
“Provide edge of Cambridge parking with bike storage (not village hubs which are too far out to cycle or walk from). Vast numbers of drivers
would transfer to foot or bicycle with guarantees of travel times“
“Park and cycle sites“
“Park & Ride/cycle in right places with reliable buses both in and out”
usual mode of transport used, by district.Source: Systra travel survey, Autumn 2017
self-reported alternative modes of transport available to car/van users.Source: Systra travel survey, Autumn 2017
20%
50%
40%
10%
30%
0%
Oth
er
Car/Van (a
s a d
river, t
rave
lling
alone)Tr
ain
Moto
rcyc
le/M
oped/Sco
oter
Car/Van (a
s a p
assenge
r)
Park &
Rid
e bus s
ervice
s
Walk
ing/R
unning
Oth
er bus,
min
ibus o
r coach
serv
ices
Car/Van (a
s a d
river, w
ith p
assenge
r/s)
Bicycle
Car/Van (a
s a d
river, t
rave
lling
alone)
Taxi
Bicycle
Cambridge south Cambridgeshire
25% of car/van drivers say that cycling is an alternative to their car use (note that people could choose more than one alternative).
Other bus, minibus or coach services
Park & Ride bus services
Motorcycle/Moped/Scooter
Walking/Running
None of the above Taxi
Other
Train
Don’t Know/ prefer not to say
Bicycle
Page 9

18 19
theMe 7 – aCCess FOr all theMe 7 (data) aCCess FOr all
Respondents with protected characteristics discussed the difficulties they had accessing travel methods, which in turn was causing issues in using leisure facilities and finding employment. For those with disabilities public transport options were felt to be difficult to get on to, were not available in suitable locations or reliable enough to use, and some commented on being denied access. Older respondents also iterated these points. There were comments on an overreliance on cycle improvements which some respondents felt was ignoring residents who were not physically able to make use of them.
They also discussed how employment opportunities were not available to them. Some respondents felt their age or need for childcare options put them at a disadvantage in job applications and that training was not available to older residents.
Respondents also commented on their personal safety. For many who cycled there was the feeling of a need to improve on the safety of cycle facilities as they felt uncomfortable sharing the road with vehicles. Other respondents commented on the behaviours of cyclists and drivers, with pedestrians feeling unsafe at places such as crossings and on shared pathways.
The research by Systra also shows that people with disabilities have a different set of priorities compared
to those without disabilities. Travel choice is shaped by physical health, distance of stop/station from final
destination as well as comfort. Price is also more important for those with a disability.
The research by Systra shows that people with disabilities have
a different set of travel choices that need to be recognised when
designing public transport. Investment in cycle schemes have little
benefit to this group however they are almost twice as likely to use
the bus compared to people without a disability.
“Preferably trams or more buses ideal something separated from general traffic and cycles that do not cycle in cycle lanes and happily cross on road.”
“Wherever one goes in Cambridge one is aware that vehicles, especially private cars and delivery vans, pose a threat to one’s safety and to efficient bus services.”
“Lack of flexibility of employers eg part-time working, some working from home. Ageism.”
“Need to consider elderly and disabled” - (Businesses meeting feedback)“
how reasons for travel choice differ for people with a disability (systra travel survey 2017) how travel choices differ for people with a disability (systra travel survey 2017)
40%
10%
25%
20%
35%
5%
45%
15%
30%
0%
Reliabilit
y of j
ourney
Distance
to d
estin
ation
Price o
f tra
nsport
Physical c
omfo
rt
Health re
asons
Comple
xity o
f journ
ey (e.g.
num
ber of c
onnectio
ns)
Frequency
of s
ervice
More
envi
ronm
entally
frie
ndly/ su
stain
able
Work
vehicl
e/ driv
e for j
ob
Price o
f park
ing
Distance
to st
ation/ s
top
Availa
bility o
f car p
arkin
g
Personal s
afety
Availa
bility o
f cyc
le fa
ciliti
es
Availa
bility o
f ‘Real T
ime In
form
ation’
Availa
bility o
f oth
er form
s of i
nform
ation
Ability t
o do o
ther t
hings w
hile tr
avellin
g (e.g
. work
/ read
/etc.
)
Speed of j
ourney
40%
10%
25%
20%
35%
5%
15%
30%
0%
Car/Van (a
s a d
river, t
rave
lling
alone)
Car/Van (a
s a d
river, w
ith p
assenge
r/s)
Oth
er bus,
min
ibus o
r coach
serv
ices
Walk
ing/R
unning
Park &
Rid
e bus s
ervice
s
Car/Van (a
s a p
assenge
r)
Moto
rcyc
le/M
oped/Sco
oter
Train
Taxi
Oth
er
Bicycle
People with a disability People without a disabilityPeople with a disability People without a disability
Page 10

21
theMe 8 - the trOuBle With hOusing theMe 8 (data) the trOuBle With hOusing
20
“Think about facilities as well as just housing. How do we cope with no facilities such as shops, schools, doctors. Every initiative needs to be supported by infrastructure” – resident
“Parish Councils or Local Authorities to build, own and manage properties for local people” - Councillor
“ Housing is the key issue for travelling around Cambridge as everyone has to come in and out” - resident
“I want to relocate my warehouse nearer to Cambridge to avoid M11/A14 traffic but not sure where the most strategic location would be for freight and there is no suitable land or property to purchase” – business
“
27%
73%
Almost three quarters of the people we spoke to as part of the Big Conversation were unhappy with their current housing situation. The main problem was the cost of housing (either to buy or to rent) but people were also concerned about how the pattern of development at places like Northstowe and Cambourne may increase in-commuting by car to Cambridge. Within Cambridge there was concern that the style of new development towards the centre of the City was changing the social structure and nature of the area.
According to Hometrack Cambridge house prices have grown at a similar rate to those in London. Since 2007 house prices in both Cambridge and the Capital are 60% higher. The lower quartile house price (reflecting the cheapest 25% of the housing market) shows that the price of entry level
property in Cambridge is currently averaging £338,000 (Sept 2017). In terms of affordability, this price represents a ratio15.6 times the average person’s salary for the area. Recent data shows that Cambridge has the highest income to price ratio outside of London.
are you happy with your current housing situation? Big Conversation Survey, 2017
yes no
£150
£200
£250
£300
£350
Sep-15 Dec-15 Mar-16 Jun-16 Sep-16 Dec-16 Mar-17 Jun-17 Sep-17
-50-40-30-20-1001020304050607080
2002 2004 2006 2008 2010 2012 2014 2016
Median Weekly rent for Cambridge (for a three bedroom property) compared to england and the east of england Source: Hometrack, Dec 2017
Percentage change in Cambridge house Prices compared to london, eastern region and the uK
Change shown as a % of Jan 2007 pricesSource: HomeTrack (https://www.hometrack.com/uk/insight/uk-cities-house-price-index/)
Cambridge
east of england
england
london
Cambridge
east of england
uK
Page 11

22 23
theMe 9 - sKills and learning (We Want tO learn and grOW) theMe 9 (data) sKills and learning (We Want tO learn and grOW)
A total of 84 organisations were represented across five business briefings. A key issue for those organisations was the improvement needed in the recruitment and retention of staff. The problem was felt to be particularly acute in retaining recent graduates in the face of high housing costs and finding and retaining suitable candidates for apprenticeships.
Some employers talked about a ‘wages gap’ across different parts of the economy with high value jobs pushing up the rental / housing market making it harder to find staff to fill service or administrative positions. The role of the Greater Cambridge Partnership in creating the transport links that connect employers in the area with a larger labour market was acknowledged. With businesses commenting that the ease / cost of travel was an important factor in recruitment and retention.
understanding the role of transport in inclusive growth
Figure 1 shows the relationship between providing high quality transport (as well as housing and a high quality environment) and the labour market. Transport is seen ‘as the most obvious factor’ for building connectivity; linking potential workers with opportunities.
Locally our data (statistically representative resident’s survey, Systra, 2017) shows that the use of bus transport by social class DE is double that of social class AB. Social class DE is also the highest percentage ‘usual’ user of bikes. This underlines the importance of transport in supporting people into employment.
Practical examples of changes to transport policy in this regard from around the world include the rerouting of transit routes to link areas of relative poverty to employment, temporal changes to time-tables to
link people to shift-work or to evening employment and schemes that reduce the cost of transport (and interchange) for regular users.
A number of people commented on the mismatch of skills compared to jobs in the labour market. The Inclusive Growth Commission (RSA 2016) have identified the “hollowing out” of traditional mid-skill jobs with those in work losing skills in relation to demand in the labour market. The possible solution being a stronger focus on vocational and in-work training to support the continual development in skills.
“Recently I had to turn down training in Huntingdon (which started at 9am) as I would have had to catch 2 buses and walk and I probably wouldn’t have been able to get there until about 9.30am or later.”
are you looking for access to training or new/different employment? Big Conversation Survey, 2017
differences in ‘usual transport’ choice by social classsource: residents survey, systra, 2017
16%
84%
the main survey findings were:
• When asked, 16% of survey respondents said that they were currently looking for new training or seeking new or different employment.
• Some talked about the pace as which the area was changing and the challenge of maintaining the right skill set.
• Acknowledgement that improving public transport would be an enabling factor when searching for employment.
• Access to some training was also identified as limiting with many providers being London based.
yes no
Car/van Bus Bike
0
40
20
60
10
50
30
70
aB C1C2 de
Functioning City:
Providing high quality transport, housing and
urban environment.
labour demand:
Growth in high quality jobs
inclusive growth
transport
labour supply:
High quality education and training linked
to demand
“
Page 12

24 25
yOu said… Further inFOrMatiOn
This brochure forms the findings of Our Big Conversation as of January 2 2018, based on:
• OBC surveys and feedback
• Systra Travel Survey report
• Interim Travel for Cambridgeshire Travel Survey report
Individual reports and appendices can be found at www.greatercambridge.org.uk/bigconversation and as published reports for the Joint Assembly (JA) and Executive Board (EB) meetings January to March.
The final report, based on complete analysis, will be published on 16 February 2018.
get involved
Local views and opinions are vital to understanding the problem, discovering new ideas and working through potential solutions. We want to hear from you and below is a number of ways you can get involved with the work of the Greater Cambridge Partnership.
timeline
2018 PuBliCatiOn
8 January JA paper publication – interim OBC report
18 January JA meeting – Systra presentation
29 January EB paper publication – interim OBC report
8 February EB meeting – OBC interim
16 February JA paper publication – final OBC report
28 February JA Assembly
9 March EB paper publication – final OBC report
21 March EB meeting
01223 715454
@greaterCambs
Facebook.com/greaterCam greater Cambridge Partnership events www.greatercambridge.org.uk/events local liaison Forums www.greatercambridge.org.uk/transport/local-liaison-forums
On public transport…
“Missing part is the last mile - how I get from my village to the busway.” – South Cambs resident
“I drive because the bus doesn’t get me where I need to go and it would take me too long” – Histon resident
“Park and Ride an inconvenience, not a convenience! Why would you go out of your way to Park and Ride, to then be stuck in the same traffic as all other road users – you might as well just drive all way.’ – Shopper
“The solution is to get transit times consistent and reliable – to get from home, school, business in a known time. It requires reducing the number of vehicles on the road very dramatically” - Councillor
On cycling…
“I live on Mill Road and would like better cycling facilities and generally better public transport.” – Cambridge resident
“One thing that would improve my travel is a cycleway from Barhill. The A14 is a nightmare!” – Barhill resident
Business briefing poll: use one word to describe your commute Business briefing poll: what should money raised from a revenue stream pay for?
“I like cycling around Cambridge but round the station is a nightmare.” – commuter
On tackling congestion...
“Increase the cost of car parking in Cambridge so people use the park and ride.” – Cambridge Utd supporter
“An eastern perimeter road should be put in and just put an underground in I know it will cost millions but just do it.” – Cambridge resident
“Charge for driving - I would just pass it on to my customers…” – Tradesman
“Private schools should provide a shuttle bus for children – 30 mins knocked off my commute during school holidays” – Commuter
“We need a strategic approach to freight.” - Business
“Charging must demonstrate value for money and benefit” - Business
On housing…
“I moved to Foxton recently and housing is a real problem. I’m lucky enough to privately rent a house that is managed by the council, but the rent is still high and I will be unable to save for a deposit to buy a house.” – South Cambs resident
“There is far too much executive housing and nowhere near enough affordable and suitable housing for essential workers such as nurses, teachers and technicians, conveniently situated by employers.”
“Far too much private sector rental housing in Cambridge and a broken ownership market skewed by overseas investors and buy to let, means housing costs in and around Cambridge are ridiculous and stifling the economy here. Public sector led social housing projects need to disrupt the market to ensure reasonably priced housing for those workers who service the growth economy here.”
Page 13

26
www.greatercambridge.org.uk
Page 14