great-west lifeco inc. - quarterly information for ... · q2 2015 q3 2015 q4 2015 q1 2016 q2 2016...
TRANSCRIPT

Quarterly Information
for Analysts and Investors
Q2 2016

CAUTIONARY NOTE REGARDING FORWARD-LOOKING INFORMATION
This document contains some forward-looking statements about the Company, including its business operations, strategy and expected financial
performance and condition. Forward-looking statements include statements that are predictive in nature, depend upon or refer to future events or
conditions, or include words such as “expects”, “anticipates”, “intends”, “plans”, “believes”, “estimates” and similar expressions or negative versions
thereof. In addition, any statement that may be made concerning future financial performance (including revenues, earnings or growth rates), ongoing
business strategies or prospects, and possible future actions by the Company, including statements made with respect to the expected benefits of
acquisitions and divestitures, are also forward-looking statements. Forward-looking statements are based on expectations and projections about future
events that were current at the time of the statements and are inherently subject to, among other things, risks, uncertainties and assumptions about the
Company, economic factors and the financial services industry generally, including the insurance and mutual fund industries. They are not guarantees
of future performance, and actual events and results could differ materially from those expressed or implied by forward-looking statements. Material
factors and assumptions that were applied in formulating the forward-looking information contained herein include the assumption that the business and
economic conditions affecting the Company’s operations will continue substantially in their current state, including, without limitation, with respect to
market prices for products provided, sales levels, premium income, fee income, expense levels, mortality experience, morbidity experience, policy lapse
rates, reinsurance, taxes, inflation, general economic, political and market factors in North America and internationally, interest and foreign exchange
rates, investment values, global equity and capital markets, business competition, continuity and availability of personnel and third party service
providers, the Company's ability to complete strategic transactions and integrate acquisitions and that there will be no unplanned material changes to
the Company’s facilities, customer and employee relations or credit arrangements. Many of these assumptions are based on factors and events that
are not within the control of the Company and there is no assurance that they will prove to be correct. Other important factors and assumptions that
could cause actual results to differ materially from those contained in forward-looking statements include technological change, breaches or failure of
information systems and security (including cyber attacks), payments required under investment products, changes in local and international laws and
regulations, changes in accounting policies and the effect of applying future accounting policy changes, unexpected judicial or regulatory proceedings
and catastrophic events. The reader is cautioned that the foregoing list of assumptions and factors is not exhaustive, and there may be other factors
listed in other filings with securities regulators, including factors set out in the Company's 2015 Annual MD&A under "Risk Management and Control
Practices" and "Summary of Critical Accounting Estimates", which, along with other filings, is available for review at www.sedar.com. The reader is also
cautioned to consider these and other factors carefully and not to place undue reliance on forward-looking statements. Other than as specifically
required by applicable law, the Company does not intend to update any forward-looking statements whether as a result of new information, future
events or otherwise.
CAUTIONARY NOTE REGARDING NON-IFRS FINANCIAL MEASURES
This document contains some non-IFRS financial measures. Terms by which non-IFRS financial measures are identified include, but are not limited to,
“operating earnings”, “constant currency basis”, “premiums and deposits”, “sales”, “assets under management”, “assets under administration” and other
similar expressions. Non-IFRS financial measures are used to provide management and investors with additional measures of performance to help
assess results where no comparable IFRS measure exists. However, non-IFRS financial measures do not have standard meanings prescribed by
IFRS and are not directly comparable to similar measures used by other companies. Please refer to the appropriate reconciliations of these non-IFRS
financial measures to measures prescribed by IFRS.
Cautionary notes
2

Paul Mahon President & CEO
Great-West Lifeco
Summary of results
3

Leveraging global strengths and capabilities to drive
growth
4
Canada Europe U.S.
Asset management
Diversity of platforms, investment styles, products and global reach
Retirement solutions
Scale and breadth of member offerings and experiences across our markets
Customer and advice channels
Innovation to better engage customers and advisors, leveraging digital and analytics
Protection
Depth of insurance expertise across life, health, wealth and retirement
Protect and extend
leadership positions through
organic growth
Targeted growth leveraging
leadership positions,
supplemented by acquisition
and product expansion
Invest for significant organic
growth and take advantage
of consolidation
opportunities

Markets – March 31st to June 30th
5
Market volatility increased in Q2
• Brexit vote; GBP weakened
• Low interest rate environment
Additionally, outflows from actively
managed funds continue
85%
90%
95%
100%
105%
110%
S&P TSX S&P 500 Eurostoxx 50 FTSE 100
85%
90%
95%
100%
105%
110%
S&P TSX S&P 500 Eurostoxx 50 FTSE 100
$1.70
$1.75
$1.80
$1.85
$1.90
$1.95
CAD/GBP
$1.70
$1.75
$1.80
$1.85
$1.90
$1.95
CAD/GBP
0.70%
0.90%
1.10%
1.30%
1.50%
1.70%
1.90%
2.10%
Can. 10 Yr. U.S. 10 Yr. U.K. 10 Yr.
0.70%
0.90%
1.10%
1.30%
1.50%
1.70%
1.90%
2.10%
Can. 10 Yr. U.S. 10 Yr. U.K. 10 Yr.

Q2 2015 Q3 2015 Q4 2015 Q1 2016 Q2 2016
659 671
620
683 720
Q2 2015 Q3 2015 Q4 2015 Q1 2016 Q2 2016
236%238%
234%
229%
232%
Earnings (C$m)
Earnings up 2% YoY against a
challenging macro environment
Strong improvement from Q1, up 8%
Continuing capital strength and
flexibility
• MCCSR at 232%
• Lifeco cash of $813m
Dividend of $0.346 per share
MCCSR
Summary of results
6
Q2 2015 Q3 2015 Q4 2015 Q1 2016 Q2 2016
236%238%234%229% 232%

Q2 2015 Q3 2015 Q4 2015 Q1 2016 Q2 2016
24.5 24.9
48.0
39.0 36.5
Canada
• Wealth Management sales
lower, consistent with
market, partially offset by
higher Insurance results
U.S.
• No mega plan sales at
Empower this quarter
• Putnam sales up, driven by
institutional flows
Europe
• Payout annuities
rebounding
• Higher fund management
inflows in Ireland
• Good sales growth in
German pensions
Sales (C$b)
Canada U.S. Europe Lifeco
Q2 2016 2.7 16.7 5.5 24.9
Q1 2016 3.3 40.1 4.6 48.0
Q2 2015 3.0 18.1 3.4 24.5
YoY (11%) (8%) 63% 1%
Constant
Currency (11%) (12%) 54% (3%)
Summary of results – Sales
7

Q2 2015 Q3 2015 Q4 2015 Q1 2016 Q2 2016
1,062 1,124
1,175 1,145 1,102
Y/Y
91%
90%
100%
% of Budget
6% 86%
6%
6%
6%
Canada U.S. Europe Lifeco (1)
Q2 2016 366 531 221 1,124
Q1 2016 382 569 220 1,175
Q2 2015 345 502 210 1,062
YoY 6% 6% 5% 6%
Constant
Currency 6% 1% 1% 3%
Lifeco expense growth slowing,
up 3% YoY on constant
currency basis
Canada
• Continue to invest in
business
• Expense growth
moderating compared to
previous quarters
U.S.
• Investing to grow Empower
business
• Lower variable costs at
Putnam
Europe
• Leveling off post integration
and Solvency II
(1) Lifeco totals include corporate expenses
Expenses (C$m) (1)
Summary of results – Expenses
8

Lifeco fee income steady YoY
• Average equity markets
lower in all segments:
Canada
• Positive cash flows offset
impact from lower markets
U.S.
• Average assets declined
primarily due to lower retail
mutual funds
Europe
• Fee growth and strong flows
in spite of lower market
levels
S&P/TSX (8%)
S&P 500 (1%)
Eurostoxx 50 (18%)
Q2 2015 Q3 2015 Q4 2015 Q1 2016 Q2 2016
Fee Income
1,226 1,231 1,254 1,333
1,241
Y/Y
0%
(100%
(100%)
90%
0%
0%
% of Budget
(100%)
0%
Canada U.S. Europe Lifeco
Q2 2016 369 555 307 1,231
Q1 2016 362 571 321 1,254
Q2 2015 366 577 283 1,226
YoY 1% (4%) 8% -
Constant
Currency 1% (8%) 3% (3%)
Fee Income (C$m)
Summary of results – Fee Income
9

Brexit
10
Impact on Lifeco’s Q2 earnings is not material
Brexit resulted in market volatility and uncertainty, with the British pound
depreciating by approximately 10% against the Canadian dollar
• Lower FX rates had minimal impact on earnings as quarterly average rates are used
for translation
UK sovereign credit rating reduced to AA
• $8.1 billion of UK government bonds shifted from AAA to AA, with no direct asset
default provision impact
Negative sentiment toward UK investment property values
• A fair value adjustment of 3.5% was applied to U.K. properties held by the general
funds, with a similar change in the insurance contract liabilities
Our businesses are resilient and we maintain significant financial flexibility
Company remains committed to this market

Business developments
11
Completed transactions to acquire Aviva Health Insurance Ireland Limited
and assume full control of GloHealth Financial Services Limited
• Received regulatory approval and closed August 1st
• Set synergy targets of €16m, with integration and restructuring costs of €16m
Continued focus on innovation and customer experience
• Launched Apple watch applications for GroupNet™ in Canada and Empower
Retirement in the U.S.
Ongoing collaboration
• Irish Life Investment Managers (ILIM) appointed sub-advisor to GWF, for €4.8b
of funds under management across six index funds
• ILIM quant funds launched on Mackenzie platform in Canada
Follows successful launches of other ILIM products on Investor Group’s
shelf in 2015 and Investment Planning Counsel’s in early 2016

Garry MacNicholas EVP & CFO
Great-West Lifeco
Financial highlights
12

Q2 2015 Q3 2015 Q4 2015 Q1 2016 Q2 2016
0.661 0.675
0.625
0.688 0.724
Canada U.S. Europe Lifeco (1)
Q2 2016 327 53 293 671
Q1 2016 276 63 287 620
Q2 2015 308 67 289 659
YoY 6% (21%) 1% 2%
Constant
Currency 6% (24%) - 1%
Q2 earnings of $671m or
$0.675 per share
Earnings up 2% YoY in
challenging markets
Canada earnings strong in
spite of lower TSX
Putnam fees lower, partially
offset by lower variable costs
Europe remains strong with
higher basis changes
offsetting higher impairments
Financial highlights
13
Earnings (C$m)
Earnings per Share
(1) Lifeco totals include corporate earnings

Financial highlights
14
For the three months ended June. 30, 2016
Source of Earnings (C$m) Canada U.S. Europe Corp. Q2/16
Total
Q1/16
Total
Q2/15
Total
Expected profit on in-force business 288 98 252 (5) 633 653 679
Impact of new business (3) (30) (11) - (44) (68) (51)
Experience gains and losses 71 5 (26) (1) 49 38 64
Management actions and changes in
assumptions - - 129 - 129 54 90
Other - (4) (1) - (5) (4) (14)
Earnings on surplus (incl. financing
charges) 30 (4) - (1) 25 11 3
Net income before tax 386 65 343 (7) 787 684 771
Taxes (33) (12) (46) 5 (86) (33) (80)
Net income before non-controlling
interests & preferred dividends 353 53 297 (2) 701 651 691
Non-controlling interests & preferred
dividends (26) - (4) - (30) (31) (32)
Net income – common shareholders 327 53 293 (2) 671 620 659

Q2 2015 Q3 2015 Q4 2015 Q1 2016 Q2 2016
18.28 19.04 19.29
20.07 19.40
14.0%
16.4%
6.1%
19.7%
Lifeco EuropeU.S.Canada
Return on Equity of 14.0%
• Trailing earnings up, offset by
higher average equity due to
currency moves
Lifeco cash at quarter end was
$0.8b
Lifeco book value per share
declined with recent currency
movement, but up 4% YoY
Book Value per Share
Return on Equity
1) Reported ROE for Great-West Financial of 11.7% and (0.4%) for Putnam
2) Lifeco Average Allocated Equity includes $0.6 billion attributable to Lifeco Corporate
Average
Allocated Equity
(C$b)
Financial highlights
15
(Trailing 4 quarters)
$6.0 $5.5 $19.3 $7.2
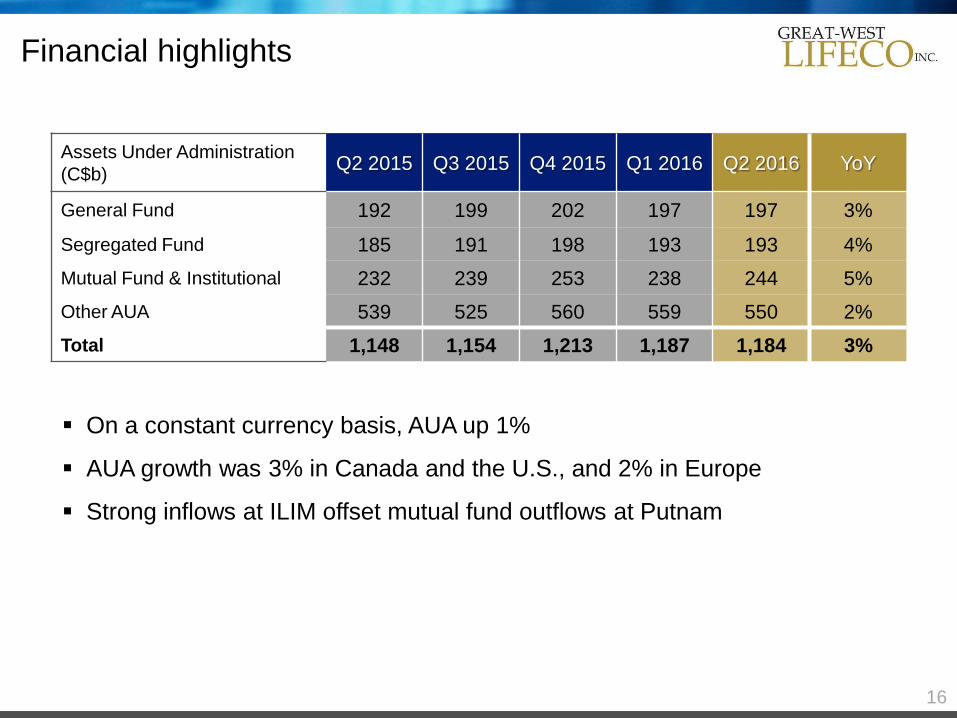
Assets Under Administration
(C$b) Q2 2015 Q3 2015 Q4 2015 Q1 2016 Q2 2016 YoY
General Fund 192 199 202 197 197 3%
Segregated Fund 185 191 198 193 193 4%
Mutual Fund & Institutional 232 239 253 238 244 5%
Other AUA 539 525 560 559 550 2%
Total 1,148 1,154 1,213 1,187 1,184 3%
Financial highlights
16
On a constant currency basis, AUA up 1%
AUA growth was 3% in Canada and the U.S., and 2% in Europe
Strong inflows at ILIM offset mutual fund outflows at Putnam

Questions
17

Appendix
18

Canada
19 Note: nmf denotes not meaningful
(In C$m) Q2 2015 Q3 2015 Q4 2015 Q1 2016 Q2 2016 YoY
Sales
Individual Insurance 138 142 137 125 155 12%
Group Insurance 121 251 135 283 119 (2%)
259 393 272 408 274 6%
Individual Wealth Management 2,092 1,970 2,411 2,267 1,907 (9%)
Group Wealth Management 665 581 809 593 496 (25%)
2,757 2,551 3,220 2,860 2,403 (13%)
Total 3,016 2,944 3,492 3,268 2,677 (11%)
Fee Income
Group Insurance 39 38 41 43 42 8%
Wealth Management 313 310 316 307 315 1%
Corporate 14 18 12 12 12 nmf
Total 366 366 369 362 369 1%
Operating Expenses
Individual Insurance 101 105 111 107 108 7%
Group Insurance 125 125 134 145 132 6%
Wealth Management 114 114 124 126 119 4%
Corporate 5 8 1 4 7 nmf
Total 345 352 370 382 366 6%
Operating Earnings
Individual Insurance 88 91 51 92 80 (9%)
Group Insurance 96 153 74 67 125 30%
Wealth Management 122 116 119 101 104 (15%)
Corporate 2 (34) 18 16 18 nmf
Total 308 326 262 276 327 6%

United States
20
(1) Excludes U.S. Corporate which represents post-tax restructuring costs and acquisition expenses from J.P. Morgan RPS which were US$1m in Q2/15, US$2m in Q3/15,
US$2m in Q4/15, US$2m in Q1/16, and US$2m in Q2/16
(1)
Note: nmf denotes not meaningful
(In US$m) Q2 2015 Q3 2015 Q4 2015 Q1 2016 Q2 2016 YoY
GWF Sales
Empower Retirement 7,562 11,720 15,153 20,029 4,438 (41%)
Individual Markets 263 180 340 241 246 (6%)
Total 7,825 11,900 15,493 20,270 4,684 (40%)
Putnam Sales 6,916 7,818 8,111 9,042 8,236 19%
Fee Income
Empower Retirement 220 215 241 212 228 4%
Individual Markets 22 18 19 22 23 5%
Putnam 228 217 216 183 179 (21%)
Total 470 450 476 417 430 (9%)
Operating Expenses
Empower Retirement 189 193 199 203 203 7%
Individual Markets 16 15 19 19 22 38%
Other 1 4 - - - nmf
Putnam 199 189 187 191 184 (8%)
Restructuring / Acquisition 3 2 3 3 3 nmf
Total 408 403 408 416 412 1%
Operating Earnings
Empower Retirement 16 23 29 24 18 13%
Individual Markets 39 57 29 39 36 (8%)
Other 3 1 5 4 2 nmf
Putnam (2) (6) 31 (18) (14) nmf
Total 56 75 94 49 42 (25%)

Europe
21 Note: nmf denotes not meaningful
(In C$m) Q2 2015 Q3 2015 Q4 2015 Q1 2016 Q2 2016 YoYConstant
Currency
Sales
UK / Isle of Man 523 821 819 651 671 28%
Ireland / Germany 2,873 6,895 3,098 3,923 4,879 70%
Total 3,396 7,716 3,917 4,574 5,550 63% 54%
Fee Income
UK / Isle of Man 74 71 69 70 74 0%
Ireland / Germany 203 207 251 246 229 13%
Reinsurance 6 6 7 5 4 (33%)
Total 283 284 327 321 307 8% 3%
Operating Expenses
UK / Isle of Man 58 63 75 55 64 10%
Ireland / Germany 123 136 125 146 138 12%
Reinsurance 16 14 15 17 16 -
Corporate 2 2 6 1 2 nmf
Restructuring / Acquisition 11 3 3 1 1 nmf
Total 210 218 224 220 221 5% 1%
Operating Earnings
UK / Isle of Man 140 176 109 152 157 12%
Ireland / Germany 67 53 125 74 68 1%
Reinsurance 92 71 73 63 74 (20%)
Corporate (10) (4) (4) (2) (6) nmf
Total 289 296 303 287 293 1% -
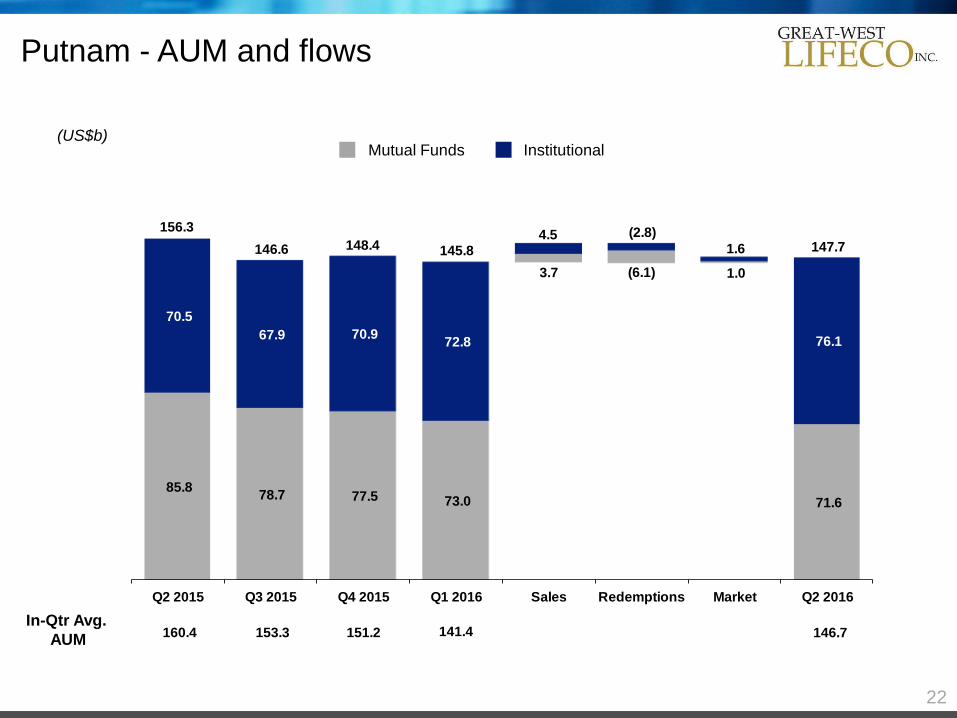
Mutual Funds Institutional
In-Qtr Avg.
AUM
(US$b)
Putnam - AUM and flows
22
85.8 78.7 77.5 73.0 71.6
70.5
67.9 70.9 72.8 76.1
Q2 2015 Q3 2015 Q4 2015 Q1 2016 Sales Redemptions Market Q2 2016
Putnam AUM Flows
156.3
147.7 (2.8)4.5
145.8 148.4 146.6
3.7 (6.1) 1.0
1.6
141.4 146.7 151.2 153.3 160.4

226 211 223
179 185
(211)(200) (193) (201) (190)
(13)
10
6.6%5.2%
13.5%
(12.3%)
(35%)
(25%)
(15%)
(5%)
5%
15%
25%
35%
$(250)
$(150)
$(50)
$50
$150
$250
Q2 2015 Q3 2015 Q4 2015 Q1 2016 Q2 2016
Op
era
ting
Ma
rgin
Co
re E
arn
ing
s (U
S$
mm
)
Putnam Net Earnings - Core Earnings
Income Taxes Expenses Fee & Net Inv. Income Operating Margin (Pre-tax)
% of Budget
84%
88%
(2.7%)
Income Taxes
Fee & Net Inv Income
Expenses
Operating Margin (Pre-tax)
Core Net Earnings $8 $6 $17 ($12) ($4)
Core net earnings (loss) (a non-IFRS financial measure) is a measure of the Asset Management business unit's performance. Core net earnings (loss) include the impact of dealer
commissions and software amortization, and excludes the impact of corporate financing charges and allocations, fair value adjustments related to stock-based compensation, certain tax
adjustments and other non-recurring transactions
(US$m)
Putnam – Core net earnings
23

200% 200% 200%
204%205%205%
201%
207%
210%
218%
221%
223%
230%
228%
233%
224%
222%
229%
234%
238%
236%
232%
190%
210%
230%
Q1 2011
Q2 2011
Q3 2011
Q4 2011
Q1 2012
Q2 2012
Q3 2012
Q4 2012
Q1 2013
Q2 2013
Q3 2013
Q4 2013
Q1 2014
Q2 2014
Q3 2014
Q4 2014
Q1 2015
Q2 2015
Q3 2015
Q4 2015
Q1 2016
Q2 2016
2011
233%
Adjusted MCCSR
The Great-West Life Assurance Company’s MCCSR of 232% is a 4 point decrease from Q1/16
Quarterly earnings performance was offset by a combined impact of in period business growth,
currency movements and fair value increases in capital requirements
The MCCSR ratio does not include holding company cash which would add approximately 12 points
to the ratio
Consolidated MCCSR ratio
24
2016
200% 200% 200%
204%205%205%
201%
207%
210%
218%
221%
223%
230%
228%
233%
224%
222%
229%
234%
238%
236%
232%
190%
210%
230%
Q1 2011
Q2 2011
Q3 2011
Q4 2011
Q1 2012
Q2 2012
Q3 2012
Q4 2012
Q1 2013
Q2 2013
Q3 2013
Q4 2013
Q1 2014
Q2 2014
Q3 2014
Q4 2014
Q1 2015
Q2 2015
Q3 2015
Q4 2015
Q1 2016
Q2 2016
2012 2013 2014 2015

2005 2006 2007 2008 2009 2010 2011 2012 2013 2014 2015
2,3352,499
2,8742,769
2,237
2,504 2,4472,576
2,633
3,2683,347
26% 25% 20% 19% 18%20%
11%20% 21%
24% 23%
Note: Experience Gains (Losses), Management Actions, and Changes in Assumptions exclude Putnam for 2008-2012; include Putnam for 2013-2015
(C$m) Experience Gains (Losses), Management Actions, and Changes in Assumptions
as a % of Net Income Before Tax
11 Year
Average
20.6%
Stable trend over the years
25

Gov't, Gov't Related and Agency Securitized Bonds
32%
Corporate andNon-Agency Securitized
Bonds 41%
Conventional Mortgages9%
Insured Residential and Multi-family Mortgages
2%
Non-Insured Residential Mortgages
1%
Stocks 5%
Investment Properties3%
Loans to Policyholders
5%
Cash & CD's2%
Invested asset composition*
26
* Includes certain funds held by ceding insurers (carrying value of $10.3bln)
Invested assets at June 30, 2016 were
$170.9bln
Diversified high quality portfolio:
• Bonds represent 73% of invested
assets (99% are investment grade;
82% rated A or higher)
• Mortgage portfolio represents 12% of
invested assets, and is well diversified
by geography and property type.
Portfolio is well seasoned, with
minimal impairments; delinquencies >
90 days on non-impaired mortgages
are negligible
• Stocks represent 5% of invested
assets, mostly Canadian publicly
traded
• Investment Properties represent 3% of
invested assets (35% in Canada; 65%
in UK). Properties are unlevered; UK
properties benefit from long term lease
contracts

*Includes certain funds held by ceding insurers
Lifeco consolidated bond portfolio*
27
Domicile of Issuer
Government,
Government Related and
Agency Securitized Banking
Other Financial
Institutions and REITs
Other Corporate and
Non-Agency Securitized
% of Invested
Assets $ (millions)
United States 5.9% 0.8% 1.7% 16.3% 24.7% 42,120
Canada 12.5% 0.9% 0.7% 6.8% 20.9% 35,672
United Kingdom 8.7% 0.8% 1.9% 5.8% 17.2% 29,462
Ireland 0.4% 0.0% 0.0% 0.1% 0.5% 810
27.5% 2.5% 4.3% 29.0% 63.3% 108,064
Eurozone (excluding Ireland)
Germany 1.5% 0.0% 0.1% 1.0% 2.6% 4,480
France 0.6% 0.1% 0.1% 0.6% 1.4% 2,421
Netherlands 0.5% 0.2% 0.1% 0.3% 1.1% 1,744
Belgium 0.2% 0.0% 0.0% 0.2% 0.4% 587
Spain 0.0% 0.1% 0.0% 0.2% 0.3% 532
Austria 0.3% 0.0% 0.0% 0.0% 0.3% 466
Italy 0.0% 0.0% 0.0% 0.2% 0.2% 400
Finland 0.1% 0.0% 0.0% 0.0% 0.1% 241
Luxembourg 0.0% 0.0% 0.0% 0.0% 0.0% 49
Portugal 0.0% 0.0% 0.0% 0.0% 0.0% 4
3.2% 0.4% 0.3% 2.5% 6.4% 10,924
Other Europe
Sweden 0.1% 0.1% 0.0% 0.2% 0.4% 688
Switzerland 0.0% 0.1% 0.1% 0.2% 0.4% 672
Norway 0.2% 0.0% 0.0% 0.0% 0.2% 470
Isle of Man 0.1% 0.0% 0.0% 0.0% 0.1% 129
Denmark 0.0% 0.0% 0.0% 0.1% 0.1% 104
Jersey 0.1% 0.0% 0.0% 0.0% 0.1% 89
Guernsey 0.0% 0.0% 0.0% 0.0% 0.0% 79
0.5% 0.2% 0.1% 0.5% 1.3% 2,231
Asia Pacific
Australia 0.0% 0.2% 0.1% 0.6% 0.9% 1,501
Japan 0.0% 0.0% 0.0% 0.3% 0.3% 590
Singapore 0.1% 0.0% 0.0% 0.0% 0.1% 239
New Zealand 0.0% 0.0% 0.0% 0.1% 0.1% 149
Hong Kong 0.0% 0.0% 0.0% 0.0% 0.0% 39
0.1% 0.2% 0.1% 1.0% 1.4% 2,518
All Other 0.8% 0.0% 0.0% 0.0% 0.8% 1,409
Total % 32.1% 3.3% 4.8% 33.0% 73.2% 125,146
Total $ (millions) 54,822 5,622 8,239 56,463 125,146
Corporate and Non-Agency Securitized

*Includes certain funds held by ceding insurers
Corporate and securitized bonds –
Sector diversification*
28
% of
Invested
Assets
% of
Invested
Assets
Corporates Non-Agency Securitized
Utilities 9.1% ABS 2.1%
Consumer Products 5.8% CMBS 2.2%
Industrial Products 4.3% RMBS 0.9%
Banking 3.3% Covered 0.6%
Other Financial Institutions 3.1% Total Securitized 5.8%
Energy 2.8%
Transportation 2.3% Total Corporates and Non-Agency Securitized 41.1%
Communications 1.8%
REITS 1.7%
Technology 1.1%
Total Corporates 35.3%

Direct energy exposure – Bonds
Bond holdings in the oil and gas sector total $5.1 billion (3% of
invested assets)
Approximately 97% are rated investment grade
Holdings are diversified across sub-sectors, with only $1.2 billion
(0.7% of invested assets) in the Independent and Oil Field Services
sub-sectors
(C$m) Carrying Value Credit Rating % of Amortized
Sub-Sector AAA AA A BBB BB & Lower Total Lifeco IA Cost
Midstream - - 1,039 1,139 67 2,245 1.3% 2,102
Integrated 4 446 531 115 - 1,096 0.7% 1,044
Independent - - 199 482 32 713 0.4% 688
Oil Field Services - 46 187 210 20 463 0.3% 466
Refining - - 48 191 - 239 0.1% 225
Government Agency - 267 39 37 13 356 0.2% 325
Total 4 759 2,043 2,174 132 5,112 3.0% 4,850
% of Total 0.1% 14.8% 40.0% 42.5% 2.6%
% of IA 0.0% 0.4% 1.2% 1.3% 0.1%
29

Indirect energy exposure –
Commercial mortgages and investment property
(1) Includes $571 million of insured (2) Includes $68 million of insured
Holdings in the province of Alberta totaled $2.3 billion (mortgages $2.0
billion; investment properties $0.3 billion), including $0.6 billion of
insured mortgages. Non-insured holdings in the province of Alberta
represent 1% of invested assets. Holdings are well diversified by
property type with a weighted average mortgage LTV of 56%.
Office property commercial mortgage holdings in Calgary total $0.4
billion (0.2% of invested assets) with a weighted average LTV of 58%
Holdings outside of Alberta are commercial mortgages primarily in the
state of Texas
30
(C$m) Carrying Value Property Type % of
City/Region Multi
‐
Family(1) Retail Office Industrial Other
(2) Total Lifeco IA
Calgary, Alberta 140 354 384 249 141 1,268 0.8%
Edmonton, Alberta 485 143 186 191 56 1,061 0.6%
Total Calgary & Edmonton 625 497 570 440 197 2,329 1.4%
Texas/Other 224 85 84 59 94 546 0.3%
Total 849 582 654 499 291 2,875 1.7%
% of Total 29.5% 20.2% 22.8% 17.4% 10.1%
% of IA 0.5% 0.3% 0.4% 0.3% 0.2%

United Kingdom property related exposures
Mortgages
(C$m) Carrying Value Property Type % of
City/Region Multi
‐
Family Retail Office Industrial Other Total Lifeco IA
Central London 302 764 505 - 63 1,634 1.0%
Other United Kingdom 80 720 226 815 264 2,105 1.2%
Total United Kingdom 382 1,484 731 815 327 3,739 2.2%
% of Total 10.2% 39.7% 19.6% 21.8% 8.7%
% of IA 0.2% 0.9% 0.4% 0.5% 0.2%
Mortgage holdings in the United Kingdom totaled $3.7 billion (2.2% of
invested assets). Mortgages are well diversified by property type, with a
weighted average LTV of 55%, a weighted average DSCR of 1.9, and a
weighted average lease term of 14 years.
Central London mortgage holdings totaled $1.6 billion (1.0% of invested
assets), with office holdings totalling $0.5 billion (0.3% of invested assets).
Central London mortgage weighted average LTV is less than 45% and Central
London office weighted average LTV is less than 55%.
31

United Kingdom property related exposures
Investment Properties
(C$m) Carrying Value Property Type % of
City/Region Multi
‐
Family Retail Office Industrial Other Total Lifeco IA
Central London - 25 247 - 35 307 0.2%
Other United Kingdom - 1,103 386 622 383 2,494 1.4%
Total United Kingdom - 1,128 633 622 418 2,801 1.6%
% of Total - 40.3% 22.6% 22.2% 14.9%
% of IA - 0.6% 0.4% 0.4% 0.2%
Investment property holdings in the United Kingdom totaled $2.8 billion
(1.6% of invested assets). Property holdings are well diversified by property
type, with a weighted average lease term of 14 years.
Central London property holdings are primarily office properties and totaled
$0.3 billion (0.2% of invested assets).
32

Total Credit Impact on Shareholders’ Net Earnings
In-quarter developments
Credit markets
33
Credit experience related to impairments and rating changes
negatively impacted shareholders’ net earnings by $18 million in the
quarter
Full Year YTD
($ millions) Q1 Q2 Q3 Q4 2015 Q1 Q2 2016
Credit (impairments) / recoveries 3 4 1 (1) 7 (4) (18) (22)
Credit (downgrades) / upgrades (6) (16) (8) (25) (55) 14 - 14
Total Impact (3) (12) (7) (26) (48) 10 (18) (8)
2015 2016

Income & Expenses Balance Sheet
US$ £ € US$ £ €
Q2 2016 1.29 1.85 1.46 1.30 1.72 1.44
Q1 2016 1.37 1.96 1.51 1.30 1.87 1.48
Q4 2015 1.34 2.03 1.46 1.38 2.04 1.50
Q3 2015 1.31 2.03 1.46 1.34 2.02 1.50
Q2 2015 1.23 1.89 1.36 1.25 1.96 1.39
Currency
34