grass, water and soil evaporation at aspendale
TRANSCRIPT

G R A S S , W A T E R A N D S O I L E V A P O R A T I O N AT A S P E N D A L E
I . C . M c l L R O Y and D. E. A N G U S
C.S.I.R.O., Division o[ Meteorological Physics, A,sl~emlale (Australia)
(Received October 5, 1963)
S U M M A R Y
Results are presented of the first three years of operation of a multiple large weighed lysimeter installation. Evaporation from well-watered grass (potential evaporation) consistently exceeded that from free water, and even more that from wet soil. The latent heat of potential evaporation also consistently exceeded the net radiant energy available. These phenomena arise from the well-known oasis effect, operating on a very large scale and affecting rough surfaces more than smooth.
Grass potential evaporation is well correlated with water loss from several types of containers, and with evaporation computed from meteorological observations by a recent formula. This suggests the desirability of using lysimeters to calibrate simpler methods of determining evaporation for subsequent routine use.
I N T R O D U C T I O N
In 1957, as part of a wide-ranging study of problems in evaporation and water rela- tionships, the C.S.I.R.O. Division of Meteorological Physics commenced the instal- lation at Aspendale, Victoria, of a number of large ferro-concrete weighable lysime- ters. Results are now available from twelve such units (1.6 m diameter, 1.1 m depth) and two smaller units (potential evaporimeters, 44-gallon oil-drum size), for periods of 2-3 years. During this time six of them have been fitted with automatic recording balances (MC[LROY and SUMNER, 1961), for periods of up to 29 months.
During much of the time relevant quantities such as radiation and evaporation from several types of water tank have been recorded or measured regularly at the site.
The project was first discussed by MCILROY (1958), and a detailed description of the site and the equipment appears in another paper (MCILROY and ANGUS, 1963) referred to hereafter as M and A. The latter also describes a site survey and a number of special tests to establish the accuracy and representativeness of the lysimeter results.
A gr. Meteorol., 1 (1964) 201-224
202 1. ( . MclLROY AND D. E. A N G U S
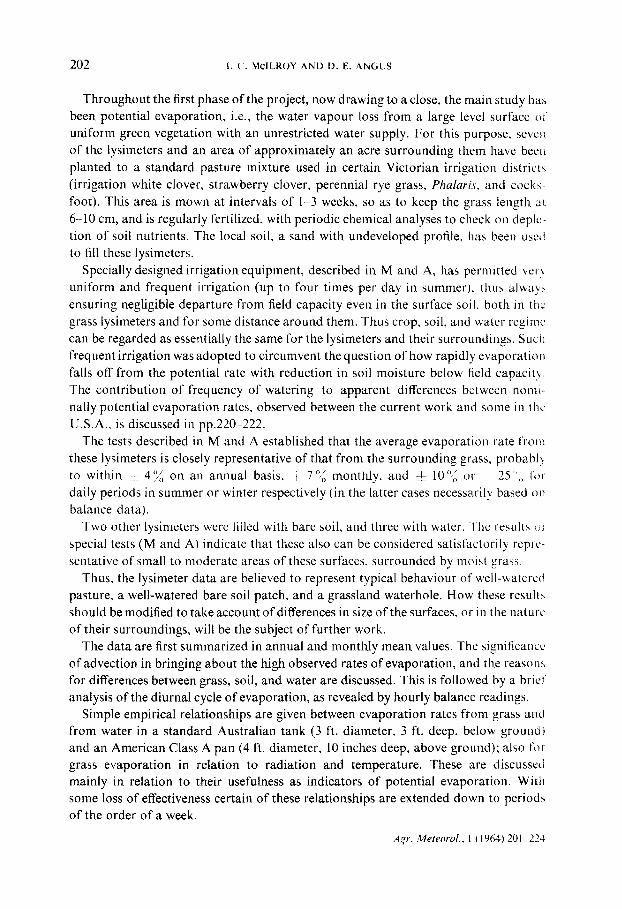
Throughout the first phase of the project, now drawing to a close, the main study has been potential evaporation, i.e., the water vapour loss from a large level surface ol uniform green vegetation with an unrestricted water supply. For this purpose, seve~ of the lysimeters and an area of approximately an acre surrounding them have beet~ planted to a standard pasture mixture used in certain Victorian irrigation districts (irrigation white clover, strawberry clover, perennial rye grass, Phalaris, and cocks- foot). This area is mown at intervals of 1-3 weeks, so as to keep the grass length at 6-10 cm, and is regularly fertilized, with periodic chemical analyses to check on depic- tion of soil nutrients. The local soil, a sand with undeveloped profile, has been used to fill these lysimeters.
Specially designed irrigation equipment, described in M and A, has pernaitted vet\ uniform and frequent irrigation (up to four times per day ill summer), thus alway.~ ensuring negligible departure fi'om field capacity even in the surface soil. both in the grass lysimeters and for some distance around them. Thus crop, soil, and water regimc can be regarded as essentially the same for the lysimeters and their surroundings. Such frequent irrigation was adopted to circumvent the question of how rapidly evaporatiol~ falls off from the potential rate with reduction in soil moisture below field capacit), The contribution of frequency of watering to apparent differences between nomi- nally potential evaporation rates, observed between the current work and some in lhc U.S.A., is discussed in pp.220-222.
The tests described in M and A established that the average evaporatioia rate from these lysimeters is closely representative of that from the surrounding grass, probabl) to within -- 4%, on an annual basis, ~i 7°~o ~ monthly, and ~__ 10"~ or 25'~,, for daily periods in summer or winter respectively (in the latter cases necessarily based o~ balance data).
Two other lysimeters were liiled with bare soil, and three with water, i h c result,~ ~1 special tests (M and AI indicate that these also can be considered satisfactorily repre- sentative of small to moderate areas of these surfaces, surrounded by moist grass.
Thus, the lysimeter data are believed to represent typical behaviour of well-walercd pasture, a well-watered bare soil patch, and a grassland waterhole. How these results should be modified to take account of differences in size of the surfaces, or in the nature of their surroundings, will be the subject of further work.
The data are first summarized in annual and monthly mean values. The signiticancc of advection in bringing about the high observed rates of evaporation, and the reasons for differences between grass, soil, and water are discussed. This is followed by a brief analysis of the diurnal cycle of evaporation, as revealed by hourly balance readings.
Simple empirical relationships are given between evaporation rates from grass and from water in a standard Australian tank (3 ft. diameter, 3 ft. deep, below groundt and an American Class A pan (4 ft. diameter, 10 inches deep, above ground); also liar grass evaporation in relation to radiation and temperature. These are discussed mainly in relation to their usefulness as indicators of potential evaporation. With some loss of effectiveness certain of these relationships are extended down to periods of the order of a week.
Agr. Meteorol.. I 11964) 201 224

GRASS, WATER AND SOIL EVAPORATION AT ASPENDALE 203
Finally a strong relationship is shown, effective even down to hourly periods under favourable circumstances, between lysimeter evaporation and that computed from meteorological data by a new formula (MCILROV, 1960). On the other hand, only fair agreement is found between lysimeter evaporation and that computed by the rather similar formula of PENMAN (1948), or by the well-known energy balance method.
L O N G - T E R M E V A P O R A T I O N
Monthly and annual averages of measured evaporation rates from the various sur- faces (lysimeter grass Eg, lysimeter water Ew, lysimeter soil E S, Australian tank E t, Class A pan Ep), are set out in Table I. Almost all of the values quoted are averages from two or more units. Nine of the monthly periods have been adjusted slightly to avoid drainage anomalies, i.e., they are quasi-months ranging 28-33 days in length rather than strict calendar months (cf. M and A, p. 12).
Corresponding figures for several other quantities are also given in Table I. These include net, R, and global radiation, R G, for comparative purposes divided by latent heat, L, to give equivalent evaporation rates, i.e., R/L and R6/L respectively; sunshine hours, S: mean dry-bulb and wet-bulb temperature, T and T w, and relative humidity, R.H.: mean windspeed, u; and monthly precipitation, P. They are measured by stan- dard methods, all except rainfall at a height of about a metre, to one side of the lysi- meter site. Radiation, windspeed, and precipitation are recorded as 24-hour totals, while temperature and humidity are obtained by averaging 09 h 00 and 15 h 00 obser- vations. In addition, Table I includes a computed value of grass evaporation, E~2 (see p.218), and the ratios of grass evaporation to that from water (Eg/E~) and to the net radiant energy equivalent (LEg~R).
z,.
E E
g ;z >=
i
I I I J I I l I I I I
8 x \
7 \ \ ' \ , \ \ , \ / 1960
6 , \ \ / / . % / - - I961
5 ".~.\ ,. 4 \\', /-~Y-"I'
3 \ " /
I I I I . . , I I I I I I F
F M A M J J A S 0 r,,i D
Month
F ig.l. Separate annual cycles of potential evaporation (Eg) at Aspendale, 1959-1961.
Agr. Meteorol., 1 (1964)201-224

Mon
th
1959
Ja
n.
Feb
. M
arch
Ap
ril
May
J
un
e
July
A
ug.
Sep
t.
Oct
. N
ov.
Dec
.
_~
1960
Ja
n.
Feb
. ~,
M
arch
A
pril
• "
May
-
June
Ju
ly
Aug
.
Eg
E s
E w
E
t E
p 11
1171
lll
ljVl
ffllT
l 11
7111
IT
IIH
per
per
per
per
per
day
day
day
dav
da v
TA
BL
E
I
MO
NT
HL
Y
~N
D
AN
NU
Al.
A
VI-
RA
(;Y
S
l
Ec,
_, R
/L
RG
/L
S T
Fll
nl
D1F
II
Fll
lll
]lot
irs
per
per
per
per
day
C
day
t/at"
da
y
7.54
7.
62
7.29
9.
20
7.75
4.
65
5.26
5.
44
6,30
5.
66
3.78
-
3.07
3.
43
3.99
3.
81
3.07
2.
62
3.02
3.
43
3.35
1.
68
--
1.09
1.
83
1.70
1.
70
1.04
0.
41
0.86
1.
42
1.42
1.
37
1.14
0.
74
0.81
1.
14
1.27
1.
37
1.55
0.
97
1.52
[.
85
2.39
2.
11
2.51
1.
70
1.88
2.
16
2.90
3.
00
3.66
2.
41
3.02
3.
15
4.44
4.
09
5.36
3.
66
3.51
3.
76
5.21
4.
88
5.26
3.
73
4.65
4.
78
6.15
6.
48
6.10
11
.66
10.2
22
.8
4.60
9.
25
7.5
21.1
3.
35
6.25
5.
6 [8
.8
2.36
5.
36
6.0
t7.3
0.
94
3.53
4.
3 [2
.7
0.46
2.
74
4. I
11
.4
0.69
3.
07
3.4
10.0
1.
40
4.52
5.
7 11
.6
2,36
5,
92
5.6
12.5
3.
89
8.08
7.
0 15
.3
4.24
8.
71
6.3
19.0
5.
77
10.5
4 7.
6 19
.4
7.59
5.
08
5.92
6.
20
8.05
7.
26
5.59
10
.97
8.9
5.66
4.
06
4.55
5.
23
6.45
5.
89
4.60
9.
30
7.4
4.57
3.
40
3.61
4.
27
5.26
4.
72
3.28
7.
29
7.1
3.20
2.
79
2.82
3.
30
3.68
3.
25
(I .
88t
5.18
4.
4 0.
94
0.56
1.
04
1.88
1.
96
1.75
0.
79
2.87
3.
0 0.
97
0.69
0.
76
1.22
1.
22
1/.7
4 0.
58
3,15
4.
1 0.
74
0.43
0,
81
1.27
1.
55
1.30
(0
.711
2.
92
3.1
1.35
0.
97
1.09
1.
40
1,83
I.
~8
1.32
4.
37
5.5
23.3
19
.9
20.3
16
.4
11.9
9.
4 9.
9 10
.3
Tw
C
17.2
16
.6
15.8
13
.8
10.2
9.
4 8,
1 9.
3 9.
8 12
,1
t5.2
14
.4
17.2
15
.1
15.4
12
.9
10,1
8.
6 8.
4 8.
4
R.H
.
o o
54
61
72
66
71
75
76
73
69
67
65
55
52
58
57
65
78
88
80
76
It
¢ "II
I 'S
~("
P
IHll
l
p¢l"
t,'lo
/ztlt
L~,'E
w LE
~/R
280
8.9
0.9
c~
1.24
24
0 25
.1
0.89
1.
01
220
88.9
1.
23
1.12
21
0 16
.5
1.18
1.
30
175
46.0
1.
53
1.78
22
0 52
.8
1.21
2.
28
210
31.5
1.
41
1.67
24
5 64
.0
1.02
1.
11
245
60.2
i .
33
1.06
27
0 80
.3
1.21
0.
94
215
21.8
1.
53
1.26
22
5 59
.2
1.13
0.
91
38.1
1.
28
1.35
54
.1
1.24
1.
23
8.4
1.27
1.
39
26.9
1.
14
tl.7
1/
i28.
5 0.
91
1.19
28
.4
1.27
i .
65
102.
6 !1
.91
~1.0
4)
70.6
1.
23
1.02
240
245
210
250
310
t75
250
190
b~
7-
;>
Z ;>
Z

T A
B L
E
I (c
onti
nued
)
1960
Sep
t.
1.83
1.
27
1.63
1.
85
2.49
2.
31
2.29
5.
31
4.3
12.7
10
.9
79
240
96.0
1.
12
0.80
O
ct.
4.24
3.
23
3.56
3.
53
4.80
4.
04
3.73
7.
92
6.9
15.0
12
.4
72
290
39.1
1.
19
1.14
N
ov.
4.34
3.
51
3.71
3.
91
5.03
5.
05
4.70
9.
35
7.3
15.6
12
.2
65
280
110.
2 1.
17
0.92
D
ec.
6.58
4.
90
5. I
1 5.
69
8.28
6.
48
5.46
11
.05
9.5
21.1
16
.3
59
250
8.9
1.29
1.
20
1961
Jan.
8.
20
5.66
6.
71
6.86
8.
79
7.70
6.
43
12.3
2 10
.5
23.8
18
.4
57
255
24.1
1.
23
1.28
F
eb.
6.55
4.
70
5.59
6.
45
7.72
6.
81
4.95
10
.64
8.5
22.3
16
.4
52
250
36.6
1.
17
1.32
M
arch
4.
27
2.95
3.
63
4.37
5.
18
4.14
2.
84
8.18
6.
4 19
.6
15.8
66
25
0 36
.3
1.17
1.
50
Apr
il
2.54
1.
80
2.03
2.
67
2.95
2.
87
1.88
5.
41
4.2
17.8
t4
.7
70
210
85.1
1.
25
1.35
M
ay
1.30
0.
76
1.14
1.
73
1.83
1.
55
1.14
4.
09
4.9
13.1
11
.3
80
185
55.4
1.
13
1.13
Ju
ne
0.97
0.
53
0.84
1.
?0
1.42
1.
45
0.69
2.
41
3.0
12.0
10
.3
80
260
65.0
1.
15
1.41
Ju
ly
0.91
0.
58
0.91
1.
22
1.35
1.
35
0.84
3.
28
4.1
10.1
8.
6 80
23
0 65
.0
1.00
1.
09
Aug
. 1.
22
0.81
1.
04
1.55
1.
78
1.50
1.
45
4.62
5.
2 11
.2
9.9
83
200
90.7
1.
15
0.84
S
ept.
2.
57
2.01
2.
41
2.57
3.
68
3.33
2.
97
6.93
7.
4 13
.8
11.0
69
23
0 29
.5
1.06
0.
86
Oct
. 4.
32
2.95
3.
30
3.45
4.
60
4.70
3.
94
8.05
6.
8 17
.2
13.3
62
24
5 39
.4
1.31
1.
10
Nov
. 5.
77
4.24
4.
67
4.98
6.
35
5.87
4.
47
9.35
7.
5 18
.7
14.3
59
30
0 35
.1
1.23
1.
29
Dec
. 6.
12
4.70
5.
56
6.07
7.
80
6.73
5.
41
10.4
1 8.
7 19
.7
15.0
58
29
5 39
.1
1.11
1.
14
~.
1959
-196
1 O
vera
ll
3.58
2.
57
3.00
3.
40
4.24
3.
84
3.00
6.
81
6.2
16.0
12
.8
68
240
52.6
1.
20
1.20
av
erag
e 2
Rat
io
1.00
1.
40
1.20
1.
05
0.84
0.
93
1.20
0.
53
- -
-
2"_
i S
ymbo
ls a
re a
s fo
llow
s:
Eg
lvsi
met
er.
~."-
'rass
evap
orat
ion:
E~
iy
sim
eter
soi
l ev
apor
atio
n:
E,,
= ly
sim
cter
wat
er e
,ap
ora
tio
n:
El
Aus
tral
ian
tank
ev
apor
atio
n:
Ep
Cla
ss A
p
an e
vapo
rati
on;
Ec.
_, co
mp,
Jte:
t e,
,apo
rati
on,
by e
qu
atio
n 3
: R
L
net
radi
atio
n eq
uiva
lent
: R
(;/L
gl
obal
ra
diat
ion
equi
vale
nt;
S su
nsh
ine
hour
s:
7-.
7",,
dry
and
wet
bul
b te
mpe
ralu
re,
resp
.: R
.H.
rela
tNc
hu
mid
ity
: tt
,ain
dspe
ed:
P pr
ecip
itat
ion;
(
) de
note
s &
va
lues
est
imat
ed f
rom
inc
ompl
ete
data
. b
a
bO

206 I . c . MclLROY AND D. E. ANGUS
7
6
E E
5
o 4
3
I
0
I
! J • i , I I , ] , ~ i ', J
F M A M J J ~ S ~3 N D
Morlth
Fig.2. Average annual cycles ( 1959-1961 ) of evaporat ion from grass (Eg), water (E~), soil I E~) and net radiat ion equivalent (R'L).
In Fig.l, the annual cycle of/:g is plotted for 3 successive years, to show the yea~- to-year variability. The same picture is obtainable from similar plots of the othc~ evaporation or radiation-equivalent quantities in Table I. Deviations of individual monthly values from the 3-year averages tend to occur in general sympathy for all the evaporation quantities, and to a lesser extent for radiation too; but little correlation can be found with corresponding deviations in temperature, humidity, etc.
The main features of the Aspendale data are the high level of /:g by comparison with ~ E~, and of both with respect to the available energy equivalent R/L. Fig.2 s h o ~ annual cycles (averaged over the three years) of Eg. Ew, E~ and R/L. Excess energs,. over and above tile net radiant input, is needed for grass evaporation virtttall 5 throughout the year, for water evaporation during summer and autumn, and for soil evaporation during the month of April.
Similar phenomena have been observed increasingly frequently in recent experl ments, both in Australia and overseas. Their importance is so great that discussion in some detail seems warranted.
EXCESS OF L A T E N T HEAT F L U X OVER NET R A D I A T I O N I N P U T
Local or site effects
Large latent heat fluxes can be explained in terms of the well-known oasis effect, where relatively dry hot air from upwind unirrigated land, blowing over the moist cool
1 The slightly higher values of Et compared with E w are partly a size effect and partly due to the tank being outside the ma in irrigated area, while the even higher values of Ep are mainly due to the pan being raised above ground level (see p.214).
Agr. Meteorol., 1 11964)201-224

GRASS~ WATER AND SOIL EVAPORATION AT ASPENDALE 207
surface of an irrigated area, increases the vertical humidity gradient, and decreases or even reverses the normal daytime temperature gradient.
The resulting enhancement of evaporation rate and reduction or reversal of upward sensible heat flux is greatest at the upwind boundary, but decreases with distance downwind, rapidly at first and then more gradually, due to the air becoming moister and cooler as it flows further into the oasis. If the latter is large enough and the weather steady enough, the evaporation rate should eventually tend to a finite lower limit, which can be shown to depend partly on temperature but mainly on net radiant input (see p.218). In practice, due to a number of interfering factors (see, for instance, next sub-section), it would be rare for such an u!timate or equilibrium value to be ap- proached at all closely. Nevertheless, the downwind trend of oasis evaporation will generally be toward the above limit rather than towards zero, or as sometimes supposed the net radiation equivalent itself.
In the case of the present site, the variation of evaporation rate has been shown to be small, even in summer with the immediate surroundings very dry (M and A). A com- parison was also made of evaporation rates inside and just outside the irrigated zone, using small sunken water tanks to emphasize differences due to air modification over the irrigated surface. This revealed only a comparatively small increase in the outside rate relative to that inside, rising to no more than 20-30 ° o even during the summer (M and A, see table 11). With such small differences, scatter in the data made it impossible to derive any definite relationship between evaporation rate and length of irrigated fetch. Nevertheless, it was apparent that even a substantial increase in the area under irrigation would have produced little reduction in evaporation measured more than a few metres in from the edges of the wet zone. Thus the apparently high Aspendale evaporation rates can be explained only to a minor extent as a purely site effect, due to local advection, such as has generally been invoked in similar circumstances.
Large-scale oasis ~yffects
On the other hand, the moisture status of the surroandings on a wider scale does have a marked effect. Table I[ compares daily values of Eg and of daytime R/L, at various intervals after significant rainfall. To bring out the effect of progressive drying of the general surroundings after each rain, the data are grouped by season (since Aspendale has wet winters and springs, but comparatively dry summers and autumns), and accord- ing to whether the wind had come for the whole of the day across Port Phillip Bay, iust to the southeast (water fetch), at no time across the Bay (land fetch), or part of the time across the Bay (mixed fetch).
For a water fetch the relationship between potential evaporation and available radiant energy is virtually independent of time elapsed after rain, except perhaps in autumn. On the other hand, with a land fetch a marked increase occurs in summer and autumn between LEg/R soon after rain, and a week or more afterwards. With mixed fetch there are similar but weaker increases, except in winter when there is actually a
A W. Meteorol., 1 (1964) 201 224

tO
TA
BL
E
11
EFE
EC
T O
F D
RY
ING
OU
T O
F G
EN
ER
AL
SU
RR
OU
ND
ING
S O
N
RE
LA
TIO
N B
ET
WE
EN
G
RA
SS
PO
IEN
T1A
L
EV
AP
OR
AT
ION
, E
g,
AN
D
EV
AP
OR
<
ON
E
QU
IVA
LE
NT
OF
NE
T
RA
DIA
TIO
N,
R/L
(W
ITH
IN T
HE
EX
PE
RIM
EN
qA
L A
RE
A,
IN
MM
/DA
YI
Tim
e el
apse
d si
nce
last
rai
n/al
@re
ater
tha
n 3r
am i
, 24
hom
'.~
.~,'i
~,,if
ic.a
nc~
Seas
ol7
I-3
dars
7
dqr.
, or
~l.o
re
leve
l of
;lif
fere
ncd
No.
ofd
al's
E
g R
.L
Eg-
R;L
LE
g R
.\
o. o
ldc(
v;
L~
R'L
E
g-R
.'I.
L.['
~'R
i,
Eg
Wat
er .f
etch
S
um
mer
39
6.
20
5.82
0.
38
1.07
22
6.
91
6.25
0.
66
1.11
N
o s
ign.
A
utu
mn
8
2.64
2.
57
0.07
i.
03
13
4.72
3.
02
1.70
i.
56
5 i'g
~ W
inte
r 19
1.
52
2.01
0.
49
0.76
3
1.17
1.
52
0.35
0.
77
No
sig
n.
Sp
rin
g
52
3.84
4.
37
0.53
0.
88
23
4.52
4.
98
- 0.4
6 /)
.91
No
sig
n.
Lan
d fe
tch
Su
mm
er
9 6.
86
5.92
0.
94
1.16
22
10
.82
6.53
4.
29
1.66
0.
1 o
Au
tum
n
12
2.92
2.
74
0.18
1.
06
21
4.55
2.
62
1.93
1.
74
1 °,
, W
inte
r 22
1.
96
1.80
0.
16
1.08
15
2.
16
1.60
0.
56
1.35
N
o s
ign.
S
pri
ng
16
4.
44
4.29
0.
15
1.04
19
5.
13
3.99
1.
14
t.29
N
o s
ign.
.~
Mix
ed fe
tch
~ S
um
mer
16
6.
17
6.02
0.
15
1.03
66
7.
92
6.25
1.
67
1.27
I
",,
Au
tum
n
23
2.59
2.
69
0.10
0.
96
50
3.73
2.
95
0.78
1.
27
5 'k
l W
inte
r 32
1.
35
1.63
0.
28
0.83
26
0.
97
1.68
0.
71
0.58
5
o,
Sp
rin
g
18
3.89
4.
17
0.28
0.
93
41
4.55
4.
17
0.38
1.
09
No
si~
,n.
=
of b
,,~, ~
lfte
r ,t
djtt
stin
g fo
r di
ffer
ence
,, m
rad
iati
on
g 4a
i,,..1
t,..)
tJ
4a.
Lev
el
of
sign
ific
ance
of
tile
diff
eren
ce
bet
wee
n
the
tv.o
\a
lue,
;
2"
¢3
..<

GRASS~ WATER AND SOIL EVAPORATION AT ASPENDALE 209
decrease. The difference ill LEg/R between land and water fetches is proportionally
greatest in winter, when the waters of the Bay are warmer titan the land, in effect adding to their relative efficiency ill modifying the air passing over them.
Even with fetches mainly over water the last few hundred metres are always o~er mostly unirrigated land between the Bay and the site. The absence of any marked drying-out effect on these occasions, together with th.e findings noted in the previous
- i sub-section, therefore suggest that much of the increase in L/},g,'R with time, when present, arises from the drying of large upwind stretches of land rather than of the immediate surroundings of the experimental area. Although the extent to which this drying occurs cannot be determined, nor the distance upwind for which it is important, the consequence at Aspendale must be considered as a genuine component of the regional clirnate rather than a purely local oasis effect.
The position at Aspendale is undoubtedly complicated by the nearness of Port Phillip Bay. As well as the influences already mentioned, it appears to introduce a noticeable dependence on wind-direction into the horizontal gradients of temperature and humidity measured over th.e site (e.g, M and A, table I). However, as already stated, little horizontal variation (whether direction-dependent or not) could be found in surface evaporation rates.
The overall effect of the Bay can be estimated by assuming no other cause of a variation in LEg/R with fetch. At their face value, the data of Table 1[ then indicate that the presence of the Bay would not make much difference for a few days after rain, but could reduce LEg/R by more than 50 "~,~ on some days which have a Bay fetch and occur well after rain. Seasonal evaporation thus appears to be reduced by about t 5 ",i in spring, to perhaps 30 ?,o / in summer. Other things being equal it is only the presence of the Bay which prevents an even more striking excess of Eg over R/L than that displayed in Fig.2 (showing the average of all days).
The effect of season on LEg~R, with highest values in summer and autumn irrespec- tive of fetch (also to be seen in the data of Table IL is consistent with the temperature dependence of equilibrium evaporation (see equation 2, p.218). It will also be influ- enced by seasonal heat accumulation and release by the soil or water (cf. p.214). A further factor in the case of land fetch could be a faster rate of upwind drying after rain in summer and autumn. The varying incidence of dry-fetch days is also reflected in the slight negative correlation between monthly rainfall and monthly (/~-R,'L), to be seen from Table I.
However, Table I1 also brings out the relatively high rates of evaporatio,-t occurring virtually at all times, even with a water fetch or soon after rain with a land fetch, with the surroundi lgs moist for many kilometres all around. The great distance for which air must therefore remain comparatively dry, when penetrating what is in effect a giant oasis, emphasizes the large scale oa which advection processes can be important. Even assuming a high degree of initial contrast, a very slow rate of air modification over th.e Bay or the rain-wetted area is indicated.
This could arise from either atmospheric subsidence (i.e., a downward component of mean air flow), tending to bring down relatively dry air from aloft, or else strong
Agr. Meteorol., 1 (1964)201 224

210 I . C . M c I L R O Y A N D D. E. A N G U S
turbulent exchange within a deep dry air layer overrunning the wetted zone. Such a layer could be generated by a long previous path over dry land or through a region of subsidence.
Within the oasis itself, current theories of the "'blanketing effect" of a moist bound- ary layer, such as is commonly supposed to develop over water or an irrigated sur- face, may need considerable modification in practice because of massive penetration of the blanket by convective circulations under unstable conditions or slow but widespread subsidence over large areas under stable conditions.
Thus although potential evaporation must be governed in a broad sense by factors affecting the local availability of radiant energy, such as latitude and cloudiness. another important control must be the general pattern of air flow, both over and for some tens or even hundreds of kilometres upwind of the region concerned.
This will often be the case in coastal and near-coastal Australia, because of the contrast between the vast dry inland areas and the surrounding oceans. In Melbourne, a limited survey does show a preponderance of trajectories over land for 100 km or more upwind, right through the year. This alone is perhaps sufficient to account fi~r the relatively high potential evaporation rate found, compared with several reported from overseas (see pp.220--222). In addition, the whole of Victoria and much of" Australia is subject to subsidence, due to the pattern of circulation of the atmosp- here as a whole. This is itself, of course, the main reason for the dryness of !he Australian interior.
E X C E S S O1- G R A S S E V A P O R A T I O N O V E R W A T E R E V A P O R A T I O N
Roughness and level q/ sur/dce
Evaporation rates depend on the moisture gradient between the surface and the over- lying air and on the turbulent transfer coefficient ill this layer. The increase in e~apo- ration rate from adjacent surfaces such as vegetation and free water when the o~cr- lying air increases in dryness depends on the respective values of the transfer coeti~- cients, or, to a first approximation, on the aerodynamic roughness of the surface,~. lh~- greater roughness of the grass is believed to be an important reason for Eg exceedint: Ew, in spite of net radiation over grass being less in magnitude than over water, i,,, about 25 ~ both by day and by night. This is supported by special tests with long gr~,,, (M and A). It is discussed further on pp.218-219.
Another obvious reason for grass evaporation exceeding that from a sunken tank i~ the lower level of the water surface compared with the surrounding grass, again affect- ing the relative exchange efficiencies. Tests in which grass lysimeters were lowered ~a their pits (M and A) indicate a magnitude for this effect of the order of 10"~,. O~c~ periods of the order of an hour the large difference in heat storage between soil and trcc water also becomes important. This tends to reduce water evaporation during the dtt~ but to favour it at night, with little influence on the long-term average (see p.213 ].
,4~,r. Meteorol., I t l 9 6 4 ) 2111 22 ;

GRASS, WATER AND SOIL EVAPORATION AT ASPENDALE 21 1
A low aerodynamic roughness and a slightly depressed surface must also contribute to the low value found for E S, although this will also be affected by th.e smaller net radiation over bare soil (in the present case 4 ~ less than over irrigated grass), and to some extent by occasional drying out of a shallow top layer of soil.
Watering regime
Until recently so-called potential evaporation has been found repeatedly to be less than free-water evaporation. This probably reflects in part the milder advection con- ditions under which most earlier trials took place (e.g., in northern Europe), and in part the rarity of comparisons between water and thoroughly irrigated vegetation. Only where very frequent watering is applied will it be possible to neglect the effect of varying degrees of stomatal closure in reducing evaporation from vegetation. Even then, this may sometimes apply only in the long-term average, since in spite of heavy watering some plant species may still suffer "midday-wilt" on severe days, and on some nights may close their stomates early, or open them late next day.
With the elaborate irrigation program described in M and A the values of Eg obtained certainly represent maximum freedom from water restriction, because they were not increased by occasional further watering. (This was not true of bare soil evaporation at first, as increasing the normal watering frequency after the first twelve months of operation did cause a 5 °/o increase in the lower of the values of E, obtained from two bare soil lysimeters. This emphasizes the ease with which a dry crust can form, in spite of very frequent irrigation.)
A spuriously high rate of grass evaporation due to the frequency of irrigation, with water droplets present on the leaf surfaces for an undue proportion of the time, can be ruled out for two reasons. Firstly inspection showed that even immediately after an irrigation the percentage of leaf area covered by water films or droplets was appre- ciably less than that estimated to be occupied by stomates 1. Secondly the lysimeter balance records gave no indication whatsoever of an enhanced rate of evaporation j ust after a wetting, compared with just before~ with the implication that stomatal resist- ance never became significantly high under these conditions.
SHORT-TERM EVAPORATION
For all but a few days of the 3 years, daily totals of evaporation are available from at least one water lysimeter (either by weighing or with. less accuracy by hook-gauge readings), as well as a Class A pan and one or more Australian tanks. The same is true
1 Except in very calm conditions (when the effects of surface wetness are less important anyway) water droplets promptly run off most of the grass blades, and in particular those which are well exposed to lhe air. The drops which remain, although often appearing misleadingly prominent when looking directly down on them, generally occupy less than a few percent of the area of the horizontal or gently- sloping leaves, themselves few in number and poorly ventilated.
A jr . Meteorol., I (1964) 201 224

212 1. ('. McILROY AND D. E. ANGUS
24 EnEe~cjy balance co~iDonsons ~ A Clear summer day
,: 3 L \
i 6 / I 1
t \ \ /
{- ,o if. ] I " ,
/ . / / /
0 ~ ,4. • e , - - , x ' ~ x . 1:
2 I t I I I l h " I I
16 Energy corn p_gor~eons / / ~ . B Cloudy sumrner d%, / %1
12 27 th donuory 196t E i l ~
E
/M. .>< \ o
> . , ,° 7 , ' , \ - , :J / y , o./, , ,,.. ,..o j . . c - ~ t R I L , .
I A J ., ~ + Z _ . _ . J _ _ I - - L _ _ I I I I I I I I 1 "1" i i r - - . ' - J O 0 0 I 02 O~ 04 05 06 07 08 09 10 li 12 13 14 15 16 17 lib 19 20 21 22 ~D 24
1 2 p i ] I F ! - ~ F - - ' - T - - - ~ I r ' - - - t - i r - - ' T ~ ' T ' - - T ~ I - - I i ~ i - - - - l - - - ' q
J I - cZ Clear w in te r coy .J 26 "h O~;i}t_vJZL',i
g I \
L - . I k . - A . . . . . . . . L . . . . . ~ . ! I ~ I i ,i i 1 Ii I ' I ' I ~ - - 1 - - ' ' ' ~ - - ~ : i O0 O! OLL f ' ' ;)~i C~ CG OW ©~ 09 I0 II 12 I~ 14" [5 16 17 18 19 20 21 22 ,t% "7
6 E,~ergy , :: ~ U . _ £~ ,, L,.c. A n F s\'/Z;,.c_ ~ ~' C[OuIy w i r ie r JCy j .. 4 I st July " , . ,p./ • z/ x \
O0 OI O~ 05 04 O~ 06 ;]7 08 09 I0 I i7 I~ 14 15 !6 17 18 19 20 21 22 2.~ 24"
Pour of day
Fig.3. Typical diurnal cycles oF grass and water evaporat ion and net radia t ion equivalent.
Axr. MeteoroL, I t l 9 6 4 ) 2 0 1 22~-

GRASS, WATER AND SOIL EVAPORATION AT ASPENDALE 213
for one or more weighed grass lysimeters for the 29 months for which balances were in use. Throughout the whole of the 3 years nominal daily totals are also available from unweighed grass and bare soil lysimeters operated as potential evaporimeters (cf. M and A). From the latter, reasonably satisfactory averages can be found for periods greater than a week. In spite of considerable scatter, the daily and weekly data support the conclusions reached below, based on the hourly evaporation from grass and water and using recorded balance data.
Fig.3 shows diurnal cycles of Eg, E w and R/L in January and in July, for typical clear and cloudy days. The clear day curves tend towards a simple semi-sinusoidal shape, with the relation of E w to Eg largely one of reduced amplitude and up to several-hours phase lag. This is associated with greater daytime heat storage in the water than in the soil, and correspondingly greater heat release at night. The high storage rate itself arises partly from the penetration of sunshine well into the water, and partly from distribution of the absorbed energy through virtually the whole depth of water by thermal or wind-induced stirring. Short term effects of differences in sur- face roughness will also be present, although difficult to separate out (cf. p.211).
During the day the hourly values of R/L are exceeded frequently by those of Eg, but very rarely by E w. During the night, despite R becoming negative, E w always remains positive, and is sometimes quite large, due to the daytime heat storage men- tioned above. A similar tendency is present with the grass, although less marked, with nighttime Eg always small but generally positive. Genuine dewfall of significant magnitude is comparatively rare. The maximum sustained value recorded at night of the ratio LEg/R was about 0.5.
Under any but the most favourable conditions, even clear day curves are far from
I- / ,//
6O /
50 , / - "
~ o ~ % • / / • /
50 ,, • / o / / o • •
'ot- . / JA'. /." ol/ / 7 . . . . . / "
0 10 2O 3O 40 50 6O
[ I I I I I I I ,, 1 0 10 20 50 40 50 60 70 L I I I [ I 0 10 20 50 40 50 60
E w (rnm/week) Ec2 (mm/week) R/L (ram/week)
Fig.4. Comparison of weekly totals of grass potential evaporation (Eg) with those of water evapora- tion (Ew), computed grass evaporation (Ec2) and net radiation equivalent (R/L).
A~r. MeteoroL, 1 (1964) 201-224

214 i .C . MclLROY AND D. E. ANGUS
regular, while in the presence of cloud they display marked variations, not only from day to day but from hour to hour. Although hourly water-level readings are much less reliable than weighings, the diurnal cycles of the Class A pan and the Australian tank display much the same kind of fluctuations as those of the water lysimeters. In most conditions, therefore, the combined effects of such factors as varying heat storage in the water and ground, and possible intermittent stomatal closure in the grass, often accompanied by intense and varying small scale advection, preclude a useful relation- ship between short-period values of Eg and either Ew, Ep or E t.
E M P I R I C A L R E L A T I O N S H I P S
Fig.4 compares weekly averages of Eg with those for E w, R/L and Eca (see p.218), for a number of typical weeks in each season of the year. Balance data are used for Eg, as otherwise the scatter becomes considerably greater.
In Fig.5A, monthly Eg is plotted against the corresponding values of E w, E t and Ep. In Fig.5B the same is done for R/L, Ec~ and T. For clarity in these diagrams, average values for the 3 years have been used for each of the 12 months, although the remarks below apply almost as well to a plot of the thirty-six individual monthly points. The full lines shown are not lines of best fit, but are lines of slope equal to the appropriate long-term ratio, taken from the last line of Table I.
For weekly averages in Fig.4, the effects of the fluctuating short-term differences discussed in the previous section are still strong. However, they are somewhat reduced in the monthly averages of Fig.5, and in the case of Eg versus E w, for instance, an ex- tremely close relationship is now found. The excellen tcorrelation here is more than a mere reflection of the basic dependence of heat fluxes on available energy. It demon- strates that all the factors contributing to evaporation, including the proportioning of the total atmospheric energy flux between sensible and latent heat, are integrated over a period in an essentially similar way by the two systems, freely transpiring crop and free water surface.
Strikingly high correlations also exist of Eg with Ep and E t, even tbough the pan and the tanks are some 20 m outside the frequently irrigated area, with partial drying out of the soil around them in late summer and early autumn. The resulting small- scale advection appears to introduce a slight seasonal discrepancy into the relationship with the tank but has little effect on that with the pan. Both this reduction in influence of the immediate surroundings, and the appreciably higher range of pan values arc believed to arise from the pan being above-ground, rather than from any difference in dimensions or construction.
The importance of local energy input is demonstrated by the correlation of £~ with radiation. However, a clear seasonal cycle can be seen in the relationship between E~ and R/L, both in Fig.5B and in Fig.2 earlier. A more pronounced cycle in the reverse sense is visible in the relationship of Eg with temperature, T.
Part of this cycle can be accounted for by heat storage in the ground during spring,
Ag'r. Meteorol., I (1964)201-224

GRASS~ WATER AND SOIL EVAPORATION AT ASPENDALE 215
g E E
o = o o o
=_ g
/ / ..... oA.,, A
- - o - o December
o - - o o Februory
0 - - 0 0 - Novembe r
o o Morch o o October --
~- o ~pr,r -
o Septemloer
Moy o ~ : - o ° August
- - o dune
l I IX" I I I I I . I
I 2 3 4 5 6 7 8
i I I I i I I I I ; , ,0 I I I I I I I I
t 0 I 2 3 4 5 6 8
E w ( m m / d 0 y ) Ep ( ram/day) E t (mm/day )
,'. / E = O 93 E c q 7 Eg : 1.2 R / L / ~ 4 5 o / / E g : O.E 2 , , ' ,
,~A/ ' : / , ~ / / . / . , @ 6 / , ~ .
// / - / - i:: 5 . . . . °~ ber
> 3
I " / ~ - a o ~ ' ,
o } I / 1 I I I 0 1 5 4 5 6 7
l I I I I I I I I I 0 1 2 3 4 5 6 7 8
10 15 20 25
R/L ( m m / d a y ) Ecz (mm/c ley) T (°C)
Fig.5. Comparison of monthly averages of grass potential evaporation with those of other quantities. A. Grass evaporation (Eg) vs. water evaporation; water lysimeter (Ew), Australian sunken tank (E t)
and U.S. Class A raised pan (Ep). B. Grass evaporation (Eg) vs. net radiation equivalent (R/L), computed evaporation (Ec2) and
dry-bulb temperature (T).
with a co r re spond ing hea t release in au tumn, the former reducing and the lat ter in-
creasing the energy avai lable at the surface ( R - G in equat ions 1-3). F r o m measured
soil t empera tu res and est imates o f soil hea t capaci ty , such effects are greatest in Octo-
ber and Apri l , when they are equivalent to 0.25 m m o f evapora t ion per day.
A W. Meteorol., 1 (1964)201-224

216 1. C. MclLROY AND D. E. ANGUS
Changes in the proportion of the available energy going into latent heat can also be expected, from seasonal variations both in temperature and in moisture status of the surrounding countryside (see also pp. 209, 218).
To sum up, with an acre or more of low uniform, well-irrigated crop. it would appear that:
(1) Although unsuitable at present for periods less than a week, properly "'calibra- ted" water tanks provide a good estimate of crop evaporation rates for a month or longer.
(2) The best results come from a sunken tank 3 ft. or more in diameter, well within the crop.
(3) A working estimate is provided by a similar tank a short distance outside the crop, provided its surroundings are not too unlike the crop itself.
(4) Because of a reduced dependence on its immediate surroundings, a rnoderatc sized raised tank such as the Class A pan gives a good performance even when outside the crop (again not too far away), and this may be little improved by installation right inside the crop.
(5) An estimate of crop evaporation satisfactory for many purposes may be obtain,-. able from radiation.
(6) Net radiation, measured over the crop itself, is directly conccrned with 11~c evaporation process, and should be determined whenever possible.
(7) Correlations with other single meteorological variables, including the often- employed temperature, appear to be less useful.
(8) However, in all the above cases, the relevant empirical coefficient or coel'ficiem~ must be determined in situ for at least one growing season, by continuou~ or repeatcd comparison between tank or instrument readings and direct measurements of actual crop evaporation by some reliable means such as lysimetry.
C O M P U T E D E V A P O R A T I O N
General
The rate at which energy enters the atmosphere from a point on the surface is given by R-G, where G is the rate of heat flow into the ground, or into water. Although for a vegetated surface G is generally small, it cannot always be neglected even over quite long periods (cf. discussion of seasonal cycles, p.214). This is especially true of free water surfaces, particularly when the water is deep.
The total energy supply to the atmosphere then divides into a flow of sensible heal H and of latent heat LE, denoted as positive when away from the ground and into the air. On p.207 it was shown that in the presence of advection the ratio of these fluxes. known as the Bowen ratio, [3 ( = H/LE), can vary condiderably.
Thus the mere empirical relation of latent heat consumption to local radiant energy supply, i.e., of Eg directly to R/L as discussed earlier, should be capable of consider-
Agr, Meteorol., I (1964) 201-224

GRASS~ WATER AND SOIL EVAPORATION AT ASPENDALE 217
able improvement by also taking G and variations in [3 into account in some manner.
Energy balanc~
One well-known method is to measure R-G (and hence H -~- LE) and then use meas- ured gradients of temperature and humidity near the ground to obtain the prevailing value of [3. Assumptions of similar transfer mechanisms for heat and water vapour, and constancy of 13 with, height, are implicit in this approach. It is known that the former assumption does not always hold under conditions of large H, nor the latter with strong advection, but errors from both sources can be minimized by making the
gradient measurements as close to the surface as possible. A convenient expression for computing evaporation by this so-called energy balance
approach has been derived by McIIroy (equation 3.18 of SLATYER and MC|LROY 1961: for brevity denoted subsequently by S and M):
L 1 - - (I S @ y W where A T and ~ T w are measured differences of dry-bulb and wet-bulb temperature
o{ respectively, over the same small height interval; and is a slowly varying temper-
s 7 ature-dependent weighing function, obtained from tables or graphs (e.g., S and M, appendix 5). In consistent units • is the ratio of the specific heat of air to the latent heat of evaporation of water, or nearly enough the psychrometric constant, and s the slope of the saturation specific humidity versus temperature curve at mean wet-bulb temperature.
Gradient data suitable for this method were not recorded, so that monthly values could not be obtained. However, a total of 25 special measurements were made over separate periods of 10-30 min on seven days in autumn and winter. ~ T and : T, a, were obtained either from Assmann psychrometers, or from miniature wet- and dry-bulb resistance thermometers. All measurements were made at heights of 0.25 and 1 m over the centre of the irrigated area.
R and G were obtained from simultaneous recordings of a net radiometer and buried heat-flux plates nearby. The computed evaporation rates were then compared with lysimeter evaporation from balance records, estimated as well as possible for the
rather short periods involved. The mean ratio E~I was 0.72, with a standard error of E~
0.06 and a coefficient of variation of 0.40. The scatter is not surprising considering the difficulties of measurement of tempera-
ture differences over small height intervals, and of lysimeter evaporation rates over small time intervals. The rather low values of E~I relative to Eg can be explained by advection, due to the reduction with height in vertical flux of latent heat under oasis conditions (cf. M and A, section 6c). This work is to be extended to longer periods, with improved techniques at lower measuring heights for ~ T and ~ Tw.
Agr. Meteorol., 1 (1964)201-224

218 I. C, MclLROY AND D. E. ANGUS
Combination method
Another possible procedure is firstly to derive the proportion of the local energy supply that should go into latent heat in the absence of advection, and then to allow for the departure from this rather ideal condition under the given circumstances. It can readily be shown that over a large uniform moist surface, with the air close to the ground saturated or nearly so, 13 must approach the value 7/s (PR1ESTLE¥, 1959, chapter 8; S and M, section 3-11).
In any such case, with the air and the ground mutually adjusted to each other in respect of their "wetness", we can speak of an equilibrium evaporation rate. given by:
E~ s .
(This follows from equation 1, with/5 T -- YTw.) Thus under equilibrium conditions, the proportion of net radiation used in evaporation will increase with temperature. due to the variation of s/(s ~ y).
Where the air over wet ground is not already saturated it will be taking up addi- tional moisture, and hence latent heat, at the expense of some sensible heat. The main factors governing the corresponding departure from an equilibrium evaporation rate will be the prevailing windspeed and the dryness of the air. Their effectiveness i,i causing evaporation greater than the equilibrium rate will depend on the nature of the surface, in particular on its roughness, as it affects the turbulent diffusivity for a giveH wind speed.
The resulting evaporation rate can be simply expressed by means of another equa- tion derived by McIlroy (S and M, equation 3.19), which combines the flux-gradient relationship (or the transfer-coefficient concep0 with the energy balance equation. giving:
L~2 = 4 (D-Do) (3) s - 7 L
where D and D O are the wet-bulb depressions at reference level and at the surface respectively, and h is a windspeed-dependent heat-transfer coefficient, to be empiri- cally determined for each crop and site. (A suitable method is outlined in S and M~ appendix 7.)
Weekly and monthly values of E~ have been computed by this method with D o and G neglected, and h -- 0.5 (1 - u) mW/cm 2 ~'C witll u in m/sec (cf. S and M, section 3-11). The monthly values set out in Table I earlier were arrived at by direct insertion in the equation of monthly average data, also shown in Table I. The values used for s/(s + 7) were those corresponding to mean Tw. A similar procedure was employed for weekly values. The excellent correlation between E~2 and Eg, both weekly and monthly, can be seen from Fig.4 and 5B. It is almost as good as that of E W and Eg, and certainly better than for any other of the quantities tested. Furthermore. departures from the line Eg ~ E~2 are also small.
Table III shows the average ratio E~z/Eg, calculated for ten daily periods in summer :and autumn (.mostly clear, although some partly cloudy), and using various sampling
Agr. Meteoro/., 1 (1964) 201-.224

GRASS, WATER AND SOIL EVAPORATION AT ASPENDALE 219
T A B L E I I I
COMPARISON OF MEASURED EVAPORATION, Eg, AND EVAPORATION COMPUTED BY THE COMBINATION METHOD, Ec2
Sampling procedure employed
Ratio 1 Ec,,/Eg
Mean Standard Coefficient value error of variation
(1) Ec2, 24 hour totals; daytime and nighttime totals com- puted separately from average values of variables. 0.97 0.09 0.28
(2) Daytime only; total Ecz computed directly from daytime average values of variables. 0.97 0.06 0.19
(3) Daytime only; sum of hourly values of Ec2, each com- puted from hourly averages of variables. 0.98 0.02 0.07
1 Ec2 computed daily, for 10 typical summer and autumn days, from equation 3 with Do neglected, and G measured by flux plate or estimated during the day as 15 3/o of R; Eg from weighed lysimeter data.
procedures. The agreement here depends on the procedure employed. Equation 3 evidently tends to break down at night (in procedure I), both in practice because of the small size of some of the quantities involved, and in principle because of incor- rectness under inversion conditions of the windspeed function used for h. In the best case, however, where hourly computations are summed, for daytime only (proce- dure 3), the scatter is lower than 10%; while in all cases the mean ratio is very close to unity. Unfortunately the same cannot be said of the corresponding calculations for winter days, where both the mean ratio and the scatter appear to increase appreciably.
By way of comparison the rather more complicated calculations for Penman's well- known potential evaporation formula (PENMAN, 1948) were also carried out (by proce- dure 3 and using measured rather than estimated net radiation, but for the five sum- mer days only), giving a mean ratio E (Penman)/Eg of 0.84 ± 0.12. A similarly low mean value was found for monthly ratios also. This arises mainly from the inadequacy of a fixed windspeed coefficient such as then used by Penman 1, for coping with surfaces whose transfer properties differ from those for which tile coefficient was originally derived.
Penman's coefficient was originally determined from English water tank data, so that it should not be surprising that his unmodified formula appears to fit E w better than Eg. However, even here a slightly better fit for monthly E w was found using equation 3 with G - - D O = 0 and h 0.3 (1 t_u) mW/cm 2 °C, with u in m/sec. Although a seasonal cycle is apparent in each case, it is not large enough to warrant applying corrections.
It is of interest to note that Penman's windspeed coefficient (for a water tank), derived in a humid English climate, is still valid in much drier Australian conditions. This is perhaps yet another indication that when the immediate surroundings are kept adequately moist (to a radius of some tens of metres, depending on the degree of con-
In later publications (e.g., PENMAN, 1961) adjustment to take account of surface roughness is advocated.
A~r. Meteorol., 1 (1964)201-224

220 I . C . McILROY AND D. E. ANGUS
trast at the boundary), then a lysimeter or tank measurement is less influenced by the nearby environment (i.e., just outside the moist area) than by the general or large scale fetch (see also PRUITT, 1960).
As an additional comparison the short-term data taken for the energy balance measurement described in the previous sub-section were used to evaluate/z'~2 for the same periods. The mean ratio Ec2/Eg for all 25 runs was found to be 1.16 -T 0.05. with a coefficient of variation of 0.20. For the nine runs on two days of particularly steady conditions, the corresponding figures became 1.04 ~-0.05, and 0.15. The superior performance of equation 3 under these circumstances, by comparison with equation 1, may merely reflect the different effective height of working in the two cases. For an air layer from ground up to reference height, transfer coefficients such as h (equation 3) ~, are less liable to advective or convective distortion than those appl i- cable to an above-ground air layer, such as are implicit in the energy balance approach of equation 1 (cf. S and M, section 3-9).
Clearly no simple windspeed function for h can be expected to take adequate account of the effects of strong local convection or advection. Nevertheless any large- scale oasis effect is absorbed in equation 3 by the term h (D - Do)/L, provided properly measured on-site data are combined with a relevant value of h, determined empirica!ly for the particular crop and the locality concerned.
It is interesting to note that calculated monthly results very nearly as good as those in Table I are obtainable using total run-of-wind, uncorrected for length of month. Together with the suitability of simple averages of screen observations to find D, this made the calculation extremely easy. On the other hand, with weekly and even more with daily or shorter periods, a definite failure in the performance of equation 3 result- ed from the use of inferior data, e.g., from a thermohygrograph or screen thermom- eter in place of a fully-ventilated psychrometer used over the site itself.
C O M P A R I S O N W I T H A M E R I C A N M E A S U R E M E N T S
In Fig.6 the average annual cycle of Eg at Aspendale is compared with those reported from Davis by PRUITT (1960) and from other American lysimeter stations by VA~, BAVEL (1961). The curves are seen to be very similar in shape, although the amplitude is appreciably higher at Aspendale and Davis. This is particularly noticeable because of the remarkable consistency of four independent sets of data from the other stations.
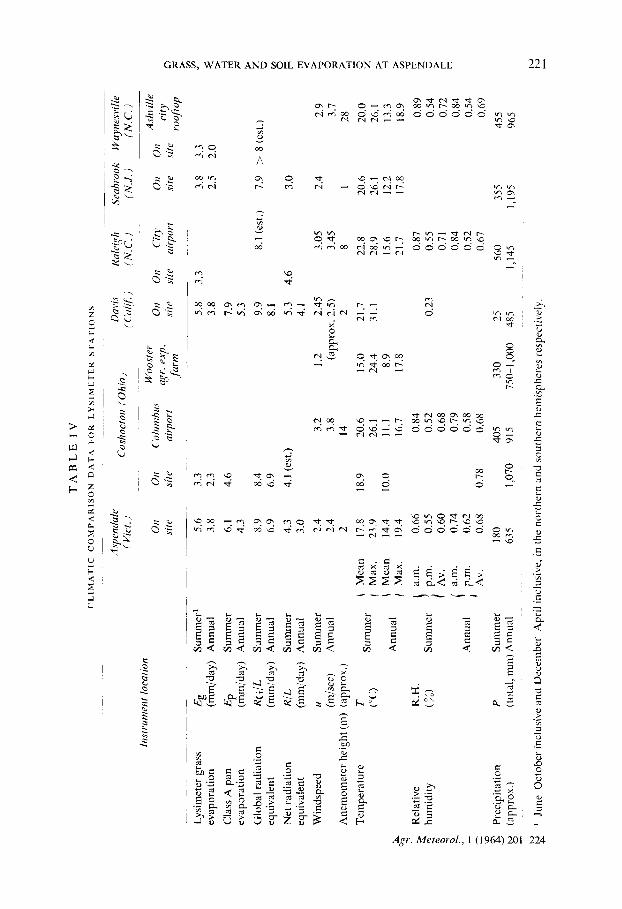
Table IV compares Aspendale data (taken from Table I) with the rather scanty figures available from the other sites (or from the nearest suitable weather stations where on-site measurements were not taken). The one climatic difference which stands out is in rainfall, with the implication that Davis and Aspendale 2, being in drier
1 The constants actually used in h had been derived independently from earlier data (S and M. section 3.12).
Rainfall tends to increase somewhat to the northeast of Aspendale, and fall offto the west and south, but district rainfalls generally behave in much the same way as those given, for Aspendale itself.
Agr. Meteorol., I (1964) 201-224
I I',a
4~
Inst
rum
ent
loca
tion
Lys
imet
er g
rass
ev
apor
atio
n
Cla
ss A
pan
Eg
S
umm
er1
ram
/day
) A
nnua
l
Ep
Sum
mer
(m
m/d
ay)
Ann
ual
RG
/L
Sum
mer
(r
am/d
ay)
Ann
ual
R/ L
S
umm
er
(mm
/day
) A
nnua
l
u S
umm
er
(m/s
ec)
Ann
ual
(app
rox.
)
T
Sum
mer
C
c)
Ann
ual
R.H
. (%
) S
umm
er
TA
BL
E
IV
f'L
IMA
TIC
C
OM
PA
RIS
ON
D
AT
A
FO
R
LY
S1
ME
TE
R
ST
AT
ION
S
Asp
enda
le
Dav
is
( V
ict
) C
osho
cton
(O
hio)
(C
al(f
.)
Wo
ost
er
On
On
Col
umbu
s O
n O
n ~(
gr. e
xp.
site
si
te
airp
ort
farm
si
te
site
5.6
3.3
5.8
3.3
3.8
2.3
3.8
6.1
4.6
7.9
4.3
5.3
8.9
8.4
9.9
6.9
6.9
8.1
4.3
4.1
(est
.)
5.3
3.0
4.1
2.4
3.2
1.2
2.45
2.
4 3.
8 (a
ppro
x. 2
.5)
2 14
2
17.8
18
.9
20.6
15
.0
21.7
23
.9
26.1
24
.4
31.1
14
.4
I0.0
11
.1
8.9
19.4
16
.7
17.8
0.66
0.
84
0.55
0.
52
0.60
0.
68
0.74
0.
79
0.62
0.
58
0.68
0.
78
0.68
180
405
635
1,07
0 91
5
evap
orat
ion
Glo
bal
radi
atio
n eq
uiva
lent
Net
rad
iati
on
equi
vale
nt
Win
dspe
ed
Ane
mom
eter
hei
ght (
m)
Tem
pera
ture
Rel
ativ
e hu
mid
ity
Pre
cipi
tati
on
(app
rox.
)
Ann
ual
P S
umm
er
(tot
al,
ram
) A
nnua
l
Mea
n I
Max
. !
Mea
n M
ax.
I a.
m.
p.m
. A
v.
i a.
m.
p.m
.
Av.
0.23
330
750
1,00
0
Ral
eigh
Se
abro
ok
Way
nesv
ille
(S
.C.)
(N
.J.)
(N
.C.)
Ash
vill
e C
ity
On
On
city
ah
'por
t si
te
site
ro
ofto
p
3.8
3.3
2.5
2.0
25
485
June
Oct
ober
inc
lusi
ve a
nd D
ecem
ber
Apr
il i
nclu
sive
, in
the
nor
ther
n an
d so
uthe
rn h
emis
pher
es r
espe
ctiv
ely.
4.6
8.1
(est
.)
7.9
> 8
(cst
.)
3.0
3.05
2.
4 2.
9 3.
45
3.7
8 1
28
22.8
20
.6
20.0
28
.9
26.1
26
.1
15.6
12
.2
13.3
21
.7
17.8
18
.9
0.87
0.
89
0.55
0.
54
0.71
0.
72
0.84
0.
84
0.52
0.
54
0.67
0.
69
56O
35
5 45
5 1,
145
1,19
5 96
5
> > --1
t--'
< > ©
7~
> ..q
> ,-]
Z >

222 1. C. McILROY AND D. E. ANGUS
regions, would experience stronger large-scale oasis effects than the other stations. Little significant difference can be found between stations in radiation, temperature
or humidity, except possibly for Seabrook, which has rather a low summer net radia- tion, Coshocton which has rather high humidities, and Davis with high net radiation and low humidity. However, on-site R.H. figures for the heavier rainfall stations would undoubtedly be higher than those cited in lieu, taken from Columbus, Raleigh and AshviUe respectively. Allowing for differences in observing times and heights, and known site characteristics, in summer at least there can be little doubt that wet-bulb depressions at 1 m height would be larger at Davis and Aspendale than over the other lysimeters concerned. In addition, allowing again for height of measurement, and the unusual summer day-night wind regime at Davis, all the American stations except Seabrook appear to have lower effective windspeeds than Aspendale.
Month (Australia]
d A S 0 N D d F M A M 8 [ , , , , ,,, , j , , , , , ,
7 = Aspendole ,<'~ - | - - x - - Ceshocton / ' / N,l"
6 k - - -A- - -Dav ,s ~ J ",~, g" / _ _ , _ _ Role,g h ~ ' ~ ' "
. . . . . Se00,oo< / 4 , " \ ' '
x 3 r 2 y .
. , . 7
0 I 1 I I I I I I d F M A M d A S 0 N O
Month ( U S A )
Fig.6. Monthly potential evaporation from various lysimeter stations.
Taken in conjunction with equation 3, the above factors could largely explain the relationship between the various evaporation rates. Further contributions would arise from differences in roughness between the grasses employed, and from differ- ences in the strength of local advection at the sites themselves, which are not revealed by the very limited data available.
On the other hand, the ratio of grass to pan evaporation is highest at Aspendale. whereas that of pan evaporation to net radiation is the same at Aspendale as at Davis. and does not differ appreciably from that to be expected from the above reasoning ai Coshocton, the only other site where a pan was operated. It therefore appears that differences in irrigation practice may also enter. Only at Aspendale does it seem certain that the watering rate was always adequate to achieve true potential evapora tion.
Agr. Meteorol., I (1964) 201-224

GRASS, WATER AND SOIL EVAPORATION AT ASPENDALE 223
C O N C L U S I O N S
It was shown that under conditions similar to those at Aspendale long-term evapora- tion from a moderate area of uniform well-watered grass can exceed that from a small free-water surface (by 20 G annually, and as much as 50 ~ for individual months); and that each process needs more energy than is available locally through net radiation (20 ~ more annually and up to 100 ~ more over a month, in the case of grass). The main reasons advanced were in the first case the relative roughness and level of the two surfaces concerned, and in the second, the magnitude at Aspendale (and undoubt- edly at many other places, particularly around the coastal fringes of Australia) of large-scale subsidence and/or advection from relatively dry inland areas of the con- tinent. Small-scale or local effects were seen to play only a minor role, even in dry weather and with an irrigated area of little more than an acre.
It was then shown that under Aspendale conditions grass evaporation, as measured by accurate lysimeters and over periods of a week or more, can be closely approxi- mated by simpler devices, such as correlation with water tanks, or radiometers, or suitable formulae combining standard meteorological quantities. The latter, in partic- ular, showed some promise even down to hourly values.
To what extent these findings can be extended to other crops, soils, or climatic con- ditions, or to less intense irrigation, can be determined only by further experiment. However, the present results are sufficiently encouraging to warrant an immediate extension of such investigations, with a number of crops ~,t a number of places.
These need the best available equipment and teclmiques for the calibrations required, which must be carried out on the spot and under a sufficient range of conditions to determine any dependence of coefficients on season, soil moisture content, growth stage of crop, etc.
In the last section apparent regional differences in potential evaporation were dis- cussed, arising out of a comparison with lysimeter measurements in the U.S.A. Lack of adequate weather data from most sites prevented a completely satisfactory explana- tion being found, although it appeared that insufficient watering might sometimes contribute, along with actual climatic differences.
In this connection it is clearly desirable that suitable ancillary measurements be taken, and where potential evaporation is concerned that standard minimum watering practices be adopted, at all existing lysimeter stations. The time also appears ripe for the setting up of many more such stations, e.g., at key points throughout the major agricultural regions, particularly where irrigation is common.
A C K N O W L E D G E M E N T S
The installation and operation of the lysimeters and much of the ancillary equipment was carried out by Messrs. D. J. Beardsmore and E. W. Walton, who were also respon- sible for working up most of the raw data. A number of special measurements were made by Mrs. H. S. Goodman, who also did much of the computation.
Agr. Meteorol., 1 (1964) 201-224

224 I .C. McILROY AND D. E. ANGUS
REFERENCES
MCILROY, I. C., 1958. A lysimeter installation at Aspendale. U.N.E.S.C.O. AridZone Res., 11 : 45-47. MCILROY, I. C., 1960. Lecture notes, Cairo, regional course in microclimatology. U.N.E.S.C.O.,
Mimeo, 28 pp. MCILROY, I. C. and ANGUS, D. E., 1963. The Aspendale multiple weighed lysimeter installation.
C.S.I.R.O. Div. Meteorol. Phys. Tech. Paper, 14 : 27 pp. MCILROV, I. C. and SUMNER, C. J., 1961. A sensitive high capacity balance for continuous automatic
weighing in the field. J. Agr. Eng. Res., 6 : 252-258. PENMAN, H'. L., 1948. Natural evaporation from open water, bare soil and grass. Proc. Roy. Sac.
(London), Set. A, 193 : 120-145. PENMAN, H. L., 1961. Weather, plant and soil factors in hydrology. Weather, 16 : 207-219. PRIESTLEY, C. H. B., 1959. Turbulent Tran,~fer in the Lower Atmosphere. Univ. of Chicago Pres.~.
Chicago, 197 pp. PRUn'T, W. O., 1960. Correlation of climatological data with water requirements of crops. Dept . , /
Irrigation, Univ. of Calif., Ann. Rept., 1959-1960 : 91 pp. SLATVER, R. O. and MCILROV, I. C., 1961. Practical Mieroelimatology. C.S.I.R.O., Melbourne, 310 pp. VAN BAVEL, C. H. M., 1961. Lysimetric measurements of evapotranspiration rates in the eastern
United States. Soil Sci. Sac. Am. Proe., 25 : 138-141.
Agr. Meteorol., 1 (1964) 201-224