graphs in data structure
TRANSCRIPT

Lecture: Graphs Data Structures
Graphs

Lecture: Graphs Data Structures
Graph Definitions• A graph G is denoted by G = (V, E) where
– V is the set of vertices or nodes of the graph
– E is the set of edges or arcs connecting the vertices in V
• Each edge E is denoted as a pair (v,w) where v,w V
For example in the graph below
1
2
5
6 4
3
V = {1, 2, 3, 4, 5, 6}E = {(1, 2) (2, 5) (3, 6) (4, 6) (5, 6)}• This is an example of an unordered
or undirected graph

Lecture: Graphs Data Structures
Graph Definitions (contd.)• If the pair of vertices is ordered then the
graph is a directed graph or a di-graph
1
2
5
6 4
3 Here, V = {1, 2, 3, 4, 5, 6}E = {(1, 2) (2, 5) (5, 6) (6, 3) (6, 4)}
• Vertex v is adjacent to w iff (v,w) E• Sometimes an edge has another component called a weight or
cost. If the weight is absent it is assumed to be 1

Lecture: Graphs Data Structures
Graph Definitions: Path• A path is a sequence of vertices w1, w2, w3, ....wn
such that (wi, wi+1) E
• Length of a path = # edges in the path
• A loop is an edge from a vertex onto itself. It is denoted by (v, v)
• A simple path is a path where no vertices are repeated along the path
• A cycle is a path with at least one edge such that the first and last vertices are the same, i.e. w1 = wn
Lecture: Graphs Data Structures
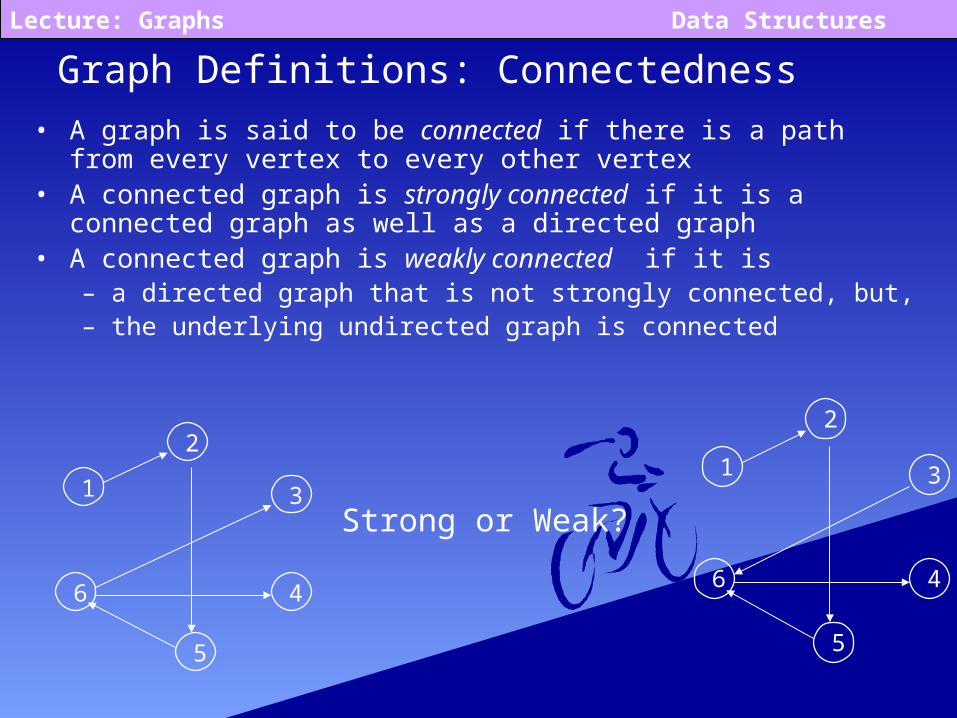
Graph Definitions: Connectedness
• A graph is said to be connected if there is a path from every vertex to every other vertex
• A connected graph is strongly connected if it is a connected graph as well as a directed graph
• A connected graph is weakly connected if it is – a directed graph that is not strongly connected, but,– the underlying undirected graph is connected
1
2
5
6 4
31
2
5
6 4
3
Strong or Weak?

Lecture: Graphs Data Structures
Applications of Graphs• Driving Map
– Edge = Road– Vertex = Intersection – Edge weight = Time required to cover the road
• Airline Traffic– Vertex = Cities serviced by the airline– Edge = Flight exists between two cities– Edge weight = Flight time or flight cost or both
• Computer networks– Vertex = Server nodes– Edge = Data link– Edge weight = Connection speed
• CAD/VLSI

Lecture: Graphs Data Structures
Representing Graphs: Adjacency Matrix • Adjacency Matrix
– Two dimensional matrix of size n x n where n is the number of vertices in the graph
– a[i, j] = 0 if there is no edge between vertices i and j
– a[i, j] = 1 if there is an edge between vertices i and j
– Undirected graphs have both a[i, j] and a[j, i] = 1 if there is an edge between vertices i and j
– a[i, j] = weight for weighted graphs• Space requirement is (N2)• Problem: The array is very sparsely populated. For example if a
directed graph has 4 vertices and 3 edges, the adjacency matrix has 16 cells only 3 of which are 1

Lecture: Graphs Data Structures
Representing Graphs: Adjacency List
• Adjacency List– Array of lists– Each vertex has an array entry– A vertex w is inserted in the list for vertex v if
there is an outgoing edge from v to w– Space requirement = (E+V)– Sometimes, a hash-table of lists is used to
implement the adjacency list when the vertices are identified by a name (string) instead of an integer

Lecture: Graphs Data Structures
Adjacency List Example
1
2
5
6 4
31
2
3
4
5
6
2
5
6
43
Graph Adjacency List
• An adjacency list for a weighted graph should contain two elements in the list nodes – one element for the vertex and the second element for the weight of that edge

Lecture: Graphs Data Structures
Negative Cost Cycle
• A negative cost cycle is a cycle such that the sum of the costs of the edges is negative
• The more we cycle through a negative cost cycle, the lower the cost of the cycle becomes
2
3
4
4 2
-12
Cost of the path v1-v5
• No traversal of cycle: 6 • One traversal of cycle: 0• Two traversals of cycle: -6• Three traversals of cycle: -12...
5
1
5
1
• Negative cost cycles are not allowed when we traverse a graph to find the weighted shortest path

Lecture: Graphs Data StructuresApplication of Graphs Using a model to solve a complicated traffic light Using a model to solve a complicated traffic light problemproblem
• GIVEN: A complex intersection.
• OBJECTIVE: Traffic light with minimum phases.
• SOLUTION:
• Identify permitted turns, going straight is a “turn”.
• Make group of permitted turns.
• Make the smallest possible number of groups.
• Assign each phase of the traffic light to a group.

Lecture: Graphs Data Structures
Using a model to solve a complicated traffic Using a model to solve a complicated traffic light problemlight problem
AB
C
D
E
An intersection
Lecture: Graphs Data Structures
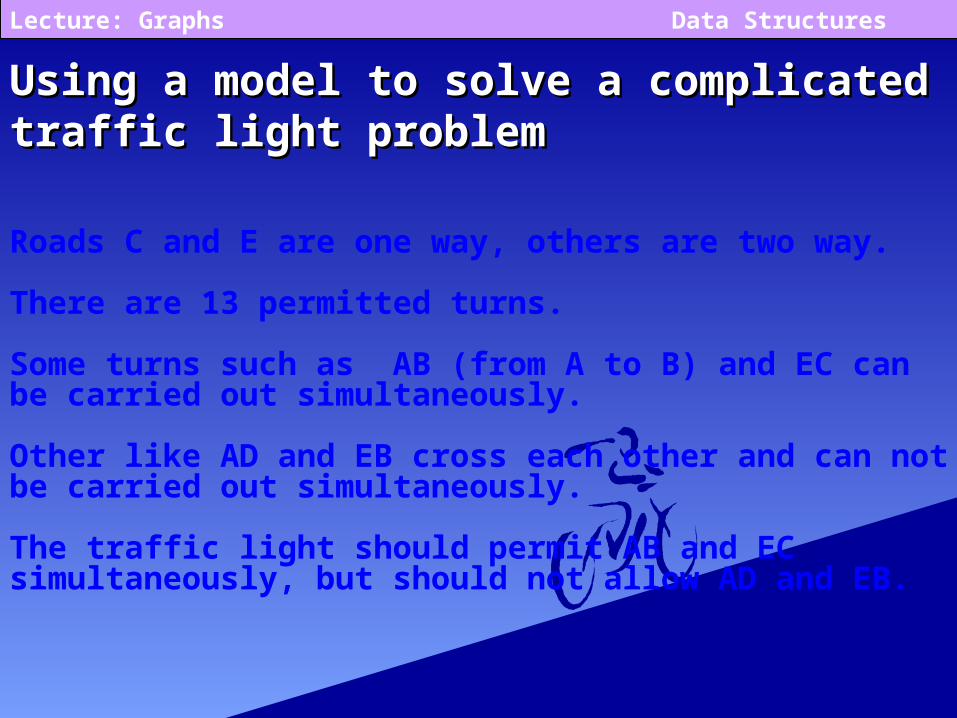
Using a model to solve a complicated traffic Using a model to solve a complicated traffic light problemlight problem
Roads C and E are one way, others are two way.
There are 13 permitted turns.
Some turns such as AB (from A to B) and EC can be carried out simultaneously.
Other like AD and EB cross each other and can not be carried out simultaneously.
The traffic light should permit AB and EC simultaneously, but should not allow AD and EB.

Lecture: Graphs Data Structures
Using a model to solve a complicated traffic Using a model to solve a complicated traffic light problemlight problem
AB
C
D
E
An intersection
AB & AC
AD & EB

Lecture: Graphs Data Structures
Using a model to solve a complicated traffic Using a model to solve a complicated traffic light problemlight problem
SOLUTION:
• We model the problem using a structure called graph G(V,E).
• A graph consists of a set of points called vertices, and lines connecting the points, called edges.
•Drawing a graph such that the vertices represent turns.
• Edges between those turns that can NOT be performed simultaneously.

Lecture: Graphs Data Structures
Using a model to solve a complicated traffic Using a model to solve a complicated traffic light problemlight problem
AB
C
D
E
An intersection
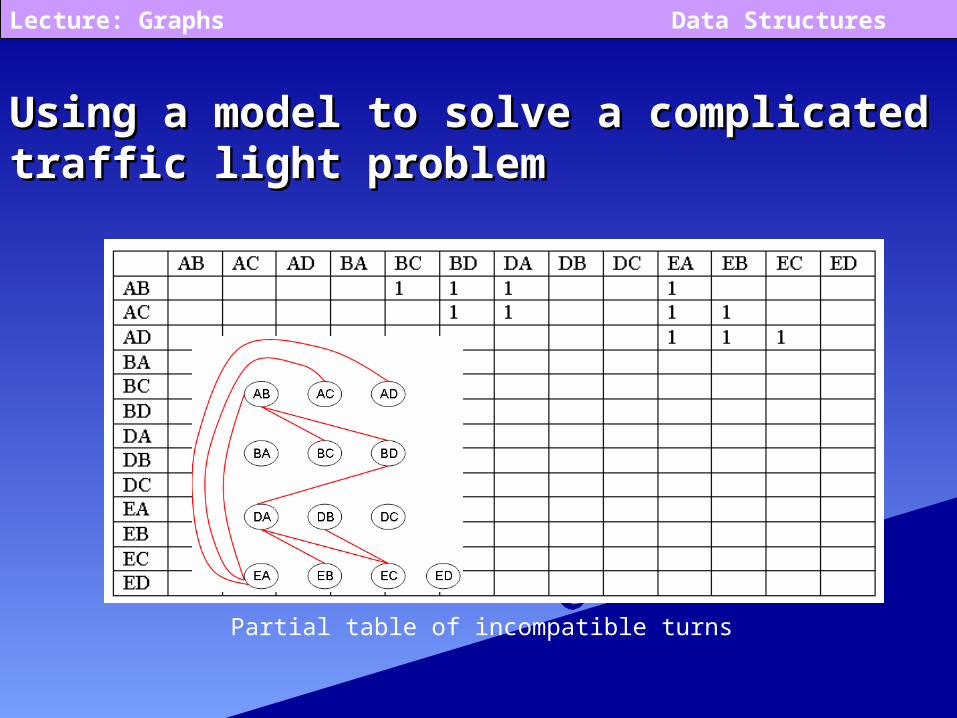
AB AC AD
BA BC BD
DA DB DC
EA EB EC ED
Partial graph of incompatible turns
Lecture: Graphs Data Structures
Partial table of incompatible turns
Using a model to solve a complicated traffic Using a model to solve a complicated traffic light problemlight problem

Lecture: Graphs Data Structures
Using a model to solve a complicated traffic Using a model to solve a complicated traffic light problemlight problem
SOLUTION:
The graph can aid in solving our problem.
A coloring of a graph is an assignment of a color to each vertex of the graph, so that no two vertices connected by an edge have the same color.
Our problem is of coloring the graph of incompatible turns using as few colors as possible.

Lecture: Graphs Data Structures
Using a model to solve a complicated traffic Using a model to solve a complicated traffic light problemlight problem
More on SOLUTION (Graph coloring):
The problem has been studied for decades.
The theory of algorithms tells us a lot about it.
Unfortunately this belongs to a class of problems called as NP-Complete problems.
For such problems, all known solutions are basically “try all possibilities”
In case of coloring, try all assignments of colors.
Lecture: Graphs Data Structures
Using a model to solve a complicated traffic Using a model to solve a complicated traffic light problemlight problem
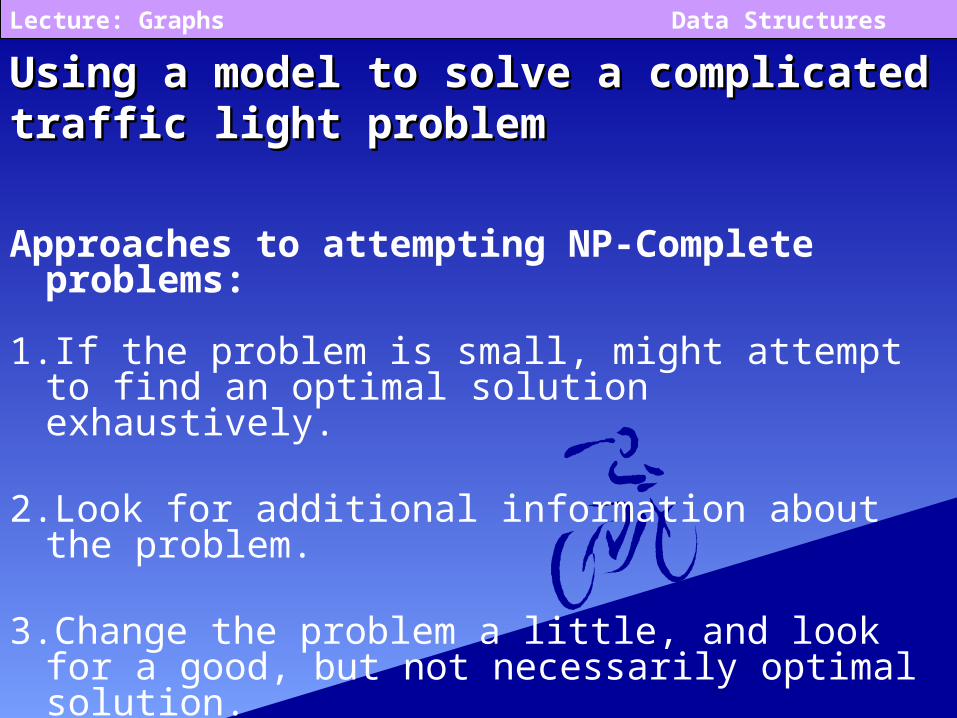
Approaches to attempting NP-Complete problems:
1. If the problem is small, might attempt to find an optimal solution exhaustively.
2.Look for additional information about the problem.
3.Change the problem a little, and look for a good, but not necessarily optimal solution.
An algorithm that quickly produces good but not necessarily optimal solutions is called a heuristic.
Lecture: Graphs Data Structures
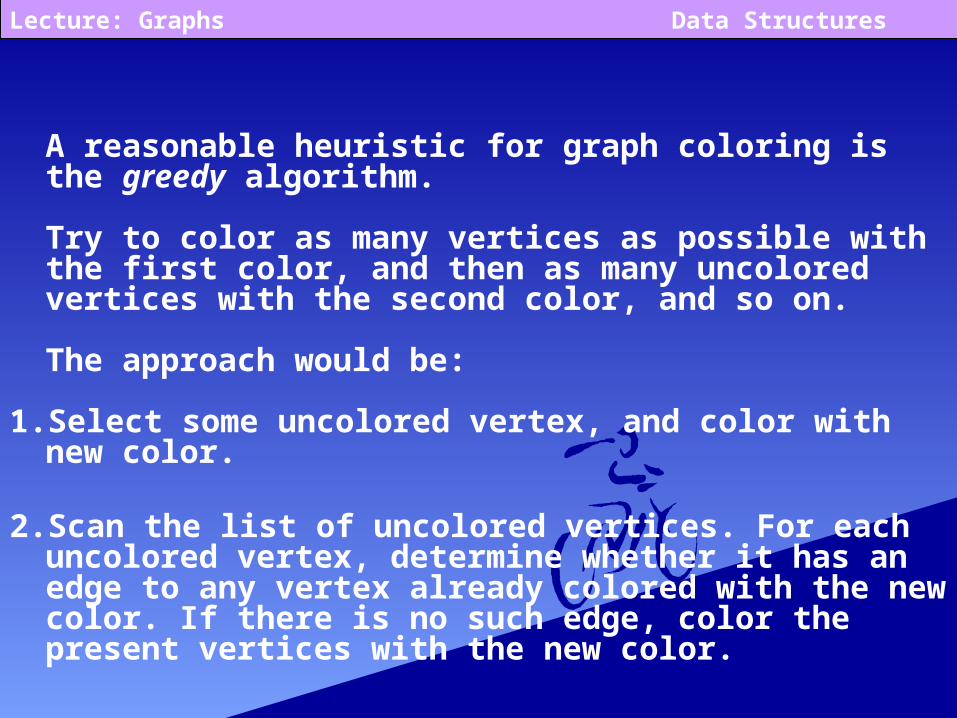
A reasonable heuristic for graph coloring is the greedy algorithm.
Try to color as many vertices as possible with the first color, and then as many uncolored vertices with the second color, and so on.
The approach would be:
1. Select some uncolored vertex, and color with new color.
2. Scan the list of uncolored vertices. For each uncolored vertex, determine whether it has an edge to any vertex already colored with the new color. If there is no such edge, color the present vertices with the new color.

Lecture: Graphs Data Structures
This is called “greedy”, because it colors a vertex, whenever it can, without considering potential drawbacks.
1 5
3
4
21 2
3
4
5
1 5
3
1
3
5 2
4