graphical analysis of linear motion -...
TRANSCRIPT

Graphical Analysis of Linear
MotionMotion

Part 1 – Linear Motion

Part 1 – Linear Motion

Part 2 – Constant Velocity
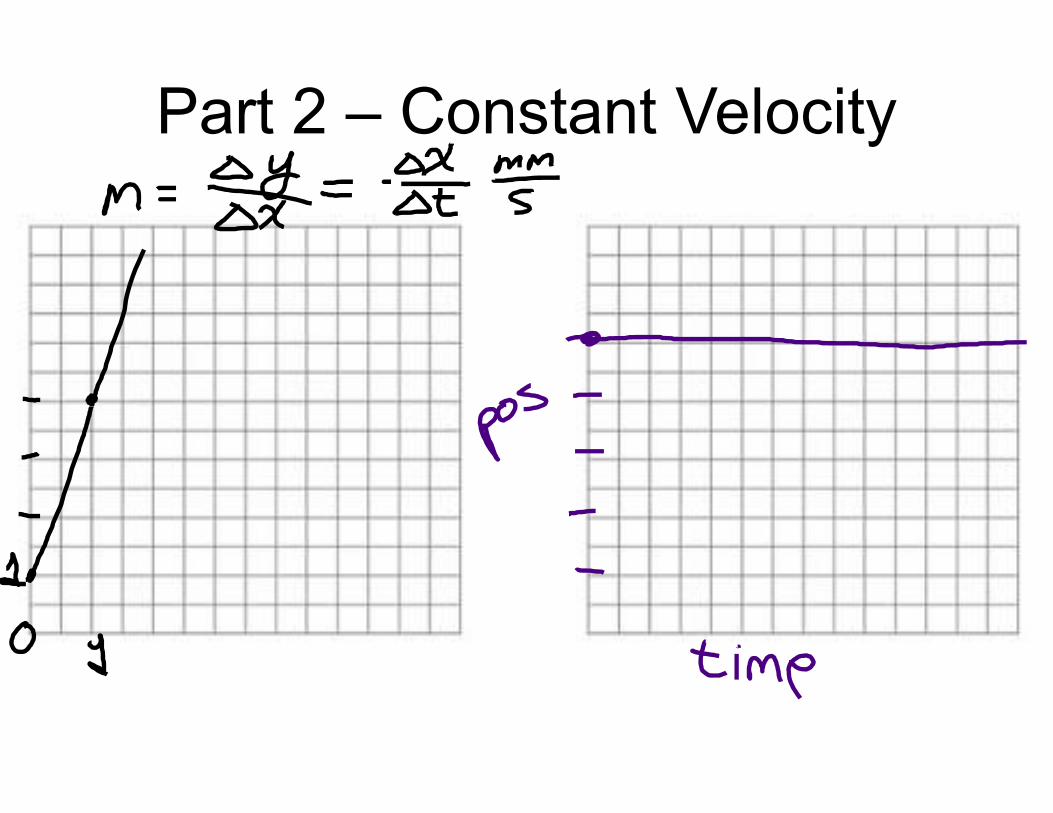
Part 2 – Constant Velocity

Part 3 – Constant Acceleration

Part 3 – Constant Acceleration

2-8 Graphical Analysis of Linear Motion
This is a graph of x vs. t for an object
moving with constant velocity. The velocity
is the slope of the x-t curve.

2-8 Graphical Analysis of Linear Motion
On the left we have a graph of velocity vs. time for an object with varying
velocity; on the right we have the resulting x vs. t curve. The instantaneous
velocity is tangent to the curve at each point.

2-8 Graphical Analysis of Linear Motion
The displacement, x, is the area
beneath the v vs. t curve.

Reading Data from a Graph
Po
sitio
n (
m)
12,000
8000
10,000
Po
sitio
n (
m)
Time (s)
200 400 600 800 12001000
2000
4000
6000
8000

Reading Data from a Graph
Ve
locity (
m/s
)
200
250
300
Ve
locity (
m/s
)
Time (s)
200 400 600 800 12001000
50
100
150
200

Instantaneous Velocity
The graph shows the height versus time of an
object. Estimate the instantaneous velocity, in m/s,
of the object at time t = 15 min.

Position vs. Time
An object is moving along the x axis. The graph shows its
position from the starting point as a function of time.
Various segments of the graph are identified by the letters
A, B, C, and D.

Position vs. Time
During which interval(s) is the object moving in the negative
x direction?

Position vs. Time
What is the velocity of the object at t = 7.0 s?

Position vs. Time
What is the acceleration of the object at t = 7.0 s?

Position vs. Time 2
An object is moving along a straight line. The
graph shows the object’s position from the starting
point as a function of time.

Position vs. Time 2
In which segment(s) of the graph does the object’s
average velocity (measured from t = 0 s) decrease
with time?

Position vs. Time 2
What was the instantaneous velocity of the object
at t = 4 s?

Position vs. Time 2
In which segments(s) of the graph does the object
have the highest speed?

Position vs. Time 2
At which time(s) does the object reverse its
direction of motion?

Velocity vs. Time
An object is moving along a straight line.
The graph shows the object’s velocity as a
function of time.

Velocity vs. Time
During which interval(s) of the graph does
the object travel equal distances in equal
times?

Velocity vs. Time
During which interval(s) of the graph does
the speed of the object increase by equal
amounts in equal times?

Velocity vs. Time
How far does the object move in the interval
from t = 0 to t = 2 s?

Velocity vs. Time
What is the acceleration of the object in the
interval from t = 5 s to t = 6 s?