graphene nanoelectrodes: fabrication and size-dependent
TRANSCRIPT
www.spm.co
m.cn
Graphene Nanoelectrodes: Fabrication and Size-DependentElectrochemistryBo Zhang, Lixin Fan, Huawei Zhong, Yuwen Liu, and Shengli Chen*
Key Laboratory of Analytical Chemistry for Biology and Medicine (Ministry of Education), Hubei Key Laboratory of ElectrochemicalPower Sources, Department of Chemistry, Wuhan University, Wuhan, People’s Republic of China
*S Supporting Information
ABSTRACT: The fabrication and electrochemistry of a new class of grapheneelectrodes are presented. Through high-temperature annealing of hydrazine-reducedgraphene oxides followed by high-speed centrifugation and size-selected ultra-filtration, flakes of reduced graphene oxides (r-GOs) of nanometer andsubmicrometer dimensions, respectively, are obtained and separated from the largerones. Using n-dodecanethiol-modified Au ultramicroelectrodes of appropriately smallsizes, quick dipping in dilute suspensions of these small r-GOs allows attachment ofonly a single flake on the thiol monolayer. The electrodes thus fabricated are used tostudy the heterogeneous electron transfer (ET) kinetics at r-GOs and the nanoscopiccharge transport dynamics at electrochemical interfaces. The r-GOs are found toexhibit similarly high activity for electrochemical ET reactions to metal electrodes. Voltammetric analysis for the relatively slowET reaction of Fe(CN)6
3− reduction produces slightly higher ET rate constants at r-GOs of nanometer sizes than at large ones.These ET kinetic features are in accordance with the defect-dominant nature of the r-GOs and the increased defect density in thenanometer-sized flakes as revealed by Raman spectroscopic measurements. The voltammetric enhancement and inhibition forthe reduction of Ru(NH3)6
3+ and Fe(CN)63−, respectively, at r-GO flakes of submicrometer and nanometer dimensions upon
removal of supporting electrolyte are found to significantly deviate in magnitude from those predicted by the electroneutrality-based electromigration theory, which may evidence the increased penetration of the diffuse double layer into the mass transportlayer at nanoscopic electrochemical interfaces.
1. INTRODUCTION
As the newest member in the carbon family, graphenes areattracting increasing research interest. Electrochemistry is aparticular area in which graphenes have both fundamental andapplied significance.1 On one hand, various novel carbons arealways among the electrochemical focuses due to their uniquesurface chemistry and electronic structures.2,3 Besides, thepromise of graphenes in constructing high performanceelectrodes for ultracapacitors,4 fuel cells,5 and batteries6
requires knowledge of their charge storage and transferproperties.Chemical-vapor-deposition (CVD) is most capable of
producing large area single/few layer of graphenes.7 Thefabrication of CVD graphene electrodes, however, mostlyinvolves cumbersome sheet transfer and photolithographicprocesses,8,9 which not only limit the widespread studies ofgraphene electrochemistry, but could also result in electrodecontamination and even damage.10 Reduced graphene oxides(r-GOs), which can be generated more facilely and scalably,11
represent another common form of graphenes and are mostwidely used in various electrochemical energy technologies.4,5c,6
Currently, r-GO-based electrodes, in either fundamental orapplied studies, are mostly prepared as relatively thick films onconducting substrates through drop casting,12 adsorption withself-assembled-monolayer (SAM),13 in situ electrochemicalreduction, and other methods.14 The involvement of r-GO
sheets of diverse shapes and dimensions and the uncontrolledporosity and accessibility of the electroactive surface areas inthe films make the measurements of intrinsic electrochemicalproperties of graphenes difficult.In this study, we introduce a type of graphene electrode in
which a single r-GO sheet is immobilized on alkylthiol-modifiedAu electrodes. Our strategy is to separate r-GOs into flakes ofdifferent size ranges and use SAM-modified Au ultra-microelectrodes (UME) of appropriately small sizes assubstrates to attach flakes of certain size ranges in dilutesuspensions, which can effectively reduce the possibility ofmultiflake immobilization.The SAMs in most cases form a compact and rigid film,15
which can therefore block the electron transfer (ET) of Au withredox molecules attached on its end or in solution due to thelong distance effect.16 However, efficient electron tunneling cantake place between Au and the immobilized conductingmaterials, such as metal nanoparticles, carbon nanotubes, andgraphenes,13,17 mainly because they have much higher densityof states than the redox molecules. An excellent analysis on thiscan be found in recent literature by Chazalviel et al.17a Thus,the voltammetric responses of the present r-GO electrodes
Received: March 8, 2013Published: June 14, 2013
Article
pubs.acs.org/JACS
© 2013 American Chemical Society 10073 dx.doi.org/10.1021/ja402456b | J. Am. Chem. Soc. 2013, 135, 10073−10080
www.spm.co
m.cn
would be predominantly determined by the interfacial electro-chemical processes at the immobilized single r-GO flakes.In addition to providing a way to study the intrinsic
electrochemistry of individual r-GO sheets, the presentapproach also offers a straightforward alternative to fabricateplanar carbon electrodes of submicrometer and nanometerdimensions, which are appreciated due to their capability ofprobing fast heterogeneous ET kinetics18,19 and nanoscopiccharge transport dynamics.20−24 Currently, such small electro-des are usually fabricated by shielding thinned metal/carbonwires with glasses18c,d,19 or polymers,18a,b,25 which could lead toelectrode recession and insulation defects.19c,21a,b,26
2. EXPERIMENTAL SECTIONChemicals, apparatus, and measurement details are given in theSupporting Information (SI, sections 1 and 2).2.1. Preparation of r-GOs. The GOs were prepared according to
the modified Hummers method5c,27 (SI, section 3). The r-GOs wereprepared by using a combined chemical and thermal reduction ofGOs.28,29 Briefly, the r-GO sample was first dispersed in doublydistilled water to give a colloidal solution, into which the hydrazinehydrate was added. The resulting mixture was kept at 80 °C for 12 hunder ultrasonication and was then centrifuged and washed withdeionized water repeatedly. After being thoroughly rinsed, thechemically reduced GO product was annealed at 900 °C under Argas for ca. 30 min, which is believed to be able to reduce theoxygenated functional groups that cannot be effectively reduced byhydrazine and to repair some defects.29
2.2. Preparation of Size-Selected r-GO Suspensions. Toprepare size-selected r-GO suspensions, the r-GO sample obtainedfrom thermal annealing was subjected to a size fractionation processinvolving high-speed centrifugation and successive ultrafiltration(Scheme 1). First, 10 mg r-GOs were dispersed in 100 mL DMF
and vigorously disrupted under ultrasound for 15 min. The dispersionwas then subjected to high-speed centrifugation under 16 600 rpm for3 min, which resulted in sedimentation of roughly 80 wt % of theoriginal sample and transformation of the dispersion color from blackinto faint black. The upper supernatant, which should contain single-and few-layer r-GO flakes of relatively small sizes, was then collectedand filtered successively by using ultrafiltration membranes of 800,450, and 220 nm pore sizes, respectively. The retained solid in eachfiltration was dispersed in 100 mL DMF to form a nearly colorlessdispersion, which was further diluted by spreading 1 mL dispersioninto 100 mL DMF. In result, four types of dilute r-GO suspensions,containing mainly r-GO flakes of <220 nm (I), 220−450 nm (II),450−800 nm (III), and >800 nm (IV), respectively, were obtained.These suspensions were allowed to stand for a period of time to form asupernatant liquor for fabricating graphene electrodes.2.3. Fabrication of Graphene Electrodes. The general strategy
for electrode fabrication is depicted in Scheme 1. It was started withAu disk electrodes of micrometer and/or submicrometer dimensionsprepared by laser-assisted pulling of annealed Au wires of 20 μmdiameters in borosilicate capillaries (Drummond, 1.0-mm o.d., 0.2-mmi.d.) under vacuum with the help of a Sutter P-2000/G pipet
puller.19,30 The exposure of Au disks were controlled by carefullypolishing with 0.05 μm alumina powders and monitored with thevoltammetry for the reduction of 10 mM Ru(NH3)6
3+ in 1 M KCl.Only Au electrodes larger than 0.5 μm in diameter were used infollowing steps to reduce the risk of electrode recession.
SAM-modified Au (Au/SAM) electrodes were formed by soakingAu disk electrodes in C12H25SH solution for at least 48 h at roomtemperature. Prior to use, the bare Au electrodes were ultrasonicatedin ethanol and ultrapure water, respectively, for 3 min and thencleaned in Piranha solution (30% H2O2/concentrated H2SO4, 1:3 v/v). They were electrochemically polished by consecutive potentialcycling between −0.40 and 0.9 V (Hg/Hg2SO4) at 0.05 V/s in 0.5 MH2SO4 until a characteristic cyclic voltammogram of a clean Au surfacewas obtained.
Immobilization of r-GO flakes was achieved by quick dipping ofAu/SAM electrodes in r-GO suspensions described above. After rinsedwith ultrapure water, the electrode was moved into an electrochemicalcell containing a solution of 10 mM Ru(NH3)6
3+ in 1 M KCl to checkwhether the electrode gave a reduction wave not seen on the Au/SAMelectrode. If not, further quick dipping was performed until theattachment of an r-GO flake. The electrodes thus prepared aredenoted as graphene electrodes in the following.
3. RESULTS AND DISCUSSION3.1. Electrode Fabrication and Characterization. Figure
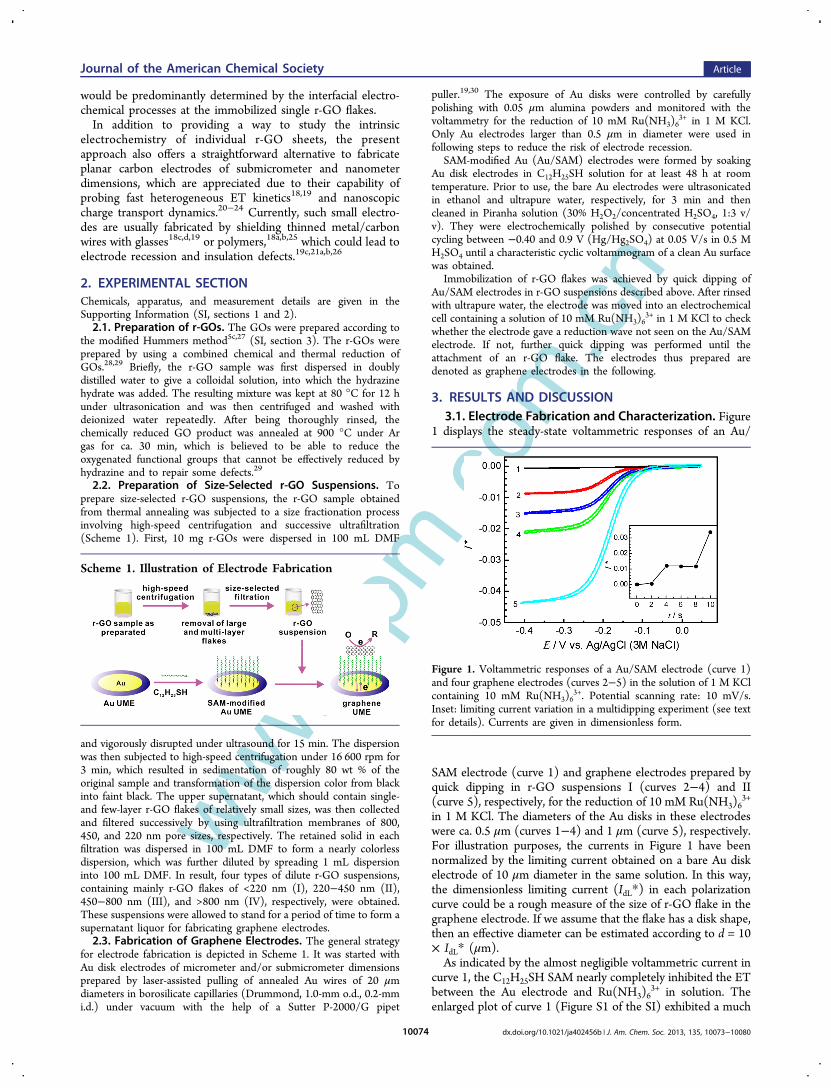
1 displays the steady-state voltammetric responses of an Au/
SAM electrode (curve 1) and graphene electrodes prepared byquick dipping in r-GO suspensions I (curves 2−4) and II(curve 5), respectively, for the reduction of 10 mM Ru(NH3)6
3+
in 1 M KCl. The diameters of the Au disks in these electrodeswere ca. 0.5 μm (curves 1−4) and 1 μm (curve 5), respectively.For illustration purposes, the currents in Figure 1 have beennormalized by the limiting current obtained on a bare Au diskelectrode of 10 μm diameter in the same solution. In this way,the dimensionless limiting current (IdL*) in each polarizationcurve could be a rough measure of the size of r-GO flake in thegraphene electrode. If we assume that the flake has a disk shape,then an effective diameter can be estimated according to d = 10× IdL* (μm).As indicated by the almost negligible voltammetric current in
curve 1, the C12H25SH SAM nearly completely inhibited the ETbetween the Au electrode and Ru(NH3)6
3+ in solution. Theenlarged plot of curve 1 (Figure S1 of the SI) exhibited a much
Scheme 1. Illustration of Electrode Fabrication
Figure 1. Voltammetric responses of a Au/SAM electrode (curve 1)and four graphene electrodes (curves 2−5) in the solution of 1 M KClcontaining 10 mM Ru(NH3)6
3+. Potential scanning rate: 10 mV/s.Inset: limiting current variation in a multidipping experiment (see textfor details). Currents are given in dimensionless form.
Journal of the American Chemical Society Article
dx.doi.org/10.1021/ja402456b | J. Am. Chem. Soc. 2013, 135, 10073−1008010074

www.spm.co
m.cn
lagged variation of current with potential, which furthersuggested a strong inhibition of the ET kinetics by SAM.We also ran blank experiments by immersing Au/SAM
electrodes in DMF without r-GOs for a few hours. The as-treated Au/SAM electrodes gave almost identical responses tothe untreated ones. Thus, the voltammetric responses in curves2−5 should be due to the reduction of Ru(NH3)6
3+ at theattached r-GO flakes, rather than through pinholes in SAMsformed during dipping experiments. It is known that theformation of alkanethiol SAMs usually undergoes a crystal-lization step and leads to a compact and rigid structure due tothe strong Au−S bonding interaction and the strong hydro-phobic interaction among the long alkyl chains. The SAM isable to keep its integrity unless under extreme conditions, suchas very positive potentials or high temperatures.15
To ensure that only a single r-GO flake is attached on eachprepared electrode, we mainly used Au disk electrodes ofsubmicrometer diameter (<1 μm) to attach r-GO flakes insuspension I, and that 1−2 μm in diameters to attach r-GOflakes in suspensions II and III. In addition, the concentrationsof the r-GO suspensions were controlled to be very dilute (seesection 2.2) and the dipping times of Au/SAM electrodes in thesuspensions were controlled to be very short (typically less than5 s).Under such conditions, the attachment of an r-GO flake was
found to be somewhat random in nature. In most cases, severaltimes of dipping were required for successfully attaching an r-GO flake. The inset of Figure 1 shows the variation of thelimiting current given by an Au/SAM electrode of ∼0.8 μmdiameter in a multidipping experiment using suspension I, withthe dipping and voltammetric measurement performedalternatively. In this experiment, the attachment of the first r-GO flake occurred in the second dipping. Upon further threetimes of dipping, the second r-GO flake was attached. Unlessstated otherwise, graphene electrodes described in the followingrefer to those only the first attachment of r-GO flake was seen.The random nature of the r-GO attachment was also
indicated by the varied limiting currents, which represented thesizes of the attached r-GO flakes, in different dipping in thesame suspension (Figure 1, curves 2−4). However, the effectivediameters of the r-GO flakes estimated from IdL* roughly fellinto the size range for each suspension. This indicated that ther-GOs were effectively separated into different size ranges in thesize-selected filtration process, and that in most cases, only asingle r-GO was attached in each dipping. AFM images of r-GOflakes from different suspensions (Figure 2) also indicated thattheir sizes were approximately within the expected ranges.Due to the fact that the surface roughness of Au substrates
was beyond the thicknesses of the SAMs and the attached r-GOflakes, and that the SAM could respond elastically to AFM tips,it was difficult to image r-GO flakes on Au/SAM electrodes.AFM images obtained on cleaved mica surfaces through dropcasting of the dilute suspensions showed that the prepared r-GO flakes were considerably diverse and irregular in shape(Figure 2a−c). In general, the larger flakes looked more round,and the smaller ones were more flat. Interestingly, the smallestflakes in suspension I were found to be predominantly shapedin short ribbons of low aspect ratios (Figure 2a), which was alsoindicated by the TEM images (Figure S2 of the SI). Thelengths and widths of these small r-GOs were typically 130−180 nm and 40−90 nm, respectively. It seems that very small r-GO flakes derived from high temperature annealing tend tohave narrow flat geommetries.31
The AFM topographic heights of the r-GO flakes on micasurfaces were mostly in the range of 1−3 nm (Figures S3 andS4 of the SI), which can be ascribed to single- and/or few-layerr-GO sheets when considering the intrinsic wrinkles of r-GOsand the adsorption of solvent molecules on them.32 Due to thefact that the r-GOs could undergo restacking in the course ofdrop-casting due to the hydrophobic interaction, and that themica surface is very different from SAMs in roughness andcharge, the AFM geometric information obtained on a micasurface might not represent the real layer numbers and theexact shapes of the r-GO flakes in suspensions and onelectrodes. By employing very dilute suspensions and quickdipping procedures, we expect that the aggregation andrestacking could be greatly inhibited in the prepared electrodes.In addition to r-GO flakes, some dot-like structures were also
observed in the AFM images, which should be the assemblies ofsolvent molecules since they also appeared on mica surface afterdrop casting of r-GO free DMF (Figure S5 of the SI). Similardot structures were also seen in AFM images of graphenes byothers.33 By purposely choosing small sampling areas, thesestructures can be excluded when imaging the small r-GO flakes(Figure 2a).
3.2. Heterogeneous ET Kinetics at r-GO Flakes. Theheterogeneous ET kinetics at graphene-based materials is notonly intrinsic to their electrochemical applications, but is alsofundamentally important in understanding the relation betweenET kinetics and the electronic structures of electrodematerials.8a,34−36 We used Ru(NH3)6
3+ and Fe(CN)63−, two
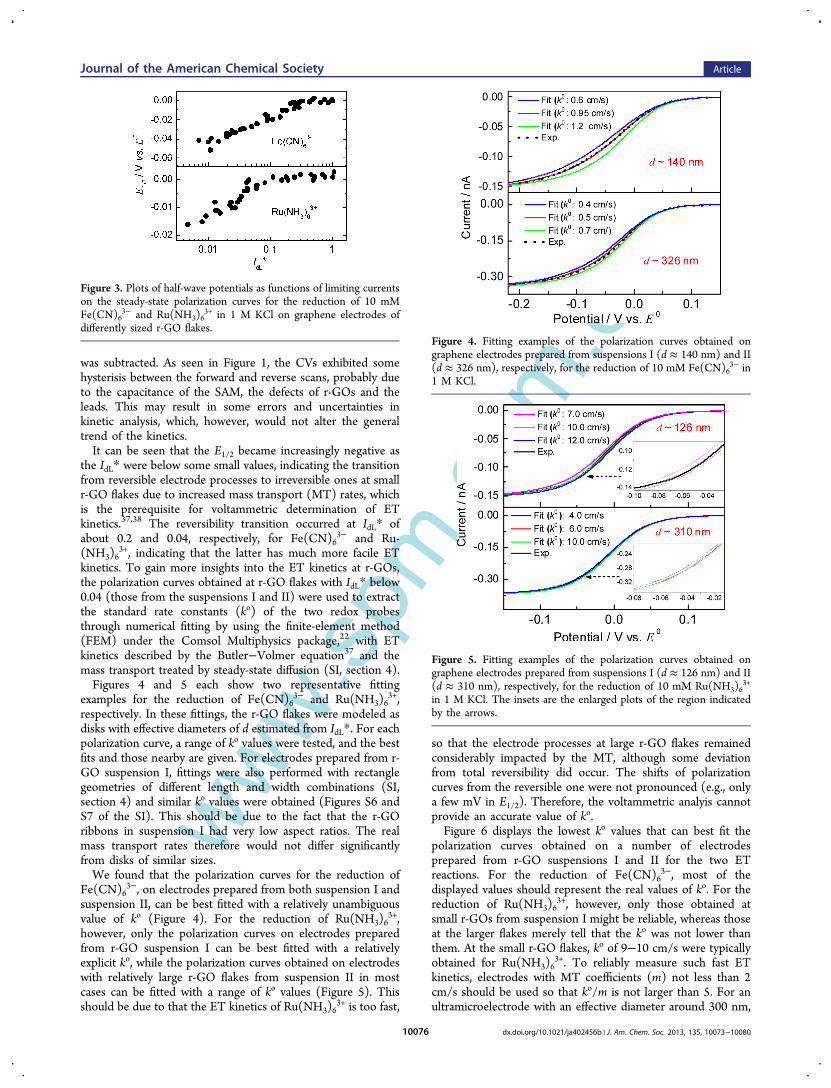
commonly used redox probes with relatively fast and slow ETkinetics, respectively, to probe the heterogeneous ET kinetics atr-GOs.Figure 3 shows the variation of the half-wave potentials
(E1/2) as functions of IdL* on the steady-state polarizationcurves for the reduction of the two redox probes on r-GO flakesof various sizes. The E1/2 was given with respect to thatobtained on the 10 μm Au electrode, at which the two reactionswere nearly reversible and therefore the half-wave potentialscan be approximately considered the formal potentials (E0).37,38
It should be mentioned that we used the negative goingbranches in the cyclic voltammograms (CVs) obtained under apotential scanning rate of 10 mV/s as the polarization curvesfor kinetic analysis, with the double layer charging background
Figure 2. Representative AFM images of r-GO flakes in suspensions(a) I, (b) II, and (c) III obtained under a tapping mode of 1024 ×1024 pixel resolution on mica surfaces.
Journal of the American Chemical Society Article
dx.doi.org/10.1021/ja402456b | J. Am. Chem. Soc. 2013, 135, 10073−1008010075
www.spm.co
m.cnwas subtracted. As seen in Figure 1, the CVs exhibited somehysterisis between the forward and reverse scans, probably dueto the capacitance of the SAM, the defects of r-GOs and theleads. This may result in some errors and uncertainties inkinetic analysis, which, however, would not alter the generaltrend of the kinetics.It can be seen that the E1/2 became increasingly negative as
the IdL* were below some small values, indicating the transitionfrom reversible electrode processes to irreversible ones at smallr-GO flakes due to increased mass transport (MT) rates, whichis the prerequisite for voltammetric determination of ETkinetics.37,38 The reversibility transition occurred at IdL* ofabout 0.2 and 0.04, respectively, for Fe(CN)6
3− and Ru-(NH3)6
3+, indicating that the latter has much more facile ETkinetics. To gain more insights into the ET kinetics at r-GOs,the polarization curves obtained at r-GO flakes with IdL* below0.04 (those from the suspensions I and II) were used to extractthe standard rate constants (ko) of the two redox probesthrough numerical fitting by using the finite-element method(FEM) under the Comsol Multiphysics package,22 with ETkinetics described by the Butler−Volmer equation37 and themass transport treated by steady-state diffusion (SI, section 4).Figures 4 and 5 each show two representative fitting
examples for the reduction of Fe(CN)63− and Ru(NH3)6
3+,respectively. In these fittings, the r-GO flakes were modeled asdisks with effective diameters of d estimated from IdL*. For eachpolarization curve, a range of ko values were tested, and the bestfits and those nearby are given. For electrodes prepared from r-GO suspension I, fittings were also performed with rectanglegeometries of different length and width combinations (SI,section 4) and similar ko values were obtained (Figures S6 andS7 of the SI). This should be due to the fact that the r-GOribbons in suspension I had very low aspect ratios. The realmass transport rates therefore would not differ significantlyfrom disks of similar sizes.We found that the polarization curves for the reduction of
Fe(CN)63−, on electrodes prepared from both suspension I and
suspension II, can be best fitted with a relatively unambiguousvalue of ko (Figure 4). For the reduction of Ru(NH3)6
3+,however, only the polarization curves on electrodes preparedfrom r-GO suspension I can be best fitted with a relativelyexplicit ko, while the polarization curves obtained on electrodeswith relatively large r-GO flakes from suspension II in mostcases can be fitted with a range of ko values (Figure 5). Thisshould be due to that the ET kinetics of Ru(NH3)6
3+ is too fast,
so that the electrode processes at large r-GO flakes remainedconsiderably impacted by the MT, although some deviationfrom total reversibility did occur. The shifts of polarizationcurves from the reversible one were not pronounced (e.g., onlya few mV in E1/2). Therefore, the voltammetric analyis cannotprovide an accurate value of ko.Figure 6 displays the lowest ko values that can best fit the
polarization curves obtained on a number of electrodesprepared from r-GO suspensions I and II for the two ETreactions. For the reduction of Fe(CN)6
3−, most of thedisplayed values should represent the real values of ko. For thereduction of Ru(NH3)6
3+, however, only those obtained atsmall r-GOs from suspension I might be reliable, whereas thoseat the larger flakes merely tell that the ko was not lower thanthem. At the small r-GO flakes, ko of 9−10 cm/s were typicallyobtained for Ru(NH3)6
3+. To reliably measure such fast ETkinetics, electrodes with MT coefficients (m) not less than 2cm/s should be used so that ko/m is not larger than 5. For anultramicroelectrode with an effective diameter around 300 nm,
Figure 3. Plots of half-wave potentials as functions of limiting currentson the steady-state polarization curves for the reduction of 10 mMFe(CN)6
3− and Ru(NH3)63+ in 1 M KCl on graphene electrodes of
differently sized r-GO flakes.Figure 4. Fitting examples of the polarization curves obtained ongraphene electrodes prepared from suspensions I (d ≈ 140 nm) and II(d ≈ 326 nm), respectively, for the reduction of 10 mM Fe(CN)6
3− in1 M KCl.
Figure 5. Fitting examples of the polarization curves obtained ongraphene electrodes prepared from suspensions I (d ≈ 126 nm) and II(d ≈ 310 nm), respectively, for the reduction of 10 mM Ru(NH3)6
3+
in 1 M KCl. The insets are the enlarged plots of the region indicatedby the arrows.
Journal of the American Chemical Society Article
dx.doi.org/10.1021/ja402456b | J. Am. Chem. Soc. 2013, 135, 10073−1008010076

www.spm.co
m.cn
however, the m should be around 1.0 cm/s (m = 2D/d, D ≈ 1× 10⁻⁵ cm2/s).An important question in the electrochemistry of graphene
and other sp2 carbons such as highly oriented pyrolytic graphite(HOPG) is the role of surface defects in their electrochemicalreactivity. Recent literature on graphene has shown that theedges and defects are more reactive than the basal plane.34
Similarly, numerous works have suggested that edge plane sitesand defects are the predominant origin of electrochemicalactivity of HOPG.35,36 The poor electrode kinetics on defect-free sp2 carbon surfaces has been believed to be due to theirlow local density of states (DOS) near the Fermi level.37,39 Thelatter can be significantly increased by introducing defects.40
The ko values for the reduction of Fe(CN)63− and
Ru(NH3)63+ obtained at the small r-GOs in present study
were very close to those obtained on metal nanoelectro-des,18b,19,41 and much higher than those reported for HOPGand graphenes.34−36 Raman spectra of these small r-GOsexhibited comparable intensities between D and G bands(Figure 7 and Figures S8 and S9 of the SI, where D peak at∼1352 cm−1 is a defect peak due to intervalley scattering and Gpeak at ∼1584 cm−1 is associated with the pristine sp2
domains). In addition, these r-GOs also exhibited S3 peaks at2900−2950 cm−1 (a second-order peak due to the D−G
combination) with higher intensity than the 2D peaks around2650 cm−1. These Raman features indicated that the preparedr-GOs were dominated with defects,42 which may beresponsible for their high activity for heterogeneous ETreactions. It is imaginable that small r-GOs should haveundergone severe oxidation, which would therefore bedominated with edges and other defects.As shown in Figures S8 and S9 of the SI (these spectra were
sampled under a lower laser power than that for Figure 7, seeSI, section 2.2), the Raman D/G intensity ratios, whichrepresent the ratios of defect sites at edges and boundaries overthat in sp2 domains, were generally higher for r-GOs fromsuspension I than those from suspension II, indicating anincrease in the defect density in smaller r-GO flakes.Accordingly, it is interesting to note from Figure 6 that theko values obtained for the reduction of Fe(CN)6
3− at the smallr-GOs from suspension I (typically in the range of 0.7−1.0 cm/s) are slightly larger than those obtained on the large r-GOs(around 0.6 cm/s). This seemingly implied that theheterogonous ET kinetics at graphene-based materials is indeedcorrelated with the defect density. It is worth mentioning thatan earlier study by Unwin et al.18b using Pt nanoelectrodes alsoshowed an apparent size effect in ET kinetics for theFe(CN)6
3−/Fe(CN)64− couple. A recent study by Unwin and
co-workers43 on HOPG surfaces has also suggested that thereare some factors associated with this redox couple which couldmake the voltammetric analysis complicated.
3.3. Diffuse Double Layer Effect on Nanosized r-GOs.Due to the fact that the size of an electrode dictates the domainof its electrochemical interface,37 reducing the electrode tonanometer dimensions would result in a significant extension ofthe diffuse electric double layer (EDL) on the entireinterface.20−24 This may raise pronounced EDL effects oninterfacial ET kinetics and MT dynamics, for example, makingthe electroneutrality-based treatment of electrochemical MTand the Frumkin treatment of the diffuse EDL effect37 on ETkinetics break down. Depending on the concentration of thebackground electrolyte, the thickness of the diffuse EDL variesfrom a few angstroms to several hundreds of nanometers.37
Therefore, the electroneutrality-based mass transport maybreak down at electrodes of a few nanometers when thesolution is strongly supported by a background electrolyte,22
while it could occur at electrodes up to hundreds of nanometersin dilute solutions of redox probes without supportingelectrolyte.20,21,24 On this basis, the graphene electrodesobtained from r-GO suspensions I and II can be used to verifythe applicability of the electroneutrality-based MT in non-supported solution.By investigating the steady-state voltammetric responses of
graphene electrodes of different sizes for the reduction ofRu(NH3)6
3+ and Fe(CN)63− in the presence and absence of 1
M KCl (Figures S10 and S11 of the SI), we summarize inFigure 8 the ratios between the limiting currents in the absenceand presence of the supporting electrolyte (IL/IdL), as afunction of IdL*. The values of IL/IdL quantitatively describe theinfluence of the supporting electrolyte on the limiting transportrates of the electroactive species. By assuming an electro-neutrality-based diffusion and electromigration of the electro-active species and ignoring the diffuse EDL effect, Amatore etal.44 have derived a theoretical formula for IL/IdL (eq 1).
Figure 6. The lowest values of ko for the reduction of Ru(NH3)63+ and
Fe(CN)63− provided by the voltammetric fittings on r-GO of various
sizes.
Figure 7. A representative Raman spectrum of r-GO flakes fromsuspension I.
Journal of the American Chemical Society Article
dx.doi.org/10.1021/ja402456b | J. Am. Chem. Soc. 2013, 135, 10073−1008010077

www.spm.co
m.cn
= ± + + | | −
−+ | | −
⎜ ⎟
⎪
⎪
⎧⎨⎩⎛⎝
⎞⎠
⎡⎣⎢
⎤⎦⎥⎫⎬⎭
ii
z zzn
z z n
1 1 (1 ) 1
ln 11
(1 )(1 / )
L
dL
(1)
In eq 1, the sign (±) is positive for n < z and negative for n >z. According to this equation, the value of IL/IdL depends onlyon the charge of the reactant (z) and the electron transfernumber in the electrode reaction (n, positive for reduction andnegative for oxidation), and is independent of electrodedimension. The validation of eq 1 has been justified bymicroelectrode studies of a range of redox probes, includingthose studied here.44,45
It can be seen from Figure 8 that the removal of thesupporting electrolyte led to enhanced and inhibited limitingcurrents, respectively, for the reduction of cation (Ru(NH3)6
3+)and anion (Fe(CN)6
3−). At electrodes of relatively large IdL*,the magnitudes of the enhancement or the inhibition were allaround 10% and nearly invariant with IdL*, which agreedreasonably with the prediction of eq 1 (the dotted lines),indicating that the diffuse EDL had insignificant influence onthe mass transport of the studied redox probes at the large r-GO flakes.As IdL* was below some small values, the IL/IdL started to
depart from the relatively constant values seen at large r-GOs.The departure occurred at an IdL* of ca. 0.03 and 0.2,respectively, for the reduction of Ru(NH3)6
3+ and Fe(CN)63−,
which corresponded to radii of about 150 nm and 1.0 μm,respectively, if considering the r-GOs as disks. With thedecrease in r-GO size, the magnitude of the departureincreased, manifesting the increased diffuse EDL effect at theelectrochemical interfaces of small r-GOs.The diffuse EDL effect seemed to be much more
pronounced for the reduction of Fe(CN)63−. Similar phenom-
ena were also observed previously on Pt and carbonmicroelectrodes,20a,45b,46 which has been attributed to theformation of a passivation layer through ferricyanide decom-position45b,46a and/or the diffuse EDL effect on the ETkinetics,46b i.e., the so-called Frumkin effect.37 As seen fromFigure S11 of the SI, the steady-state voltammetric responsesfor this probe severely lagged at small r-GO flakes in theabsence of supporting electrolyte. At r-GOs of nanometerdimensions, the voltammetric currents were nearly completely
inhibited upon removal of the supporting electrolyte, whichseemed to tell that there was indeed an increased inhibition ofthe ET kinetics as well as the MT dynamics due to the diffuseEDL at interfaces of smaller r-GOs. Since no well-definedlimiting currents were established for Fe(CN)6
3− reduction onvery small electrodes, only approximate values of IL/IdL wereobtained by using the current values at the lower potentiallimits. For the reduction of Ru(NH3)6
3+, the diffuse EDL effectswere only seen on the MT dynamics because that the ETkinetics are too facile so that the limiting transport occurs wellbefore the appearance of the kinetic effect of the diffuse EDL.
3.4. Further Discussions. It should be pointed out that thevalues of IdL* may only qualitatively distinguish the sizes ofdifferent r-GO flakes, due to their irregular and variedgeometries as seen from the AFM and TEM images. Forinstances, the short r-GO ribbons in suspension I could havediffering aspect ratios, and the flakes in suspensions II more orless deviate from ideal disk shapes. Besides, we have assumedthat the r-GO flakes would lay on the end surface of SAM dueto the hydrophobic interaction between the graphene surfaceand the end surface of SAM. We believe that in most cases thisshould be true. In some rare cases, however, other orientationof r-GOs such as intercalation into the SAM layer and/orstanding vertically on SAM surface may occur, especially for thesmallest flakes. These geometry and orientation complexitieswould complicate the relationship between the r-GO sizes(therefore the MT rates) and the dimensionless limitingcurrent IdL*.As discussed earlier, despite the irregularity and variation, the
shapes of the relatively large r-GO flakes in the present studyare mostly close to disk. Although the smaller flakes are morelike ribbons, they have very low aspect ratios. Therefore, themass transport rates at r-GOs in the present study should notdiffer significantly from disks of similar sizes, making the kineticanalysis reliable at least in qualitative trend.In the case that an r-GO flake may stand on and/or partially
intercalate into the SAM, the exposed surface areas would bedoubled. As a result, the electrode would give a much largerlimiting current than that expected by the geometric size of r-GO. In this case, the mass transport rate would beunderestimated when using the dimensionless limiting currentIdL*. This might be the reason for the considerable datascattering in the determined ko values at small r-GOs (Figure6). However, this should not prevent us from gaining aqualitative trend in the ko variation with the r-GO size.In the case that the r-GO is fully intercalated in the SAM, the
electron transfer and mass transport would be stronglyinhibited. In this case, no well-defined sigmoid voltammetricresponses would be obtained. In this study, we did not use suchvoltammetric responses for kinetic analysis.
4. CONCLUSIONSIn summary, high-temperature annealing followed by high-speed centrifugation and size-selected ultrafiltration has enabledus to separate r-GO flakes of submicrometer and nanometersizes from the large ones. These ultrasmall flakes can be used toconstruct nanometer and submicrometer graphene electrodesby using SAM-modified Au electrodes of appropriately smallsizes as supports to attach individual flakes in their dilutesuspensions. The fabricated graphene ultramicroelectrodes canbe used to study the fast heterogeneous ET kinetics at r-GOsand the nanoscopic charge transport dynamics at electro-chemical interfaces.
Figure 8. Ratios between the limiting currents for the reduction ofRu(NH3)6
3+ and Fe(CN)63− in the absence and presence of 1 M KCl
as a function of r-GO sizes (IdL*). The dotted lines are the ratioscalculated from eq 1.
Journal of the American Chemical Society Article
dx.doi.org/10.1021/ja402456b | J. Am. Chem. Soc. 2013, 135, 10073−1008010078

www.spm.co
m.cn
Numerical fittings of the voltammetric responses of thefabricated graphene electrodes with nanometer-sized r-GOflakes have shown that the ko values of Ru(NH3)6
3+ andFe(CN)6
3− could be as high as 9−10 cm/s and 0.7−1.0 cm/srespectively, which are similar to that observed at metalelectrodes but much higher than those reported at basal planesof HOPG and graphenes. The high electrochemical ET activityon these small r-GOs may be explained in terms of their defect-dominant nature, as revealed by the Raman spectroscopicresults. Furthermore, an accordant increase in the Raman defectdensity and ko with the decreased r-GO sizes has beenobserved, which seemingly further stresses the correlationbetween the ET activity and the defect density at carbonsurfaces.The voltammetric responses of the fabricated graphene
electrodes in the absence of supporting electrolyte showenhanced and inhibited limiting transport currents for thereduction of Ru(NH3)6
3+ and Fe(CN)63−, respectively, as
expected from the coupled electromigration−diffusion trans-port. As the tethered r-GO flakes are of submicrometer andnanometer dimensions, however, the enhancing and/orinhibiting magnitudes significantly deviate from that predictedby the mass transport equations based on electroneutralityassumption, which may evidence the increased penetration ofthe diffuse EDL into the mass transport layer at nanoscopicelectrochemical interfaces.
■ ASSOCIATED CONTENT*S Supporting InformationChemicals, apparatus, and measurements; preparation of GOs;and supporting figures. This material is available free of chargevia the Internet at http://pubs.acs.org.
■ AUTHOR INFORMATIONCorresponding [email protected] authors declare no competing financial interest.
■ ACKNOWLEDGMENTSThis work was supported by the Ministry of Science andTechnology of China under the National Basic ResearchProgram (2012CB932800 and 2012CB215500) and theNational Natural Science Foundation of China (21173162).
■ REFERENCES(1) Brownson, D. A. C.; Kampouris, D. K.; Banks, C. E. Chem. Soc.Rev. 2012, 41, 6944−6976.(2) (a) Chlistunoff, J.; Cliffel, D.; Bard, A. J. Thin Solid Films 1995,257, 166−184. (b) Birkett, P. R.; Taylor, R.; Wachter, N. K.; Carano,M.; Paolucci, F.; Roffia, S.; Zerbetto, F. J. Am. Chem. Soc. 2000, 122,4209−4212.(3) (a) Campbell, J. K.; Sun, L.; Crooks, R. M. J. Am. Chem. Soc.1999, 121, 3779−3780. (b) Heller, I.; Kong, J.; Heering, H. A.;Williams, K. A.; Lemay, S. G.; Dekker, C. Nano Lett. 2005, 5, 137−142. (c) Nugent, J. M.; Santhanam, K. S. V.; Rubio, A.; Ajayan, P. M.Nano Lett. 2001, 1, 87−91. (d) Wang, C.; Waje, M.; Wang, X.; Tang, J.M.; Haddon, R. C.; Yan, Y. Nano Lett. 2004, 4, 345−348.(4) (a) Zhu, Y. W.; Murali, S.; Stoller, M. D.; Ganesh, K. J.; Cai, W.;Ferreira, P. J.; Pirkle, A.; Wallace, R. M.; Cychosz, K. A.; Thommes,M.; Su, D.; Stach, E. A.; Ruoff, R. S. Science 2011, 332, 1537−1541.(b) Zhang, L. L.; Zhao, X.; Ji, H. X.; Stoller, M. D.; Lai, L. F.; Murali,S.; Mcdonnell, S.; Cleveger, B.; Wallacec, R. M.; Ruoff, R. S. EnergyEnviron. Sci. 2012, 5, 9618−9625. (c) Skinner, B.; Fogler, M. M.;
Shklovskii, B. I. Phys. Rev. B 2011, 84, 235133−235145. (d) Stoller, M.D.; Park, S. J.; Zhu, Y. W.; An, J. H.; Ruoff, R. S. Nano Lett. 2008, 8,3498−3502. (e) El-Kady, M. F.; Strong, V.; Dubin, S.; Kaner, R. B.Science 2012, 335, 1326−1330.(5) (a) Gong, K. P.; Du, F.; Xia, Z. H.; Dustock, M.; Dai, L. M.Science 2009, 323, 760−764. (b) Yu, D. S.; Nagelli, E.; Du, F.; Dai, L.M. J. Phys. Chem. Lett. 2010, 1, 2165−2173. (c) Zhang, S. M.; Zhang,H. Y.; Liu, Q.; Chen, S. L. J. Mater. Chem. A 2013, 1, 3302−3308.(d) Li, Y. G.; Zhou, W.; Wang, H. L.; Xie, L. M.; Liang, Y. Y.; Wei, F.;Idrobo, J. C.; Pennycook, S. J.; Dai, H. J. Nat. Nanotechnol. 2012, 7,394−400.(6) (a) Yoo, E. J.; Kim, J.; Hosono, E.; Zhou, H. S.; Kudo, T.;Honma, I. Nano Lett. 2008, 8, 2277−2282. (b) Zhou, G.; Wang, D.W.; Li, F.; Zhang, L.; Li, N.; Wu, Z. S.; Wen, L.; Lu, G. Q.; Cheng, H.M. Chem. Mater. 2010, 22, 5306−5313. (c) Wang, C.; Li, D.; Too, C.O.; Wallace, G. G. Chem. Mater. 2009, 21, 2604−2606.(7) (a) Geim, A. K. Science 2009, 19, 1530−1534. (b) Li, X.; Cai, W.;An, J.; Kim, S.; Nah, J.; Yang, D.; Piner, R.; Velamakanni, A.; Jung, I.;Tutuc, E.; Banerjee, S. K.; Colombo, L.; Ruoff, R. S. Science 2009, 5,1312−1314. (c) Bae, S.; Kim, H.; Lee, Y.; Xu, X.; Park, J. S.; Zheng, Y.;Balakrishnan, J.; Lei, T.; Kim, H.; Song, Y. I.; Kim, Y. J.; Kim, K. S.;Ozyilmaz, B.; Ahn, J. H.; Hong, B. H.; Iijima, S. Nat. Nanotechnol.2010, 5, 574−578.(8) (a) Guell, A. G.; Ebejer, N.; Snowden, M. E.; Macpherson, J. V.;Unwin, P. R. J. Am. Chem. Soc. 2012, 134, 7258−7261. (b) Xia, J.;Chen, F.; Li, J.; Tao, N. Nat. Nanotechnol. 2009, 4, 505−509.(c) Chen, F.; Qing, Q.; Xia, J.; Li, J.; Tao, N. J. Am. Chem. Soc. 2009,131, 9908−9909.(9) (a) Li, W. T. C.; Lowe, M. A.; Abruna, H. D.; Ralph, D. C. ACSNano 2011, 5, 2264−2270. (b) Rodriguez-Lopez, J.; Ritzert, N. L.;Mann, J. A.; Tan, C.; Dichtel, W. R.; Abruna, H. D. J. Am. Chem. Soc.2012, 134, 6224−6236.(10) (a) Li, X.; Zhu, Y.; Cai, W.; Borysiak, M.; Han, B.; Chen, D.;Piner, R. D.; Colombo, L.; Ruoff, R. S. Nano Lett. 2009, 9, 4359−4363.(b) Dudin, P. V.; Snowden, M. E.; Macpherson, J. V.; Unwin, P. R.ACS Nano 2011, 5, 10017−10025.(11) (a) Moon, I. K.; Lee, J.; Ruoff, R. S.; Lee, H. Nat. Commun.2010, 1, 73−78. (b) Dreyer, D. R.; Park, S. J.; Bielawski, C. W.; Ruoff,R. S. Chem. Soc. Rev. 2010, 39, 228−2401.(12) (a) Zhou, M.; Zhai, Y.; Dong, S. Anal. Chem. 2009, 81, 5603−5613. (b) Guo, S. J.; Dong, S. J. Chem. Soc. Rev. 2011, 40, 2644−2672.(c) Shan, C.; Yang, H.; Song, J.; Han, D.; Ivaska, A.; Niu, L. Anal.Chem. 2009, 81, 2378−2382.(13) (a) Yang, S.; Xu, B.; Zhang, J.; Huang, X.; Ye, J.; Yu, C. J. Phys.Chem. C 2010, 114, 4389−4393. (b) Xie, X.; Zhao, K.; Xu, X.; Zhao,W.; Liu, S.; Zhu, Z.; Li, M.; Shi, Z.; Shao, Y. J. Phys. Chem. C 2010,114, 14243−14250.(14) (a) Zhou, M.; Wang, Y.; Zhai, Y.; Zhai, J.; Ren, W.; Wang, F.;Dong, S. Chem.Eur. J. 2009, 15, 6116−6120. (b) Li, F.; Xue, M.;Ma, X.; Zhang, M.; Cao, T. Anal. Chem. 2011, 83, 6426−6430.(15) (a) Gooding, J. J.; Ciampi, S. Chem. Soc. Rev. 2011, 40, 2704−2718. (b) Ulman, A. Chem. Rev. 1996, 96, 1533−1554.(16) Liu, B.; Bard, A. J.; Mirkin, M. V.; Creager, S. E. J. Am. Chem.Soc. 2004, 126, 1485−1492.(17) (a) Chazalviel, J. N.; Allongue, P. J. Am. Chem. Soc. 2011, 133,762−764. (b) Su, L.; Gao, F.; Mao, L. Anal. Chem. 2006, 78, 2651−2657. (c) Diao, P.; Liu, Z. J. Phys. Chem. B 2005, 109, 20906−20913.(d) Kissling, G. P.; Milesa, D. O.; Fermın, D. J. Phys. Chem. Chem.Phys. 2011, 13, 21175−21185.(18) (a) Watkins, J. J.; Chen, J. Y.; White, H. S.; Abruna, H. D.;Maisonhaute, E.; Amatore, C. Anal. Chem. 2003, 75, 3962−3971.(b) Slevin, C. J.; Gray, N. J.; Macpherson, J. V.; Webb, M. A.; Unwin,P. R. Electrochem. Commun. 1999, 1, 282−288. (c) Penner, R. M.;Heben, M. J.; Longin, T. L.; Lewis, N. S. Science 1990, 250, 1118−1121. (d) Li, Y.; Bergman, D.; Zhang, B. Anal. Chem. 2009, 81, 5496−5502.(19) (a) Mirkin, M. V. Isr. J. Chem. 2010, 50, 291−305. (b) Sun, P.;Mirkin, M. V. Anal. Chem. 2006, 78, 6526−6534. (c) Mirkin, M. V.;Shao, Y. Anal. Chem. 1997, 69, 1627−1634.
Journal of the American Chemical Society Article
dx.doi.org/10.1021/ja402456b | J. Am. Chem. Soc. 2013, 135, 10073−1008010079

www.spm.co
m.cn
(20) (a) Norton, J. D.; White, H. S.; Feldberg, S. W. J. Phys. Chem.1990, 94, 6772−6780. (b) Watkins, J. J.; White, H. S. Langmuir 2004,20, 5474−5483. (c) White, H. S. Anal. Chem. 2002, 74, 4577−4582.(d) Conyers, J. L.; White, H. S. Anal. Chem. 2000, 72, 4441−4446.(e) Smith, C. P.; White, H. S. Anal. Chem. 1993, 65, 3343−3353.(21) (a) Chen, S. L.; Kucernak, A. J. Phys. Chem. B 2002, 106, 9396−9404. (b) Chen, S. L.; Kucernak, A. Electrochem. Commun. 2002, 4,80−85. (c) Liu, Y. W.; Zhang, Q. F.; Chen, S. L. Electrochim. Acta2010, 27, 8280−8286.(22) (a) He, R.; Chen, S. L.; Yang, F.; Wu, B. L. J. Phys. Chem. B2006, 110, 3262−3270. (b) Sun, Y.; Liu, Y. W.; Liang, Z. X.; Xiong, L.;Wang, A. L.; Chen, S. L. J. Phys. Chem. C 2009, 113, 9878−9883.(c) Liu, Y. W.; He, R.; Zhang, Q. F.; Chen, S. L. J. Phys. Chem. C 2010,114, 10812−10822.(23) (a) Batchelor-McAuley, C.; Dickinson, E. J. F.; Rees, N. V.;Toghill, K. E.; Compton, R. G. Anal. Chem. 2012, 84, 669−684.(b) Dickinson, E. J. F.; Compton, R. G. J. Phys. Chem. C 2009, 113,17585−17589. (c) Henstridge, M. C.; Dickinson, E. J. F.; Compton, R.G. Chem. Phys. Lett. 2010, 485, 167−170.(24) (a) Limon-Petersen, J. G.; Streeter, I.; Rees, N. V.; Compton, R.G. J. Phys. Chem. C 2009, 113, 333−337. (b) Streeter, I.; Compton, R.G. J. Phys. Chem. C 2008, 112, 13716−13728. (c) Limon-Petersen, J.G.; Streeter, I.; Rees, N. V.; Compton, R. G. J. Phys. Chem. C 2008,112, 17175−17182.(25) Sun, P.; Zhang, Z. Q.; Guo, J. D.; Shao, Y. H. Anal. Chem. 2001,73, 5346−5351.(26) Cox, J. T.; Zhang, B. Annu. Rev. Anal. Chem. 2012, 5, 253−272.(27) Hummers, W. S.; Offeman, R. E. J. Am. Chem. Soc. 1958, 80,1339−1339.(28) (a) Stankovich, S.; Dikin, D. A.; Piner, R. D.; Kohlhaas, K. A.;Kleinhammes, A.; Jia, Y.; Wu, Y.; Nguyen, S. T.; Ruoff, R. S. Carbon2007, 45, 1558−1565. (b) Tung, V. C.; Allen, M. J.; Yang, Y.; Kaner,R. B. Nat. Nanotechnol. 2009, 4, 25−29.(29) (a) Li, X. L.; Wang, H. L.; Robinson, J. T.; Sanchez, H.;Diankov, G.; Dai, H. J. J. Am. Chem. Soc. 2009, 131, 15939−15944.(b) Gao, W.; Alemany, L. B.; Ci, L. J.; Ajayan, P. M. Nat. Chem. 2009,1, 403−408. (c) Yang, D; V. A.; Bozoklu, G.; Park, S.; Stoller, M.;Piner, R. D.; Stankovich, S.; Jung, I.; Field, D. A.; Ventrice, C. A., Jr.;Ruoff, R. S. Carbon 2009, 47, 145−152.(30) Mezour, M. A.; Morin, M.; Mauzeroll, J. Anal. Chem. 2011, 83,2378−2382.(31) Li, X.; Wang, X.; Zhang, L.; Lee, S.; Dai, H. Science 2008, 319,1229−1232.(32) (a) Lotya, M.; Hernandez, Y.; King, P. J.; Smith, R. J.; Nicolosi,V.; Karlsson, L. S.; Blighe, F. M.; De, S.; Wang, Z.; McGovern, I. T.;Duesberg, G. S.; Coleman, J. N. J. Am. Chem. Soc. 2009, 131, 3611−3620. (b) Shin, K. Y.; Hong, J. Y.; Jang, J. Adv. Mater. 2011, 23, 2113−2118.(33) (a) He, C.; Li, Z.; Cai, M.; Cai, M.; Wang, J. Q.; Tian, Z.; Zhang,X.; Shen, P. K. J. Mater. Chem. A 2013, 1, 1401−1406. (b) Ragoussi,M. E.; Malig, J.; Katsukis, G.; Butz, B.; Spiecker, E.; de la Torre, G.;Torres, T.; Guldi, D. M. Angew. Chem., Int. Ed. 2012, 51, 6421−6425.(34) (a) Tan, C.; Rodríguez-Lopez, J.; Parks, J. J.; Ritzert, N. L.;Ralph, D. C.; Abruna, H. D. ACS Nano 2012, 6, 3070−3079.(b) Sharma, R.; Baik, J. H.; Perera, C. J.; Strano, M. S. Nano Lett. 2010,10, 398−405.(35) (a) Cline, K. K.; McDermott, M. T.; McCreery, R. L. J. Phys.Chem. 1994, 98, 5314−5319. (b) McCreery, R. L. Chem. Rev. 2008,108, 2646−2687. (c) McDermott, M. T.; Kneten, K.; McCreery, R. L.J. Phys. Chem. 1992, 96, 3124−3130.(36) (a) Banks, C. E.; Moore, R. R.; Davies, T. J.; Compton, R. G.Chem. Commun. 2004, 1804−1805. (b) Davies, T. J.; Hyde, M. E.;Compton, R. G. Angew. Chem. 2005, 44, 5121−5126. (c) Hyde, M. E.;Davies, T. J.; Compton, R. G. Angew. Chem., Int. Ed. 2005, 44, 6491−6496. (d) Ji, X. B.; Buzzeo, M. C.; Banks, C. E.; Compton, R. G.Electroanalysis 2006, 18, 44−52. (e) Banks, C. E.; Davies, T. J.;Wildgoose, G. G.; Compton, R. G. Chem. Commun. 2005, 829−841.(37) Bard, A. J.; Faulkner, L. R. Electrochemical Methods:Fundamentals and Applications, 2nd ed.; Wiley: New York, 2001.
(38) (a) Mirkin, M. V.; Bard, A .J . Anal. Chem. 1992, 64, 2293−2302. (b) Oldham, K. B.; Zoski, , C. G. J. Electroanal. Chem. 1988, 256,11−19. (c) Oldham, K. B. Steady State Voltammetry. In Microelectrode:Theory and Application; Montenegro, M. I., Queiros, M. A., Daschbach,J. L., Eds.; Kluwer: Dordrecht, The Netherlands, 1991; pp 35−50.(39) (a) McCreery, R. L.; McDermott, M. T. Anal. Chem. 2012, 84,2602−2605. (b) Royea, W. J.; Hamann, T. W.; Brunschwig, B. S.;Lewis, N. S. J. Phys. Chem. B 2006, 110, 19433−19442. (c) Gerischer,H.; McIntyre, R.; Scherson, D.; Storck, W. J. Phys. Chem. 1987, 91,1930.(40) (a) Ugeda, M. M.; Brihuega, I.; Guinea, F.; Gomez-Rodriguez, J.M. Phys. Rev. Lett. 2010, 104, 096804−096807. (b) Schweitzer, L.Phys. Rev. B 2009, 80, 245430−245435.(41) (a) Wang, C.; Hu, X. Talanta 2006, 68, 1322−1328.(b) Velmurugan, J.; Sun, P.; Mirkin, M. V. J. Phys. Chem. C 2009,113, 459−464.(42) Wang, H. L.; Robinson, J. T.; Li, X. L.; Dai, H. J. J. Am. Chem.Soc. 2009, 131, 9910−9911.(43) (a) Patel, A. N.; Collignon, M. G.; O’Connell, M. A.; Hung, W.O. Y.; McKelvey, K.; Macpherson, J. V.; Unwin, P. R. J. Am. Chem. Soc.2012, 134, 20117−20130. (b) Lai, S. C. S.; Patel, A. N.; McKelvey, K.;Unwin, P. R. Angew. Chem., Int. Ed. 2012, 51, 1−5.(44) (a) Amatore, C.; Fosset, B. J. Electroanal. Chem. 1988, 256,255−268. (b) Amatore, C.; Deakin, M. R.; Wightman, R. M. J.Electroanal. Chem. 1987, 220, 49−63.(45) (a) Ciszkowska, M.; Jaworski, A.; Osteryoung, J. G. J.Electroanal. Chem. 1997, 423, 95−101. (b) Lee, C.; Anson, F. C. J.Electroanal. Chem. 1992, 323, 381−389.(46) (a) Beriet, C.; Pletcher, D. J. Electroanal. Chem. 1993, 361, 93−101. (b) Rooney, M. B.; Coomber, D. C.; Bond, A. M. Anal. Chem.2000, 72, 3486−3491.
Journal of the American Chemical Society Article
dx.doi.org/10.1021/ja402456b | J. Am. Chem. Soc. 2013, 135, 10073−1008010080

www.spm
.com
.cn
S1
Supporting Information
Graphene Nanoelectrodes: Fabrication and Size-Dependent
Electrochemistry
Bo Zhang, Lixin Fan, Huawei Zhong, Yuwen Liu, Shengli Chen.
Key Laboratory of Analytical Chemistry for Biology and Medicine (Ministry of Education), Hubei Key
Laboratory of Electrochemical Power Sources, Department of Chemistry, Wuhan University, Wuhan, People’s
Republic of China.
1. Chemicals
N-dodecanethiol (C12H25SH) and Ru(NH3)6Cl3 were purchased from Aldrich. N,N-dimethylformamide
(DMF), K3Fe(CN)6 and KCl were purchased from National Pharmaceutical Group Chemical Reagent Co., Ltd.
(Shanghai, China). All chemicals are analytical grade. The C12H25SH solution was prepared by dissolving it in
ethanol and the concentration was 5mM.
2. Characerizations and Measurements.
2.1 AFM Measurements. The AFM images were obtained under the tapping mode of 1024×1024 pixel
resolution (Benyuan-CSPM5500, China), and analyzed with CSPM Console software (Benyuan-CSPM5500,
China). The samples for AFM observation were prepared by drop-casting suspensions on freshly cleaved mica
surface.
2.2 Raman Measurements. The Raman spectra were taken with a laser-micro-Raman spectrometer
(Renishaw in via, Renishaw). The excitation laser had a wavelength of 532nm. The laser spot size was
around 2µm. To prepare samples for Raman measurements, a piece of SiO2-coated substrate was immersed
in r-GO suspension of DMF and pulled slowly by the tilt of 45º, and then dried at a 100℃ on a hotplate.
Two kinds of laser powers, 30 mW and 10mW respectively, were used to sample Raman spectra. The
spectrum shown in Figure 7 was sampled with a 30 mW power, while the spectra in Figures S8 and S9
were obtained using a 10mW power. We found that sometimes the samples could be destroyed in relatively
high laser power , probably due to that our r-GO flakes had very small sizes and were distributed mostly as
individual flakes on substrates. With the lower power, the obtained Raman signals had relatively low
signal/noise ratios, so that the 2D peak was not clearly seen. However, the characteristic G and D bands
(where the D peak is a defect peak due to intervalley scattering and G refers to the graphene G peak) were
clearly seen at ~1584 and ~1352 cm-1, respectively. The spectra obtained using higher power clearly
showed the weak 2D and S3 peak.
2.3 Electrochemical Measurements. Electrochemical measurements were performed on CHI900B
www.spm
.com
.cn
S2
electrochemical workstation with an Ag/AgCl (3.0M NaCl) electrode as counter electrode and reference
electrode. Solutions for electrochemical measurements were prepared using ultrapure water and purged with
argon prior to each experiment.
3. Preparation of Graphene Oxides (GOs)
GOs were prepared according to the modified Hummers method1,2. Briefly, graphite powder (2 g,
Sigma-Aldrich.) was mixed with 115 mL of concentrated sulfuric acid in a 1000 mL round-bottom flask. Next, 1
g of NaNO3 was added to the mixture and allowed to stir at room temperature. The flask was then placed in
an ice bath. KMnO4 (15g) was slowly added to the mixture under vigorous agitation, and the reaction
temperature was kept below 20 °C. The solution was then heated at 35-40℃ for 24 h with gentle stirring,
during which the mixture became more and more viscous with color gradually changing from
dark green to reddish brown. After cooling with an ice bath, the slurry was diluted with 250 ml deionized
water to terminate the reaction. The color of the mixture immediately turned to bright yellow following the
treatment with 10 ml of 30 wt.% H2O2 to reduce the insoluble manganese species to Mn2+ ions. The suspension
was centrifuged and washed with deionized water repeatedly. Finally, the product was subject to ultrasonic
exfoliation and then lyophilized to obtain fluffy GO powder.
4. Numeric Fittings
We considered the outer-sphere one-electron reduction of electroactive species O to the product R at
disk electrodes of effective diameter d and/or ribbon electrodes of different length and width combinations.
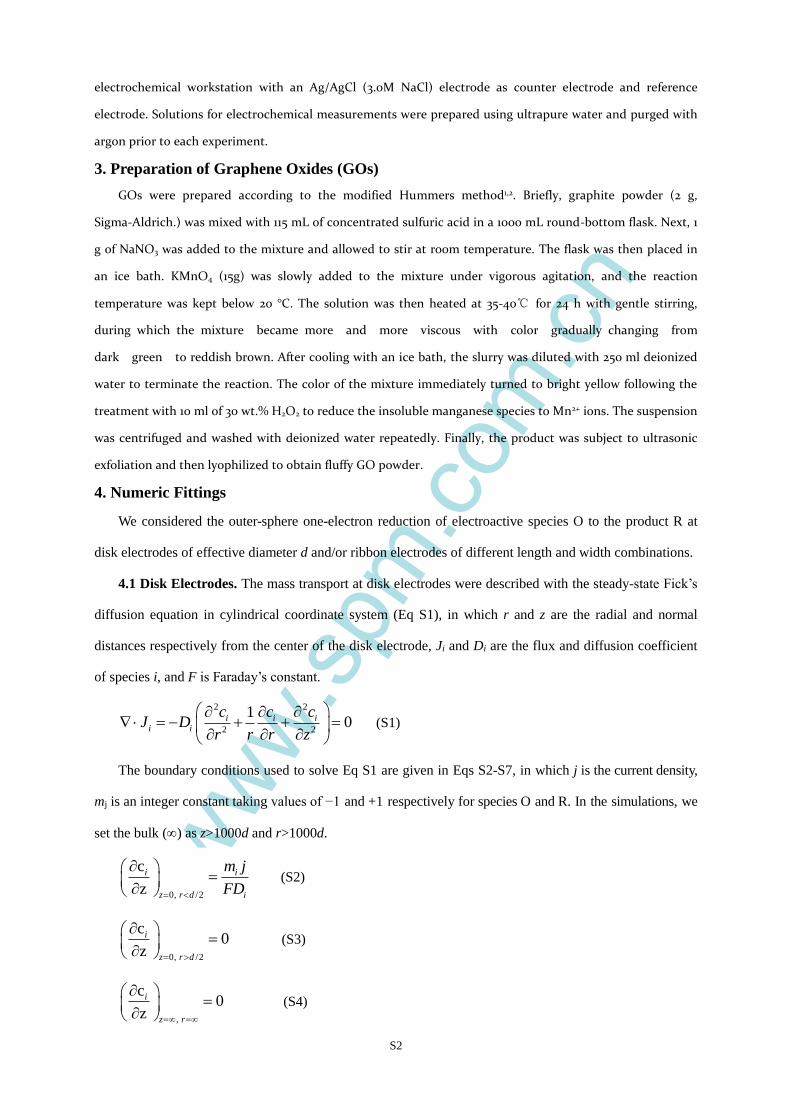
4.1 Disk Electrodes. The mass transport at disk electrodes were described with the steady-state Fick’s
diffusion equation in cylindrical coordinate system (Eq S1), in which r and z are the radial and normal
distances respectively from the center of the disk electrode, Ji and Di are the flux and diffusion coefficient
of species i, and F is Faraday’s constant.
2 2
2 2
10i i i
i i
c c cJ D
r r r z
(S1)
The boundary conditions used to solve Eq S1 are given in Eqs S2-S7, in which j is the current density,
mj is an integer constant taking values of −1 and +1 respectively for species O and R. In the simulations, we
set the bulk () as z>1000d and r>1000d.
0, /2
c
z i i
z r d i
m j
FD
(S2)
0, /2
0z
ci
z r d
(S3)
,
c
z0i
z r
(S4)

www.spm
.com
.cn
S3
,
5 Mc mz rO
(S6)
,
c 0z rR
(S7)
The current density j can be related to the potential and concentrations at electrode surface through the
Butler-Volmer equation (S8). The total current I can be obtained with Eq S9. The transfer coefficient was
assumed to be 0.5.
0 0α (1 α)0F e e
F FE E E E
RT RTO Rj k c c
(S8)
/2
02
d
I rjdr (S9)
4.2 Ribbon Electrodes. The ribbon electrodes were modeled with a rectangle with length of l and
width of w (Figure S0). The mass transport was described with the steady-state Fick’s diffusion equation in
Cartesian coordinate system (Eq S10). The boundary conditions and parameters used to solve Eq S10 were
similar to that for solving Eq S1.
l/2
w/2
y
z
x
Figure S0. The geometry used in simulating ribbon electrodes.
2 2 2
2 2 20i i i
i i
c c cJ D
x y z
(S10)
The current at ribbon electrodes were obtained according to Eq S11.
/2 /2
/2 /2
l w
l wI jdxdy
(S11)
For ribbon electrodes, a polarization curve could be fitted with different (w, l, k0) combinations. We
showed two limiting combinations for each the polarization curve in Figures S6 and S7, namely, (w, l, k0)1
containing the smallest possible w and the largest possible l and (w, l, k0)2 containing the largest possible w
and the smallest possible l seen in AFM observations. For w smaller than that in (w, l, k0)1 or larger than
that in (w, l, k0)2, no l within the AFM-observed range could be found to fit the limiting current. The k0
values in the two given combinations should represent its upper and lower limits respectively. In fact, the

www.spm
.com
.cn
S4
two combinations gave nearly identical k0 due to that the r-GO ribbons prepared in this study had very
small aspect ratios and relatively narrow distributions in w and l. Due to the same reason, similar k0 values
were obtained by fitting these polarization curves with disk geometry.
It should be pointed out that the theoretical treatments for ribbon/band microelectrodes can be found in
the literature3. However, the models in most of the existing literature were developed for band electrodes
with very high aspect ratios, that is, l>> w. The small r-GO flakes in present study had very low aspect
ratios, i.e., the length and width are comparable in dimension. Therefore, they can not be treated with the
existing models in the literature.
5. Supporting Figures
-0.4 -0.3 -0.2 -0.1 0.0
-0.009
-0.006
-0.003
0.000
Cu
rre
nt
/ n
A
Potential / V vs. Ag/AgCl (3M NaCl)
Figure S1. Cyclic voltammograms of a Au/SAM electrode in the solution of 1 M KCl containing 10 mM
Ru(NH3)63+. Potential scanning rate: 10 mV/s. (Enlarged plot of curve 1 in Figure 1 in the paper.)
Figure S2. Representative TEM images of r-GO flakes in suspension I. The sample was prepared by
drop casting of dilute r-GO suspension on the carbon film supported by Cu grid. Some restacking of r-GO
flakes might have occurred during the sample preparation processes.

www.spm
.com
.cn
S5
4.6
4.8
5.0
5.2
5.4
4.4
4.6
4.8
5.0
5.2
5.4
4.6
4.8
5.0
5.2
5.4
30 60 90 120 150
4.6
4.8
5.0
5.2
5.4
30 60 90 120 150
4.6
4.8
5.0
5.2
30 60 90 120 1504.4
4.6
4.8
5.0
5.2
5.4
(b)
Heig
ht
/ nm
(a) (c)
(d)
(f)
Width / nm
(e)
Figure S3. AFM height profiles for r-GO flakes in suspension I measured along the width direction.
15
16
17
15
16
17
15
16
17
18
0 200 400
15
16
17
0 200 400
15
16
17
0 200 400
15
16
17
(b)
Heig
ht
/ nm
(a) (c)
(d)
(f)(e)
Width / nm
Figure S4. AFM height profiles for r-GO flakes in suspension II.
Figure S5. AFM images of the solvent assemblies on mica obtained by drop-casting DMF free of r-GO.

www.spm
.com
.cn
S6
-0.2 -0.1 0.0 0.1
-0.15
-0.10
-0.05
-0.2 -0.1 0.0 0.1
-0.15
-0.10
-0.05
0.00
(b)
Fit (w, l, k0 )
1 : 62 nm, 178 nm, 0.9 cm/s;
Fit (w, l, k0
)2 : 86 nm, 136 nm, 1.0 cm/s;
Exp.
Curr
ent / nA
(a)
Potential / V vs. E 0
Fit (w, l, k0 )
1 : 73 nm, 178 nm, 0.9 cm/s;
Fit (w, l, k0 )
2 : 86 nm,156 nm, 1.0 cm/s;
Exp.
Figure S6. Fitting examples for the polarization curves obtained on graphene electrodes prepared from
r-GO suspension I for the reduction of 10 mM Fe(CN)63- in 1 M KCl by assuming the r-GO flakes have
rectangle shapes.
-0.2 -0.1 0.0 0.1
-0.15
-0.10
-0.05
-0.2 -0.1 0.0 0.1
-0.15
-0.10
-0.05
0.00
(b)
Fit (w, l, k0 )
1 : 44 nm, 178 nm, 10.0 cm/s
Fit (w, l, k0 )
2 : 58 nm, 136 nm, 10.0 cm/s
Exp.
Curr
ent / nA
Potential / V vs. E 0
(a)
Fit (w, l, k0 )
1 : 64 nm, 178 nm, 9.0 cm/s
Fit (w, l, k0 )
2 : 86 nm, 139 nm, 10.0 cm/s
Exp.
Figure S7. Fitting examples for the polarization curves obtained on graphene electrodes prepared from
r-GO suspension I for the reduction of 10 mM Ru(NH3)63+ in 1 M KCl by assuming the r-GO flakes have
rectangle shapes.
200
400
600
200
400
600
200
300
400
500
1000 1200 1400 1600 1800
200
300
400
500
1200 1400 1600 1800
200
400
600
1200 1400 1600 1800
200
400
600
800(e) I
D:I
G=1.0031(d) I
D:I
G=1.0023
(c) ID:I
G=1.0228(b) I
D:I
G=1.0531
Inte
nsity (
a.u
.)
(a) ID:I
G=1.0622
(f) ID:I
G=1.0049
Raman Shift (cm-1)
Figure S8. Representative Raman spectra of r-GO in suspension I sampled at laser power of 10 mW. The
corresponding D/G intensity ratios are also given.

www.spm
.com
.cn
S7
250
500
750
400
600
800
500
750
1000
1000 1200 1400 1600 1800
200
400
600
1200 1400 1600 1800
300
400
500
1200 1400 1600 1800
200
400
600
800 (e) ID:I
G=0.9719(d) I
D:I
G=0.9270
(c) ID:I
G=0.9811(b) I
D:I
G=0.8449(a) I
D:I
G=0.8509
Inte
nsity (
a.u
.)
(f) ID:I
G=0.8505
Raman Shift (cm-1)
Figure S9. Representative Raman spectra of r-GO in suspension II sampled at laser power of 10 mW. The
corresponding D/G intensity ratios are also given.
-0.2 -0.1 0.0 0.1 0.2
-0.8
-0.6
-0.4
-0.2
0.0
-0.2 -0.1 0.0 0.1 0.2
-0.3
-0.2
-0.1
0.0
-0.2 -0.1 0.0 0.1 0.2
-3
-2
-1
0(b) d~605 nm
Cu
rre
nt / n
A
(a) d~154 nm
Potential / V vs. E 0
(c) d~2.63m
Figure S10. The voltammetric responses of graphene electrodes for the reduction of 10 mM Ru(NH3)63+ in
the presence (red dash lines) and absence (black sold lines) of 1 M KCl respectively. The numbers in the
figures indicate the effective diameters by assuming that the r-GO flakes are in disk shapes.
-0.3 -0.2 -0.1 0.0 0.1 0.2
-0.4
-0.2
0.0
-0.3 -0.2 -0.1 0.0 0.1 0.2
-0.15
-0.10
-0.05
0.00
-0.3 -0.2 -0.1 0.0 0.1 0.2
-2.0
-1.5
-1.0
-0.5
0.0(b) d~494 nm
Potential / V vs. E 0
Cu
rre
nt / n
A
(a) d~160nm (c) d~1.8 m
Figure S11. The voltammetric responses of graphene electrodes for the reduction of 10 mM Fe(CN)63- in
the presence (red dash lines) and absence (black sold lines) of 1 M KCl respectively. The numbers in the
figures indicate the effective diameters by assuming that the r-GO flakes are in disk shapes.
5. References
1. Zhang, S. M.; Zhang, H. Y.; Liu, Q.; Chen, S. L. J. Mater. Chem. A 2013, 1, 3302–3308.
2. Hummers, W. S.; Offeman, R. E. J. Am. Chem. Soc. 1958, 80, 1339.
3. Bard, A. J.; Faulkner, L. R. Electrochemical methods: fundamentals and applications, 2nd ed.; Wiley:
New York, 2001.