graphene functionalized with arginine decreases the .... j. mol. sci. 2015, 16 25216 amino acids...
TRANSCRIPT
Int. J. Mol. Sci. 2015, 16, 25214-25233; doi:10.3390/ijms161025214
International Journal of
Molecular Sciences ISSN 1422-0067
www.mdpi.com/journal/ijms
Article
Graphene Functionalized with Arginine Decreases the Development of Glioblastoma Multiforme Tumor in a Gene-Dependent Manner
Ewa Sawosz 1, Sławomir Jaworski 1, Marta Kutwin 1, Krishna Prasad Vadalasetty 2,
Marta Grodzik 1, Mateusz Wierzbicki 1, Natalia Kurantowicz 1, Barbara Strojny 1,
Anna Hotowy 1, Ludwika Lipińska 3, Joanna Jagiełło 3 and André Chwalibog 2,*
1 Department of Animal Nutrition and Biotechnology, Warsaw University of Life Sciences,
Warsaw 02-787, Poland; E-Mails: [email protected] (E.S.); [email protected] (S.J.);
[email protected] (M.K.); [email protected] (M.G.);
[email protected] (M.W.); [email protected] (N.K.);
[email protected] (B.S.); [email protected] (A.H.) 2 Department of Veterinary Clinical and Animal Sciences, University of Copenhagen,
Frederiksberg 1870, Denmark; E-Mail: [email protected] 3 Institute of Electronic Materials Technology, Warsaw 02-787, Poland;
E-Mails: [email protected] (L.L.); [email protected] (J.J.)
* Author to whom correspondence should be addressed; E-Mail: [email protected];
Tel.: +45-4096-3573; Fax: +45-3533-3020.
Academic Editor: Bing Yan
Received: 6 August 2015 / Accepted: 10 October 2015 / Published: 23 October 2015
Abstract: Our previous studies revealed that graphene had anticancer properties in
experiments in vitro with glioblastoma multiforme (GBM) cells and in tumors cultured
in vivo. We hypothesized that the addition of arginine or proline to graphene solutions might
counteract graphene agglomeration and increase the activity of graphene. Experiments were
performed in vitro with GBM U87 cells and in vivo with GBM tumors cultured on chicken
embryo chorioallantoic membranes. The measurements included cell morphology, mortality,
viability, tumor morphology, histology, and gene expression. The cells and tumors were
treated with reduced graphene oxide (rGO) and rGO functionalized with arginine (rGO + Arg)
or proline (rGO + Pro). The results confirmed the anticancer effect of graphene on GBM
cells and tumor tissue. After functionalization with amino acids, nanoparticles were
distributed more specifically, and the flakes of graphene were less agglomerated. The molecule
OPEN ACCESS

Int. J. Mol. Sci. 2015, 16 25215
of rGO + Arg did not increase the expression of TP53 in comparison to rGO, but did not
increase the expression of MDM2 or the MDM2/TP53 ratio in the tumor, suggesting that
arginine may block MDM2 expression. The expression of NQO1, known to be a strong
protector of p53 protein in tumor tissue, was greatly increased. The results indicate that the
complex of rGO + Arg has potential in GBM therapy.
Keywords: graphene; reduced graphene oxide; amino acids; glioblastoma multiforme; cells;
tumor; gene expression
1. Introduction
Primary brain tumors represent about 2% of all malignant tumors in adults; 50%–60% of these are
astrocyte gliomas [1]. Although these tumors are relatively uncommon, they unfortunately generate
major clinical problems because of their infiltrative growth, aggressive character and progression to
malignancy [2]. Glioblastoma multiforme (GBM) is extremely aggressive and the most lethal type
of brain tumor. After diagnosis the median patient survival is approximately one year [3,4]. Major
challenges in the therapy of GBM are associated with the tumor location within the brain, which greatly
complicates surgical removal, and the fact that pharmacological therapy is extremely harmful to
healthy tissues [5]. Consequently, research into new methods for GBM therapy that minimize side
effects remains indispensable.
Graphene, a single atomic layer of sp2-bonded carbons [6], and graphene oxide have been recently
investigated as nanostructures useful in anticancer treatment. There are two main avenues to this
research. The first is focused on the use of graphene as a delivery platform [7–9]. The second trend is
focused on graphene as a drug-like structure possessing anticancer activity [10,11]. However, the
behavior of graphene within an organism is still controversial, regardless of its application.
The most important factor is that the solubility of graphene in water is low [12], which consequently
affects the transportation and utilization of graphene within an organism; thus, graphene shows a
tendency to agglomerate and form deposits at the site of administration [13]. This characteristic may
positively limit the range of graphene penetration into healthy tissue when administered into tumor
tissue, but negatively decreases its activity due to a reduced surface area after agglomeration.
Our previous studies revealed that graphene had anticancer properties in in vitro experiments with
GBM cells and in experiments with GBM tumors cultured in vivo [14]. We demonstrated that graphene
enters into GMB cells and other cells in GMB tissue, causing severe destruction of cells by triggering
apoptosis. However, nanoparticles of graphene deposited within tissue or cells showed a tendency to
agglomerate, which probably decreased the graphene-biostructure interface within the tissue and/or
cell. We hypothesized that the addition of amino acids to graphene solutions might counteract graphene
agglomeration. Moreover, amino acids, which are natural, small molecules involved in specific
interactions with other molecules, inside and outside cells, may increase anchoring of graphene in the
area of amino acids specific localizations, and prevent agglomeration of graphene. The role of proteins
as a cargo for carbon nanotubes, when proteins are enabled as internal loads or for external adsorption
of nanotubes, was also suggested [15].

Int. J. Mol. Sci. 2015, 16 25216
Amino acids show natural affinity for graphene surface, interestingly they bind graphene surface
according to the structure of side-chain groups [16]. Proline has a unique structure among the common
amino acids, having its side chain cyclized onto the backbone nitrogen atom, which is the main reason
why proline is a common binding motif [17]. The unique structure of proline distinguishes it from other
amino acids, in terms of chemical stability and inelasticity [18]. Proline is a hydrophobic amino acid
capable of binding to aromatic residues [19], which may mediate its affinity for graphene, however, the
affinity of proline for graphene is small, compared to other amino acids [16]. The binding of proline to
graphene may influence the spread of graphene particles in the tissue and increase resistance to
agglomeration; consequently, graphene + proline molecules may occupy a larger area in the tumor
tissue. Proline participates in the induction and progression of cellular stress [20,21] and in molecular
recognition, particularly in intracellular signaling [19], and also participates in signaling mechanisms,
particularly those occurring via protein-protein recognition without a translational pathway [22].
The regulatory effect of proline metabolism is connected to stress dependent on p53 regulation, because
the first enzyme in the proline degradation pathway (proline oxidase/proline dehydrogenase) is encoded
by p53-induced gene 6 (PIG6) and induces metabolic responses under stress conditions. One of the most
promising anticancer strategies involves exploring the possibilities of p53 protein activation by blocking
its binding to MDM2 [23]. Other key studies [24] concerning polymorphisms of p53 demonstrated that
this protein also occurs in a form containing arginine instead of proline in the N-terminal domain, which
increases its proapoptotic activity by 15-fold. The results of other studies have suggested that the
methylation of arginine may play a role in regulating different biochemical properties of p53 that have
downstream consequences on the functional result of the p53 response [25]. Moreover, according to
Jeong et al. [26] the greatest difference between p53-arginine and p53-proline was demonstrated for the
PERP gene engaged in cell-cell adhesion and apoptosis. The most common genes that are transcribed
more efficiently by the p53-arginine protein than the p53-proline protein are related to apoptotic function
(DR4, NOXA, PUMA, and PIG3). Other studies have also confirmed the participation of arginine in
protecting the redox state in cells [27]. Furthermore, arginine as a source of nitric oxide can modify the
formation of reactive forms of oxygen in mitochondria and lead to apoptosis. Interestingly, arginine
showed the highest affinity for graphene, in comparison to all amino acids [16].
Therefore, proline or arginine may not only protect graphene against agglomeration but also support
its anticancer properties. Proline and arginine are perceived as anti-cancer molecules [21,28–30]. In the
present study, however, it was investigated as to whether amino acids might play a role as a cargo for
graphene, supporting its navigation and deposition in tumor tissue, and hence modulate the toxicity of
graphene, and also act as potential anti-cancer agents. We hypothesized that counteracting graphene
agglomeration within tissue/cells may increase the range of graphene activity. Therefore, we investigated
the other trend in anticancer graphene use, where graphene as an anticancer drug is delivered and
distributed by organic compounds (amino acids), which also support the anticancer activity of graphene
and create a kind of mutual cooperation.

Int. J. Mol. Sci. 2015, 16 25217
2. Results
2.1. Characterization of GO (Graphene Oxide) and rGO (Reduced Graphene Oxide)
Figure 1 shows representative TEM (transmission electron microscope) images of GO (A), rGO (B),
rGO + Arg (C), rGO + Pro (D). GO after reduction, a change in morphology was seen, with fewer layers,
and irregular and wrinkled flakes, ranging from 100 nm to 1.5 μm in diameter. After functionalization
of GO with arginine and proline, graphene and amino acids changed their appearance. Graphene was
attached to the amino acids, and there were no visible free flakes of graphene, the structures were
irregular and branch like.
Figure 1. TEM image of graphene oxide (A); reduced graphene oxide (B); and reduced
graphene oxide functionalised with arginine (C) and proline (D). The ζ potentials were for
rGO: 19.5, rGO + Arg: 32.5, rGO + Pro: 39.8, Arg: 9.67 and Pro: 23.8 mV.
The Fourier transform infrared spectroscopy (FTIR) spectrum of rGO, rGO + Arg and rGO + Pro
samples indicate the presence of amino acids grafted by rGO (Figure 2). Both spectra of graphene
functionalized with amino acids are similar and differ from rGO spectra. In the rGO characteristic
spectrum, three peaks at 1769, 1602 and 1289 cm−1 were observed, corresponding to C=O, C=C and
C–O bonds respectively [31]. The spectrum of rGO + Arg and rGO + Pro samples showed presence of
groups originated from amino acids functionalization, observed also by the other authors in the spectra
of arginine [32], graphene functionalized with poly-L-lysine [33] and graphene functionalized with
amine [34]. In the range from 3500 to 3140 cm−1, stretching bands derived from O–H group and N–H in
free NH3+ group was observed. At around 1570 cm−1 there is out-of-plane bending of NH2 group and at
around 1236 cm−1 overlap C–O and also C–N stretching is seen. Bending vibrations of N–H groups are
in the range of 890–810 cm−1. At 454 cm−1 in the sample with arginine and at 463 cm−1 in the sample
with proline there are bands due to rocking motion of N–H groups. The C=O stretching vibration,
corresponding to carboxylic groups, appears at 1725 cm−1.

Int. J. Mol. Sci. 2015, 16 25218
Figure 2. Fourier transform infrared spectroscopy spectra of reduced graphene oxide
(top left) and reduced graphene oxide with arginine and with proline.
2.2. Experiments with Fibroblast and Glioblastoma Cells
Mortality, Viability and Morphology of Cells
In the preliminary experiments with fibroblast L929 the morphology of cells after treatment with rGO
differed from the control group. Fewer cells were seen and with graphene agglomerates attached to the
cell body (Figure 3B). rGO significantly (p < 0.05) decreased viability of both cell lines comparing with
the control groups. However, the reduction of GBM cells was significantly higher than fibroblast cells
(Figure 3C).
Figure 3. Morphology of L929 fibroblast cells in the control group (A); after treatment with
reduced graphene oxide (B) and the viability of cells (C). Notes: Reduced graphene oxide
flakes formed agglomerates and adhered to the cells. Bars with different superscripts indicate
significant differences between groups (p < 0.05); error bars are standard deviations. C
Fibrobl: control fibroblasts (untreated); rGO Fibrobl: fibroblasts treated with reduced
graphene oxide; C GMB: control glioblastoma (untreated); and rGO GMB: glioblastoma
treated with reduced graphene oxide.
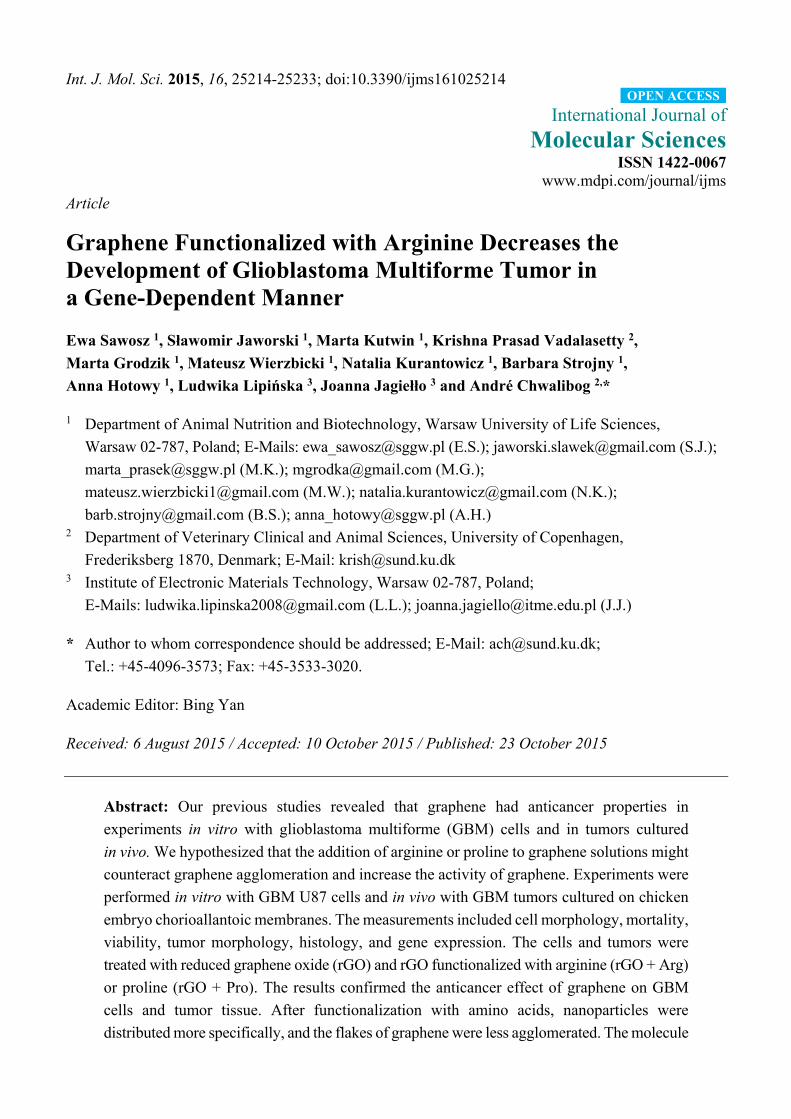
The measurements of mortality demonstrated that rGO flakes significantly (p <0.05) increased the
number of dead cells compared with the control group. The complexes of rGO + Arg and rGO + Pro
also significantly increased cell mortality but to lesser extent than rGO (Figure 4).
Int. J. Mol. Sci. 2015, 16 25219
Figure 4. Effect of reduced graphene oxide, reduced graphene oxide with arginine, and
reduced graphene oxide with proline on the mortality of glioblastoma U87 cells. Notes: Bars
with different superscripts indicate significant differences between groups (p < 0.05); error
bars are standard deviations. C: control group (untreated cells); rGO: reduced graphene oxide
group; rGO + Arg: reduced graphene oxide with arginine group; and rGO + Pro: reduced
graphene oxide with proline group.
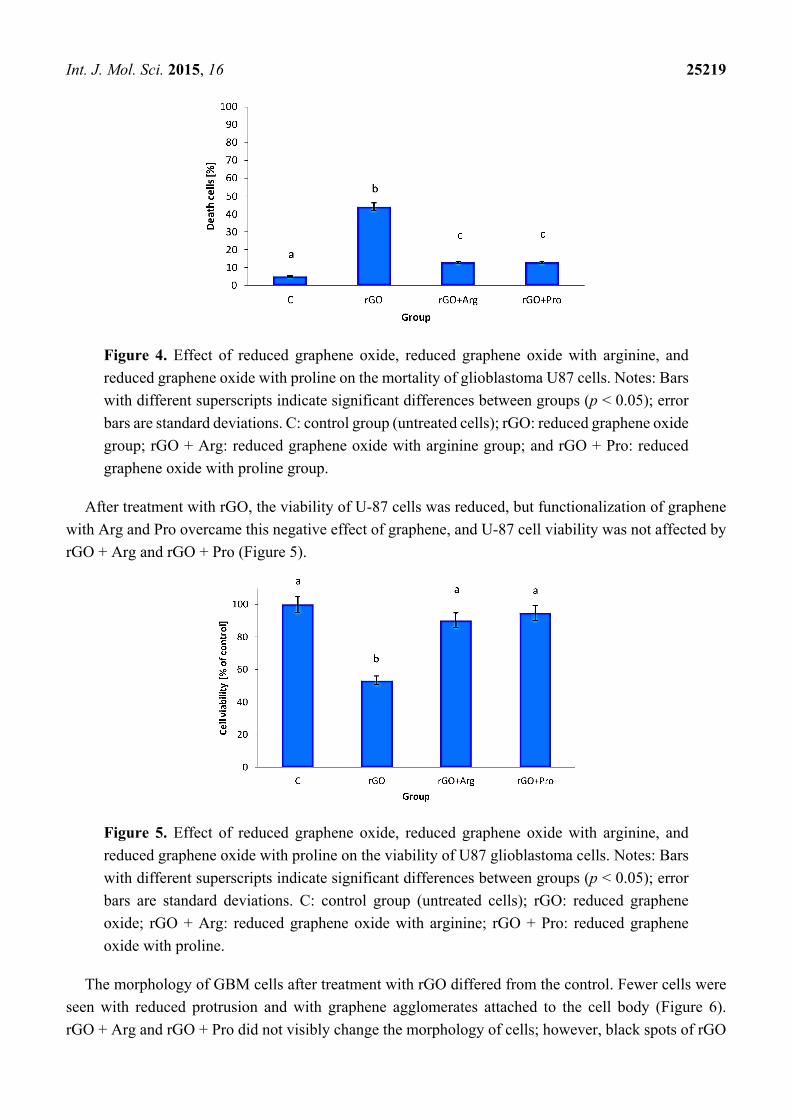
After treatment with rGO, the viability of U-87 cells was reduced, but functionalization of graphene
with Arg and Pro overcame this negative effect of graphene, and U-87 cell viability was not affected by
rGO + Arg and rGO + Pro (Figure 5).
Figure 5. Effect of reduced graphene oxide, reduced graphene oxide with arginine, and
reduced graphene oxide with proline on the viability of U87 glioblastoma cells. Notes: Bars
with different superscripts indicate significant differences between groups (p < 0.05); error
bars are standard deviations. C: control group (untreated cells); rGO: reduced graphene
oxide; rGO + Arg: reduced graphene oxide with arginine; rGO + Pro: reduced graphene
oxide with proline.
The morphology of GBM cells after treatment with rGO differed from the control. Fewer cells were
seen with reduced protrusion and with graphene agglomerates attached to the cell body (Figure 6).
rGO + Arg and rGO + Pro did not visibly change the morphology of cells; however, black spots of rGO

Int. J. Mol. Sci. 2015, 16 25220
agglomerates were not seen, and only small shadows were observed on the body of cells. In the group
of cells treated with rGO + Arg, graphene was nearly invisible.
Figure 6. Morphology of U-87 glioblastoma cells in the control group (A) and after
treatment with reduced graphene oxide (B), reduced graphene oxide with arginine (C),
and reduced graphene oxide with proline (D). Notes: Reduced graphene oxide flakes formed
agglomerates (B), all graphene forms adhered to the cells.
2.3. Experiments with Tumor Tissue
2.3.1. The Volume, Weight and Morphology of GBM Tumors
GBM U-87 cells were cultured on the chorioallantoic membranes of chicken embryos. The tumor
tissue was resected, and the volume, weight and morphology of the tumors were compared (Table 1).
Table 1. Characteristics of glioblastoma multiforme U87 tumors cultured on chicken embryo
chorioallantoic membrane after treatment with reduced graphene oxide, reduced graphene
oxide with arginine and reduced graphene oxide with proline or untreated as a control.
Parameter Group ANOVA
Control rGO rGO + Arg rGO + Pro SE p-Value
Weight [mg] 0.0981 a 0.0637 b 0.0666 b 0.0598 b 0.01551 0.0317 Volume [mm3] 114.2 a 45.32 b 74.51 b 64.12 b 18.481 0.0049
a,b Values with different superscripts denote a statistically significant difference (p < 0.05) between the
treatments. Abbreviations: control group (untreated); rGO: reduced graphene oxide group; rGO + Arg: reduced
graphene oxide with arginine group; rGO + Pro: reduced graphene oxide with proline group; ANOVA: analysis
of variance; and SE: pooled standard error.
rGO and rGO functionalized with arginine and proline significantly reduced the weight of the tumors.
The volume of the tumors after treatment with rGO, rGO + Arg, and rGO + Pro was reduced in

Int. J. Mol. Sci. 2015, 16 25221
comparison to the control; however, the greatest reduction was observed with rGO. The morphology of
the tumors after treatment with rGO differed from the control (Figure 7).
Figure 7. Morphology of U-87 glioblastoma tumors cultured on chicken embryo
chorioallantoic membranes in the control group (A) and after treatment with reduced
graphene oxide (B); reduced graphene oxide with arginine (C); and reduced graphene oxide
with proline (D).
The solid part of the tumor was less rounded, wrinkled and creased with fewer visible blood vessels.
Dark grey or black spots of graphene agglomerates were seen. After treatment with rGO + Arg, solid
parts of tumors were smaller and rounded without wrinkles; however, comparing to the other groups,
the network of blood vessels reduced to the greatest extent. rGO + Pro also decreased the solid volume
of the tumor, but did not change the surface morphology. Graphene particles were easily visible.
2.3.2. Histology of Tumors
Pictures of the control GBM tumor presented a typical microstructure (Figure 8). Two basic
morphologic features were seen: necrosis and endothelial proliferation. Centrally located necrosis and
palisading cells around necrotic foci were observed. Formations of blood vessels were also noted, mainly
in the outer layer of the tumor. The presence of pink fibrillary cytoplasm in the cells was also seen.
Images of the GBM tumors treated with rGO indicated the presence of graphene agglomerates within
the tissue. rGO was randomly distributed in the central area of the tumor as well as in the core. The
tissue, however, was full of white gaps and ruptures. GBM tumors, after injection with rGO + Arg and
rGO + Pro, appeared different. In the rGO + Arg group, graphene was placed on the outer layer of the
tumor, slightly aligned and often located close to small blood vessels and in microglia cells. In the tumors
treated with rGO + Pro, the agglomeration of graphene particles was greatly reduced, and the particles
were aligned in the tissue and found between cells and around cells rather than inside the cells.

Int. J. Mol. Sci. 2015, 16 25222
Figure 8. Histology of U-87 glioblastoma tumors cultured on chicken embryo
chorioallantoic membranes in the control group (A,B) and after treatment with reduced
graphene oxide (C,D); reduced graphene oxide with arginine (E,F); and reduced graphene
oxide with proline (G,H). Arrows point to nanoparticles. Note: Reduced graphene oxide
flakes formed agglomerates.
2.3.3. Gene Expression in Tumors
Expression of the tumor protein p53 (TP53), at the mRNA level, was increased in tumors after
treatment with rGO; however, this effect was diminished by amino acid attachment, but the level of
TP53 after rGO + Arg treatment was higher in comparison to the control (Table 2).
The expression of mouse double minute 2 (MDM2) was significantly higher in tumors treated with
rGO in comparison to the control. Graphene functionalized with arginine and proline diminished this
property; however, the expression of MDM2 was slightly but non-significantly higher than in the control
group. The MDM2/TP53 ratio was lowest in the rGO + Arg group. The expression of cytochrome c

Int. J. Mol. Sci. 2015, 16 25223
oxidase 6 (COX6) increased after treatment with all experimental treatments, with the highest expression
found in rGO and rGO + Arg treated tumors. NAD(P)H: quinone acceptor oxidoreductase 1 (NQO1)
expression was increased after injection of rGO, even more after treatment with rGO + Pro and much
more after rGO + Arg treatment. The expression of caspase-3 (CASP3) was increased in all experimental
groups; however, this was significant only in the groups treated with rGO and rGO + Arg. Expression
of fibroblast growth factor-2 (FGF2) was lower in all experimental groups than in the control.
The mRNA level of vascular endothelial growth factor A (VEGF) was slightly (non-significantly) lower
in tumors injected with rGO + Arg.
Table 2. Gene expression at the mRNA level in glioblastoma multiforme U87 tumors,
cultured on chicken embryo chorioallantoic membrane, after treatment with reduced
graphene oxide, reduced graphene oxide with arginine and reduced graphene oxide with
proline or untreated as a control.
Genes Group ANOVA
Control rGO rGO + Arg rGO + Pro SE p-Value
TP53 0.345 a 1.310 b 0.965 c 0.604 a 0.0999 0.0001 MDM2 0.845 a 3.053 b 1.919 a 1.564 a 0.3544 0.0065
MDM2/TP53 2.45 a 2.33 a 1.99 b 2.59 a 0.288 0.0032 COX6 0.323 a 0.950 c 1.082 c 0.714 b 0.0777 0.0001 NQO1 0.380 a 3.781 b 10.845 c 5.012 b 0.2208 0.0000 CASP3 0.428 a 0.920 b 1.052 b 0.780 a,b 0.1724 0.0115 FGF2 1.059 a 0.671 b 0.432 b 0.741 b 0.0956 0.0045 VEGF 0.528 0.438 0.287 0.526 0.1723 0.1156
a,b,c Values with different letters denote a statistically significant difference between the groups. Abbreviations:
control group (untreated); rGO: reduced graphene oxide group; rGO + Arg: reduced graphene oxide with
arginine group; rGO + Pro: reduced graphene oxide with proline group; ANOVA: analysis of variance; and
SE: pooled standard error.
3. Discussion
In the present studies we measured both mortality and viability of cells. The number of dead cells is
a measurement of the integrity of the cell membrane, while viability is related to NAD(P)H production
through glycolysis and correlates to the number of metabolically active cells in the culture. The results
with experiments with GBM cells confirmed our earlier studies indicating that rGO increases cell
mortality [10,14,35]. The toxic effects of rGO in in vitro experiments with normal and cancer cells have
been demonstrated previously [36–39]. However, the toxic effects also depend on the type of the cells,
as it was observed that fibroblasts (Figure 3), being less susceptible to the rGO treatment than GBM.
This might be explained by the high amount of graphene aggregates in fibroblast medium and lower
affinity of the rGO flakes to fibroblast cells, influencing adhesion to the cell membrane and rGO intake
by cells. Although, the lower toxicity of rGO to fibroblasts than to GBM might be considered, the method
of potent use of graphene as an anticancer structure presupposes direct intratumor injections.
The toxic effect of graphene can be explained by the interaction of hydrophobic chemically active
groups, available on the surface, with the membranes of living cells, as well as other intracellular
structures [36–39]. However, the toxicity of graphene may be reduced after the adsorption of amino

Int. J. Mol. Sci. 2015, 16 25224
acids onto graphene sheets [40]. The treatment with rGO after functionalization with amino acids led to
significantly reduced number of dead cells compared to rGO. However, still the toxicity of rGO + Pro
and rGO + Arg was higher than in the control group. The harmful effects of graphene might be mediated
by hydrophobic groups exposed on the rGO surface, which became unavailable after Pro and Arg
functionalization. In other experiments using graphene oxide (GO), the toxicity was greatly mitigated
following extremely high protein adsorption on GO, where proteins, as a crown placed on graphene,
decreased the number of active groups available on the surface [41].
Visualization of the morphology of the graphene-GBM cell interaction, as in our previous
experiments, pointed to the affinity, adherence and entry of rGO into cells [10]. The phenomenon of
graphene transport into cells has also been documented in other studies [13,14]. Functionalization of
rGO by amino acids (Pro and Arg), however, dramatically changed rGO behavior. Graphene flakes, after
administration to cultured cells, adhered to the body of cells, agglomerated, and were seen as black spots.
Visualization of rGO + Arg and rGO + Pro did not show this kind of structure, and agglomerates of
graphene were not seen clearly as black spots. This might suggest that the functionalization of rGO with
Pro and Arg prevented rGO agglomeration. Shan et al. [33] demonstrated increased solubility of
graphene after functionalization of Poly-L-lysine, what also might occur in the present experiment,
especially that Zeta potential of rGO after functionalization with amino acids increased about two-fold.
The results on cell viability may partially explain the above observations. rGO treatment induced
significant cell toxicity, as well as decreased viability, but rGO + Pro and rGO + Arg only affected
the mortality of GBM cells. We suspect that diminished agglomeration due to arginine and proline
functionalization inhibited the entry of graphene into cells, but did not affect the intracellular mechanism,
i.e., NAD(P)H production. The number of dead cells was reduced, but the toxicity of rGO + Arg and
rGO + Pro was higher than in the control group, mediated by the destruction of cell membranes due to
graphene flakes sticking to the membranes. It is likely that amino acids increased the adhesion of flakes
to the membranes, and thereby increased their toxicity.
In the experiment with GBM tumors cultured on the chicken embryo chorioallantoic membranes,
rGO decreased the weight and volume of the tumors. The decreased tumor volume was accompanied by
reduced tension of the tumor tissue, manifested by wrinkling of the surface. In our previous study,
apoptosis of cancer cells was observed after graphene treatment [14], resulting in a reduction in tumor
weight and volume. However, a disruption in water homeostasis might also occur, especially since
graphene is permeable to water but not permeable to ions [42]; thus, graphene could act as a kind of
filter, as was also suggested by Jaworski et al. [14] The volume of the tumors in rGO + Arg and
rGO + Pro groups was smaller than in the control group but greater than in the rGO group, which was
also confirmed by the more wrinkled surface of the tumor treated with rGO. Consequently, this may
suggest that the proliferation of cells was decreased by all graphene treatments (rGO, rGO + Arg and
rGO + Pro), but water circulation was changed only by rGO.
The decreased rate of cell proliferation in the tumors after all treatments was confirmed by FGF2
expression on the mRNA level. FGF2 is a marker of cell proliferation during tumor development;
moreover, the dramatic effects of FGF2 in cancer result from FGF2-induced shifts in gene expression [43].
FGF2 is necessary for maintaining VEGFR2 receptor, hence, the inhibition of FGF2 downregulates
VEGF-dependent biological processes, mainly angiogenesis [44]. In the present study, we observed a
tendency for decreased VEGF expression only after rGO + Arg treatment. This result is in line with the

Int. J. Mol. Sci. 2015, 16 25225
examination of the histology images from the rGO + Arg group, where graphene was found mainly
in the outer, most metabolically active layer of the tumor, slightly aligned and often located near
small blood vessels. This may suggest that arginine was preferentially localized in these areas. Tumor
downregulation of the argininosuccinate synthetase results in a dependence on extracellular arginine,
due to an inability to synthesize arginine for growth [45]. Thus, the requirement of cancer cells for
arginine may have increased the movement of rGO + Arg molecules preferentially to the areas of most
aggressive tumor growth. Consequently, graphene was localized in the outer layer of the tumor, in the
area of the highly active process of angiogenesis, in contrast to rGO and rGO + Pro.
Our previous studies did not document any anti-angiogenic effects of graphene [46], suggesting that
the antiangiogenic effect observed in this study was induced by arginine, which was protected from
breakdown by the association with graphene. However, the involvement of arginine in angiogenesis is
controversial [47–49].
In the present experiment, the mRNA level of NQO1 increased dramatically after rGO + Arg
treatment and to a lesser extent by rGO and rGO + Pro treatments. NQO1 promotes the two-electron
reduction of quinones, nitroaromatics and quinoneimines and consequently depresses the quinone level,
which minimizes the generation of reactive oxygen species [50]. Graphene-like materials, however,
can protect molecular targets from oxidation by free radicals, and are highly effective scavengers of
hydroxyl radical [51]. Furthermore, NQO1 plays a broad role in cytoprotection because it binds to and
consequently stabilizes the tumor suppressor p53 protein from proteasomal degradation [52]. In the
present experiments, however, the expression of TP53 at the mRNA level also increased after rGO +
Arg and to a higher degree after rGO application. Furthermore, rGO upregulated the expression of TP53,
indicating a dual role of rGO by stimulation of the TP53 gene and by stimulation of the protector of p53,
NQO1. As a key tumor suppressor, p53 inhibits tumorigenesis by inducing cell cycle arrest, senescence,
and apoptosis [53]. Apoptosis of GMB cells as a result of rGO treatment was observed in our earlier
experiments [10,14]. The present experiments confirm these results, demonstrating the upregulation of
CASP3, which plays a key role in the execution phase of apoptosis.
During stress, the expression of p53 increases in glioma [54], but its actual activity is determined
by the level of MDM2, which binds to the N-terminal domain of p53 and blocks its proapoptotic
activity [55]. Some authors believe that blocking the binding of p53 with MDM2 by selective blocking
of the MDM2 binding domain without deregulation and deactivation of p53 protein could benefit
anticancer therapy [56,57]. In all experimental groups, increased expression of MDM2 at the mRNA
level was observed. However, the MDM2/TP53 index was significantly lower only in rGO + Arg treated
tumors. This raises the issue that only the interaction of graphene and arginine may modify molecular
responses in the most promising direction.
TP53 has several polymorphisms, including a proline to arginine variant at amino acid 72 (P72 to R72).
The P72 variant induces cell cycle arrest, while the R72 variant has the ability to preferentially induce
apoptosis [53]. Thus, we can hypothesize that an additional reservoir of arginine, provided and protected
against enzymatic digestion by the rGO platform [58], may support the synthesis of DNA for properly
encoded TP53 with the R72 polymorphism (arginine variant). This is in line with the results concerning
CASP3-mediated activation of apoptosis.
Considering the results of rGO + Pro administration in comparison to rGO + Arg, the MDM2/TP53
index and reduced expression of NQO1 indicate the insufficient effect of this complex. The data may

Int. J. Mol. Sci. 2015, 16 25226
also confirm that, in the case of TP53 with the R72 polymorphism, supplementation with proline has no
impact on the mRNA expression of TP53.
Interestingly, COX6 mRNA expression was significantly induced by rGO and rGO + Arg and to
a lesser degree by rGO + Pro. The intrinsic pathway of apoptosis occurs by releasing COX6 into the
cytosol, which then causes the assembly of a multiprotein caspase-activating complex [59]. p53 activates
this mechanism in a transcriptionally-dependent or -independent manner [60]. In our experiments, the
activation of TP53 and COX6 transcription was similar, i.e., higher in the rGO and rGO + Arg treatments
and lower in the control and rGO + Pro groups. Considering these results, as well as decreased CASP3
expression mediated by rGO + Pro, may indicate that proline attached to graphene reduces the
proapoptotic activity of rGO.
4. Experimental Section
4.1. Preparation of Graphene Complexes
Graphene oxide (GO) was prepared from natural graphite flakes (purchased from Asbury Carbons,
Asbury, NJ, USA) by a modified Hummers method [14]. To prepare the reduced graphene oxide (rGO),
a water suspension of 50 mg of GO was acidified to pH 1 and heated to 90 °C. In the next step, 12 mL
of reducing mixture (0.01 g of ammonium iodide, 9 g of hydrated sodium hypophosphite, and 1.21 g of
sodium sulfite dissolved in 100 mL of deionized water) was added. A black material (rGO) precipitated
immediately. The product was filtered, washed with deionized water, and dried. The rGO powders
were used to make aqueous suspensions for further analysis and applied in experiments. The aqueous
suspensions were done by adding the powder to ultrapure water and sonicating the solution at 550 W/m2
for 1 h. To prepare graphene + L-arginine (rGO + Arg) or graphene + L-proline (rGO + Pro) complexes,
the amino acid (mass ratio of 1:1) was added to the GO aqueous suspension and mixed on a magnetic
stirrer to dissolve the amino acid. Then, a mixture of reducers, i.e., sodium hypophosphite (0.5 g) and
hydroiodic acid (5 mL at a concentration of 57%) was added. The process of reduction was conducted
for approximately 3 h at a temperature of 80 °C. At the end of the procedure, gentle sonication of the
sample was performed. The procedure was the same with each of the amino acids (arginine and proline).
L-arginine and L-proline were obtained from Sigma-Aldrich (St. Louis, MO, USA). In the preliminary
tests we have established the quantity of amino acids, linked with graphene without leaving residues of
graphene, as 1:1 proportion of amino acid to graphene. Ninhydrine (2,2-Dihydroxyindane-1,3-dione)
was used to detect amino acids in the washed out fluid.
The size and shape of the graphene sheets were examined by a JEM-1220 (JEOL, Tokyo, Japan)
transmission electron microscope (TEM) at 80 KeV, with a Morada 11-megapixel camera
(Olympus Soft Imaging Solutions, Münster, Germany). The samples for TEM were prepared by placing
droplets of hydrocolloids on to Formvar-coated copper grids (Agar Scientific, Stansted, UK). The
droplets were dried in dry air, and immediately the grids were inserted into the TEM. The tests were
performed in triplicate.
The ζ potential in water was measured by a Zetasizer Nano ZS model ZEN3500 (Malvern Instruments,
Malvern, UK). The FTIR spectra were measured by Vertex 80v (Bruker BioSpin Corporation,
Billerica, MA, USA) in the range 500 to 4000 cm−1.
Int. J. Mol. Sci. 2015, 16 25227
4.2. Cell Culture
The human glioblastoma U87 and fibroblast L929 cell lines were purchased from the American Type
Culture Collection (Manassas, VA, USA) and maintained in Dulbecco’s Modified Eagle’s culture
medium containing 10% fetal bovine serum (Life Technologies, Houston, TX, USA) and 1% penicillin
and streptomycin (Life Technologies) at 37 °C in a humidified atmosphere of 5% CO2/95% air in a DH
AutoFlow CO2 air-jacketed incubator (NuAire, Plymouth, MN, USA).
4.3. Cell Morphology
U87 glioma cells were seeded in six-well plates (1 × 10⁵ cells per well) and incubated for 24 h. Cells
cultured in the medium without any treatment were used as the control group. Graphene and amino acid
complexes, at a concentration of 50 μg/mL of rGO and 50 μg/mL of arginine or proline, were introduced
to the cells. 24 h after exposure, an optical microscope was used to evaluate cell morphology.
4.4. Cell Mortality
The trypan blue assay (Sigma-Aldrich, St. Louis, MO, USA) was used to evaluate cell mortality.
U87 cells were plated in 96-well plates (5 × 10⁵ cells per well) and incubated for 24 h. The medium was
removed, and rGO, rGO + Arg, or rGO + Pro samples were introduced to the cells. Then, the cells were
detached with 300 μL of a trypsin-ethylenediaminetetraacetic acid (EDTA) solution. The mixture was
centrifuged at 1200 rpm for 3 min. In the next step, 700 μL of trypan blue solution was added to each
well and dispersed. After 5 min, the cells were counted using a CellCounter (Roche, Penzberg, Germany).
Dead cells were stained blue. Cell mortality was expressed as the percentage of the dead cells in
proportion to the total cell number.
4.5. Cell Viability
Cell viability was determined using a 2,3-bis-(2-methoxy-4-nitro-5-sulphophenyl)-2H-tetrazolium-5-
carboxyanilide salt (XTT)-based cell proliferation assay kit (Life Technologies, Taastrup, Denmark).
U87 were plated in 96-well plates (5 × 10³ cells per well) and incubated for 24 h. The medium was
then removed, and rGO and rGO + Arg, or rGO + Pro samples were introduced to the cells (at the
concentration described above). In the next step, 50 μL of XTT solution was added to each well and
incubated for an additional 3 h at 37 °C. The optical density of each well was recorded at 450 nm on an
enzyme-linked immunosorbent assay reader (Infinite M200, Tecan, Durham, NC, USA). Cell viability
was expressed as the percentage (ODtest − ODblank)/(ODcontrol − ODblank), where ODtest is the optical
density of cells exposed to GO and rGO, ODcontrol is the optical density of the control sample, and ODblank
is the optical density of wells without glioma cells. The same procedure was used with fibroblasts L929
and glioblastoma U87 cells treated with rGO.
4.6. Culture of GMB on a Chorioallantoic Membrane
The fertilized eggs (Gallus gallus; n = 80) were obtained from a commercial hatchery (Dębówka,
Poland). After 6 days of incubation (under standard conditions), a silicone ring ×10 containing

Int. J. Mol. Sci. 2015, 16 25228
3–4 × 10⁶ U87 cells, suspended in 30 μL of culture medium, was placed on the chorioallantoic
membrane. The eggs were incubated for the following 7 days, and then randomly divided into four
groups (n = 20 each): control not injected and rGO, rGO + Arg and rGO + Pro, injected with 200 μL of
each solution. The concentration of rGO, rGO + Arg or rGO + Pro was 500 μL of rGO and 500 μL of
arginine or proline. The solutions were directly injected into the tumor tissue. After 3 days, the tumors
were resected for pending analysis.
4.7. Tumor Volume and Histology
A stereomicroscope (SZX10, CellD software version 3.1; Olympus Corporation, Tokyo, Japan) was
used to take digital photographs of the tumors. The measurements were performed with cellSens
Dimension Desktop version 1.3 (Olympus). The tumor volumes were calculated using the method
described by Jaworski et al. [14].
After resection, tumors were fixed in 4% buffered formalin (Sigma-Aldrich, St. Louis, MO, USA).
Samples were dehydrated and embedded in paraffin. Sections 5 μm in thickness were placed on
poly-L-lysine-coated slides (Equimed, Krakow, Poland) and stained with hematoxylin and eosin.
The measurements were carried out using an optical microscope DM750; Leica Microsystems GmbH,
(Wetzlar, Germany) and LAS EZ version 2.0 software (Wetzlar, Germany). Morphometric estimation
and image analysis were made using 20 measurements of each sample at 400× magnification. The
mitotic index was evaluated as the number of mitotic figures in ten visual fields.
4.8. Gene Expression at the mRNA Level
The tumor tissue samples were homogenized in TRIzol® Reagent (Thermo Fisher Scientific,
Waltham, MA, USA), and total RNA was extracted according to the manufacturer’s instructions. The
RNA was purified using the SV Total RNA Isolation System (Promega Corporation, Madison, WI, USA)
and quantitated using a NanoDrop spectrophotometer (NanoDrop Technologies, Wilmington, DE,
USA). Quality was further measured using an Agilent 2100 bioanalyzer (Agilent RNA 6000 Nano kit,
Waldbronn, Germany). The RNA integrity number (RIN) higher than 6.5 was considered acceptable to
proceed with complementary DNA (cDNA) synthesis. Using 2 µg of total RNA was reverse transcribed
for cDNA synthesis, after which real-time PCR was performed with cDNA and the gene specific primers
shown in Table 3 (TAG, Copenhagen A/S, Copenhagen, Denmark) mixed with SYBR Green Master
mix (Roche Applied Science, Penzberg, Germany) in a Light Cycler® 480 real-time PCR system (Roche
Applied Science, Penzberg, Germany). The cycling conditions included with an initial denaturing step
at 95 °C for 15 min, followed by 40 cycles with a denaturing step at 94 °C (15 s), an annealing step at
56 °C (30 s), and an elongation step at 72 °C (60 s). The cycling reports and melting curves were
evaluated as part of the analysis. Each individual sample reaction was performed in triplicate.
For analyses, relative quantification was calculated versus expression of the β actin (ACTB)
reference gene.

Int. J. Mol. Sci. 2015, 16 25229
Table 3. Primers used in the study.
Gene Forward Primer (5′–3′) Reverse Primer (5′–3′)
TP53 CCCAGCCAAAGAAGAAACCA TTCCAAGGCCTCATTCAGCT MDM2 CAGGACATCTTATGGCCTGCTT GGGCAGGGCTTATTCCTTTT COX6 TGAATCCGGGGTGCCTTTAG CAGAGGGACTGGTACACACGNQO1 AGGCTGGTTTGAGCGTGTTC TTGAATTCGGGCGTCTGCTG CASP3 ACATGGCGTGTCATAAAATACC CACAAAGCGACTGGATGAACFGF2 GGCACTGAAATGTGCAACAG TCCAGGTCCAGTTTTTGGTC
VEGFA TGAGGGCCTAGAATGTGTCC TCTTTTGACCCTTCCCCTTT ACTB ACCCAGATCATGTTCGAGACCTT TCACCGGAGTCCATCACGAT
Abbreviations: TP53, tumor protein p53; MDM2, mouse double minute 2; COX6, cytochrome c oxidase subunit
VIb polypeptide 1; NQO1, NAD(P)H: quinone acceptor oxidoreductase 1; CASP3, caspase-3; FGF2, fibroblast
growth factor-2; VEGFA, vascular endothelial growth factor A; ACTB, β-actin.
5. Conclusions
This study confirmed the anticancer effect of reduced graphene oxide on glioblastoma multiforme
cells, cultured in vitro as well as in tumor tissue in vivo. Moreover, rGO activated TP53 gene expression,
which is responsible for cellular protection and the stress response, and consequently increased the
expression of COX6 and CASP3 involved in apoptosis. Interestingly, the NQO1 gene, responsible for
quinone and nitroaromatic reduction and protection of p53 from proteasomal degradation, was activated.
This may indicate a new mechanism of the anticancer activity of graphene. However, flakes of rGO after
introduction to cells were agglomerated and randomly spread, which decreased its surface area and
interfered with the distribution of rGO within the tumor.
After functionalization with amino acids, rGO was distributed more specifically, and flakes of
graphene were less agglomerated. Undoubtedly, amino acids directed the distribution of graphene within
the tumor, playing the role of tailoring molecules. Moreover, arginine but not proline enhanced the
anticancer activity of rGO at the molecular level. The rGO + Arg molecule, however, did not increase
the expression of TP53 in comparison to rGO, but also did not increase the expression of MDM2 (a key
protein in binding and deactivating p53) or the MDM2/TP53 ratio in the tumor, suggesting that arginine
may block MDM2 expression. Furthermore, rGO + Arg did not diminish COX6 and CASP3 mRNA
expression, which were increased by rGO treatment, indicating that the pro-apoptotic character of
rGO was not reduced by arginine functionalization. The most important result was that rGO + Arg
strongly increased the expression of NQO1 in tumor tissue, which may have decreased the generation of
reactive oxygen.
Acknowledgments
This work was supported by the Polish National Research Council (grant 2011/03/B/NZ9/03387).
Author Contributions
Ewa Sawosz conceived, designed and performed the experiments, analysed data and wrote the paper;
Sławomir Jaworski helped in experiments and sample collection from in vivo and in vivo experiments;

Int. J. Mol. Sci. 2015, 16 25230
Marta Kutwin and Krishna Prasad Vadalasetty performed mRNA gene expression; Marta Grodzik
helped in analysing data and preparation of the paper; Mateusz Wierzbicki performed experiments with
cells; Natalia Kurantowicz and Barbara Strojny performed experiments witch chrioallantoic membrane;
Anna Hotowy performed total RNA isolation and cDNA preparation; Ludwika Lipińska and
Joanna Jagiełło characterized graphene particles and manufactured rGO and amino acid complexes; and
André Chwalibog conceived, designed experiments and wrote the paper.
Conflicts of Interest
The authors declare no conflict of interest.
References
1. Walker, C.; Baborie, A.; Crooks, D.; Wilkins, S.; Jenkinson, M.D. Biology, genetics and imaging
of glial cell tumours. Br. J. Radiol. 2011, 84, 90–106.
2. DeAngelis, L.M. Medical progress: Brain tumors. N. Engl. J. Med. 2001, 344, 114–123.
3. Parson, D.W.; Jones, S.; Zhang, X.; Lin, J.C.; Leary, R.J.; Angenendt, P.; Mankoo, P.; Carter, H.;
Siu, I.M.; Gallia, G.L.; et al. An Integrated Genomic Analysis of Human Glioblastoma Multiforme.
Science 2008, 321, 1807–1812.
4. Shakur, S.F.; Bit-Ivan, E.; Watkin, W.G.; Merrell, R.T.; Farhat, H.I. Multifocal and multicentric
glioblastoma with leptomeningeal gliomatosis: A case report and review of the literature.
Case Rep. Med. 2013, 2013, 132679.
5. Kesari, S. Understanding glioblastoma tumor biology: The potential to improve current diagnosis
and treatments. Semin. Oncol. 2011, 38, S2–S10.
6. Geim, A.K.; Novoselov, K.S. The rise of graphene. Nat. Mater. 2007, 6, 183–191.
7. Liu, Z.; Robinson, J.T.; Sun, X.; Dai, H. PEGylated nanographene oxide for delivery of
water-insoluble cancer drugs. J. Am. Chem. Soc. 2008, 130, 10876–10877.
8. Liu, J.; Cui, L.; Losic, D. Graphene and graphene oxide as new nanocarriers for drug delivery
applications. Acta Biomater. 2013, 9, 9243–9257.
9. Sun, X.M.; Liu, Z.; Welsher, K.; Robinson, J.T.; Godwin, A. Nano-graphene oxide for cellular
imaging and drug delivery. Nano Res. 2008, 1, 203–212.
10. Jaworski, S.; Sawosz, E.; Grodzik, M.; Winnicke, A.; Prasek, M.; Wierzbicki, M.; Chwalibog, A.
In vitro evaluation of the effects of graphene platelets on glioblastoma multiforme cells.
Int. J. Nanomed. 2013, 8, 413–420.
11. Fiorillo, M.; Verre, A.F.; Iliut, M.; Peiris-Pagés, M.; Ozsvari, B.; Gandara, R.; Cappello, A.R.;
Sotgia, F.; Vijayaraghavan, A.; Lisanti, M.P. Graphene oxide selectively targets cancer stem cells,
across multiple tumor types: Implications for non-toxic cancer treatment, via “differentiation-based
nano-therapy”. Oncotarget 2015, 6, 3553–3562.
12. Konios, D.; Stylianakis, M.M.; Stratakis, E.; Kymakis, E. Dispersion behaviour of graphene oxide
and reduced graphene oxide. J. Colloid Interface Sci. 2014, 430, 108–112.
13. Sawosz, E.; Jaworski, S.; Kutwin, M.; Hotowy, M.; Wierzbicki, M.; Grodzik, M.; Strojny, B.;
Lipinska, L.; Chwalibog, A. Toxicity of pristine graphene in experiments in a chicken embryo
model. Int. J. Nanomed. 2014, 9, 3913–3922.

Int. J. Mol. Sci. 2015, 16 25231
14. Jaworski, S.; Sawosz, E.; Kutwin, M.; Wierzbicki, M.; Hinzmann, M.; Grodzik, M.; Winnicka, A.;
Lipinska, L.; Wlodyga, K.; Chwalibog, A. In vitro and in vivo effects of graphene oxide and reduced
graphene oxide on glioblastoma multiforme. Int. J. Nanomed. 2015, 10, 1–12.
15. Marchesan, S.; Prato, M. Under the lens: Carbon nanotube and protein interaction at the nanoscale.
Chem. Commun. 2015, 51, 4347–4359.
16. Huges, Z.E.; Walsh, T.R. What makes a good graphene-binding peptide? Adsorption of amino acids
and peptides at aqueous graphene interfaces. J. Mater. Chem. B 2015, 3, 3211–3221.
17. Kay, B.K.; Williamson, M.P.; Sudol, M. The importance of being proline: The interaction of
proline-rich motifs in signaling proteins with their cognate domains. FASEB J. 2000, 14, 231–241.
18. Krane, S.M. The importance of proline residues in the structures stability and susceptibility to
proteolityc degradation of collagen. Amino Acids 2008, 35, 703–7010.
19. Betts, M.J.; Russell, R.B. Amino acids properties and consequences of substitution. In
Bioinformatics for Geneticists, 2nd ed.; Barnes, M.R., Gray, I.C., Eds.; Wiley: Hoboken, NJ, USA,
2003; pp. 311–343.
20. Hamasu, K.; Haraguchi, T.; Kabuki, Y.; Adachi, N.; Tomonaga, S.; Sato, H.; Denbow, D.M.;
Furuse, M. L-Proline is a sedative regulator of acute stress in the brain of neonatal chicks.
AMINO ACIDS 2009, 37, 377–382.
21. Phang, J.M.; Liu, W.; Hancock, C.; Christian, K.J. The proline regulatory axis and cancer.
Front. Oncol. 2012, 2, 60.
22. Phang, J.M.; Donald, S.P.; Pandhare, J.; Liu, Y. The metabolism of proline, a stress substrate
modulates carcinogenic pathway. Amino Acids 2008, 4, 726–745.
23. Bond, G.L.; Hu, W.; Levine, A.J. 2MDM2 is a central node in the p53 pathway: 12 years and
counting. Curr. Cancer Drug Targets 2005, 6, 3–8.
24. Murphy, M.E. Regulation of IAP (Inhibitor of Apoptosis) Gene Expression by the p53 Tumor
Expression Protein; Army Medical Research and Materiel Command Fort Detrick, Fox Chase
Cancer Center: Philadelphia, PA, USA, 2005.
25. Jansson, M.; Durant, S.T.; Cho, E.-C.; Sheahan, S.; Edelmann, M.; Kessler, B.; la Thangue, N.B.
Arginine methylation regulates the p53 response. Nat. Cell Biol. 2008, 10, 1431–1439.
26. Jeong, B.-S.; Hu, W.; Belyi, V.; Rabadan, R.; Levine, A.J. Differential levels of transcription of
p53-regulated genes by the arginine/proline polymorphism: p53 with arginine at codon 72 favors
apoptosis. FASEB J. 2010, 24, 1347–1353.
27. Lin, W.-T.; Yang, S.-C.; Chen, K.-T.; Huang, C.-C.; Lee, N.-Y. Protective effects of L-arginine
on pulmonary oxidative stress and antioxidant defenses during exhaustive exercise in rats.
Acta Pharmacol. Sin. 2005, 26, 992–999.
28. Yeatman, T.J.; Risley, G.L.; Brunson, M.E. Depletion of dietary arginine inhibits growth of
metastatic tumor. Arch. Surg. 1991, 126, 1376–1381.
29. Roomi, M.W.; Ivanov, V.; Kalinovsky, T.; Niedzwiecki, A.; Rath, M. Antitumor effect of ascorbic
acid, lysine, proline, arginine, and green tea extract on bladder cancer cell line T-24. Int. J. Urol.
2006, 13, 415–419.
30. Shu, X.; Liu, X.L.; Zhong, J.X.; Liu, J. L-Arginine enhance arginine deaminase induced human
lymphoma cell growth inhibition through NF-κBp65 and p53 expression in vitro. Eur. Rev. Med.
Pharmacol. Sci. 2014, 18, 2124–2131.
Int. J. Mol. Sci. 2015, 16 25232
31. Kurantowicz, N.; Sawosz, E.; Jaworski, S.; Kutwin, M.; Strojny, B.; Wierzbicki, M.; Szeliga, J.;
Hotowy, A.; Lipińska, L.; Kozinski, R.; et al. Interaction of graphene family materials with
Listeria monocytogenes and Salmonella enterica. Nanoscale Res. Lett. 2015, 10, 23.
32. Kumar, S.; Rai, S.B. Spectroscopic studies of L-arinine molecule. Indian J. Pure Appl. Phys. 2010,
48, 251–255.
33. Shan, C.; Yang, H.; Han, D.; Zhang, Q.; Ivasak, A.; Niu, L. Water-soluble graphene covalently
funcionalized by biocompatible poly-L-lysine. Langimuir 2009, 25, 12030–12033.
34. Singh, S.K.; Singh, M.K.; Kulkarni, P.P.; Sonkart, C.K.; Grácio, J.J.A. Amine-modified graphene:
Thrombo-protective safer alternative to graphene oxide for biomedical applications. ACS Nano
2012, 6, 2731–2740.
35. Hinzmann, M.; Jaworski, S.; Kutwin, M.; Jagiełło, J.; Koziński, R.; Wierzbicki, M.; Grodzik, M.;
Lipińska, L.; Sawosz, E.; Chwalibog, A. Nanoparticles containing allotropes of carbon have
genotoxic effects on glioblastoma multiforme cells. Int. J. Nanomed. 2014, 9, 2409–2417.
36. Liao, K.-H.; Lin, Y.-S.; Macosko, C.W.; Haynes, C.L. Cytotoxicity of graphene oxide and graphene
in human erythrocytes and skin fibroblasts. ACS Appl. Mater. Interfaces 2011, 3, 2607–2615.
37. Saebra, A.B.; Paula, A.J.; de Lima, R.; Alves, O.L.; Duran, N. Nanotoxicity of graphene and
graphene oxide. Chem. Res. Toxicol. 2014, 27, 159–168.
38. Bianco, A. Graphene: Safe or toxic? The two faces of the medal. Angew. Chem. Int. Ed. Engl. 2013,
52, 4986–4997.
39. Chang, Y.; Yang, S.-T.; Liu, J.-H.; Dong, E.; Wang, Y.; Cao, A.; Liu, Y.; Wang, H. In vitro toxicity
evaluation of graphene oxide on A549 cells. Toxicol. Lett. 2011, 200, 201–210.
40. Sanchez, V.C.; Jachak, A.; Hurt, R.H.; Kane, A.B. Biological Interactions of graphene-family
nanomaterials: An interdisciplinary review. Chem. Res. Toxicol. 2012, 25, 15–34.
41. Hu, W.; Peng, C.; Lv, M.; Li, X.; Zhang, Y.; Chen, N.; Fan, C.; Huang, Q. Protein corona-mediated
mitigation of cytotoxicity of graphene oxide. ACS Nano 2011, 5, 3693–3700.
42. Cohen-Tanugi, D.; Grossman, J.C. Water desalination across nanoporous graphene. Nano Lett.
2012, 12, 602–608.
43. Kottakis, F.; Polytarchou, C.; Foltopoulou, P.; Sanidas, I.; Kampranis, S.C.; Tsichlis, P.N. FGF-2
regulates cell proliferation, migration and angiogenesis through an NDY1/KDM2B-miR-101-EZH2
pathway. Mol. Cell 2011, 43, 285–298.
44. Murakami, M.; Nguyen, L.T.; Hatanaka, K.; Schachterle, W.; Chen, P.-Y.; Zhuang, Z.W.; Black, B.L.;
Simons, M. FGF-dependent regulation of VEGF receptor 2 expression in mice. J. Clin. Investig.
2011, 121, 2668–2678.
45. Delage, B.; Fennell, D.A.; Nicholson, L.; McNeish, I.; Lemoine, N.R.; Crook, T.; Schlosarek, P.W.
Arginine deprivation and argininosuccinate synthetase expression in the treatment of cancer.
Int. J. Cancer 2010, 126, 2762–2772.
46. Wierzbicki, M.; Sawosz, E.; Grodzik, M.; Prasek, M.; Jaworski, S.; Chwalibog, A. Comparison of
anti-angiogenic properties of pristine carbon nanoparticles. Nanoscale Res. Lett. 2013, 8, 195.
47. Bae, D.-G.; Gho, Y.-S.; Yoon, W.-H.; Chae, C.-B. Arginine-rich anti-vascular endothelial growth
factor peptides inhibit tumor growth and metastasis by blocking angiogenesis. J. Biol. Chem. 2000,
275, 13588–13596.

Int. J. Mol. Sci. 2015, 16 25233
48. Yeh, C.-L.; Pai, M.-H.; Li, C.-C.; Tsai, Y.-L.; Yeh, S.-L. Effect of arginine on angiogenesis induced
by human colon cancer: In vitro and in vivo studies. J. Nutr. Biochem. 2010, 21, 538–543.
49. Kettenmann, H.; Hanisch, U.K.; Verkhratsky, A. Physiology of microglia. Physiol. Rev. 2011, 91,
461–553.
50. Ross, D.; Kepa, J.K.; Winski, S.; Beall, H.D.; Anwar, A.; Siegel, D. NAD(P)H:Quinone
oxidoreductase 1 (NQO1): Chemoprotection, bioactivation, gene regulation and genetic
polymorphisms. Chem. Biol. Interact. 2000, 129, 77–97.
51. Qiu, Y.; Wang, Z.; Owens, A.C.; Kulaots, I.; Chen, Y.; Kane, A.B.; Hurt, R.H. Antioxidant
chemistry of graphene-based materials and its role in oxidation protection technology. Nanoscale
2014, 6, 11744–11755.
52. Dinkova-Kostova, A.T.; Talay, P. NAD(P)H:Quinone acceptor oxidoreductase 1 (NQO1), a
multifunctional antioxidant enzyme and exceptionally versatile cytoprotector. Arch. Biochem. Biophys.
2010, 501, 116–123.
53. Kung, C.P.; Khaku, S.; Jennis, M.; Murphy, M.E. Identification of TRIML2, a novel p53 target,
that enhances p53 SUMOylation and regulates the transactivation of pro-apoptotic genes.
Mol. Cancer Res. 2015, 13, 250–262.
54. Bonini, P.; Cicconi, S.; Cardinale, A.; Vitale, C.; Serafino, A.L.; Ciotti, M.T.; Marlier, N.J.-L.
Oxidative stress induces p53-mediated apoptosis in glia: p53 transcription- independent way to die.
J. Neurosci. Res. 2004, 75, 83–95.
55. Meulmeester, E.; Jochemsen, A.G. p53: A guide to apoptosis. Curr. Cancer Drug Targets 2008, 8,
87–97.
56. Vassilev, L.T.; Vu, B.T.; Graves, B.; Carvajal, D.; Podlaski, F.; Filipovic, Z.; Kong, N.; Kammlott, U.;
Lukacs, C.; Klein, C.; et al. In vivo activation of the p53 pathway by small-molecule antagonists of
MDM2. Science 2004, 303, 844–848.
57. Ventura, A.; Kirsch, D.G.; McLaughlin, M.E.; Tuveson, D.A.; Grimm, J.; Lintault, L.; Newman, J.;
Reczek, E.E.; Weissleder, R.; Jacks, T. Restoration of p53 function leads to tumour regression
in vivo. Nature 2007, 8, 661–665.
58. Lei, H.Z.; Mi, L.J.; Zhou, X.J.; Lei, H.; Mi, L.; Zhou, X.; Chen, J.; Hu, J.; Guo, S.; Zhang, Y.
Adsorption of double-stranded DNA to graphene oxide preventing enzymatic digestion. Nanoscale
2011, 3, 3888–3892.
59. Green, D.R.; Reed, J.C. Mitochondria and apoptosis. Science 1998, 281, 1309–1312.
60. Haupt, S.; Berger, M.; Goldberg, Z.; Haupt, Y. Apoptosis—The p53 network. J. Cell Sci. 2003,
116, 4077–4085.
© 2015 by the authors; licensee MDPI, Basel, Switzerland. This article is an open access article
distributed under the terms and conditions of the Creative Commons Attribution license
(http://creativecommons.org/licenses/by/4.0/).