granulometric and sedimentologic study of beach sediments, … · 2019-03-27 · 4.2....
TRANSCRIPT
International Journal of Geosciences, 2019, 10, 295-316 http://www.scirp.org/journal/ijg
ISSN Online: 2156-8367 ISSN Print: 2156-8359
DOI: 10.4236/ijg.2019.103017 Mar. 28, 2019 295 International Journal of Geosciences
Granulometric and Sedimentologic Study of Beach Sediments, Lagos, Southwestern Nigeria
Olusiji S. Ayodele1, Henry Y. Madukwe2
1Department of Applied Geology, The Federal University of Technology, Akure, Nigeria 2Department of Geology, Ekiti State University, Ado-Ekiti, Nigeria
Abstract
Grain size analysis and sedimentology of beach sediments in Lagos, south-western Nigeria have been studied. Ten fresh beach sediment samples were randomly collected at a depth of 25 cm - 40 cm along Lagos and Badagry axis. The sediments were analyzed by wet sieving method. Ternary diagrams indi-cate that the beach sediment is silty. The graphic mean ranges from 1.02ф (medium grained) to 2.21ф (fine grained) with an average of 1.61ф (medium grained). The preponderance of medium grained sediments and lack of coarse sands suggest moderate to high energy conditions of deposition. Graphic standard deviation ranges from 0.01ф - 0.81ф (very well sorted to moderately well sorted), with an average of 0.52ф (moderately well sorted). This is probably due to rapid back and forth flow of the depositing medium. Inclusive graphic skewness ranges from −0.38 to 1.41 (strongly coarse skewed to strongly fine skewed), with an average of 0.41 (strongly fine skewed). The graphic kurtosis values are between 0.44 and 1.37, which indicates very pla-tykurtic to leptokurtic; with an average of 0.78 (platykurtic). This variation suggests that part of the sediment achieved its sorting elsewhere in high-energy environment. Histograms of the sediments exhibit both unimod-al and bimodal trends. The arrangement is dominantly asymmetrical with varying modal class, which could be attributed to variation in the energy of the transporting medium. Bivariate plots (simple skewness vs. standard devi-ation and mean size vs. standard deviation) show the samples plotting mainly in the river sand zone, which suggests that the sediments were initially river sediments before reworking to the present site; other parameters that discri-minate between river channel deposits, overbank deposits and overbank-pool deposits show the beach sediments plotting in the river channel zone. Linear discriminant functions analysis indicates a shallow marine beach environ-ment in agitated water, with inputs from aeolian source. The Passega C-M diagram suggests suspension and rolling as the mode of deposition.
How to cite this paper: Ayodele, O.S. and Madukwe, H.Y. (2019) Granulometric and Sedimentologic Study of Beach Sediments, Lagos, Southwestern Nigeria. International Journal of Geosciences, 10, 295-316. https://doi.org/10.4236/ijg.2019.103017 Received: January 28, 2019 Accepted: March 25, 2019 Published: March 28, 2019 Copyright © 2019 by author(s) and Scientific Research Publishing Inc. This work is licensed under the Creative Commons Attribution International License (CC BY 4.0). http://creativecommons.org/licenses/by/4.0/
Open Access

O. S. Ayodele, H. Y. Madukwe
DOI: 10.4236/ijg.2019.103017 296 International Journal of Geosciences
Keywords
Lagos, Beach Sediments, Standard Deviation, Skewness, Kurtosis, Graphic Mean
1. Introduction
Analysis of grain size distribution has been widely used by sedimentologists to classify sedimentary environments and elucidate transport dynamics. Grain size frequency distribution and textural factors may reflect the mode of transporta-tion and depositional history of an area. Several workers have endeavoured to infer depositional environment and hydrodynamics from grain size data [1]-[17]. Grain size is also an important abiotic component of the dune ecosys-tem. The grain sizes of sediments provide an indication of the shear stress that must be applied by the medium to initiate and sustain particle movement. [18] found that the mean particle size of sand was the most important factor influen-cing vegetation composition, structure and distribution in the Malindi Bay coastal sand dunes in Kenya. Reference [18] also noted that geomorphological units consisting of fine grained sand had high species diversity in contrast to those with medium-grained sand which were mostly not vegetated or sparsely vegetated; these differences may be accompanied by changes in chemical com-position and/or substrate processes. The foreshore sediment is generally influ-enced by coastal processes, especially wave action and beach morphology (beach-face slope and shoreline orientation). The grain size characteristics in in-tertidal zone are changing with sediment transport especially disposal and re-moval of fine sediments. In tide dominated beaches the tidal current can play an important role to change the textural characteristics of beach sediments in an estuarine zone. Reference [19] identified that many rivers in Asia play an im-portant role in carriage of sediment loads. Reference [20] also discovered that the ebb tidal sediment fluxes are higher than flood tidal fluxes during spring tid-al cycles. The objectives of this research are to determine the texture of the beach sediments in the study area; infer the textural attributes of the sediments and the likely source(s) of the sediments and determine the hydrodynamic regime under which the sediments were deposited.
2. Location, Accessibility and Drainage System
The study area is located within latitudes 6˚261'17.94" to 6˚23'22.014"N and longitudes 3˚51'14.154"E to 2˚48'59.658"E (Figure 1). The study area also in-cludes the beaches around Dahomey basin at Badagry-Seme and Lagos, south-western Nigeria. Badagry is a coastal town in Lagos state, Nigeria, and it is be-tween the city of Lagos and the border with Benin at Seme. The study areas are easily accessible by motorable roads and tracks, Figure 2 shows the sample lo-cations. Lagos State borders Ogun state to the North East, Atlantic Ocean to the

O. S. Ayodele, H. Y. Madukwe
DOI: 10.4236/ijg.2019.103017 297 International Journal of Geosciences
Figure 1. Generalized geological map showing the study area. Inset: Map of Africa showing Nigeria, modified from [22].
Figure 2. Showing the sample locations (modified after [24]).
O. S. Ayodele, H. Y. Madukwe
DOI: 10.4236/ijg.2019.103017 298 International Journal of Geosciences
South; it stretches for about 180 km along the Atlantic coast and also borders the Republic of Benin to the west. Coastal area of Lagos such as the Badagry are si-tuated in flat coastal plains and most areas in the state do not rise above 700 meters above sea level. The area has about 22% of the nation’s coastline mostly in Epe, Badagry, Ikorodu, and Lagos. The state falls within the marine, brackish and freshwater ecological zones. Principal water bodies including Lagos, Lekki, Ologe Lagoons, Badagry and Porto Novo creeks, Kuramo waters and the Rivers Yewa, Ogun and Osun. The drainage system of the State is characterized by a maze of lagoons and waterways which constitute about 22 percent of 787 sq∙kms of the State total landmass. The major water bodies are the Lagos and Lekki Lagoons, Yewa and Ogun Rivers. Others are Ologe, Lagoon, Kuramo Waters, Badagry, Five Cowries and Omu. Water is the most significant topographical feature in Lagos state. Water and wetlands cover over 40% of the total area within the state and an additional 12% is subject to seasonal flooding [21].
3. Geology of the Study Area
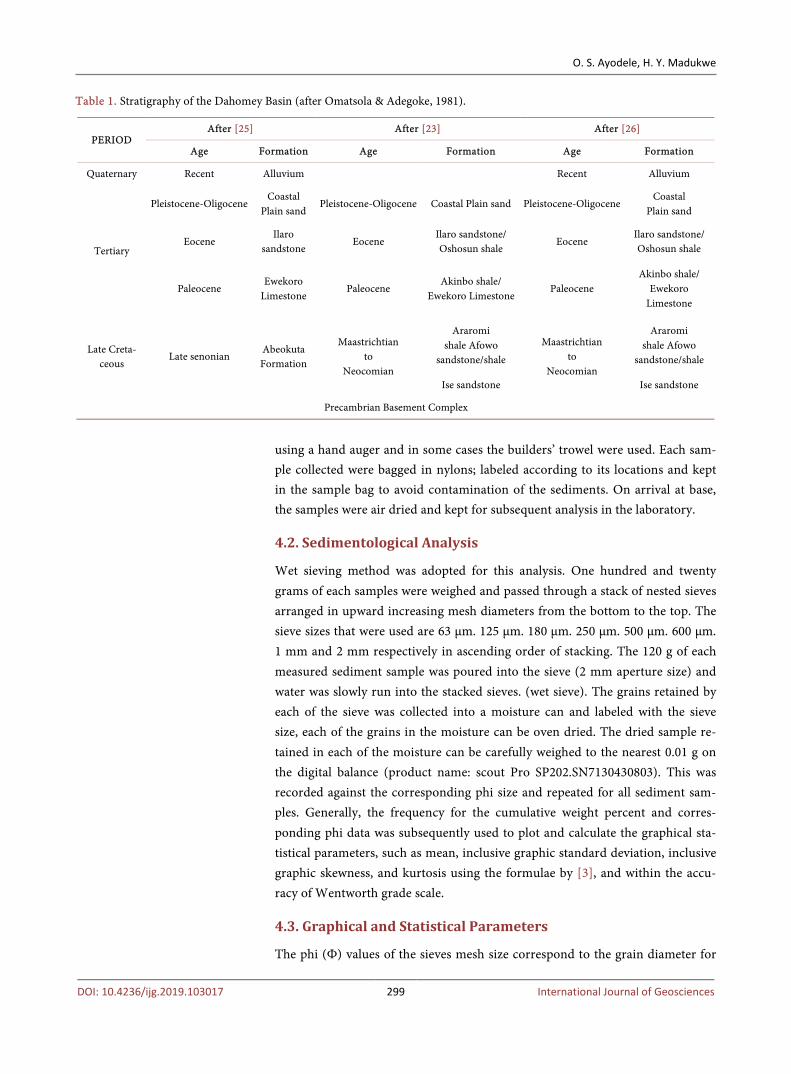
Lagos lies on the Dahomey basin of West Africa, which is situated just west of the Niger-Delta basin; both basins are low lying. The Dahomey basin extends beyond Nigeria and like the Niger Delta, seems to have oil deposits, although the former is far less explored than the latter. The continental basin of the former is not as extensive and the sea bed slopes away relatively steeply from shore, while in the central Niger Delta the seabed slopes away gently making for a wider area continental shelf. The geology of the study area is mainly sedimentary of tertiary and quaternary sediments. Tertiary sediments are unconsolidated sandstones, grits with mudstone band and sand with layers of clay. Quaternary sediments are recent deltaic sands, mangrove swamps and alluvium near the coast. The state is located on sedimentary rock mainly of sand and alluvium. The major soil groups are juvenile, organic-hydromorphic and ferrallitic soils. The base-ment rocks that underline the basin line are titled towards the south Atlantic and have been faulted into horsts and graben structures [23]. The li-tho-stratigraphy of the basin has been grouped into the following namely: The Abeokuta group (oldest), Ewekoro formation, Akinbo formation, Ososhun formation, Ilaro formation, coastal plain sands and Alluvium (recent) as shown in Table 1.
4. Methodology
4.1. Sampling Technique
Ten (10) samples were randomly collected from beaches in Lagos State (Atica-nElegushi, Eleko and Suntan). All samples were collected from the beach front (beach surface) after removing the overburden, sampling was done at a distance of at least about 50 m away from each station at a depth of 25 cm - 40 cm. Global Positioning System (GPS) was employed to locate the precise geographical loca-tions of sample points. At each station, beach sediment samples were collected
O. S. Ayodele, H. Y. Madukwe
DOI: 10.4236/ijg.2019.103017 299 International Journal of Geosciences
Table 1. Stratigraphy of the Dahomey Basin (after Omatsola & Adegoke, 1981).
PERIOD After [25] After [23] After [26]
Age Formation Age Formation Age Formation
Quaternary Recent Alluvium Recent Alluvium
Tertiary
Pleistocene-Oligocene Coastal
Plain sand Pleistocene-Oligocene Coastal Plain sand Pleistocene-Oligocene
Coastal Plain sand
Eocene Ilaro
sandstone Eocene
Ilaro sandstone/ Oshosun shale
Eocene Ilaro sandstone/ Oshosun shale
Paleocene Ewekoro
Limestone Paleocene
Akinbo shale/ Ewekoro Limestone
Paleocene Akinbo shale/
Ewekoro Limestone
Late Creta-ceous
Late senonian Abeokuta Formation
Maastrichtian to
Neocomian
Araromi shale Afowo
sandstone/shale
Maastrichtian to
Neocomian
Araromi shale Afowo
sandstone/shale
Ise sandstone Ise sandstone
Precambrian Basement Complex
using a hand auger and in some cases the builders’ trowel were used. Each sam-ple collected were bagged in nylons; labeled according to its locations and kept in the sample bag to avoid contamination of the sediments. On arrival at base, the samples were air dried and kept for subsequent analysis in the laboratory.
4.2. Sedimentological Analysis
Wet sieving method was adopted for this analysis. One hundred and twenty grams of each samples were weighed and passed through a stack of nested sieves arranged in upward increasing mesh diameters from the bottom to the top. The sieve sizes that were used are 63 µm. 125 µm. 180 µm. 250 µm. 500 µm. 600 µm. 1 mm and 2 mm respectively in ascending order of stacking. The 120 g of each measured sediment sample was poured into the sieve (2 mm aperture size) and water was slowly run into the stacked sieves. (wet sieve). The grains retained by each of the sieve was collected into a moisture can and labeled with the sieve size, each of the grains in the moisture can be oven dried. The dried sample re-tained in each of the moisture can be carefully weighed to the nearest 0.01 g on the digital balance (product name: scout Pro SP202.SN7130430803). This was recorded against the corresponding phi size and repeated for all sediment sam-ples. Generally, the frequency for the cumulative weight percent and corres-ponding phi data was subsequently used to plot and calculate the graphical sta-tistical parameters, such as mean, inclusive graphic standard deviation, inclusive graphic skewness, and kurtosis using the formulae by [3], and within the accu-racy of Wentworth grade scale.
4.3. Graphical and Statistical Parameters
The phi (Ф) values of the sieves mesh size correspond to the grain diameter for

O. S. Ayodele, H. Y. Madukwe
DOI: 10.4236/ijg.2019.103017 300 International Journal of Geosciences
each sieve fraction. Since the millimeter and micron meter are usually written on the sieves, a phi-millimeter conversation was done using the relation below by [3]:
log 2DΦ = −
where D = diameter (in mm) of the particle. The cumulative weight percentages were plotted against the respective grain
sizes in phi units on a log-linear graph. The cumulative frequently curve was completed and value of 5, 16, 25, 50, 75, 85 and 95 percentiles were recorded. The grain size parameters such as Mean (Mz), Standard Deviation (σ1), skew-ness (Sk1) kurtosis (KG) were calculated using the formulae provided by [3].
Also, histograms were plotted with the percentages of the weights retained on the ordinate, and their corresponding phi units on the abscissa. This is the main device used to display sedimentological data. It represents frequency by rectan-gular blocks, in a series of steps like bars each representing a frequency distribu-tion of the grain size classes, especially the modal class. This method is pictorial and cannot be used for the determination of any statistical parameters as the shape is greatly affected by the sieve size interval chosen. Nevertheless, it is of value in plotting distribution of sediments on a map or stratigraphic section as the height of the columns may be more easily compared visually than if the data were plotted as cumulative curves.
Statistical Parameters of Grain Size The following statistical measures defined by [3], were calculated from the cu-mulative plot such as graphic means (Mz), inclusive graphic standard deviation, (σ1), inclusive graphic skewness (SK1), kurtosis (KG). Precise measurement of average grain size sorting and other frequency distribution properties required for valid interpretation are necessary. This is so modeled to deduce accurately the history of transportation and sedimentation of the sands and the nature of their depositional environments [3].
1) Graphic Means (Mz) According to [27], the best graphic measures of determining overall size is the
graphic mean given by the formula;
16 50 84Mz3
φ φ φ+ +=
Graphic mean Mz represent the average size distribution of the entire sedi-ments. The graph mean for sediments distribution along Lagos beach was calcu-lated from the log-normal graph plotted for the grain size distribution and clas-sified according to the system of [28]. Reference [28] classified sands into 3 ma-jor nomenclatures namely; coarse sand, medium sand and fine sand. Coarse sand has the phi values ranging from −1 to +1, the medium grained sand varies from +1 to +2 while the fine grained sand ranges from +2 to +4. The sand size is a direct indication of the medium of transportation and deposition. Coarse sands are transported as bed loads and deposited by traction current, medium
O. S. Ayodele, H. Y. Madukwe
DOI: 10.4236/ijg.2019.103017 301 International Journal of Geosciences
sands are deposited by means of sortation while fine sands are transported as Aeolian sands and deposited by suspension. This parameter (graphic mean), measures the average grain size of the particles’ population in terms of energy and also; indicate the average kinetic energy of the depositing energy. According to [11], the average grain size is also influenced by the availability of this size as the sources adopting the standard description presented by [28].
2) Inclusive Graphic Standard Deviation (Σ1) Standard deviation is a measure and mathematical expression of sorting [29].
The sorting of a given population is a measure of the range of grain-size present and the magnitude of these sizes around the mean sizes. Standard deviation val-ues reflect fluctuations in the kinetic energy and hence, the velocity of the depo-sitional agent [11]. Mathematically, the inclusive graphic standard deviation is imputed as [3]:
184 16 95 5
4 6.6σ Φ +Φ Φ +Φ
= +
Measurements of sorting values for a large number of sediments have been suggested and the classification scale for sorting is based on [30].
3) Determination of Skewness Skewness is the analysis of grain distribution of sediment at the environment
of deposit as fine or coarse (usually represented mathematically as positive or negative skewness). Graphic skewness as a measure of skewness given by the formula [1]:
16 84 2 50SKG84 16
Φ +Φ + Φ=
Φ −Φ
This measures the displacement of the medium from the average of the Φ16 and Φ84 point expressed as a fraction of the standard deviation, However, two samples may have the same average grain size and sorting but may be quite dif-ferent to their degrees of symmetry. The inclusive graphic skewness (SK1), measures the asymmetry of a curve. It marks the position of the mean in relation to the median [11]. A given size population that has a tail of excess fine particles is said to be positively skewed while one with tail of excess is said to be negative-ly skewed. Reference [3] gives the mathematical expression as:
( ) ( )16 84 2 50 5 95 2 50SK12 84 16 2 95 5
Φ +Φ + Φ Φ +Φ + Φ= +
Φ −Φ Φ −Φ
This is the best skewness measure to use because it determines the skewness not only “tails” of the curve, but also of the central portion. The tails of the curve basically show the critical differences between samples. Skewness values should always be recorded with a positive or negative sign to avoid possible confusions. Symmetrical curves have a skewness equal to 0.00; those with a large proportion of fine material are positively skewed; those with a large proportion of coarse material are negatively skewed.
4) Determination of Kurtosis

O. S. Ayodele, H. Y. Madukwe
DOI: 10.4236/ijg.2019.103017 302 International Journal of Geosciences
Kurtosis is the measure of the peakedness of curves and is a valuable test normality of a distribution [3]. Kurtosis has been discouraged as a means of de-scribing flatness or peakedness of any frequency curve. It therefore measures the sorting ratio at the extremes of the distribution rather than peakedness of the frequency curves, according to [3] who also gave description of KG values.
Mathematically,
( )95 5KG
2.44 75 25Φ +Φ
=Φ −Φ
5. Results and Discussion
Field description of the various samples collected are presented in Table 2. The table shows the field characteristics of the beach sediment samples in terms of colour, texture, geographical position, elevation and locality. Granulometric analysis provides quantitative information when a comparison of the character is required from sediments deposited within a known environment, such as a beach or along a river. It is therefore most commonly used in the analysis and quantification of present-day processes of transport and deposition [31].
5.1. Frequency Diagrams
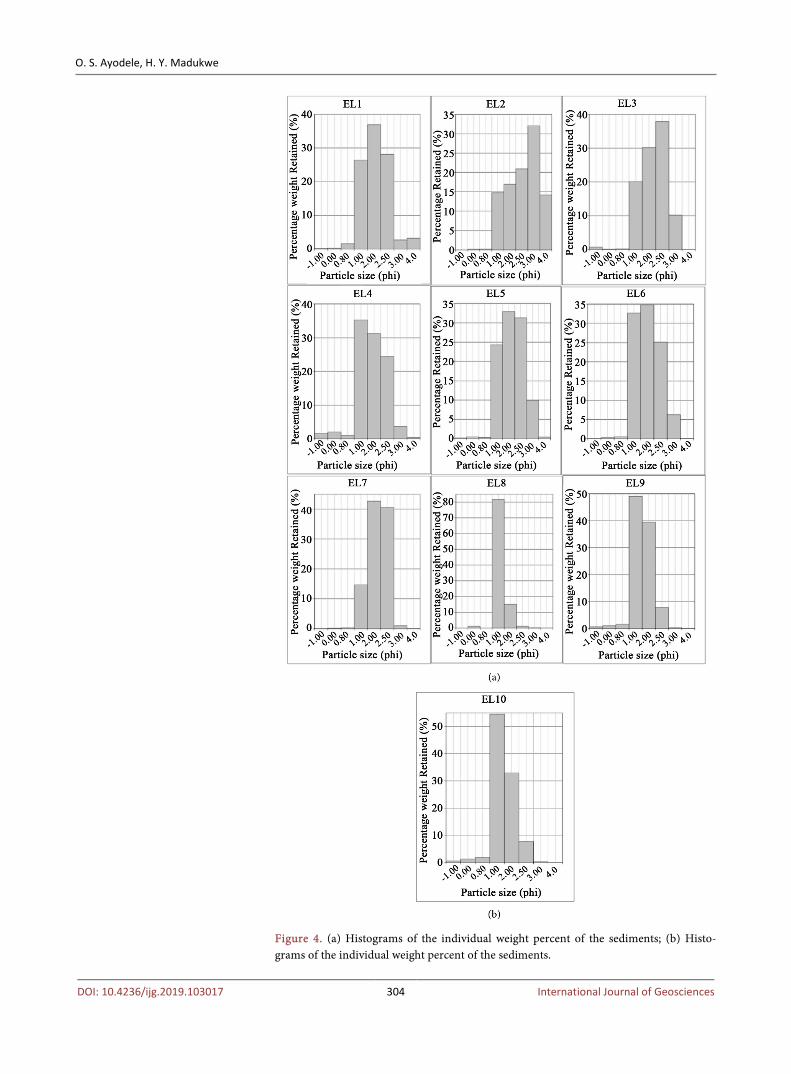
The frequency diagrams show the modal distribution of the sediments, while the curves give description of the transport medium of the sediments. Figure 3(a) and Figure 3(b) shows the cumulative curve of the studied samples typical of beach sands. Figure 4(a) and Figure 4(b) are histograms of the individual weight percent of the sediments exhibiting both unimodal and bimodal trends. The histogram is a reflection of the source of the sediments. Most of the stations are bimodal, with peaks ranging from over 30% to over 80% at L8. L2 shows domination by a fine population and is attributed to the deposition of sediments primarily by waves and currents. The bimodality is ascribed to discharge of
Table 2. Field description of the beach sediments.
Sample ID Beach Colour Texture Latitude Longitude Elevation (m) Accuracy (m)
L1 Eleko Brown Fine Grained 6˚26'17.94''N 3˚51'14.154''E 6 2.6
L2 Eleko Light Brown Medium - Fine Grained 6˚26'16.584''N 3˚51'56.76''E 12.4 3.1
L3 Atican Brown Medium - Coarse Grained 6˚25'28.824''N 3˚35''56.922''E 71.9 2.4
L4 Elegushi Brown Fine Grained 6˚25'19.584''N 3˚29'8.928''E 3 3.1
L5 Suntan Brown Medium - Coarse Grained 6˚23'26.538''N 2˚49'57.036''E 8.2 1.7
L6 Suntan Brown Medium - Coarse Grained 6˚23'25.704''N 2˚49'48.372''E 5.3 2.2
L7 Suntan Brown Medium - Coarse Grained 6˚23'24.024''N 2˚49'24.372''E 5.6 2.7
L8 Suntan Brown Medium - Coarse Grained 6˚23'23.658''N 2˚49'18.69''E 2.4 2.7
L9 Suntan Brown Fine Grained 6˚23'22.95''N 2˚49'10.46''E 1.8 2.2
L10 Suntan Brown Medium Grained 6˚23'22.014''N 2˚48'59.658''E 1 2.5

O. S. Ayodele, H. Y. Madukwe
DOI: 10.4236/ijg.2019.103017 303 International Journal of Geosciences
Figure 3. (a) Cumulative curve of the studied samples; (b) Cumulative curve of the studied samples.
O. S. Ayodele, H. Y. Madukwe
DOI: 10.4236/ijg.2019.103017 304 International Journal of Geosciences
Figure 4. (a) Histograms of the individual weight percent of the sediments; (b) Histo-grams of the individual weight percent of the sediments.
O. S. Ayodele, H. Y. Madukwe
DOI: 10.4236/ijg.2019.103017 305 International Journal of Geosciences
sediments from rivers around the beach. The unimodality reflects the lack of sediment deposition from rivers. The peak is dominantly recorded on 1.0, 2.0 and 2.5ϕ sizes, showing that the beach is predominantly medium grained sand and slightly fine sand. The frequency curves reflect the medium of deposition. The dominant mediums of deposition of the sediments are current and wave. L2 and L8 showed no record of coarse sediments deposition which is a reflection of tidal change in that area of the beach. The outlay is dominantly asymmetrical with varying modal class, which could be attributed to variation in the energy of the transporting medium.
5.2. Textural Distribution
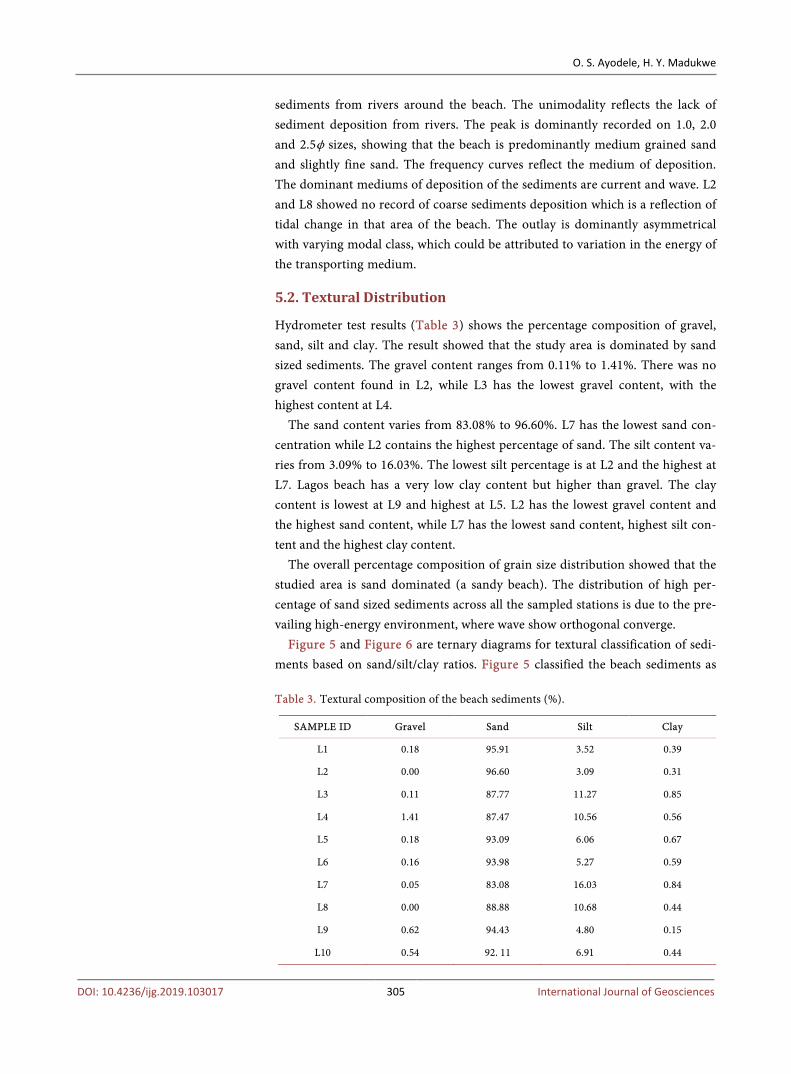
Hydrometer test results (Table 3) shows the percentage composition of gravel, sand, silt and clay. The result showed that the study area is dominated by sand sized sediments. The gravel content ranges from 0.11% to 1.41%. There was no gravel content found in L2, while L3 has the lowest gravel content, with the highest content at L4.
The sand content varies from 83.08% to 96.60%. L7 has the lowest sand con-centration while L2 contains the highest percentage of sand. The silt content va-ries from 3.09% to 16.03%. The lowest silt percentage is at L2 and the highest at L7. Lagos beach has a very low clay content but higher than gravel. The clay content is lowest at L9 and highest at L5. L2 has the lowest gravel content and the highest sand content, while L7 has the lowest sand content, highest silt con-tent and the highest clay content.
The overall percentage composition of grain size distribution showed that the studied area is sand dominated (a sandy beach). The distribution of high per-centage of sand sized sediments across all the sampled stations is due to the pre-vailing high-energy environment, where wave show orthogonal converge.
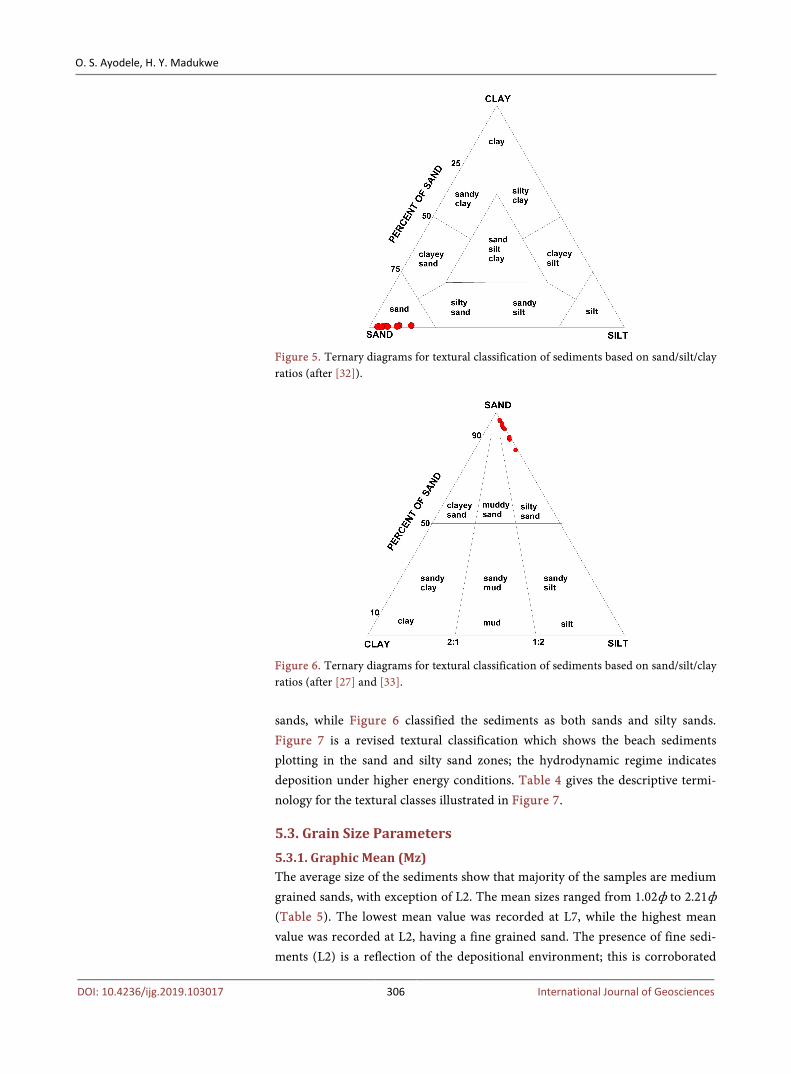
Figure 5 and Figure 6 are ternary diagrams for textural classification of sedi-ments based on sand/silt/clay ratios. Figure 5 classified the beach sediments as Table 3. Textural composition of the beach sediments (%).
SAMPLE ID Gravel Sand Silt Clay
L1 0.18 95.91 3.52 0.39
L2 0.00 96.60 3.09 0.31
L3 0.11 87.77 11.27 0.85
L4 1.41 87.47 10.56 0.56
L5 0.18 93.09 6.06 0.67
L6 0.16 93.98 5.27 0.59
L7 0.05 83.08 16.03 0.84
L8 0.00 88.88 10.68 0.44
L9 0.62 94.43 4.80 0.15
L10 0.54 92. 11 6.91 0.44
O. S. Ayodele, H. Y. Madukwe
DOI: 10.4236/ijg.2019.103017 306 International Journal of Geosciences
Figure 5. Ternary diagrams for textural classification of sediments based on sand/silt/clay ratios (after [32]).
Figure 6. Ternary diagrams for textural classification of sediments based on sand/silt/clay ratios (after [27] and [33]. sands, while Figure 6 classified the sediments as both sands and silty sands. Figure 7 is a revised textural classification which shows the beach sediments plotting in the sand and silty sand zones; the hydrodynamic regime indicates deposition under higher energy conditions. Table 4 gives the descriptive termi-nology for the textural classes illustrated in Figure 7.
5.3. Grain Size Parameters
5.3.1. Graphic Mean (Mz) The average size of the sediments show that majority of the samples are medium grained sands, with exception of L2. The mean sizes ranged from 1.02ф to 2.21ф (Table 5). The lowest mean value was recorded at L7, while the highest mean value was recorded at L2, having a fine grained sand. The presence of fine sedi-ments (L2) is a reflection of the depositional environment; this is corroborated

O. S. Ayodele, H. Y. Madukwe
DOI: 10.4236/ijg.2019.103017 307 International Journal of Geosciences
Figure 7. Ternary diagram for a revised textural classification of hydrodynamic subdivi-sions based on sand/silt/clay ratios. (based on [34]). Table 4. Letter-number code and descriptive terminology for the 25 textural classes based on sand/silt/clay ratios as defined in Figure 7 [34].
Code Textural Class Code Textural class S Sand D-I Extremely silty slightly sandy mud
A-I Slightly silty sand D-II Very silty slightly sandy mud A-II Slightly clayey sand D-III Silty slightly sandy mud
D-IV Clayey slightly sandy mud B-I Very silty sand D-V Very clayey slightly sandy mud B-II Silty sand D-VI Extremely clayey slightly sandy mud B-III Clayey sand B-IV Very clayey sand E-I Silt
E-II Slightly clayey silt C-I Extremely silty sandy mud E-III Clayey silt C-II Very silty sandy mud E-IV Silty clay C-III Silty sandy mud E-V Slightly silty clay C-IV Clayey sandy mud E-VI Clay C-V Very clayey sandy mud C-VI Extremely clayey sandy mud
Table 5. Data summary of grain size parameters for the beach sediments.
Sample ID Mean Interpretation Sorting Interpretation Kurtosis Interpretation Skewness Interpretation
L1 1.63 Medium grained 0.65 Moderately well sorted 0.68 platykurtic 0.004 Near symmetrical
L2 2.21 Fine grained 0.81 Moderately sorted 0.70 platykurtic 0.44 Strongly fine skewed
L3 1.82 Medium grained 0.73 Moderately sorted 0.72 platykurtic −0.38 Strongly coarse skewed
L4 1.55 Medium grained 0.64 Moderately well sorted 0.57 Very Platykurtic 0.32 Strongly fine skewed
L5 1.85 Medium grained 0.57 Moderately well sorted 0.44 Very Platykurtic 1.44 Strongly fine skewed
L6 1.63 Medium grained 0.62 Moderately well sorted 0.53 Very Platykurtic 0.23 Fine skewed
L7 1.02 Medium grained 0.08 Very well sorted 1.37 Leptokurtic 0.60 Strongly fine skewed
L8 1.92 Medium grained 0.58 Moderately well sorted 0.77 Platykurtic −0.30 coarse skewed
L9 1.15 Medium grained 0.50 Well sorted 1.16 Leptokurtic 0.84 Strongly fine skewed
L10 1.27 Medium grained 0.01 Very well sorted 0.82 platykurtic 0.93 Strongly fine skewed
O. S. Ayodele, H. Y. Madukwe
DOI: 10.4236/ijg.2019.103017 308 International Journal of Geosciences
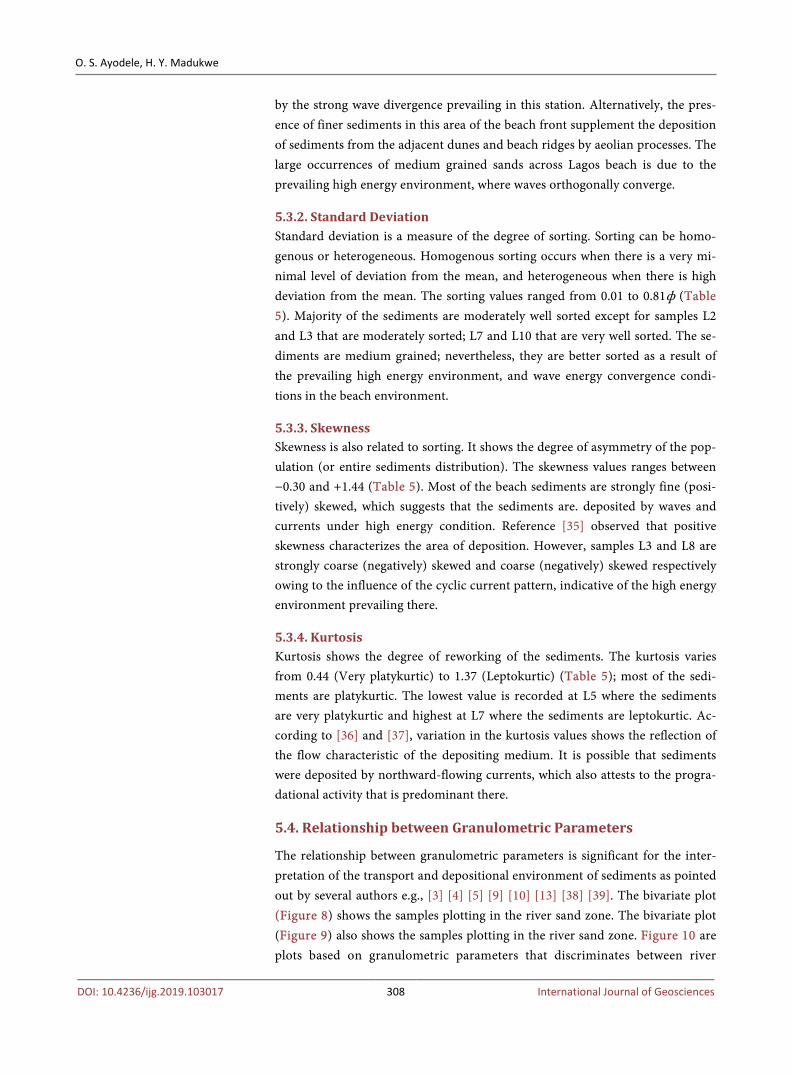
by the strong wave divergence prevailing in this station. Alternatively, the pres-ence of finer sediments in this area of the beach front supplement the deposition of sediments from the adjacent dunes and beach ridges by aeolian processes. The large occurrences of medium grained sands across Lagos beach is due to the prevailing high energy environment, where waves orthogonally converge.
5.3.2. Standard Deviation Standard deviation is a measure of the degree of sorting. Sorting can be homo-genous or heterogeneous. Homogenous sorting occurs when there is a very mi-nimal level of deviation from the mean, and heterogeneous when there is high deviation from the mean. The sorting values ranged from 0.01 to 0.81ф (Table 5). Majority of the sediments are moderately well sorted except for samples L2 and L3 that are moderately sorted; L7 and L10 that are very well sorted. The se-diments are medium grained; nevertheless, they are better sorted as a result of the prevailing high energy environment, and wave energy convergence condi-tions in the beach environment.
5.3.3. Skewness Skewness is also related to sorting. It shows the degree of asymmetry of the pop-ulation (or entire sediments distribution). The skewness values ranges between −0.30 and +1.44 (Table 5). Most of the beach sediments are strongly fine (posi-tively) skewed, which suggests that the sediments are. deposited by waves and currents under high energy condition. Reference [35] observed that positive skewness characterizes the area of deposition. However, samples L3 and L8 are strongly coarse (negatively) skewed and coarse (negatively) skewed respectively owing to the influence of the cyclic current pattern, indicative of the high energy environment prevailing there.
5.3.4. Kurtosis Kurtosis shows the degree of reworking of the sediments. The kurtosis varies from 0.44 (Very platykurtic) to 1.37 (Leptokurtic) (Table 5); most of the sedi-ments are platykurtic. The lowest value is recorded at L5 where the sediments are very platykurtic and highest at L7 where the sediments are leptokurtic. Ac-cording to [36] and [37], variation in the kurtosis values shows the reflection of the flow characteristic of the depositing medium. It is possible that sediments were deposited by northward-flowing currents, which also attests to the progra-dational activity that is predominant there.
5.4. Relationship between Granulometric Parameters
The relationship between granulometric parameters is significant for the inter-pretation of the transport and depositional environment of sediments as pointed out by several authors e.g., [3] [4] [5] [9] [10] [13] [38] [39]. The bivariate plot (Figure 8) shows the samples plotting in the river sand zone. The bivariate plot (Figure 9) also shows the samples plotting in the river sand zone. Figure 10 are plots based on granulometric parameters that discriminates between river

O. S. Ayodele, H. Y. Madukwe
DOI: 10.4236/ijg.2019.103017 309 International Journal of Geosciences
Figure 8. Depo-environmental discrimination bivariate plot of the beach sediments modified from [3].
Figure 9. Depo-environmental discrimination bivariate plot of beach sediments, mod-ified after [10]. channel deposits, overbank deposits and overbank-pool deposits; majority of the beach sediments plotted in the river channel zone. According to [40], the over-lapping of two fields (river channel deposits and overbank deposit) in Figure 10(c) corresponds to the best sorted grain-size which is approximately 2Ф (0.25 mm). The boundary between the two facies in Figure 10(b) is, similarly, si-tuated in the zone of the best sorting and the zero value of skewness [40].
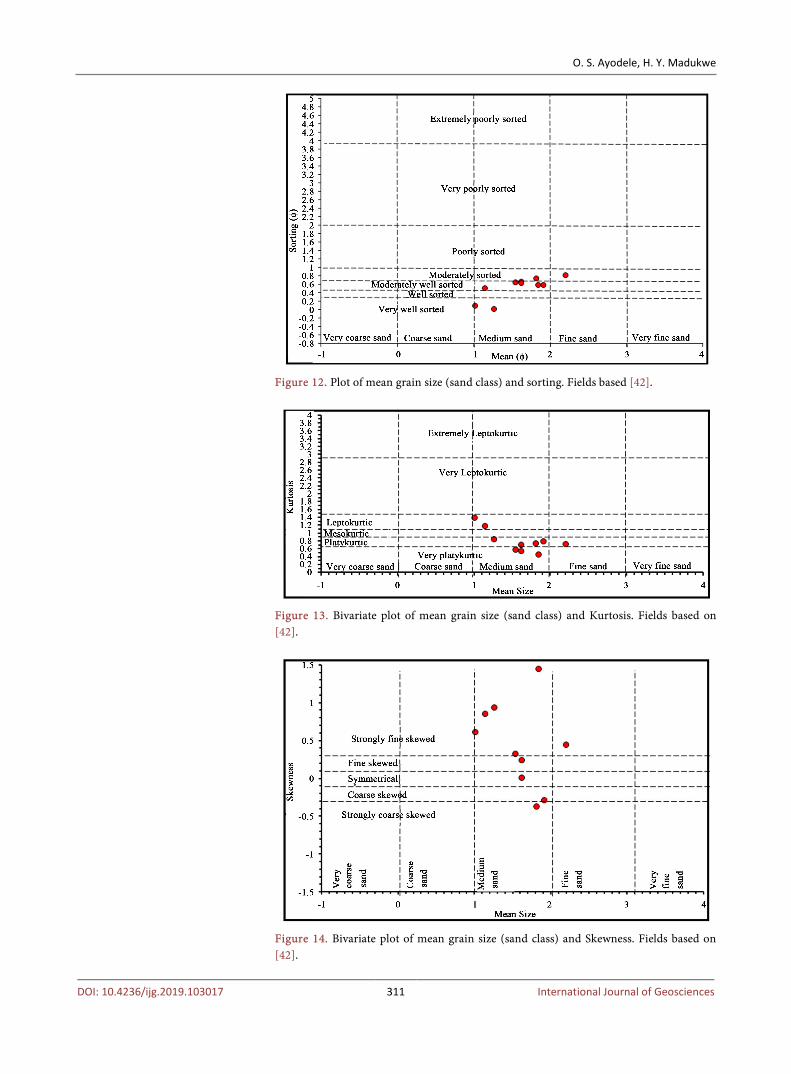
The bivariate plot between mean grain size and sorting (standard deviation) reveals that the grains are sands (Figure 11) that are mainly moderately well sorted made up of mainly medium grained sand particles (Figure 12). The energy medium may have caused the removal of fine particles via winnowing action of tidal waves.

O. S. Ayodele, H. Y. Madukwe
DOI: 10.4236/ijg.2019.103017 310 International Journal of Geosciences
Figure 10. Relationships of Folk & Ward textural parameters, (modified from [39]; [41]. (a) Skewness vs. mean grain diameter; (b) Standard deviation vs. skewness; (c) Mean grain diameter vs. standard deviation.
Figure 11. Plot of mean grain size (sediment class) and sorting, fields based on [42].
The scatter plot between mean grain size and kurtosis shows most of plots in the platykurtic and very platykurtic zones (Figure 13). Figure 14 is a bivariate plot of mean grain size and skewness showing a wide range of plots in strongly fine skewed zone.
O. S. Ayodele, H. Y. Madukwe
DOI: 10.4236/ijg.2019.103017 311 International Journal of Geosciences
Figure 12. Plot of mean grain size (sand class) and sorting. Fields based [42].
Figure 13. Bivariate plot of mean grain size (sand class) and Kurtosis. Fields based on [42].
Figure 14. Bivariate plot of mean grain size (sand class) and Skewness. Fields based on [42].

O. S. Ayodele, H. Y. Madukwe
DOI: 10.4236/ijg.2019.103017 312 International Journal of Geosciences
5.5. Linear Discriminant Functions
Statistical method of analysis of the sediments to interpret the variations in the energy and fluidity factors seems to have excellent correlation with the different processes and the environment of deposition [11]. Linear discriminant function analysis of the sediments was established in order to characterize the deposition-al setting based on the following equations (where MZ is the grain size mean, δ1 is inclusive graphic standard deviation (sorting), SK is skewness and KG is the graphic kurtosis):
1) Discrimination between Aeolian and beach environment (Y1) Y1 3.5688 Mz 3.7016 12 2.0766 SK 3.1135 KGδ= − + − +
If Y1 is less than −2.7411, Aeolian deposition is indicated and if greater than −2.7411, the environment is beach. Half of the samples have Y1 values that are greater than and less than −2.7411 (Table 6), which imply both Aeolian and beach environment of deposition.
2) Discrimination between beach and shallow agitated marine environment (Y2)
Y2 15.6534 Mz 65.7091 12 18.1071 SK 18.5043 KGδ= + + +
If Y2 is less than 65.3650, beach deposition is indicated and if greater than 65.3650, it is shallow agitated marine environment. Six samples have Y2 > 65.3650, the rest have Y2 less than 65.3650 (average = 68.79), which imply pre-dominant shallow agitated marine environment.
3) Discrimination between shallow agitated marine and the fluvial environ-ments (Y3)
Y3 0.2852 Mz 8.7604 12 4.8932 SK1 0.0482 KGδ= − − +
If Y3 is less than −7.419 the environment is fluvial, and if greater than −7.419 the environment is shallow marine. All the samples have Y3 greater than −7.419, except one, which indicates shallow marine environment.
4) Discrimination between Fluvial and turbidity (Y4) Y4 0.7215 Mz 0.403 12 6.7322 SK 5.2927 KGδ= + + +
If Y4 is less than 10.000, the environment is Fluvial and If greater than 10.000, the environment is Turbidity. 60% of the samples have Y4 less than 10, this im-plies a fluvial environment. While 40% were deposited by turbidity action. The average value of 8.18 indicates fluvial depositional process. Figure 15 and Fig-ure 16 are cross plots of the linear discriminant functions of the beach sedi-ments which indicates a shallow marine beach environment in agitated water.
Table 6. Values of the linear discriminant functions.
L1 L2 L3 L4 L5 L6 L7 L8 L9 L10 MEAN MAX MIN
Y1 −2.14 −4.19 −1.49 −2.91 −7.02 −3.22 −0.6 −2.59 −1.31 −3.91 −2.94 −0.6 −7.02
Y2 65.93 98.63 69.95 67.52 84.52 64.75 52.6 60.98 71.1 51.9 68.79 98.63 51.9
Y3 −3.22 −7.24 −2.26 −4.69 −9.34 −4 −2.64 −0.89 −5.92 −4.15 −4.43 −0.89 −9.34
Y4 4.972 8.526 2.78 6.455 13.49 5.685 12.03 3.577 12.73 11.52 8.18 13.49 2.78

O. S. Ayodele, H. Y. Madukwe
DOI: 10.4236/ijg.2019.103017 313 International Journal of Geosciences
Figure 15. Cross plots of the linear discriminant functions of the sediments: Y1-Y2.
Figure 16. Cross plots of the linear discriminant functions of the sediments: Y2-Y3.
5.6. C-M Pattern
The CM pattern or the Passega diagram can be used to determine the environ-mental conditions in which sediment was deposited based on the parameter C (one percentile of the grain size distribution) and M (the Median: 50th percen-tile of the grain size distribution), which is useful in the hydrodynamic inter-pretation of grain size data. The Passega diagram in Figure 17 features several fields, pelagic suspension (T field), uniform suspension (SR field), gradual sus-pension (QR field), suspension and rolling (QP field), rolling and suspen-sion-PO, rolling (ON field) corresponding to the various transports and sedi-mentation conditions in the marine, littoral or fluvial domains. From the Pas-sega diagram only three samples plotted directly within the parameter zones. Two samples plotted in the uniform suspension (SR) zone; two others plotted around the uniform suspension (SR) zone. A sample plotted in the suspension and rolling (QP zone). Most of the samples plotted outside the featured fields.

O. S. Ayodele, H. Y. Madukwe
DOI: 10.4236/ijg.2019.103017 314 International Journal of Geosciences
Figure 17. Passega diagram for the studied samples (modified after 13).
6. Conclusion
Grain size analysis of beach sediments in Lagos reveals that the sediments are silty sands and medium grained. The preponderance of medium grained sedi-ments and lack of coarse sands suggest moderate to high energy conditions of deposition. The beach sediments are moderately well sorted, strongly fine skewed and platykurtic. The sorting is probably due to rapid back and forth flow of the depositing medium. Histograms of the sediments exhibit both unimodal and bimodal trends. The arrangement is dominantly asymmetrical with varying modal class, which could be attributed to variation in the energy of the trans-porting medium. The beach sediments were probably deposited in a shallow marine beach environment in agitated water, with inputs from aeolian source with suspension and rolling as the mode of deposition. The sediments were in-itially river channel sediments before reworking to the present site.
Conflicts of Interest
The authors declare no conflicts of interest regarding the publication of this pa-per.
References
[1] Inman, D.L. (1952) Measures for Describing the Size Distribution of Sediments. Journal of Sedimentary Research, 22, 125-145.
[2] Shepard, F.P. and Moore, D.G. (1955) Central Texas Coast Sedimentation: Charac-teristics of Sedimentary Environment, Recent History and Diagenesis. AAPG Bulle-tin, 39, 1463-1593.
[3] Folk, R.L. and Ward, W.C. (1957) Brazos River Bar: A Study on the Significance of Grain Size Parameters. Journal of Sedimentary Petrology, 27, 3-26. https://doi.org/10.1306/74D70646-2B21-11D7-8648000102C1865D
[4] Passega, R. (1957) Texture as Characteristic of Clastic Deposition. American Asso-ciation of Petroleum Geologists, 41, 1952-1984.
[5] Passega, R. (1964) Grain Size Representation by CM Patterns as a Geological Tool. Journal of Sedimentary Research, 34. 830-847.

O. S. Ayodele, H. Y. Madukwe
DOI: 10.4236/ijg.2019.103017 315 International Journal of Geosciences
https://doi.org/10.1306/74D711A4-2B21-11D7-8648000102C1865D
[6] Mason, C.C. and Folk, R.L. (1958) Differentiation of Beach, Dune and Aeolian Flat Environments by Grain Size Analysis, Mustang Island, Texas. Journal of Sedimen-tary Research, 28, 211-226.
[7] Shepard, F.P. (1960) Gulf Coast Barriers. In: Shepard, F.P., et al., Eds., Recent Sedi-ments, Northwest Gulf of Mexico, American Association of Petroleum Geologists, 197-220.
[8] Cadigan, R.A. (1961) Geologic Interpretation of Grain Size Distribution Measure-ment of Colorado Plateau Sedimentary Rocks. Journal of Geology, 69, 121-142. https://doi.org/10.1086/626724
[9] Friedman, G.M. (1961) Distribution between Dune, Beach and River Sands from Textural Characteristic. Journal of Sedimentary Petrology, 31, 529-545.
[10] Friedman, G.M. (1967) Dynamic Processes and Statistical Parameters Compared for Size Frequency Distribution of Beach River Sands. Journal of Sedimentary Petrolo-gy, 37, 327-354.
[11] Sahu, B.K. (1964) Depositional Mechanisms from the Size Analysis of Clastic Sedi-ments. Journal of Sedimentary Research, 34, 1107-2821.
[12] Klovan, J.E. (1966) The Use of Factor Analysis in Determining Depositional Envi-ronments from Grain-Size Distributions. Journal of Sedimentary Petrology, 36, 115-125. https://doi.org/10.1306/74D7141A-2B21-11D7-8648000102C1865D
[13] Passega, R. and Byrarnjee, R. (1969) Grain-Size Image of Clastic Deposits. Sedi-mentology, 13, 233-252. https://doi.org/10.1111/j.1365-3091.1969.tb00171.x
[14] Visher, G.S. (1969) Grain-Size Distribution and Depositional Processes. Journal of Sedimentary Petrology, 39, 1074-1106.
[15] Solohub, J.T. and Klovan, J.E. (1970) Evolution of Grain Size Parameters in Lacu-strine Environments. Journal of Sedimentary Petrology, 40, 81-101.
[16] Tiara, A. and Scholle, P. (1979) Discrimination of Depositional Environments Us-ing Settling Tube Data. Journal of Sedimentary Petrology, 49, 787-800. https://doi.org/10.2110/jsr.49.787
[17] Sly, P.G., Thomas, R.L. and Pelletier, B.R. (1983) Interpretation of Measures De-rived from Water Laid Sediments. Sedimentology, 30, 219-233. https://doi.org/10.1111/j.1365-3091.1983.tb00666.x
[18] Musila, W.M. (1998) Floristic Composition, Structure and Distribution Patterns of Coastal Sand Dune Vegetation: A Case Study of the Coastal Dunes between Malindi and Mambrui. Moi University, Eldoret, 160 p.
[19] Thakur, A.K., Ojha, C.S.P., Grischek, T., Ray, C. and Saandhu, C. (2010) Water Quality Improvement through River Bank Filteration in Extreme Environmental Conditions. Journal of Indian Water Works Association, 43, 106-115.
[20] Hoque, M.A., Burgess, W.G. and Ahmed, K.M. (2010) Integration of Aquifer Geol-ogy, Groundwater Flow and Arsenic Distribution in Deltaic Aquifer—A Unifying Concept. Hydrological Processes, 444-445, 209-220.
[21] Iwugo, O.K.O., D’arcy, B. and Andoh, R. (2003) Aspects of Land-Based Pollution of an African Coastal Megacity of Lagos. Proceedings of the International Specialised IWA Conference, Dublin.
[22] Obaje, N.G., Musa, M.K., Odoma, A.N. and Hamza, H. (2011) The Bida Basin in North-Central Nigeria: Sedimentology and Petroleum Geology. Journal of Petro-leum and Gas Exploration Research, 1, 1-13.
[23] Omatsola, M.E. and Adegoke, S.O. (1981) Tectonic Evolution and Cretaceous Stra-

O. S. Ayodele, H. Y. Madukwe
DOI: 10.4236/ijg.2019.103017 316 International Journal of Geosciences
tigraphy of the Dahomey Basin. Journal of Mining Geology, 18, 130-136.
[24] Olanrewaju, A.E. (2018) Sedimentological Studies of the Beach Sediments in Lagos State, Southwestern Nigeria. Federal University of Technology, Akure, 76 p.
[25] Jones, H.A. and Hockey, R.D. (1964) The Geology of Part of S.W. Nigeria. Geologi-cal Survey of Nigeria Bulletin No. 1, 1-16.
[26] Agagu, O.A. (1985) A Geological Guide to Bituminous Sediments in Southwestern Nigeria. Department of Geology University of Ibadan.
[27] Folk, R.L. (1968) Petrology of Sedimentary Rocks. Hemphill’s, Austin, 170.
[28] Folk, R.L. (1974) The Petrology of Sedimentary Rocks. Hemphill Publishing Co., Austin, 182 p.
[29] Boggs, F.W. (1957) Report on the Kenya Coastal Sand—Sabakiriverarea. Mines and Geological Department, Nairobi.
[30] Friedman, G.M. and Sanders, J.E. (1978) Principles of Sedimentology. Wiley, New York.
[31] Martins, L.R. (1965) Significance of Skewness and Kurtosis in Environmental In-terpretation. Journal of Sedimentary Petrology, 35, 768-770. https://doi.org/10.1306/74D7135C-2B21-11D7-8648000102C1865D
[32] Shepard, F.P. (1954) Nomenclature Based on Sand-Silt-Clay Ratios. Journal of Se-dimentary Petrology, 24, 151-158.
[33] Folk, R.L., Andrews, P.B. and Lewis, D.W. (1970) Detrital Sedimentary Rock Classi-fication and Nomenclature for Use in New Zealand. New Zealand Journal of Geol-ogy and Geophysics, 13, 937-968. https://doi.org/10.1080/00288306.1970.10418211
[34] Flemming, B.W. (2000) A Revised Textural Classification of Gravel-Free Muddy Sediments on the Basis of Ternary Diagrams. Continental Shelf Research, 20, 1125-1137. https://doi.org/10.1016/S0278-4343(00)00015-7
[35] Duane, D.B. (1964) Significance of Skewness in Recent Sediments, Western Pamlico Sound, North Carolina. Journal of Sedimentary Petrology, 34, 864-874.
[36] Baruah, J., Kotoky, P. and Sarma, J. (1997) Textural and Geochemical Study on River Sediments: A Case Study on the Jhanji River, Assam. Journal of the Indian Association of Sedimentologists, 16, 195-206.
[37] Ray, A.K., Tripathy, S.C., Patra, S. and Sarma, V.V. (2006) Assessment of Godavari Estuarine Mangrove Ecosystem through Trace Metal Studies. Environment Interna-tional, 32, 219-223. https://doi.org/10.1016/j.envint.2005.08.014
[38] Moiola, R. and Weiser, D. (1968) Textural Parameters: An Evaluation. Journal of Sedimentary Petrology, 38, 45-53.
[39] Mycielska-Dowgiałło, E. (2007) Research Methods for Textural Features of Clastic Deposits and the Significance of Interpretational Results. In: Mycielska-Dowgiałło, E. and Rutkowski, J., Eds., Research into the Textural Features of Quaternary Sedi-ments and Some Dating Methods, The Family Alliance School of Higher Education Press, Warsaw, 95-180.
[40] Mycielska-Dowgiallo, E. and Ludwikowska-Kedzia, M. (2011) Alternative Interpre-tations of Grain-Size Data from Quaternary Deposits. Geologos, 17, 189-203. https://doi.org/10.2478/v10118-011-0010-9
[41] Ludwikowska-Kędzia, M. (2000) Evolution of the Middle Segment of the Belnianka River Valley in the Late Glacial and Holocene. Dialog Press, Warsaw, 180.
[42] Blott, S.J. and Kenneth, P. (2000) Gradistat: A Grain Size Distribution and Statistics Package for the Analysis of Unconsolidated Sediments. Earth Surface Processes and Landforms, 26, 1237-1248. https://doi.org/10.1002/esp.261