grant park fund 10k 12.31.06
DESCRIPTION
Grant Park Fund 10K 12.31.06TRANSCRIPT

UNITED STATES SECURITIES AND EXCHANGE COMMISSION
Washington, D.C. 20549
FORM 10-K (Mark One)
ANNUAL REPORT PURSUANT TO SECTION 13 OR 15(d) OF THE SECURITIES EXCHANGE ACT OF 1934
For the Fiscal Year Ended December 31, 2006
or TRANSITION REPORT PURSUANT TO SECTION 13 OR 15(d) OF THE SECURITIES
EXCHANGE ACT OF 1934 For the transition period from ___________ to __________
Commission File Number 0-50316
GRANT PARK FUTURES FUND LIMITED PARTNERSHIP (Exact name of Registrant as specified in its charter)
Illinois (State or other jurisdiction
of incorporation or organization)
36-3546839 (I.R.S. Employer
Identification Number)
c/o Dearborn Capital Management, L.L.C. 555 West Jackson Boulevard, Suite 600
Chicago, Illinois (Address of Principal Executive Offices)
60661 (Zip Code)
(312) 756-4450 (Registrant’s telephone number, including area code)
Securities registered pursuant to Section 12(b) of the Act: None
Securities registered pursuant to Section 12(g) of the Act:
Class A Limited Partnership Units Class B Limited Partnership Units
(Title of Class) Indicate by check mark if the registrant is a well-known seasoned issuer, as defined in Rule 405 of the
Securities Act. Yes No Indicate by check mark if the registrant is not required to file reports pursuant to Section 13 or Section
15(d) of the Act. Yes No Indicate by check mark whether the Registrant (1) has filed all reports required to be filed by Section 13 or
15(d) of the Securities Exchange Act of 1934 during the preceding 12 months (or for such shorter period that the Registrant was required to file such reports), and (2) has been subject to such filing requirements for the past 90 days. Yes No
Indicate by check mark if the disclosure of delinquent filers pursuant to Item 405 of Regulation S-K is not contained herein, and will not be contained, to the best of the Registrant’s knowledge, in definitive proxy or information statements incorporated by reference in Part III of this Form 10-K or any amendment to this Form 10-K.
Indicate by check mark whether the Registrant is a large accelerated filer, an accelerated filer, or a non-accelerated filer. See definition of “accelerated filer and large accelerated filer” in Rule 12b-2 of the Exchange Act. (Check one): Large accelerated filer Accelerated filer Non-accelerated filer
Indicate by check mark whether the Registrant is a shell company (as defined in Rule 12b-2 of the Securities Exchange Act of 1934). Yes No
The Registrant has no voting stock. As of December 31, 2006, there were 50,026.94 Class A Limited Partnership Units and 316,983.72 Class B Limited Partnership Units issued and outstanding.
DOCUMENTS INCORPORATED BY REFERENCE Portions of the Prospectus dated June 1, 2006 filed pursuant to Rule 424(b)(3) with the SEC on June 2, 2006 and included within Post-Effective No. 2 to the Registration Statement on Form S-1 (File No. 333-119338) are incorporated by reference into Part I of this Form 10-K.

TABLE OF CONTENTS
Page
i
PART I
ITEM 1. BUSINESS.........................................................................................................................1 ITEM 1A. RISK FACTORS ...............................................................................................................4 ITEM 1B. UNRESOLVED STAFF COMMENTS ............................................................................4 ITEM 2. PROPERTIES....................................................................................................................5 ITEM 3. LEGAL PROCEEDINGS..................................................................................................5 ITEM 4. SUBMISSION OF MATTERS TO A VOTE OF SECURITY HOLDERS......................5
PART II
ITEM 5. MARKET FOR REGISTRANT’S COMMON EQUITY, RELATED STOCKHOLDER MATTERS AND ISSUER PURCHASES OF EQUITY SECURITIES.....................................................................................................................5
ITEM 6. SELECTED FINANCIAL DATA.....................................................................................6 ITEM 7. MANAGEMENT’S DISCUSSION AND ANALYSIS OF FINANCIAL
CONDITION AND RESULTS OF OPERATIONS .........................................................7 ITEM 7A. QUANTITATIVE AND QUALITATIVE DISCLOSURES ABOUT MARKET
RISK ................................................................................................................................26 ITEM 8. FINANCIAL STATEMENTS AND SUPPLEMENTARY DATA ................................31 ITEM 9. CHANGES IN AND DISAGREEMENTS WITH ACCOUNTANTS ON
ACCOUNTING AND FINANCIAL DISCLOSURE .....................................................32 ITEM 9A. CONTROLS AND PROCEDURES................................................................................32 ITEM 9B. OTHER INFORMATION………………………………………………………………32
PART III
ITEM 10. DIRECTORS, EXECUTIVE OFFICERS OF THE REGISTRANT AND CORPORATE GOVERNANCE .....................................................................................32
ITEM 11. EXECUTIVE COMPENSATION...................................................................................33 ITEM 12. SECURITY OWNERSHIP OF CERTAIN BENEFICIAL OWNERS AND
MANAGEMENT AND RELATED STOCKHOLDER MATTERS..............................35 ITEM 13. CERTAIN RELATIONSHIPS AND RELATED TRANSACTIONS, AND
DIRECTOR INDEPENDENCE ......................................................................................35 ITEM 14. PRINCIPAL ACCOUNTING FEES AND SERVICES..................................................35
PART IV
ITEM 15. EXHIBITS AND FINANCIAL STATEMENT SCHEDULES ......................................36 INDEX TO FINANCIAL STATEMENTS ............................................................................................. F-1
SIGNATURES

PART I
ITEM 1. BUSINESS
Grant Park Futures Fund Limited Partnership, which is referred to in this report as Grant Park, is a multi-advisor commodity pool organized to pool assets of investors for the purpose of investing those assets in U.S. and international futures and forward contracts, options contracts and other interests in commodities. Grant Park, which is not registered as a mutual fund under the Investment Company Act of 1940, has been in continuous operation since January 1989. It is managed by its general partner, Dearborn Capital Management, L.L.C., and invests through independent professional commodity trading advisors.
Grant Park has been organized to pool assets of investors for the purpose of trading in the U.S. and international markets for currencies, interest rates, stock indices, agricultural and energy products, precious and base metals and other commodities. In trading on these markets, Grant Park may employ futures and forward contracts, security futures contracts, options contracts and other interests in commodities. Grant Park’s general partner, commodity pool operator and sponsor is Dearborn Capital Management, L.L.C., an Illinois limited liability company. The limited partnership agreement requires the general partner to own units in Grant Park in an amount at least equal to the greater of (1) 1% of the aggregate capital contributions of all limited partners or (2) $25,000, during any time that units in Grant Park are publicly offered for sale. The managing member of Dearborn Capital Management, L.L.C. is Dearborn Capital Management, Ltd., an Illinois corporation whose sole shareholder is David M. Kavanagh.
Dearborn Capital Management, L.L.C., along with its managing member and predecessor as general partner and commodity pool operator, Dearborn Capital Management Ltd., has had management responsibility for Grant Park since its inception. The general partner has been registered as a commodity pool operator and a commodity trading advisor under the Commodity Exchange Act and has been a member of the NFA since December 1995. Dearborn Capital Management Ltd., which served as Grant Park’s general partner, commodity pool operator and sponsor from 1989 through 1995, was registered as a commodity pool operator between August 1988 and March 1996 and as a commodity trading advisor between September 1991 and March 1996 and was a member of the NFA between August 1988 and March 1996.
Grant Park invests through independent professional commodity trading advisors retained by the general partner. Presently, Rabar Market Research, Inc., EMC Capital Management, Inc., Eckhardt Trading Company, or ETC, Graham Capital Management, L.P., Winton Capital Management Limited, Saxon Investment Corporation and Welton Investment Corporation serve as Grant Park’s commodity trading advisors. As of December 31, 2006, the general partner allocated Grant Park’s net assets among its existing trading advisors as follows: 18% to Rabar, 20% to EMC, 6% to ETC, 8% to Graham, 21% to Winton and 8% to Saxon. Welton Investment Corporation began trading on behalf of Grant Park effective March 1, 2006 and is currently allocated 19% of Grant Park’s assets. Each of the trading advisors employs technical and trend-following trading strategies through proprietary trading programs, in an effort to achieve capital appreciation while controlling risk and volatility. As of December 31, 2006, Grant Park had a net asset value of approximately $382.3 million and 13,026 limited partners. As of the close of business on December 31, 2006, the net asset value per unit of the Class A units was $1,162.60, and the net asset value of the Class B units was $1,022.42. Since its inception and through February 28, 2003, Grant Park offered its beneficial interests exclusively to qualified investors on a private placement basis. Effective June 30, 2003, Grant Park began publicly offering both Class A and Class B units for sale.

There have been no material administrative, civil or criminal actions within the past five years against the general partner or its principals and no such actions currently are pending.
Grant Park has been trading continuously since January 1989. Since its inception and through February 28, 2003, Grant Park offered its beneficial interests exclusively to qualified investors on a private placement basis. Grant Park converted its interests to units effective April 1, 2003, with all existing limited partners at that date converting to Class A units with a price of $1,000 per unit. Effective June 30, 2003, Grant Park registered up to an aggregate of $200 million of Class A and Class B units pursuant to a Registration Statement on Form S-1 (File No. 333-104317), and began publicly offering both Class A and Class B units for sale. Class B units began trading on August 1, 2003 and were offered at a price of $1,000 per unit. Grant Park subsequently registered up to an additional $200 million in aggregate of Class A and Class B units for sale on a Registration Statement on Form S-1 (File No. 333-113297) on March 30, 2004, and an additional $700 million in aggregate of Class A and Class B units for sale on a Registration Statement of Form S-1 (File No. 333-119338) on December 1, 2004 (the “Registration Statement”). Since July 1, 2003, the Fund has raised approximately $488,231,000 of new capital through December 1, 2006, and is continuing to offer up to an additional $611,769,000 of units pursuant to the Registration Statement, on a continuous basis at a price equal to the net asset value per unit as of the close of business on each applicable closing date, which is the last business day of each month. The proceeds of the offering are deposited in Grant Park’s bank and brokerage accounts for the purpose of engaging in trading activities in accordance with Grant Park’s trading policies and its trading advisors’ respective trading strategies.
The affairs of Grant Park will be wound up and Grant Park will be liquidated upon the happening of any of the following events (1) expiration of Grant Park’s term on December 31, 2027, (2) a decision by the limited partners to liquidate Grant Park, (3) withdrawal or dissolution of the general partner and the failure of the limited partners to elect a substitute general partner to continue Grant Park, or (4) assignment for the benefit of creditors or adjudication of bankruptcy of the general partner or appointment of a receiver for or seizure by a judgment creditor of the general partner’s interest in Grant Park.
Regulation
Under the Commodity Exchange Act, as amended (the “Act”), commodity exchanges and commodity futures trading are subject to regulation by the Commodity Futures Trading Commission (the “CFTC”). The National Futures Association (the “NFA”), a registered futures association under the Act, is the only non-exchange self-regulatory organization for commodity industry professionals. The CFTC has delegated to the NFA responsibility for the registration of “commodity trading advisors,” “commodity pool operators,” “futures commission merchants,” “introducing brokers” and their respective associated persons and “floor brokers.” The Act requires “commodity pool operators,” and “commodity trading advisors” such as Dearborn Capital Management, L.L.C., and commodity brokers or “futures commission merchants” such as Grant Park’s commodity brokers to be registered and to comply with various reporting and recordkeeping requirements. Dearborn Capital Management L.L.C. and Grant Park’s commodity brokers are members of the NFA. The CFTC may suspend a commodity pool operator’s or trading advisor’s registration if it finds that its trading practices tend to disrupt orderly market conditions, or as the result of violations of the Act or rules and regulations promulgated thereunder. In the event Dearborn Capital Management L.L.C.’s registration as a commodity pool operator or commodity trading advisor were terminated or suspended, Dearborn Capital Management L.L.C. would be unable to continue to manage the business of Grant Park. Should Dearborn Capital Management L.L.C.’s registration be suspended, termination of Grant Park might result.
2

In addition to such registration requirements, the CFTC and certain commodity exchanges have established limits on the maximum net long and net short positions which any person, including Grant Park, may hold or control in particular commodities. Most exchanges also limit the maximum changes in futures contract prices that may occur during a single trading day. Grant Park also trades in dealer markets for forward and swap contracts, which are not regulated by the CFTC. Federal and state banking authorities also do not regulate forward trading or forward dealers. In addition, Grant Park trades on foreign commodity exchanges, which are not subject to regulation by any United States government agency.
Operations
A description of the business of Grant Park, including trading approaches, rights and obligations of the unitholders, compensation arrangements and fees and expenses is contained in Grant Park’s prospectus dated June 1, 2006, filed pursuant to Rule 424(b)(3) with the SEC on June 2, 2006 and included in Post-effective Amendment No. 2 to the Registration Statement on Form S-1 (File No. 333-119338) (the “Prospectus”) under the sections captioned “Summary,” “Risk Factors,” “The General Partner,” “The Trading Advisors,” “Conflicts of Interest” and “Fees and Expenses,” and such description is incorporated herein by reference from the Prospectus.
Grant Park trades in U.S. and international futures and forward contracts and other interests in commodities, including options contracts on futures, forwards and commodities, spot contracts, swap contracts and security futures contracts. The commodities underlying these contracts may include stock indices, interest rates, currencies, or physical commodities, such as agricultural products, energy products or metals. A brief description of Grant Park’s main types of investments is set forth below.
• A futures contract is a standardized contract traded on an exchange that calls for the future delivery of a specified quantity of a commodity at a specified time and place.
• A forward contract is an individually negotiated contract between principals, not traded on an exchange, to buy or sell a specified quantity of a commodity at or before a specified date at a specified price.
• An option on a futures contract, forward contract or a commodity gives the buyer of the option the right, but not the obligation, to buy or sell a futures contract, forward contract or a commodity, as applicable, at a specified price on or before a specified date. Options on futures contracts are standardized contracts traded on an exchange, while options on forward contracts and commodities, referred to collectively in this prospectus as over-the-counter options, generally are individually negotiated, principal-to-principal contracts not traded on an exchange.
• A spot contract is a cash market transaction in which the buyer and seller agree to the immediate purchase and sale of a commodity, usually with a two-day settlement. Spot contracts are not uniform and not exchange-traded.
• A swap contract generally involves an exchange of a stream of payments between the contracting parties. Swap contracts generally are not uniform and not exchange-traded.
• A security futures contract is a futures contract on a single equity security or narrow-based stock index. Security futures contracts are relatively new financial instruments, having only begun trading in the United States in November 2002. Security futures contracts are exchange-traded. A trading advisor generally may choose to trade security futures contracts for Grant Park’s account if the trading advisor determines that the market for the particular
3

contract is sufficiently liquid and that trading the contract is consistent with the trading advisor’s trading program.
For convenience and unless otherwise specified, futures contracts, forward contracts, options contracts and all other commodity interests collectively are referred to as commodity interests.
ITEM 1A. RISK FACTORS
Grant Park’s performance, trading activities, operating results, financial condition and net asset value could be negatively impacted by a number of risks and uncertainties, including those outlined below, which may affect the value of your investment in Grant Park. The following list of risk factors should not be considered a comprehensive list of all potential risks and uncertainties relating to Grant Park. You should also refer to the other information included in this Form 10-K, including our consolidated financial statements and related notes for the year ended December 31, 2006. Significant risk factors include:
• An investment in Grant Park is speculative and leveraged; as a result of this leverage, small movements in the price of a commodity interest may cause you to incur significant losses.
• Performance can be volatile; rapid and substantial fluctuations in commodity interest prices
could cause Grant Park’s trading positions to suddenly turn unprofitable and cause you to lose all or substantially all of your investment in Grant Park.
• Trading in commodity interests is a zero-sum economic activity in which, for every gain, there
is an offsetting loss. Grant Park therefore bears the risk that, on every trade, it will incur the loss.
• Grant Park’s past performance is not necessarily indicative of future performance. • Grant Park’s use of multiple trading advisors may result in Grant Park taking offsetting trading
positions, thereby incurring additional expenses with no net change in holdings. • No secondary market exists for the units; redemptions are limited and may result in early
redemption fees. • Grant Park pays substantial fees and expenses, including fees paid to its trading advisors, that
must be offset by trading profits and interest income. • A substantial portion of the trades executed for Grant Park takes place outside of the U.S., much
of which exposes Grant Park to substantial credit, regulatory and foreign exchange risk. • You will have no right to participate in the management of Grant Park. • The structure and operation of Grant Park involve several conflicts of interest.
ITEM 1B. UNRESOLVED STAFF COMMENTS
Not applicable.
4

ITEM 2. PROPERTIES
Grant Park does not own or use any physical properties in the conduct of its business. Its assets currently consist of U.S. and international futures and forward contracts and other interests in commodities, including options contracts on futures, forwards and commodities, spot contracts, swap contracts and security futures contracts. Grant Park’s main office is located at 555 West Jackson Boulevard, Suite 600, Chicago, Illinois 60661.
ITEM 3. LEGAL PROCEEDINGS
Grant Park is not a party to any pending material legal proceedings.
ITEM 4. SUBMISSION OF MATTERS TO A VOTE OF SECURITY HOLDERS
None.
PART II
ITEM 5. MARKET FOR REGISTRANT’S COMMON EQUITY, RELATED STOCKHOLDER MATTERS AND ISSUER PURCHASES OF EQUITY SECURITIES
Neither the Class A units nor the Class B units of Grant Park are publicly traded. Both Class A and Class B units may be transferred or redeemed subject to the conditions imposed by the Third Amended and Restated Limited Partnership Agreement. As of December 31, 2006, there were 412 and 12,614 holders of Class A units and Class B units, respectively, and 50,026.94 Class A units and 316,983.72 Class B units outstanding.
Dearborn Capital Management L.L.C. has sole discretion in determining what distributions, if any, Grant Park will make to its unit holders. Grant Park has not made any distributions as of the date hereof.
Class A and Class B units are being offered on a continuous basis at subsequent closing dates at a price equal to the net asset vale per unit as of the close of business on each applicable closing date, which is the last business day of each month. Sales of the Class A units and Class B units during the fourth quarter 2006 were as follows:
Units October November December
Class A Units Units sold................. 1,166.65 691.21 1,101.79 Net asset value......... $1,140.01 $1,132.71 $1,173.35
Class B Units Units Sold ................ 9,583.62 9,516.96 7,497.24 Net asset value......... $1,003.78 $996.64 $1,031.66
The proceeds of the offering are deposited in Grant Park’s bank and brokerage accounts for the
purpose of engaging in trading activities in accordance with Grant Park’s trading policies and its trading advisors’ respective trading strategies.
5

Issuer Purchases of Equity Securities
The following table provides information regarding the total Class A and Class B units redeemed by Grant Park during the three months ended December 31, 2006.
(a) (b) (a) (b) (c) (d)
Period Total Number
of Class A Units
Redeemed
Average Price
Paid per Unit
Total Number
of Class B Units
Redeemed
Average Price Paid per Unit
Total Number of Units Redeemed
as Part of Publicly
Announced Plans or Programs(1)
Maximum Number of Units that May Yet Be Redeemed Under
the Plans/Program(1)
10/01/06 through 10/31/06
477.68
$1,132.71
3,657.52
$996.64
4,135.20
(2)
11/01/06 through 11/30/06
475.01
$1,173.35
5,353.73
$1,031.66
5,828.74
(2)
12/01/06 through 12/31/06
796.87
$1,162.60
4,169.74
$1,022.42
4,966.61
(2)
Total
1,749.56
$1,156.22
13,180.99
$1,016.91
14,930.55
(2)
(1) As previously disclosed, pursuant to Grant Park’s Limited Partnership Agreement, investors in Grant Park may redeem their units for an amount equal to the net asset value per unit at the close of business on the last business day of any calendar month if at least 10 days prior to the redemption date, or at an earlier date if required by the investor’s selling agent, the General Partner receives a written request for redemption from the investor. Generally, redemptions are paid in the month subsequent to the month requested. The General Partner may permit earlier redemptions in its discretion. (2) Not determinable.
ITEM 6. SELECTED FINANCIAL DATA
The selected financial information for the years ended December 31, 2006, 2005, 2004, 2003 and 2002 is taken from the financial statements of Grant Park audited by McGladrey & Pullen, LLP, Grant Park’s independent registered public accountant. You should read this information in conjunction with “Management’s Discussion and Analysis of Financial Condition and Results of Operations” and our financial statements and the related notes included elsewhere in this report. Results from past periods are not necessarily indicative of results that may be expected for any future period.
6

For the Year Ended December 31, 2006 2005 2004 2003 2002
Total assets............................ $407,930,032 $307,245,733 $304,631,802 $87,861,740 $15,791,790 Total partners’ capital ........... 382,252,995 289,897,819 289,654,031 67,418,046 14,605,959 Gains (losses) from trading ... 42,290,048 7,144,929 4,281,201 10,149,161 2,971,464 Interest income...................... 16,093,168 8,436,400 3,005,585 247,863 173,351 Total expenses....................... 32,069,521 25,937,802 20,995,234 4,080,495 1,356,610 Net income (loss) .................. 26,313,695 (10,356,473) (13,708,448) 6,316,529 1,788,205 Net income (loss) per
General Partner & Class A Unit Limited Partner* 98.75 (36.11) (88.44) 194.63 –
Net income (loss) per Class B Unit Limited Partner* 82.71 (35.34) (81.15) 82.15 –
Increase (decrease) in net asset value per General Partner & Class A Unit Limited Partner 97.03 (37.96) (90.50) 194.03 –
Increase (decrease) in net asset value per Class B Unit Limited Partner 78.14 (41.89) (90.42) 76.59 –
* The Partnership converted its “Interests” to units effective April 1, 2003, with all existing Limited Partners at that date converting to Class A Units. The financial results are presented on a unitized basis from that date. Class B Units began trading on August 1, 2003. The financial results are based on weighted average number of units outstanding during the period.
Supplementary Quarterly Financial Information
The following summarized quarterly financial information presents Grant Park’s results of operations for the three-month periods ended March 31, June 30, September 30, and December 31, 2006 and 2005.
1st Quarter2006
2nd Quarter2006
3rd Quarter2006
4th Quarter2006
(unaudited) (unaudited) (unaudited) (unaudited)Gains (losses) from trading ............................... $16,396,669 $21,076,739 $(6,369,757) $11,186,397Net income (loss) .............................................. 12,253,554 16,419,952 (9,475,113) 7,115,302Net income (loss) per General Partner &
Class A Unit Limited Partner ** 44.87 61.49 (30.17) 22.56Net income (loss) per Class B Unit Limited
Partner ** 38.66 53.25 (27.72) 18.52Increase (decrease) in net asset value per
General Partner & Class A Unit Limited Partner 44.31 60.88 (30.75) 22.59
Increase (decrease) in net asset value per Class B Unit Limited Partner 37.16 51.62 (29.28) 18.64
Net asset value per General Partner & Class A Unit Limited Partner 1,109.88 1,170.76 1,140.01 1,162.60
Net asset value per Class B Unit Limited Partner 981.44 1,033.06 1,003.78 1,022.42
7

1st Quarter2005
2nd Quarter2005
3rd Quarter2005
4th Quarter2005
(unaudited) (unaudited) (unaudited) (unaudited)Gains (losses) from trading ............................. $ (4,498,378) $6,927,916 $ 3,798,919 $ 916,472 Net income (loss) ............................................ (9,603,104) 1,813,769 (171,142) (2,395,996)Net income (loss) per General Partner &
Class A Unit Limited Partner ** (35.26) 6.97 (0.11) (7.71)Net income (loss) per Class B Unit Limited
Partner ** (32.08) 5.59 (0.84) (8.01)Increase (decrease) in net asset value per
General Partner & Class A Unit Limited Partner (35.81) 6.43 (0.66) (7.92)
Increase (decrease) in net asset value per Class B Unit Limited Partner (34.28) 3.44 (2.78) (8.27)
Net asset value per General Partner & Class A Unit Limited Partner 1,067.72 1,074.15 1,073.49 1,065.57
Net asset value per Class B Unit Limited Partner 951.89 955.33 952.55 944.28
** - Based on weighted average number of units outstanding during the period.
ITEM 7. MANAGEMENT’S DISCUSSION AND ANALYSIS OF FINANCIAL CONDITION AND RESULTS OF OPERATIONS
Introduction
Grant Park is a multi-advisor commodity pool organized to pool assets of its investors for purposes of investing those assets in U.S. and international commodity futures and forward contracts and other commodity interests, including options contracts on futures, forwards and commodities, spot contracts, swap contracts and security futures. The commodities underlying these contracts may include stock indices, interest rates, currencies or physical commodities, such as agricultural products, energy products or metals. Grant Park has been in continuous operation since it commenced trading on January 1, 1989. Grant Park’s general partner, commodity pool operator and sponsor is Dearborn Capital Management, L.L.C., an Illinois limited liability company. The managing member of Dearborn Capital Management, L.L.C. is Dearborn Capital Management, Ltd., an Illinois corporation whose sole shareholder is David M. Kavanagh.
Grant Park invests through independent professional commodity trading advisors retained by the general partner. Presently, Rabar Market Research, Inc., EMC Capital Management, Inc., Eckhardt Trading Company, or ETC, Graham Capital Management, L.P., Winton Capital Management Limited, Saxon Investment Corporation and Welton Investment Corporation serve as Grant Park’s commodity trading advisors. As of December 31, 2006, the general partner allocated Grant Park’s net assets among its existing trading advisors as follows: 18% to Rabar, 20% to EMC, 6% to ETC, 8% to Graham, 21% to Winton, 8% to Saxon and 19% to Welton.
Critical Accounting Policies
Grant Park’s most significant accounting policy is the valuation of its assets invested in U.S. and international futures and forward contracts, options contracts and other interests in commodities. The substantial majority of these investments are exchange-traded contracts, valued based upon exchange settlement prices. The remainder of its investments are non-exchange-traded contracts with valuation of those investments based on third-party quoted dealer values on the Interbank market. With the valuation
8

of the investments easily obtained, there is little or no judgment or uncertainty involved in the valuation of investments, and accordingly, it is unlikely that materially different amounts would be reported under different conditions using different but reasonably plausible assumptions.
Results of Operations
Grant Park’s returns, which are Grant Park’s trading gains plus interest income less brokerage fees, performance fees, operating costs and offering costs borne by Grant Park, for the year ended December 31, 2006, were 9.1% for Class A units and 8.3% for Class B units, for the year ended December 31, 2005 were (3.4)% for Class A units and (4.3)% for Class B units, and for the year ended December 31, 2004 were (7.6)% for Class A units and (8.4)% for Class B units. Grant Park’s total net asset value at December 31, 2006, 2005 and 2004 was $382.3 million, $289.9 million and $289.7 million, respectively.
The table below sets forth Grant Park’s trading gains or losses by sector for each of the years ended December 31, 2006, 2005 and 2004.
% Gain (Loss) Year Ended December 31, Sector 2006 2005 2004
Interest Rates.................................................. (1.0)% (1.0)% (1.0)% Currencies ...................................................... 0.8 (4.6) 1.3 Stock Indices .................................................. 6.9 5.1 (1.2) Energy............................................................ (1.7) 1.0 3.2 Agriculturals .................................................. (2.1) (1.0) 2.1 Meats.............................................................. (0.3) (0.1) 0.3 Metals............................................................. 10.8 1.2 (1.0) Softs ............................................................... 0.3 1.7 (1.0) Miscellaneous ................................................ — (0.1) (0.7)
Total........................................................... 13.7% 2.2% 2.0% Year ended December 31, 2006
Grant Park reported profits during the calendar year as identifiable price trends allowed our traders to take advantage of increased volatility in the marketplace.
Grant Park started out the year on a positive note in January as the rally in base metals prices that had begun in earnest in 2005 continued into 2006. A key component to the upward price movement was the ongoing expansion of the Chinese economy, which had continued to outpace economists’ growth estimates. Gains in the sector continued throughout the year as work stoppages at several mines, growth in the housing sector and falling inventories kept a bid in the market for nickel, aluminum, copper and zinc. Precious metals positions were profitable as geopolitical concerns over Iran’s nuclear ambitions and questions regarding the direction of U.S. monetary policy saw gold prices climb above the $650 level. Silver positions rounded out profits in the sector as prices rose primarily on news that Barclays would introduce a silver-backed ETF (Exchange Traded Fund) into the marketplace. By the end of the calendar year profits from base and precious metal positions, a sector which makes up 11% of Grant Park’s market exposure, accounted for approximately 55% of Grant Park’s net gains.
Positions in global stock indices were the second largest source of Grant Park’s profits during 2006. Foreign equity markets performed well from the onset of the year as favorable business conditions coupled with strong earnings forecasts resulted in higher share prices on the Paris CAC, London FTSE-100, German DAX and Spanish IBEX. European stock prices continued to surge throughout the year as
9

merger and acquisition activity heated up. The S&P Composite Index and Hong Kong Hang Seng were responsible for the biggest gains in the sector and prices in both indices continued higher in the second half of the year on speculation that the U.S. Federal Reserve Bank, which had completed the last of its seventeen consecutive rate rises in June, might be in a position to ease short-term interest rates after a stream of economic data suggested that the U.S. economy might be slowing down enough to warrant a rate cut.
Currency positions also reported gains for Grant Park’s investors, particularly in the cross-rate markets. The Japanese yen depreciated materially against some of its major counterparts late in the year, allowing Grant Park’s traders to take advantage of the increased volatility in the sector. Disparity between interest rates was a driving force in the cross-rates as the prospect of tighter European monetary policy pushed the euro and British pound higher relative to the yen.
The largest losses for Grant Park were the result of positions in the soft/agricultural commodities, the grain markets in particular. The soybean market presented the most difficulty in terms of identifying clear price direction as it traded in a narrow range between $5.91 and $6.55 from January thru July. Short positions benefited from a breakout to the downside in August and September but concerns over soybean rust led to an October rally that erased the gains from the previous two months. While prices continued higher throughout November a definitive trend was difficult to identify as prices experienced a downside reversal during December.
Positions in the interest rate sector also sustained losses during 2006. The underlying theme reverberating throughout financial markets during the year was the state of the U.S. economy and what direction the Federal Reserve Bank would take with regard to monetary policy. The central bank was in the midst of a tightening cycle as the year began and remained in that mode until June when it implemented the last of its consecutive rate hikes. Following the halt to the rate increases comments by Fed officials concerning any further risk of inflation kept financial markets on edge even as economic data suggested that the U.S. economy might be slowing down, causing the markets to speculate that the next move by the Fed could be to lower short-term rates. These circumstances resulted in losses for positions in the Eurodollars, Ten-year notes and Thirty-year bonds as uncertainty and choppiness in the marketplace made it difficult for Grant Park’s traders to identify and exploit a price trend in either direction.
For the year ended December 31, 2006, Grant Park had a positive return of 9.1% for the Class A
units and a positive return of 8.3% for the Class B units. On a combined basis prior to expenses, approximately 13.7% resulted from trading gains and approximately 4.7% was due to interest income. These gains are offset by approximately 10.0% in combined total brokerage fees, performance fees and offering costs borne by Grant Park. An analysis of the 13.7% trading gains by sector is as follows:
Sector % Gain (Loss)
Interest Rates ...................................................... (1.0)% Currencies........................................................... 0.8 Stock Indices ...................................................... 6.9 Energy ................................................................ (1.7) Agriculturals ....................................................... (2.1) Meats .................................................................. (0.3) Metals ................................................................. 10.8 Softs.................................................................... 0.3 Miscellaneous ..................................................... —
Total ............................................................... 13.7%
10

Grant Park recorded gains for the month of January. Class A units were up 3.49% for the month
while Class B units were up 3.41% for the month. Positions in the metals, stock indices, agricultural/soft commodities and energies were profitable. Losses came from positions in the interest rate and currency sectors. Long positions in gold and silver recorded gains as precious metals rallied on news that Iran had removed U.N. seals from uranium purification equipment, sparking fears of a possible military showdown. Longs in aluminum and zinc were profitable as word that China’s economy grew at a greater-than-expected pace sent prices for base metals higher. Long positions in the stock indices were profitable as a rise in German business confidence led to higher prices on the German DAX. The London FTSE-100 gained ground on strength from steel shares while the S&P Composite Index traded higher after it was reported that U.S. durable goods orders grew for a third straight month in December. Continued South American demand for sugar-based ethanol resulted in profits to long positions in the soft/agricultural commodities as sugar prices settled higher for the month. Longs in the coffee market gained as strong demand during the holiday season pushed prices higher for the month. Longs in the energy sector were profitable as the situation in Iran sparked worries over crude oil and gasoline supplies. Reports that militants had targeted Nigerian refinery operations further added to concerns, driving prices higher. Long positions in the London long gilt and British short sterling sustained losses as prices for interest rate instruments fell on news that December retail sales in the U.K. were better-than-anticipated. Losses also came from short positions in the Canadian bills. Lastly, positions in the currency sector were unprofitable as speculation regarding the direction of interest rates in the U.S. and Europe dominated the sector. Long positions in the Swiss franc lost ground as the currency fell versus the U.S. dollar. Losses also came from positions in the Australian and New Zealand dollars. Grant Park sustained losses for the month of February. Class A units had a negative return of 3.28% for the month and Class B units had a negative return of 3.35% for the month. Positions in the metal, energy and currency sectors experienced the largest setbacks. Losses were also the result of positions in the agricultural/soft commodities and interest rate products. Profits came from positions in the stock indices. Base and precious metals prices fell during the month, resulting in losses to long positions in the sector. Lower than expected U.S. industrial production data for January sent prices for copper, zinc and aluminum lower. Analysts suggested that an expected increase in mining activity in 2006 was also responsible for the weakness in base metals. Gold and silver were weaker as the possibility of further interest rate increases in the U.S. forced precious metals prices lower. Long positions in the crude oil market led to losses in the energy sector after data showed crude inventories to be at higher levels than the same period last year. This was possibly the result of unseasonably warm weather in the Northeastern United States. Gasoline prices were also lower, causing losses to long positions. Short positions in the currency sector lost ground as the Japanese yen rallied on comments from Bank of Japan officials suggesting that the Central Bank might gradually increase short-term interest rates which have hovered near zero percent since 2001. This caused the currency to appreciate against the euro, British pound and U.S. dollar. Coffee and sugar prices were lower during the month, resulting in losses for long positions in the soft/agricultural sector. Analysts suggested that the weakness stemmed from the expectation that global production of coffee would rise, particularly in Africa, causing investors to take profits on long positions. Long positions in the foreign interest rate products reported losses as prices for the Australia Ten and Three-year bonds closed lower. Losses also came from positions in the U.S Thirty-year Treasury bond. Lastly, long positions in the stock indices made gains on the strength of utility and banking stocks. The German DAX and Spanish IBEX settled higher, benefiting long positions. Grant Park recorded gains for the month of March. Class A units were up 4.06% for the month while Class B units were up 3.98% for the month. Positions in the interest rates, metals and stock indices posted profits; losses came from positions in the currency, soft/agricultural commodity and energy sectors. Short positions in the Eurodollars and U.S. Treasury instruments benefited as prices for fixed income products fell on the possibility of higher interest rates in the U.S. After raising short term rates
11

for the 15th consecutive time, the Federal Open Market Committee cautioned that further increases could be needed to balance economic growth and price stability. Short positions in the Eurobund and Euribor benefited as prices fell after the European Central Bank boosted short term interest rates early in the month and then indicated that conditions remained favorable for continued economic expansion. Long positions in silver posted gains as the prospect of the U.S. Securities and Exchange Commission’s approval of a silver-based Exchange Traded Fund sent prices higher on speculation that the approval of the fund would deplete supplies of the precious metal. Long positions in the copper market profited as prices were higher on the expectation that current levels of physical demand could outpace inventories of the base metal. Favorable earnings forecasts for automobile and real estate stocks helped push foreign stock indices higher during the month, which benefited long positions in the London FTSE-100, Paris CAC and German DAX. Gains also came from long positions in the Tokyo Nikkei. Short positions in the foreign currencies recorded losses as the euro and Swiss franc appreciated against the U.S. dollar on the expectation that there might be more room for interest rate hikes in Europe as opposed to the U.S. Wet weather across the Midwestern U.S. led to losses from long positions in the soft/agricultural commodity sector as prices for Kansas City wheat fell after heavy rains blanketed the growing region. Corn prices also fell, resulting in losses for long positions. Finally, short positions in the energy sector reported losses as concerns over supply sent prices for heating oil and gasoline higher for the month. Grant Park posted gains during the month of April. Class A units were up 9.46% and Class B units were up 9.38%. The majority of sectors were profitable, with the largest advances the result of positions in the metals sector, followed by gains in interest rates, energies, stock indices and currencies. Losses were confined to positions in the soft/agricultural commodity sector. Long positions in the metals markets reported gains as prices for base metals appreciated during the month. Supply concerns dominated the marketplace as reports of work stoppages at mines in Mexico sent copper prices higher. Forecasts for increased global economic growth also boosted base metals, spurring nickel and aluminum prices to higher levels for the month. Long positions in the gold market benefited as the precious metal traded above $600 per ounce after investors became concerned over claims that Iran had begun to produce enriched uranium. Short positions in the interest rate sector were rewarded as fixed income prices fell on concerns over inflation in Europe and the United States. Short positions in the U.S. Treasury bond, London long gilt and Euro bund benefited as the possibility of interest rate increases on both sides of the Atlantic pushed fixed income prices lower. Short positions in the Australian 90-day bills and ten-year bonds also posted earnings. Worries over supply led to gains in the energy complex as the news regarding Iran’s uranium enrichment program sent crude oil prices higher on concerns that a showdown with the U.S. /U.N might hamper production. Rebel attacks on petroleum facilities in Nigeria also resulted in higher prices. Gains from technology and mining stocks sent the Tokyo Nikkei and Australian Share Price Index higher, resulting in gains to long positions in the stock index sector. Long positions in the currency sector reported gains as the euro currency appreciated against the dollar after the Qatar Central Bank indicated that it would buy euros to diversify its currency holdings. The British pound and Swiss franc also appreciated against the dollar, benefiting long positions in those currencies. Finally, long positions in the sugar market resulted in losses for the soft/agricultural commodity sector as analysts attributed the weakness to liquidation of long positions by investors seeking to protect recent gains. Grant Park experienced minor trading losses during the month of May. Class A units had a negative return of 0.81% while Class B units had a negative return of 0.88%. Stock index positions incurred the largest setbacks, followed by losses to positions in the energy and soft/agricultural commodity sectors. Positions in metals, currencies and interest rates reported gains for the month. Long positions in the stock indices sustained losses as global stock markets experienced a volatile month. Concerns over the prospect of higher inflation, rising interest rates and the possibility of slowing economic growth led to losses from long positions in the German DAX, Nasdaq-100 Index and Tokyo Nikkei. Positions in the energy sector reported setbacks after a report earlier in the month announced that U.S. gasoline inventories had experienced a weekly increase for the first time since February of this year,
12

leading to speculation of lessened demand during the summer driving season. Long positions in the crude oil, heating oil and gasoline markets reported losses. Short positions in the soft/agricultural commodity sector resulted in losses as prices for live cattle were higher during the month on what analysts described as a technical driven rally, with investors pushing prices higher as they moved to liquidate short positions. Long positions in the sugar market also reported losses as prices there were lower for the month. Long positions in the metals sector recorded gains as reports of tight supplies combined with continued economic growth in India, China and South America sent base metals prices higher. Reports of supply disruptions in Mexico and Chile also pushed industrial metal prices higher. Long positions in the foreign currencies profited as the U.S. dollar lost ground to the euro, Swiss franc and British pound amid speculation that short term interest rates could rise faster in Europe than in the United States. Lastly, short positions in the domestic interest rate market were profitable as the Eurodollar contract traded lower after the U.S. Federal Open Market Committee raised the federal funds target rate to 5% and issued a statement saying that any additional rate hikes would depend upon economic data going forward. Grant Park posted trading losses during the month of June. Class A units were down 2.85% while Class B units were down 2.92%. Positions in the currencies, metals, soft/agricultural commodities and stock indices accounted for the majority of losses; energy positions also sustained setbacks. Gains came from positions in the interest rate sector. Long positions in the currency sector incurred losses as the U.S. dollar moved higher during the month, buoyed by the U.S. Federal Reserve Bank’s decision to continue its series of interest rate hikes. Long positions in the euro, British pound and Swiss franc experienced the largest losses as investors were concerned that the interest rate differential between the U.S. and Europe could possibly widen despite the news that the European Central Bank boosted short term rates for the third time in the last six months. The prospect of rising global interest rates sent prices for base metals lower, resulting in losses to long positions in the nickel and copper markets. Precious metal positions also posted losses as gold and silver settled at lower levels. Positions in soybeans and wheat led to losses in the soft/agricultural sector. Long positions in soybeans lost ground during a month of volatile price action driven by technical factors, according to analysts. Long positions in the wheat market experienced losses as favorable weather permitted the U.S. harvest to proceed at a quicker rate than usual, resulting in an excess of supply coming to the market. Positions in the stock indices sustained losses as the possibility of rising interest rates pushed share prices lower. Earlier in the month, long positions in the NASDAQ and German DAX sustained setbacks in response to this downside price action. Long positions in the energy sector experienced losses as the possibility of higher interest rates worried investors that any resulting slow down in economic growth could lessen the demand for fuel, resulting in losses to crude oil positions. Long positions in heating oil also lost ground. Lastly, positions in the interest rate sector reported gains as the prospect of further interest rate hikes across the globe sent prices lower. Short positions in the Eurodollar contract and LIFFE Euribor posted the largest gains in the sector.
Grant Park sustained losses during July. Class A units were down 3.66% while Class B units were down 3.73%. Positions in the interest rates, soft agricultural commodities and energies incurred the largest setbacks, followed by losses in the currency sector. Gains came from the metals and stock indices. Short positions in the interest rate sector reported losses as prices for fixed income instruments rallied around the globe. Domestically, prices for Eurodollars and U.S. Ten-year notes rose after it was reported that U.S. non-farm payrolls were lower than expected during June; comments by Federal Reserve Chairman Ben Bernanke suggesting that the central bank expects moderate inflation going forward also sent prices higher. Open hostilities between Israel and Hezbollah put upward pressure on global fixed income prices as investors worried that the conflict could evolve into a wider war in the Middle East. Short positions in the corn market resulted in losses to the soft/agricultural commodity sector as prices rose in response to scorching heat in Midwestern growing regions and an increase in demand for corn mash for use in distilling gasoline additive ethanol. Long positions in crude oil and unleaded gasoline lost ground after prices fell in response to reports that showed inventories at higher than expected levels. Short positions in natural gas lost ground as soaring temperatures in the U.S. led to an increase in energy
13

demand from gas-fueled power stations. News that the U.S. trade deficit was lower than expected in May resulted in losses to positions in the currency sector. Long positions in the Canadian dollar and euro experienced setbacks as the U.S. dollar rallied on the report. Long positions in the metals sector were profitable as a combination of high demand and waning inventories sent prices for copper and nickel higher for the month. Reports of work stoppages at mines in Chile and Canada gave investors concern that demand could further outpace supply. Lastly, long positions in the foreign stock indices were profitable for the month. Language suggesting that the U.S. Federal Reserve might consider a pause in the central bank’s rate tightening schedule sent share markets higher, particularly the Hong Kong Hang Seng which registered the largest gains in the sector.
Grant Park reported trading gains during August. Class A units were up 2.20% while Class B units were up 2.12%. Profits came from a majority of sectors, with the biggest advances stemming from positions in the currency and interest rate markets. Positions in the metals, stock indices and soft/agricultural commodities also garnered gains. Losses came solely from the energy sector. Short positions in the Japanese yen resulted in gains for the currency sector as the yen depreciated against the British pound and the euro after the Bank of England and the European Central Bank elected to tighten short term interest rates earlier in the month. Weaker than expected economic data out of Japan also benefited yen short positions. Long positions in the interest rate sector were profitable as the weak Japanese economic data pushed Japanese Government bonds higher for the month. U.S. Treasury products were higher as a slowing U.S. housing market combined with lower personal consumption data to push prices higher. Long positions in the metal sector posted gains as inventories of nickel at the London Metals Exchange sank to approximately two days of market consumption, pushing the price of the base metal considerably higher on the month. Long positions in the stock indices produced gains as global share markets were higher after the U.S. Federal Reserve Bank decided not to raise short-term interest rates for the first time in seventeen consecutive meetings. The Hong Kong Hang Seng posted material gains as analysts suggested that exporters benefited the most from the U.S. central bank’s decision. Long positions in the live stock markets resulted in gains for the soft/agricultural commodity sector. Analysts suggested that strong commercial demand sent prices for live hogs higher and the resumption of beef exports from the United States to Japan pushed prices for live cattle higher. Lastly, long positions in the energy sector sustained losses for the month. Crude oil prices fell after a plot to blow up U.S. airliners was foiled by British intelligence, resulting in speculation that worries over terrorism and strict new travel guidelines would result in less air travel and lower demand for jet fuel.
Grant Park sustained trading losses during September. Class A units were down 1.10% while Class B units were down 1.17%. Setbacks were the result of positions in the currencies, metals, soft/agricultural commodities and interest rates. Gains came from the energy and stock index sectors. Long positions in the British pound lost ground after Bank of England officials stated that they expected growth and inflation to be lower than anticipated in the coming months, an indication that the central bank may continue to hold off on any further interest rate hikes. Canadian dollar longs incurred losses as that currency weakened in response to falling energy prices. Losses were incurred to long positions in the copper and aluminum markets as investors’ concerns over a slow down in global economic growth sent prices for raw materials lower. Long positions in the livestock markets sustained losses as prices for beef fell on expectations that the number of cattle on U.S. feedlots would increase; losses to long positions in the hog market occurred after reports of increased pork production and a decrease in U.S. exports. Short positions in the LIFFE euribor contract sustained losses as prices for the short-term interest rate product rose in response to the aforementioned comments by Bank of England officials. Energy prices fell during the month, resulting in gains to short positions in the sector. An increase in U.S. commercial supplies of crude oil coupled with the perception of a lessening in geopolitical risks in the Middle East sent prices for crude, natural gas and heating oil lower for the month. Lastly, long positions in global equity markets were profitable as analysts suggested that the decision by the U.S. Federal Reserve Bank to keep short-term interest rates steady combined with benign U.S. economic data resulted in higher prices for the S&P
14

Composite Index. Longs in the Spanish IBEX were profitable after the index traded higher on merger and acquisition activity from the utility sector.
Grant Park sustained losses in October. Class A units were down 0.64% and Class B units were down 0.71%. Losses were incurred from long positions in the interest rate sector as prices for Japanese government bonds fell after a survey of business conditions there pointed to a more robust economic environment; Eurodollars traded lower after the U.S. Department of Labor reported a drop in the unemployment rate during the month of September. Citing a weaker housing market and falling energy prices, the U.S. Federal Reserve decided to leave short-term interest rates unchanged resulting in a weakened U.S. dollar and losses to short positions in foreign currency crosses; further pressure was put on the dollar amid speculation that interest rates abroad could rise. Orange juice short positions lost ground as prices rose after the U.S. Department of Agriculture estimated next year’s crop to be the smallest in 16 years; soybean shorts lost after prices rose on concerns of a possible outbreak of soybean rust. Gains came from long positions in the global stock indices as the decision by the Federal Reserve to hold rates steady combined with lower energy prices pushed share markets higher. The Hong Kong Hang Seng, S&P Composite Index and German DAX all closed higher for the month. Metal long positions were profitable as zinc prices rallied when it was reported that inventories of the base metal were at fifteen year lows; nickel prices reached their highest levels in nineteen years after blockades at two mines resulted in falling inventories. Gains to short positions in the energy sector came from reports of increases in crude oil inventories; lower gasoline prices also contributed to profits.
Grant Park reported trading gains during November. Class A units were up 3.59% and Class B
units were up 3.51%. Long positions in the currency sector reported gains as both the euro and the British pound traded higher relative to the U.S. dollar on speculation that interest rates in Europe could be rising while rates in the U.S. might be headed lower. Both currencies rallied against the yen as well, resulting in gains to cross rate positions. The prospect of lower interest rates in the U.S. and hope of a soft landing for the U.S. economy led to gains for long positions in the S&P Composite Index. The Hong Kong Hang Seng rose on strength from the insurance and banking sectors. Nickel prices were higher for the month as the weakness in the U.S. dollar combined with labor stoppages at two mines pushed inventories of the base metal to critically low levels, resulting in gains for long positions. Long positions in the silver market were also profitable. Long positions in the corn were profitable after the U.S. Department of Agriculture announced a larger-than-expected reduction in its crop estimate; soybean positions added to gains as U.S. farmers were expected to dedicate more acreage to corn crops during 2007. Prices in the energy complex traded higher after reports showed larger than expected declines in crude product inventories, resulting in losses for short positions. Prices also rallied on news that OPEC members had voted for a second round of production cuts. Short positions in the Australian interest rate market incurred losses after prices rallied when the Reserve Bank of Australia downplayed expectations for a rate increase during the first quarter of next year.
Grant Park reported trading losses during December with Class A units down 0.92% and Class B
units down 0.90%. Long positions in the interest rate sector incurred losses after prices for U.S. Treasury products fell in response to a series of strong economic reports, including a tame reading on consumer prices and news that the U.S. economy had added more jobs in November than economists had forecasted. Grain prices experienced a reversal during the month, resulting in losses for long positions. The soybean and corn markets closed lower as investors moved to take profits on long positions amassed during the upside move in prices earlier in the fourth-quarter. Long positions in the metals markets sustained losses as prices for gold and silver fell for the month. A stronger U.S. dollar combined with selling on behalf of investors seeking to take profits on long positions pushed prices lower. The benign data on consumer prices coupled with the better-than-expected report on U.S. employment resulted in gains for long positions in the S&P Composite Index as the news revived investors’ hopes that the U.S. economy could experience a soft landing during 2007. Short positions in the energy sector reported gains
15

as warmer weather across the U.S. and reports of increased inventories resulted in lower prices for crude oil and natural gas. Short positions in the Japanese yen cross-rate market were profitable as the yen traded lower relative to the euro after the Japanese government reduced projections for economic growth.
The general partner has agreed to rebate back to Grant Park a portion of Grant Park’s operating, organization and offering expenses to the extent actual expenses were less than the actual amount Grant Park paid the general partner. For 2006, the general partner reimbursed Grant Park a total of $700,000, of which $200,000 related to operating expenses and $500,000 related to organization and offering expenses. Year ended December 31, 2005 In 2005, Grant Park suffered its second consecutive losing year, the first time since 1992 and only the second time in the 17 year trading history. As was the case in 2004, the year was marked by significant reversals and volatility in a number of the markets that Grant Park trades. After a strong fourth quarter in 2004, Grant Park suffered a setback for January. These losses were generated across the board in those markets that had just previously contributed to Grant Park’s fourth quarter 2004 success. In the first week of January, the dollar began its strongest one month rally since May of 2001. As the table below shows, the currency sector, historically a strong contributor to performance, was the largest drag on the portfolio in 2005. The dollar spent most of the year range-bound between 120 and 130 leaving little profitable trading opportunity. The overriding story of 2005 became crude oil and, to a certain degree, hurricanes. Crude oil prices started the year at $42.00 a barrel but quickly resumed their rally; however, after peaking at $58.00 a barrel, prices fell 20%. As a leveraged fund that trades both long and short positions, this rally forced most of our traders out of the market due to risk management concerns. After another substantial rally to new highs following Hurricane Katrina, the oil market fell another 20%. Once again it forced our traders out of the markets with little to show for their trading efforts. Another sector which experienced similar volatility was agricultures. During the spring and early summer, parts of the Midwest were caught in a severe drought. Corn and soybean prices rose in anticipation of lower than normal crop yields. In early July, Hurricane Dennis hit the Gulf Coast and pushed significant amounts of moisture into the Midwest, ending the drought. As a result, grain prices and, accordingly Grant Park, gave back most of its prior gains in the markets. These types of reversals characterized many of the markets Grant Park traded in 2005. Consequently, the trading managers spent most of the year on the defensive managing risk and continuing their disciplined approach to trading. There were bright spots, however, in some markets during 2005. The Nikkei Stock Index, sugar and natural gas all exhibited strong trends. Other markets that also exhibited positive trends that Grant Park was able to take advantage of were global short term interest rates and various regional stock indices. In these sectors, Grant Park was able to take advantage of these gains to offset the extreme volatility found in the other markets. For the year ended December 31, 2005, Grant Park had a negative return of 3.4% for the Class A units and a negative return of 4.3% for the Class B units. On a combined basis prior to expenses, approximately 2.2% resulted from trading gains and approximately 2.9% was due to interest income. These gains are offset by approximately 9.2% in combined total brokerage fees, performance fees and offering costs borne by Grant Park. An analysis of the 2.2% trading gains by sector is as follows:
16

Sector % Gain (Loss)
Interest Rates ...................................................... (1.0)% Currencies........................................................... (4.6) Stock Indices ...................................................... 5.1 Energy ................................................................ 1.0 Agriculturals ....................................................... (1.0) Meats .................................................................. (0.1) Metals ................................................................. 1.2 Softs.................................................................... 1.7 Miscellaneous ..................................................... (0.1)
Total ............................................................... 2.2% Grant Park’s performance was negative for the first month of the New Year. Class A units were down 5.96% for the month while Class B units were down 6.04%. Losses were sustained across most sectors, with the most significant losses sustained in the currency and stock index sectors. Short U.S. dollar/long European currency positions were hit hard as the U.S. dollar saw its largest gain against the euro since May of 2001 and finished the month up 3.8% over the euro. The U.S. dollar strengthened as economic data released throughout the month provided evidence that the U.S. economy would grow faster than its European counterparts. The dollar was further strengthened following the release of the FOMC (Federal Open Market Committee) minutes from December, which proved more hawkish than prior market expectations, suggesting that the Fed may be more aggressive in tightening interest rates. As a result, positions in the currency sector were pared back and/or reversed going into February. U.S. stock indices retreated as the threat of higher interest rates weighed heavily on investors’ minds. Long positions in both the S&P 500 Index and the Nasdaq 100 posted losses. Long Hang Seng positions also were unprofitable as shares sold off on worries of capital outflows following the swift U.S. dollar rebound. Additional losses occurred in the metals, energy and agricultural/soft sectors, while modest profits were posted in the financial (fixed income) sector. Grant Park was profitable for the month of February. Grant Park Class A units were up 3.42% for the month while the Class B units were up 3.34% for the month. Profits were concentrated in the stock indices and agricultural/softs sectors, with additional profits in the metals and currency sectors. Losses were attributed to the fixed income sector, while the energy sector was virtually flat. Long positions in global stock indices benefited as strong gains in oil and mining stocks dominated index returns. Net long positions in the grain markets also proved profitable as prices rose amidst forecasts of a continued hot and dry weather pattern across Brazil’s primary growing regions, which would harm crop yields. Additionally, at month’s end the USDA reported a stronger than expected export number which also contributed to higher prices. Soybeans and soybean oil led the rally, increasing more than 17% for the month. Dollar weakness helped support metal prices, adding modest gains to Grant Park’s long positions. The continued weakness in the U.S. dollar also benefited Grant Park’s currency positions, with the most notable winning positions in the sector being long the “commodity” currencies including the Mexican peso, Australian dollar and New Zealand dollar. While short-term interest rate positions were profitable, long-term rate positions experienced significant losses creating net losses for the fixed income sector as a whole. The yield curve in the U.S. finally steepened after Alan Greenspan’s testimony before Congress about the “conundrum” posed by the decline in forward rates, generating losses for Grant Park’s long positions in both the 30-year and 10-year bond. March performance was slightly negative for Grant Park. Class A units were down 0.51% while the Class B units were down 0.59%. Grant Park’s most significant losses were in the currency sector. Long positions in foreign currencies accumulated losses as concerns over inflation sparked a massive rally in the U.S. dollar near month’s end. After the Fed raised short-term interest rates another quarter
17

point on the 22nd of the month, the markets focused on the statements made by the Fed indicating that they are more concerned by the threat of rising inflation than was previously thought. This increased speculation that the Fed may become more aggressive and less “measured” in its approach to increasing interest rates in the near future. Long positions in stock indices also sustained losses as a result of the Fed’s comments and as higher energy prices weighed on the indices. U.S. equities were further damaged by news that General Motors’ 2005 earnings would fall short of estimates, as well as the accounting scandal being uncovered at American International Group. Additional losses were incurred in the metals markets, most notably in long positions in silver and gold as the stronger U.S. dollar made them less attractive holdings. Profits were generated in long positions in the energy sector as prices ended the month stronger. Prices were boosted on the last day of the month following comments from Goldman Sachs warning that ongoing resilient demand could push crude prices as high as $105 per barrel. Additional profits were generated in the interest rate sector, particularly in short positions in U.S short-term interest rate positions, as prices fell following the seventh consecutive interest rate hike by the Fed, as noted above. Performance for Grant Park was negative for the month of April. Class A units were down 5.05% for the month while Class B units were down 5.12%. Grant Park sustained losses in most trading sectors for the month. Positions in the energy, stock index, currency, metals and agricultural/soft sectors posted losses, while positions in the fixed income sector helped to partially offset those losses. Long positions in the energy sector were dealt setbacks as crude, heating oil and unleaded gas prices reversed downward mid-month on weak U.S. economic data and climbing inventories. U.S. crude inventories reached their highest level since May 2002, helped in part by an increase in OPEC production. Natural gas prices were also weaker, as most of the U.S. experienced a milder-than-normal end to winter/early spring. The stock index sector suffered losses on both long and short positions across the globe. Short positions in the Hang Seng during the early part of the month were particularly hard hit as the index rallied substantially. The rally was fueled by speculation of a Chinese yuan revaluation which encouraged inflows into stocks and eased concerns over a rapid rise in local interest rates. Long positions in the Nikkei, the German DAX and Paris CAC-40 also sustained losses as world equity prices softened on weak U.S. economic news, a reduction in economic growth forecasts for the euro-zone, and disappointing earnings reports from a number of U.S. companies. The currency sector recorded additional losses as long U.S. dollar positions against most major currencies were hurt by the aforementioned weak economic news. Long positions in both the metals and agricultural/softs sectors also posted losses. On the brighter side, profits were generated in long global fixed income positions. Prices benefited from the negative data on the U.S. economy as investors reasoned that any future hikes in U.S. interest rates would be kept to a minimum. Prices were further supported by a “flight to quality” premium in the wake of falling energy and equity prices. Performance for Grant Park was positive for the month of May. Grant Park Class A units were up 3.98% for the month while the Class B units were up 3.90% for the month. Gains were attributed to the fixed income and currency sectors, while the remaining four sectors registered modest losses for the month. Long positions in domestic fixed income markets benefited from signs that U.S. economic and inflationary pressures were easing. As a result, many market participants were anticipating that interest rate increases by the Federal Reserve would come to an end soon. Long positions in European fixed income markets were also profitable as prices rose steadily amidst a “flight to quality” rally, brought on by continued weakness in the euro currency. Prices were additionally boosted as economic growth appeared to be moderating and perhaps weakening throughout Europe, putting pressure on the European Central Bank to ease rates after a two-year rate freeze. Long U.S. dollar, short European currency positions posted solid gains as negative sentiment in Europe continued to build. European confidence fell to a 21-month low in May as high oil prices, high unemployment, and France’s rejection of the European Constitution sent the euro to seven-month lows against the greenback. Grant Park’s short euro position was the most profitable currency trade for the month. Short Swiss franc positions were additionally
18

profitable as were long U.S. dollar index positions. Losses in the remaining sectors were modest, with the most notable being in the energy sector. Short positions suffered as crude oil prices rose amidst tightening supply concerns as we headed into the summer driving season. June was profitable for Grant Park. Class A units were up 1.89% for the month while the Class B units were up 1.81%. Profits were earned in the interest rate, currency and stock indices sectors, while losses were attributed to energies, agriculturals/softs and metals. Long positions in European interest rates proved profitable as prices advanced following a reduction in European economic growth forecasts, which raised the likelihood that the European Central Bank would cut interest rates in the near future. Additional profits were earned in long Japanese government bond positions, which rallied amid signs that that nation’s economy was continuing to struggle. Short positions in European currencies earned profits as they declined against the U.S. dollar following the rejection of the proposed E.U. constitution by French and Dutch voters. The euro, Swiss franc, and British pound all declined against the U.S. dollar. The U.S. dollar continued its rise following news that the April U.S. trade deficit was smaller than expected. Increasing speculation that the European Central Bank could cut interest rates in the near future, as noted above, also helped to push the euro lower. Long positions in European stock indices were additionally profitable, as news of continuing U.S. economic growth eased fears of a slowdown in European exports and boosted equity prices in Europe. Oil companies were particularly strong performers, as energy prices remained high. Mining stock benefited from higher metal prices as well. End of the month reversals in commodity markets, particularly in the energy complex and agricultural markets, wiped out earlier gains and generated losses for the month. Additional losses were generated in various positions in the metals sector. July performance was negative for Grant Park. Class A units were down 1.96% for the month while Class B units were down 2.03%. Significant losses were incurred in the interest rate sector. Losses were partially offset by gains in the stock index and energy sectors. Performance for the remaining sectors was relatively flat for the month. European bonds initially rallied on flight-to-quality buying after the July 7th London terror attacks, but drifted lower as the perceived threat diminished. Long positions continued to suffer as strong French economic data lowered expectations that the European Central Bank would be cutting interest rates in the near future. Long positions in Japanese Government bonds also contributed to losses in the sector, as positive economic news and strong corporate earnings sent bond prices lower. The Japanese government reported its unemployment rate dropped to 4.2 percent, a seven-year low. Profits were generated in long positions in European equities, which rallied amid hopes that a stronger U.S. dollar would prove beneficial to exporters. Additional profits were earned in long positions in the energy sector, as prices continued to rise amidst worries of hurricane-related disruptions to production and shipping facilities in the Gulf of Mexico. Grant Park posted profits in August. Class A units were up by 1.97% for the month and Class B units posted a 1.89% profit. Positions in the energy sector were responsible for the majority of gains while losses were experienced in the currency and fixed income sectors. Long positions in the energy sector enjoyed solid gains. Prices strengthened throughout the month, initially on concerns that the death of King Fahd of Saudi Arabia would lead to instability in the Middle East. At the end of the month, prices soared as Hurricane Katrina caused a virtual shutdown of production facilities and refineries in the affected region. Grant Park’s short positions in European currencies incurred losses. The U.S. dollar weakened amid concerns that the U.S. economy may be slowing. Speculation that the European Central Bank would refrain from lowering interest rates also caused the euro to rise. Short positions in short-term U.S. interest rate futures also incurred losses, as Eurodollar futures rallied on worries that Hurricane Katrina and higher energy prices could adversely impact U.S. economic growth. Performance for Grant Park was relatively flat for the month of September. Class A units were down 0.04% for the month while Class B units were down 0.11%. Losses were largely attributed to the
19

interest rate sector, while positions in stock indices, currencies, metals and the agricultural/soft commodities were profitable. Positions in the energies provided mixed results with the sector as a whole reflecting a flat month. Inflationary concerns dealt a blow to long positions in the interest rate sector as prices weakened both at home and abroad. Additionally, the initial feeling that the U.S. Federal Reserve may hold off on any rate increases until they determine the economic impact of both Hurricane Katrina and Rita proved mistaken as they raised rates another quarter point on September 20th. As a result, the sell-off in treasuries dragged bond markets down across the globe. Long positions in stock indices enjoyed a positive month, especially for positions in the Nikkei and Hang Seng. News of the landslide victory by Koizumi's Liberal Democratic Party in Japan spurred investors to push the index over 13,000, touching four-year highs. Modest profits were generated in the currency sector, in particular to long positions in the Canadian and Australian dollars, which rallied along side the U.S. dollar. Long positions in gold also contributed to gains for the month, with prices rallying over $34 for the month to close the December futures contract at $472.30 per ounce. Finally, long positions in the energy sector provided mixed results with long crude oil positions posting losses and long natural gas and unleaded gas positions posting gains. Supply concerns for the refined products remained the dominant factor throughout the month. Grant Park sustained losses for the month of October. Class A units were down 3.38% while Class B units were down 3.45%. Positions in the stock indices, energies and soft/agricultural commodities recorded setbacks while profits came from the interest rate, metal and currency sectors. Long positions in the Asian stock indices were hard hit as concerns over the spread of Avian flu in the region drove the Hang Seng and Nikkei to close the month at lower levels. Long positions in the European indices also lost ground as disappointing earnings and fears over rising interest rates sent the FTSE and DAX to lower levels. Long positions in unleaded gasoline posted losses after the U.S. Department of Energy (DOE) reported declines in U.S. demand and as Gulf Coast refinery output gradually increased after the recent hurricanes. Natural gas prices fell when the DOE released a larger than expected inventory report and weather across U.S. user regions was warmer than usual. Short positions in coffee resulted in losses as prices rallied amid concerns over hurricane damage to Central American crops. Short positions in the U.S. Thirty-year bond and Ten-year note were profitable as a strong report on U.S. Gross Domestic Product and a jump in consumer prices sent fixed income prices lower. Concerns over higher interest rates in Europe sent the euribor contract lower, benefiting short positions. Long positions in the base metals were profitable as strong Chinese demand coupled with reports of production problems and diminishing inventories sent copper prices higher. Prices for nickel and aluminum were also higher, benefiting long positions. Short positions in the Japanese yen recorded gains as the Asian currency depreciated against the U.S. dollar, which rallied in response to the favorable report on U.S. Gross Domestic Product. Grant Park reported gains for the month of November. Class A units were up 4.16% while Class B units were up 4.08%. Positions in the metals, stock indices, currencies, soft/agricultural commodities and energies were profitable. Losses were confined to positions in the interest rate sector. Long positions in the metals sector gained ground as gold prices rose in response to continued buying on behalf of China and India. Warnings from U.S. Federal Reserve Chief Alan Greenspan about the threat of long-term inflation also boosted gold prices. Ongoing global demand for raw materials pushed prices for aluminum, copper and zinc to higher levels, benefiting long positions. Reports that the Japanese economy had posted its fourth consecutive quarter of positive growth led to gains from long positions in the Tokyo Nikkei. Longs in the S&P Composite Index, German DAX and Euro STOXX Index benefited from higher prices in those indices. Short positions in the Japanese yen were profitable as that currency depreciated against the U.S. dollar after the greenback rallied in response to the Fed Chairman’s aforementioned statement regarding the threat of long term inflation. Long positions in the sugar market were profitable as technical-driven buying resulted in higher prices for the soft commodity. Short positions in the corn gained ground on news that the U.S. Department of Agriculture had increased its ending stocks estimate
20

for 2005/06. Short positions in the energies reported profits as prices for heating oil and crude oil fell in response to a period of unseasonably warm weather across U.S. user regions. Short positions in the interest rate sector sustained losses when the Eurodollar traded higher after the release of the minutes from the Federal Open Market Committee’s November 1st meeting which revealed that the central bankers harbored concerns about taking the rate tightening cycle too far. Data that suggested strong foreign demand for U.S. securities pushed prices for the Thirty-year bond and Ten-year note higher, resulting in losses to short positions. Losses also came from short positions in the British short-sterling and Australian Ten-year bond. Grant Park sustained losses for the month of December. Class A units were down 1.36% and Class B units were down 1.35%. Positions in the currencies, energies and interest rates experienced setbacks while gains came from positions in the metals and stock indices. Performance in the soft/agricultural commodities was mixed. Short positions in the Japanese yen reported losses when the currency rallied on a jump in Japanese business confidence and on speculation that the Bank of Japan could shift away from its zero interest rate policy in the coming year. Comments from European Central Bank officials indicating the possibility of higher interest rates resulted in losses to long positions in the U.S. dollar, which depreciated against the euro and British pound. Reports of larger-than-expected inventories combined with mild weather resulted in losses for long positions in natural gas. Short positions in crude oil sustained losses on news that OPEC might implement production cuts. Short positions in Eurodollars and Five-year notes incurred losses as prices for domestic interest rate products rallied after the U.S. Federal Reserve Bank omitted the term “accommodating” when describing monetary policy going forward. Long positions in gold were profitable as the precious metal reached its highest levels in 24 years due to ongoing demand from China and reports that some Asian central banks might increase their gold reserves. Continued global demand for base metals resulted in profits for long positions in aluminum and zinc. Heavy buying of Japanese real estate stocks helped push the Tokyo Nikkei above 16000 for the first time since October of 2000, benefiting long positions. Long positions in the German DAX were also profitable. Long positions in the sugar market reported gains as prices rallied on speculation that a drought in Thailand would result in a smaller crop. Long positions in soybeans lost ground as prices declined following forecasts for rain across Argentinean growing regions. The general partner agreed to rebate back to Grant Park a portion of Grant Park’s operating, organization and offering expenses to the extent actual expenses were less than the actual amount Grant Park paid the general partner. For 2005, the general partner reimbursed Grant Park a total of $600,000, of which $300,000 related to operating expenses and $300,000 related to organization and offering expenses. Year ended December 31, 2004 In 2004, Grant Park suffered its first losing year since 1999. The majority of the year’s losses were experienced in the second quarter and early third quarter. Those losses were the result of significant trend reversals in markets that had been an important source of profits in 2003 and the first quarter of 2004. These reversals included monthly peak to trough reversals in the following markets: nickel down 20.0%, silver down 31.0%, U.S. bonds down 9.8%, copper down 16.6% and soybeans down 24.0%. During the same period, short positions in the U.S. dollar saw a rally of 4.9%. As a result of these historically significant reversals, Grant Park experienced a drawdown of (23.65)%, which lasted six months, from February, 2004 to August, 2004. The principal economic driver of the market reversals during this time period was the Central Bank of China’s decision to increase loan reserve requirements in certain targeted sectors of the Chinese economy for the third time in four months. This was done in an effort to cool down what was perceived to be an overheating Chinese economy. The “China Story” had been a prime fundamental driver in the prices for base metals, precious metals and grain markets. Once the Central Bank of China raised its
21

reserve requirements for the third time, the markets feared that the “China Story” may be coming to an end and a rush to liquidate positions in metals and grains occurred. At the same time in April, the U.S. reported its largest one month increase in new jobs in four years. This report resulted in the biggest one day decline in the history of the thirty-year U.S. Treasury bond. As a result of the higher interest rates implied by lower fixed income prices, the U.S. dollar rallied resulting in additional losses for Grant Park’s short dollar positions during this time period. By early July, Grant Park had liquidated a majority of its long and short positions in most sectors. Throughout July and August, Grant Park found little trading opportunity in which it could recoup the spring’s losses. However, September began a four month period in which Grant Park’s Class B units increased in value by 12.15% ending the year down 8.4%. The profits generated during this four month period were the result of the U.S. dollar resuming its downtrend and energy prices making new yearly highs coupled with strong metal prices. Additionally, Grant Park benefited by a year end surge in global stock indices.
For the year ended December 31, 2004, Grant Park had a negative return of approximately 7.6% for the Class A units and a negative return of 8.4% for the Class B units. On a combined basis prior to expenses, approximately 2.0% resulted from trading gains and approximately 1.4% was due to interest income. These gains are offset by approximately 11.6% in combined total brokerage fees, performance fees and operating and offering costs borne by Grant Park. An analysis of the 2.0% trading gains by sector is as follows:
Sector % Gain (Loss)
Interest Rates ...................................................... (1.0)% Currencies........................................................... 1.3 Stock Indices ...................................................... (1.2) Energy ................................................................ 3.2 Agriculturals ....................................................... 2.1 Meats .................................................................. 0.3 Metals ................................................................. (1.0) Softs.................................................................... (1.0) Miscellaneous ..................................................... (0.7)
Total ............................................................... 2.0% The first month of 2004 was slightly profitable for Grant Park. Grant Park Class A units were up 0.38% while Class B units were up 0.31% for the month. The month was a volatile one, with modest profits generated in the agricultural, metal and currency sectors. These gains collectively offset significant losses in the fixed income sector. Gains in the agricultural and metal sectors continued to be fueled by tight supplies amid surging Chinese demand, while gains in the currency sector were largely attributable to a surge in the British pound, which hit an 11 year high against the U.S. dollar, amidst continuing signs of strong growth in the British economy. Losses in the fixed income sector were largely attributable to the omission of “considerable period” in the U.S. Federal Reserve January statement release in referencing the maintenance of current interest rate levels. This omission was a clear shift in sentiment and shifted the market’s expectations for a sooner rather than later rise in U.S. interest rates. February’s performance was strong with Class A units posting a 7.33% gain and Class B units up 7.25% on the month. Gains were driven largely by the continued weakness in the U.S. dollar, with gains experienced in the grains, energy, currency and fixed income markets. Copper prices reached an 8-year high, rising 18% in February alone. Continued global demand coupled with a decrease in warehouse supply levels contributed to the continued strength in this market. Soybean prices rallied 15% on the
22

month amidst concerns of a weaker-than-expected South American crop and continued growth of Chinese demand. Crude oil and related products rose after a greater-than-expected decrease in U.S. gasoline inventories. The British pound continued to strengthen, rising to its highest level against the U.S. dollar since 1992, as expectations of continued interest rate hikes were priced into the market. Finally, gains were experienced in long global interest rate positions in response to comments by Alan Greenspan suggesting that an interest rate hike by the Federal Reserve was not imminent. Losses were incurred in short positions in British and Australian interest rate futures, which rose as part of a global rally in bonds following the U.S. lead. Additional losses were incurred in long coffee positions and long euro positions. Grant Park’s performance was negative for March with Class A units down 1.40% on the month and Class B units down 1.47%. The month was volatile with the currency, fixed income and equity index sectors particularly volatile as a result of apparent policy shifting by many of the world’s central banks. Grant Park suffered losses in long British Pound positions as the pound declined against the U.S. dollar as an improving U.S. economic outlook fueled speculation that the Federal Reserve could raise U.S. interest rates in the near future. Additional losses were generated in short Japanese yen positions as the yen rose against the U.S. dollar amid anticipation that the Bank of Japan would curtail its sales of its currency following the end of the Japanese fiscal year. Additional losses were suffered in the industrial metals, including nickel, zinc and aluminum, as the U.S. dollar’s strength resulted in reduced demand from European buyers. Additional losses were generated in sugar, Japanese Government Bonds and the Hang Seng Index. Grant Park’s largest profits were earned in silver, which hit a 16-year high at the end of the month. Additional profits were generated in long positions in soybeans and soybean meal, as limited U.S. supplies and a bitter strike at Brazil’s main grain port combined to send soy prices to a 16-year high as well. April was a difficult trading month for trend trading and our portfolio of traders in particular. Grant Park Class A units were down 11.66% for the month and Class B units were down 11.72% for the month. Major trends across several market sectors (which normally exhibit little correlation) reversed collectively as they were struck by three major fundamental factors. The first was surprisingly positive U.S. employment news. On the second day of the month it was announced that the U.S. economy added 308,000 new jobs during the month of March. Forecasts by economists were predicting an increase in the vicinity of 120,000. The workforce additions marked the biggest one-month increase in payrolls in four years. The second factor was the strength of the U.S. dollar, reflecting both a brightening U.S. economic outlook and the likelihood of a Federal Reserve rate hike occurring sooner than previously anticipated. Finally, the third factor was China’s tightening of its monetary policy. The Chinese Central Bank raised its banking reserve requirements for the third time in nine months, amidst concerns that the torrid pace of economic growth would lead to excess capacity and inflation. With this action, the central bank is attempting to restrict and reduce bank lending, money supply growth, and potentially excessive rates of economic expansion. As a result, Grant Park incurred losses in both long U.S. and European interest rate futures. U.S. fixed income prices fell sharply as a result of the positive March labor report. In fact, within minutes of the release of the report, prices for 30-year bonds collapsed five full points, which was the biggest one-day drop in the history of the 30-year bond. A positive durable goods report released in the second week of the month added to the sell-off. European interest rate futures responded in kind. Additional losses were incurred in long positions in the metals markets, as precious and industrial metal prices plunged in response to the prospects of higher interest rates combined with a stronger U.S. dollar and further depressed by speculation that the Chinese central bank’s new reserve requirements would reduce Chinese demand for industrial metals. The strong dollar and the Chinese central bank policy changes also put pressure on grain prices as well, generating additional losses in long positions in both corn and soybean markets. Equity markets also proved difficult. Grant Park posted losses in short positions in the FTSE, Dax, NASDAQ, and S&P 500. Long positions in the Hang Seng were also unprofitable. The only sector posting moderate gains for the month was long positions in the energy sector as prices rallied on OPEC’s decision to lower output.
23

Unfortunately, markets remained choppy and volatile throughout the month of May with simultaneous “start-stop” markets in currencies, fixed income and equities. Grant Park Class A units were down 4.75% for the month while Class B units were down 4.82% for the month. In general, markets seemed to lack any clear economic backdrop and exhibited little directional rhythm. As a result, Grant Park’s overall market exposure remained light. Losses were incurred in short positions in the British pound, euro and Swiss franc as prices all rose against the U.S. dollar. Weaker-than-expected U.S. economic data coupled with the assassination of Izzedine Salim, the head of the interim Iraqi governing council, resulted in a sell-off for the U.S. dollar. Long positions in the grain sector also posted losses as wet weather in the Midwest alleviated fears that previously dry conditions would damage the newly planted crop. Additional losses were incurred in long positions in the Nikkei index, which dropped sharply following a strong U.S. jobs report released on May 7th. Grant Park continued to profit from long positions in the energy sector, as prices continued their upward climb. The situation in the Middle East, lingering supply concerns and unprecedented demand for crude from the Chinese government, all contributed to strengthening prices. Finishing a difficult quarter for Grant Park, June’s performance was again negative. Class A units were down 4.47% for the month while Class B units were down 4.55%. June market conditions proved to be even more volatile than the difficult trend reversals in April and May. The lack of any sustained directional price patterns and significant short-term volatility created a very unfriendly environment for our trend following portfolio of traders. Losses were incurred across almost all trading sectors. Short positions across the bond yield curve here in the U.S. were largely unprofitable for the month as confusion reigned, as the path to higher rates in the U.S. remained unclear. Indications from Alan Greenspan early in the month led investors to believe the Fed was prepared to act decisively on inflations fears, causing a sell off. One week later, however, investors were surprised by lower than expected Consumer Price Index data, sending interest rates lower and prices higher. Additional losses were experienced in short British interest rate futures as concerns mounted that earlier rate hikes there were causing softness in the housing market, leading to speculation that the Bank of England may be less aggressive in announcing future rate hikes. Previously profitable long positions in the energy sector posted losses on news that OPEC decided to increase its production quotas as of August 1st. Prices continued to decline after the U.S.-led coalition restored Iraqi sovereignty two days ahead of schedule. Furthermore, trading in the currency markets was mixed for the month with the overall sector posting losses. Generally, major currencies have been caught in choppy (start-stop) ranges, a result of market uncertainty over how aggressively the Fed will raise interest rates. Profits were earned in the soft sector, in both cotton and sugar. Short positions in the cotton market profited amidst slack demand from China and bearish overall U.S. export numbers. Conversely, long positions in the sugar market were helped by a surprising USDA report noting that sugar stocks would be down an estimated 30.3 million tons, or 21%. July performance was negative for Grant Park. Class A units were down 3.36% for the month while Class B units were down 3.44%. Grant Park’s portfolio of traders encountered another difficult trading environment for their trend following programs in the global fixed income, currency and equity sectors. Short positions in European interest rates incurred losses, as short-term instruments rallied after the European Central Bank declined to raise interest rates. Prices continued to move higher in the wake of a weaker-than-expected U.S. employment report, which created concerns that global economic growth may be slowing. This same report also caused U.S. interest rates to rally, generating additional losses in Grant Park’s short positions. Additional losses accumulated in the currency sector as the U.S. Dollar rallied. Short positions in the U.S. Dollar index and long positions in the British Pound produced losses. The dollar strength was attributed to comments made mid-month by Alan Greenspan in his appearance before Congress, suggesting that U.S. economic growth, despite recent signs of weakness, was still strong enough to warrant additional interest rate hikes by the Federal Reserve. The dollar rallied further following a report showing that U.S. consumer confidence hit a two-year high. Finally, long positions in
24

equity markets suffered as prices weakened amidst weak earnings reports and higher energy prices. Equity markets were further weakened by investor concerns surrounding the possibility of another terrorist attack before the November elections in the U.S. Losses were partially offset by gains in long positions in the energy sector, as prices continued to rally. Supply concerns and the Yukos scandal in Russia continued to boost prices. Additional gains were made in short positions in grains as ideal weather conditions prevailed, suggesting record crops for the year. Grant Park generated losses in the month of August. Class A units lost 0.32% while Class B units were down 0.40% for the month. August saw the continuation of erratic behavior in the markets, lacking any sustained trends in most market sectors. Losses were suffered in the currency, agricultural, stock indices and energy sectors while profits were generated in the interest rate sector. Losses accumulated throughout the currency sector, as prices moved up and down throughout the month on mixed economic data, volatile energy prices, and fear of another terrorist attack in the United States at the Republican National Convention. Positions in the sector were difficult to establish for any length of time as price behavior was erratic. Short positions in grains suffered as a surprise cold spell in the northern Midwest raised worries about possible crop damage and reduction in yields. Parts of North Dakota and Iowa reported near-freezing temperatures, while temperatures throughout the month of August approached record historic lows. Additional losses were generated in long sugar positions as reports of a larger than expected Brazilian crop prompted prices to drop 6% on the month. Short positions in orange juice also suffered losses as the damage to the Florida crop from Hurricane Charley became clear. Losses were also generated in short positions in stock indices. Global stock indices rallied as crude oil retreated from a mid-month high of $50 to just over $43 at month’s end. Finally, losses were reported in long positions in crude oil, heating oil and unleaded gas as prices came off sharply from their mid-month highs amidst reports of increased U.S. inventories of both gasoline and heating oil and upon the peaceful resolution to the standoff at the Imam Ali Mosque in Najaf between U.S. forces and followers of Iraqi cleric Moqtada al-Sadr. On a positive note, interest rates were the only profitable sector for the month. Long positions in both U.S. and European bonds generated profits as prices moved higher on weak employment figures reported in the U.S and additional economic reports suggesting the economy is not growing as fast as many had anticipated. After several losing months, performance for Grant Park was positive for the month of September. Class A units gained 1.07% while Class B units gained 0.99% for the month. High energy prices consumed the economic news for the month as crude oil closed the month at $49.64 per barrel, up $7.53 for the month. As a result, Grant Park’s most significant gains were in the energy, metals and currency sectors. Long positions in the energy sector provided Grant Park with its largest gains as prices continued to trend steadily upward. Declines in U.S. inventories, ongoing disruptions in Iraqi production, hurricane damage to the refineries in the Gulf of Mexico, as well as growing civil unrest in Nigeria all contributed to higher prices. Additional profits accumulated in long positions in the base metals including copper, nickel and aluminum. Prices moved higher amid evidence of renewed demand from China and were further supported by a weakening U.S. dollar. Positions in the currency markets also provided profits as mixed economic reports out of the U.S. continued to weaken the U.S. dollar. Long positions in both the Euro currency and Canadian dollar generated profits. Profits generated in the sectors noted above were partially offset by losses suffered in both the interest rate and stock indices sectors. Mixed economic reports and uncertainty surrounding the future of interest rate hikes in both the U.S. and Europe gave way to volatility in both sectors, generating losses. October was a profitable month for Grant Park. Class A units were up 3.43% for the month while Class B units were up 3.35%. Gains came largely from positions in the currency, financial, and energy sectors while losses were suffered in the commodities and metals sectors. The U.S. dollar continued to decline, benefiting long positions in the Canadian dollar, Euro and Japanese yen as well as short positions in the U.S. dollar index. Additional profits were earned in long global interest rate positions, as prices
25

continued to rally as oil prices reached record highs, threatening the strength of the U.S. economic rebound. Long positions in the energy sector also continued to profit as prices reached record highs amidst continued supply disruptions in Iraq, Russia and Nigeria. Prices did come off their highs at month-end as news of higher inventories in the U.S. drove prices down. Going in to November, Grant Park has reduced its overall long position in the sector. Grant Park’s largest losses stemmed from long positions in the base metals markets as prices sharply reversed, particularly in nickel, aluminum and copper on the back of the above noted speculation of a slowdown in U.S. economic growth. Prices continued to drop on news of China’s first interest rate increase in nine years. The continuing weakness of the U.S. dollar sparked another profitable month in November for Grant Park. Grant Park A units were up 8.45% for the month while the B units were up 8.37% for the month. The weak U.S. dollar remained the focus of the month. The dollar has now dropped for seven weeks in a row, reaching its lowest value against the Japanese yen since 2000, and a record-low against the euro. The dollar sank on comments mid-month from Alan Greenspan, who suggested that the U.S. may be growing too dependent upon foreign capital to fund the trade deficit. Speaking in Germany, the Fed chairman told a group of central bankers that the growing U.S. current account (trade) deficit could, at some point, cause foreign demand for U.S. dollars, bonds and equity to subside. As a result, profits were earned in long foreign currency positions, most notably the euro, Swiss franc and Japanese yen and a short dollar index position. Additional profits were generated in long positions in stock indices as prices rallied on improved economic conditions around the world. Finally, Grant Park also posted profits in long metal positions, particularly in gold as the weak dollar boosted gold prices. On the negative side, Grant Park sustained modest losses on short positions in the energy sector on news late in the month that U.S. inventories of both natural gas and heating oil fell more than anticipated, thus boosting prices. After a few profitable months in a row, December proved to be a challenging trading month for Grant Park. Performance for the month was negative. Class A units were down 0.89% while the B units were down 0.96% to finish the year down 7.58% and 8.40% respectively. The Grant Park’s largest losses were incurred in the metals sector, particularly in long positions in both gold and silver. The U.S. dollar experienced a short-lived rally, causing precious metals, which had been favored by investors seeking a hedge against a weaker dollar, to lose some of their appeal. Additional losses were incurred in the currency sector. Long positions in the Canadian dollar incurred losses. The currency sold off following the Bank of Canada’s decision to back off its policy of raising rates “over time”, as the strong currency appeared to be having a negative impact on the country’s exports. Additional losses were incurred in long Japanese Yen and Swiss Franc positions. The financial (interest rate), agricultural/soft, and energy sectors also experienced modest losses as the year-end markets were characteristically volatile. On the other hand, profits were generated in the stock indices sector as long positions in both U.S. and European equities benefited from a decline in energy prices. Capital Resources
Grant Park plans to raise additional capital only through the sale of units pursuant to the continuous offering and does not intend to raise any capital through borrowing. Due to the nature of Grant Park’s business, it does not make any capital expenditures and does not have any capital assets that are not operating capital or assets.
Liquidity
Most U.S. futures exchanges limit fluctuations in some futures and options contract prices during a single day by regulations referred to as daily price fluctuation limits or daily limits. During a single trading day, no trades may be executed at prices beyond the daily limit. Once the price of a contract has reached the daily limit for that day, positions in that contract can neither be taken nor liquidated. Futures
26

prices have occasionally moved to the daily limit for several consecutive days with little or no trading. Similar occurrences could prevent Grant Park from promptly liquidating unfavorable positions and subject Grant Park to substantial losses that could exceed the margin initially committed to those trades. In addition, even if futures or options prices do not move to the daily limit, Grant Park may not be able to execute trades at favorable prices, if little trading in the contracts is taking place. Other than these limitations on liquidity, which are inherent in Grant Park’s futures and options trading operations, Grant Park’s assets are expected to be highly liquid.
Off-Balance Sheet Risk
Off-balance sheet risk refers to an unrecorded potential liability that, even though it does not appear on the balance sheet, may result in future obligation or loss. Grant Park trades in futures and other commodity interest contracts and is therefore a party to financial instruments with elements of off-balance sheet market and credit risk. In entering into these contracts, Grant Park faces the market risk that these contracts may be significantly influenced by market conditions, such as interest rate volatility, resulting in such contracts being less valuable. If the markets should move against all of the commodity interest positions of Grant Park at the same time, and if Grant Park were unable to offset positions, Grant Park could lose all of its assets and the limited partners would realize a 100% loss. Grant Park minimizes market risk through real-time monitoring of open positions, diversification of the portfolio and maintenance of a margin-to-equity ratio that rarely exceeds 25%. All positions of Grant Park are valued each day on a mark-to-market basis.
In addition to market risk, in entering into commodity interest contracts there is a credit risk that a counterparty will not be able to meet its obligations to Grant Park. The counterparty for futures and options on futures contracts traded in the United States and on most non-U.S. futures exchanges is the clearing organization associated with such exchange. In general, clearing organizations are backed by the corporate members of the clearing organization who are required to share any financial burden resulting from the non-performance by one of their members and, as such, should significantly reduce this credit risk.
In cases where the clearing organization is not backed by the clearing members, like some non-U.S. exchanges, it is normally backed by a consortium of banks or other financial institutions.
In the case of forward contracts, over-the-counter options contracts or swap contracts, which are traded on the interbank or other institutional market rather than on exchanges, the counterparty is generally a single bank or other financial institution, rather than a central clearing organization backed by a group of financial institutions. As a result, there likely will be greater counterparty credit risk in these transactions. Grant Park trades only with those counterparties that it believes to be creditworthy. Nonetheless, the clearing member, clearing organization or other counterparty to these transactions may not be able to meet its obligations to Grant Park, in which case Grant Park could suffer significant losses on these contracts.
In the normal course of business, Grant Park enters into contracts and agreements that contain a variety of representations and warranties and which provide general indemnifications. Grant Park’s maximum exposure under these arrangements is unknown, as this would involve future claims that may be made against Grant Park that have not yet occurred. Grant Park expects the risk of any future obligation under these indemnifications to be remote.
27

ITEM 7A. QUANTITATIVE AND QUALITATIVE DISCLOSURES ABOUT MARKET RISK
Introduction
Grant Park is a speculative commodity pool. The market sensitive instruments held by it are acquired for speculative trading purposes, and all or a substantial amount of Grant Park’s assets are subject to the risk of trading loss. Unlike an operating company, the risk of market sensitive instruments is integral, not incidental, to Grant Park’s business.
Market movements result in frequent changes in the fair market value of Grant Park’s open positions and, consequently, in its earnings and cash flow. Grant Park’s market risk is influenced by a wide variety of factors, including the level and volatility of exchange rates, interest rates, equity price levels, the market value of financial instruments and contracts, market prices for base and precious metals, energy complexes and other commodities, the diversification effects among Grant Park’s open positions and the liquidity of the markets in which it trades.
Grant Park rapidly acquires and liquidates both long and short positions in a wide range of different markets. Consequently, it is not possible to predict how a particular future market scenario will affect performance. Grant Park’s current trading advisors all employ trend-following strategies that rely on sustained movements in price. Erratic, choppy, sideways trading markets and sharp reversals in movements can materially and adversely affect Grant Park’s results. Grant Park’s past performance is not necessarily indicative of its future results.
Value at risk is a measure of the maximum amount that Grant Park could reasonably be expected to lose in a given market sector in a given day. However, the inherent uncertainty of Grant Park’s speculative trading and the recurrence in the markets traded by Grant Park of market movements far exceeding expectations could result in actual trading or non-trading losses far beyond the indicated value at risk or Grant Park’s experience to date. This risk is often referred to as the risk of ruin. In light of the foregoing as well as the risks and uncertainties intrinsic to all future projections, the inclusion of the quantification included in this section should not be considered to constitute any assurance or representation that Grant Park’s losses in any market sector will be limited to value at risk or by Grant Park’s attempts to manage its market risk. Moreover, value at risk may be defined differently as used by other commodity pools or in other contexts.
Materiality, as used in this section, is based on an assessment of reasonably possible market movements and the potential losses caused by such movements, taking into account the leverage, and multiplier features of Grant Park’s market sensitive instruments.
The following quantitative and qualitative disclosures regarding Grant Park’s market risk exposures contain forward-looking statements. All quantitative and qualitative disclosures in this section are deemed to be forward-looking statements, except for statements of historical fact and descriptions of how Grant Park manages its risk exposure. Grant Park’s primary market risk exposures, as well as the strategies used and to be used by its trading advisors for managing such exposures are subject to numerous uncertainties, contingencies and risks, any one of which could cause the actual results of Grant Park’s risk controls to differ materially from the objectives of such strategies. Government interventions, defaults and expropriations, illiquid markets, the emergence of dominant fundamental factors, political upheavals, changes in historical price relationships, an influx of new market participants, increased regulation and many other factors could result in material losses as well as in material changes to the risk exposures and the risk management strategies of Grant Park. Grant Park’s current market exposure and/or risk management strategies may not be effective in either the short-or long-term and may change materially.
28

Quantitative Market Risk
Trading Risk
Grant Park’s approximate risk exposure in the various market sectors traded by its trading advisors is quantified below in terms of value at risk. Due to Grant Park’s mark-to-market accounting, any loss in the fair value of Grant Park’s open positions is directly reflected in Grant Park’s earnings, realized or unrealized.
Exchange maintenance margin requirements have been used by Grant Park as the measure of its value at risk. Maintenance margin requirements are set by exchanges to equal or exceed the maximum losses reasonably expected to be incurred in the fair value of any given contract in 95% to 99% of any one-day interval. The maintenance margin levels are established by brokers, dealers and exchanges using historical price studies as well as an assessment of current market volatility and economic fundamentals to provide a probabilistic estimate of the maximum expected near-term one-day price fluctuation. Maintenance margin has been used rather than the more generally available initial margin, because initial margin includes a credit risk component that is not relevant to value at risk.
In the case of market sensitive instruments that are not exchange-traded, including currencies and some energy products and metals in the case of Grant Park, the margin requirements for the equivalent futures positions have been used as value at risk. In those cases in which a futures-equivalent margin is not available, dealers’ margins have been used.
In the case of contracts denominated in foreign currencies, the value at risk figures include foreign currency margin amounts converted into U.S. dollars with an incremental adjustment to reflect the exchange rate risk inherent to Grant Park, which is valued in U.S. dollars, in expressing value at risk in a functional currency other than U.S. dollars.
In quantifying Grant Park’s value at risk, 100% positive correlation in the different positions held in each market risk category has been assumed. Consequently, the margin requirements applicable to the open contracts have simply been aggregated to determine each trading category’s aggregate value at risk. The diversification effects resulting from the fact that Grant Park’s positions are rarely, if ever, 100% positively correlated have not been reflected.
Value at Risk by Market Sectors
The following tables indicate the trading value at risk associated with Grant Park’s open positions by market category as of December 31, 2006 and December 31, 2005 and the trading gains/losses by market category for the years ended December 31, 2006 and 2005. All open position trading risk exposures of Grant Park have been included in calculating the figures set forth below. As of December 31, 2006, Grant Park’s net asset value was approximately $382.3 million. As of December 31, 2005, Grant Park’s net asset value was approximately $289.9 million.
29

December 31, 2006
Market Sector Value at Risk % of Total
Capitalization Trading
Gain/(Loss)
Stock Indices ........................................................................... $17,109,345 4.5% 6.9% Interest Rates ........................................................................... 14,150,512 3.7 (1.0) Currencies................................................................................ 9,008,040 2.3 0.8 Metals ...................................................................................... 6,002,732 1.6 10.8 Energy ..................................................................................... 2,682,000 0.7 (1.7) Softs......................................................................................... 1,423,613 0.4 0.3 Agriculturals ............................................................................ 802,822 0.2 (2.1) Meats ....................................................................................... 462,775 0.1 (0.3)
Total .................................................................................... $51,641,839 13.5% 13.7% December 31, 2005
Market Sector Value at Risk % of Total
Capitalization Trading
Gain/(Loss)
Stock Indices ........................................................................... $ 13,288,191 4.6% 5.1% Interest Rates ........................................................................... 8,808,384 3.0 (1.0) Currencies ............................................................................... 5,632,384 2.0 (4.6) Metals ...................................................................................... 2,935,888 1.0 1.2 Energy ..................................................................................... 1,631,950 0.6 1.0 Softs......................................................................................... 1,472,902 0.5 1.7 Agriculturals ............................................................................ 963,807 0.3 (1.0) Meats ....................................................................................... 265,480 0.1 (0.1)
Total ..................................................................................... $ 34,998,986 12.1% 2.3%
Material Limitations on Value at Risk as an Assessment of Market Risk
The face value of the market sector instruments held by Grant Park is typically many times the applicable maintenance margin requirement, which generally ranges between approximately 1% and 10% of contract face value, as well as many times the capitalization of Grant Park. The magnitude of Grant Park’s open positions creates a risk of ruin not typically found in most other investment vehicles. Because of the size of its positions, certain market conditions—unusual, but historically recurring from time to time—could cause Grant Park to incur severe losses over a short period of time. The value at risk table above, as well as the past performance of Grant Park, gives no indication of this risk of ruin.
Non-Trading Risk
Grant Park has non-trading market risk on its foreign cash balances not needed for margin. However, these balances, as well as the market risk they represent, are immaterial. Grant Park also has non-trading market risk as a result of investing a substantial portion of its available assets in U.S. Treasury bills and Treasury repurchase agreements. The market risk represented by these investments is also immaterial.
Qualitative Market Risk
Trading Risk
The following were the primary trading risk exposures of Grant Park as of December 31, 2006, by market sector.
30

Stock Indices
Grant Park’s primary equity exposure is due to equity price risk in the G-7 countries as well as other jurisdictions including Hong Kong, Taiwan, and Australia. The stock index futures contracts currently traded by Grant Park are generally limited to futures on broadly based indices, although Grant Park may trade narrow-based stock index futures contracts in the future. As of December 31, 2006, Grant Park had no short equity index positions. All of the exposure in the stock index sector was held in small- to medium-sized positions. Grant Park is primarily exposed to the risk of adverse price trends or static markets in the major U.S., European and Asian indices. Static markets would not cause major market changes but would make it difficult for Grant Park to avoid being “whipsawed” into numerous small losses.
Interest Rates
Interest rate risk is a principal market exposure of Grant Park. Interest rate movements directly affect the price of the futures positions held by Grant Park and indirectly the value of its stock index and currency positions. Interest rate movements in one country as well as relative interest rate movements between countries materially impact Grant Park’s profitability. Grant Park’s primary interest rate exposure is due to interest rate fluctuations in the United States and the other G-7 countries. However, Grant Park also takes futures positions on the government debt of smaller nations, such as Australia. The general partner anticipates that G-7 interest rates will remain the primary market exposure of Grant Park for the foreseeable future. As of December 31, 2006, Grant Park’s interest rate exposure was predominantly mixed. In Japan, Grant Park was long both the short end and the long end of the yield curve. In the U.S., Grant Park was essentially flat the long end and short the short end of the curve and in Europe and Australia, Grant Park was short the market across the entire yield curve.
Currencies
Exchange rate risk is a significant market exposure of Grant Park. Grant Park’s currency exposure is due to exchange rate fluctuations, primarily fluctuations that disrupt the historical pricing relationships between different currencies and currency pairs. These fluctuations are influenced by interest rate changes as well as political and general economic conditions. Grant Park trades in a large number of currencies, including cross-rates, which are positions between two currencies other than the U.S. dollar. The general partner anticipates that the currency sector will remain one of the primary market exposures for Grant Park for the foreseeable future. As of December 31, 2006, Grant Park had a variety of positions in both the dollar and the cross rates. In general, with the exception of the Japanese yen, a weaker dollar against most currencies would benefit Grant Park.
Metals
Grant Park’s metals market exposure is due to fluctuations in the price of both precious metals, including gold and silver, as well as base metals including aluminum, copper, nickel and zinc. As of December 31, 2006, Grant Park held very little metals positions. After a substantial run up in the first half of the year, profits were taken and positions in this sector have all been liquidated for the most part with the exception of a minor long position in gold.
Energy
Grant Park’s primary energy market exposure is due to gas and oil price movements, often resulting from political developments in the Middle East, Nigeria, Russia and Venezuela. As of December 31, 2006, the energy market exposure of Grant Park consisted of minor short positions in crude
31

oil, crude products and natural gas. Oil and gas prices can be volatile and substantial profits and losses have been and are expected to continue to be experienced in this market.
Agricultural/Softs
Grant Park’s primary commodities exposure is due to agricultural price movements, which are often directly affected by severe or unexpected weather conditions. Small long positions in wheat, soybean oil, soybeans, live cattle and cotton accounted for Grant Park’s long commodity exposure while sugar accounted for Grant Park’s short positions as of December 31, 2006.
Non-Trading Risk Exposure
The following were the only non-trading risk exposures of Grant Park as of December 31, 2006.
Foreign Currency Balances
Grant Park’s primary foreign currency balances are in Japanese yen, British pounds, Euros and Australian dollars. The advisors regularly convert foreign currency balances to U.S. dollars in an attempt to control Grant Park’s non-trading risk.
Cash Management
Grant Park maintains a portion of its assets at its clearing brokers, as well as at Harris N.A. and Lake Forest Bank & Trust Company. These assets, which may range from 5% to 25% of Grant Park’s value, are held in U.S. Treasury securities and/or Treasury repurchase agreements. The balance of Grant Park’s assets, which range from 75% to 95%, are invested in investment grade money market investments purchased at either Middleton Dickinson Capital Management, LLC which are held in a separate, segregated account at State Street Bank and Trust Company or are purchased directly through Harris Nesbitt Corporation, a member of BMO Financial Group. Violent fluctuations in prevailing interest rates could cause immaterial mark-to-market losses on Grant Park’s cash management income.
Managing Risk Exposure
The general partner monitors and controls Grant Park’s risk exposure on a daily basis through financial, credit and risk management monitoring systems and, accordingly, believes that it has effective procedures for evaluating and limiting the credit and market risks to which Grant Park is subject.
The general partner monitors Grant Park’s performance and the concentration of its open positions, and consults with the trading advisors concerning Grant Park’s overall risk profile. If the general partner felt it necessary to do so, the general partner could require the trading advisors to close out individual positions as well as enter positions traded on behalf of Grant Park. However, any intervention would be a highly unusual event. The general partner primarily relies on the trading advisors’ own risk control policies while maintaining a general supervisory overview of Grant Park’s market risk exposures. The trading advisors apply their own risk management policies to their trading. The trading advisors often follow diversification guidelines, margin limits and stop loss points to exit a position. The trading advisors’ research of risk management often suggests ongoing modifications to their trading programs.
As part of the general partner’s risk management, the general partner periodically meets with the trading advisors to discuss their risk management and to look for any material changes to the trading advisors’ portfolio balance and trading techniques. The trading advisors are required to notify the general partner of any material changes to their programs.
32

General
From time to time, certain regulatory or self-regulatory organizations have proposed increased margin requirements on futures contracts. Because Grant Park generally will use a small percentage of assets as margin, Grant Park does not believe that any increase in margin requirements, as proposed, will have a material effect on Grant Park’s operations.
ITEM 8. FINANCIAL STATEMENTS AND SUPPLEMENTARY DATA
Financial statements meeting the requirements of Regulation S-X appear beginning on page F-1 of this report. The supplementary financial information specified by Item 302 of Regulation S-K is included in this report under the heading “Selected Financial Data” above.
ITEM 9. CHANGES IN AND DISAGREEMENTS WITH ACCOUNTANTS ON ACCOUNTING AND FINANCIAL DISCLOSURE
None.
ITEM 9A. CONTROLS AND PROCEDURES
As of the end of the period covered by this report, the general partner carried out an evaluation, under the supervision and with the participation of the general partner’s management including its principal executive officer and principal financial officer, of the effectiveness of the design and operation of Grant Park’s disclosure controls and procedures as contemplated by Rule 13a-15 of the Securities Exchange Act of 1934, as amended. Based on, and as of the date of that evaluation, the general partner’s principal executive officer and principal financial officer concluded that Grant Park’s disclosure controls and procedures are effective, in all material respects, in timely alerting them to material information relating to Grant Park required to be included in the reports required to be filed or submitted by Grant Park with the SEC under the Exchange Act.
There was no change in Grant Park’s internal control over financial reporting that occurred during the fourth quarter of 2006 that has materially affected, or is reasonably likely to materially affect, Grant Park’s internal control over financial reporting.
ITEM 9B. OTHER INFORMATION
None.
PART III
ITEM 10. DIRECTORS, EXECUTIVE OFFICERS OF THE REGISTRANT, AND CORPORATE GOVERNANCE
Grant Park has no directors or executive officers and also does not have any employees. Grant Park is managed solely by Dearborn Capital Management, L.L.C. in its capacity as general partner. Dearborn Capital Management, L.L.C. has been registered as a commodity pool operator and a commodity trading advisor under the Act and has been a member of the NFA since December 1995.
The principals of the general partner are Dearborn Capital Management Ltd., Centum Prata Holdings, Inc, David M. Kavanagh, Efim Tkatchew, Maureen O’Rourke and Abdullah Mohammed Al Rayes. Only the officers of Dearborn Capital Management, L.L.C., Mr. Kavanagh, Mr. Tkatchew and Ms. O’Rourke, have management responsibility and control over the general partner.
33

Mr. Kavanagh, president of Dearborn Capital Management, L.L.C., has been responsible for overseeing all operations and activities of the general partner since its formation. Commencing in October 1998, Mr. Kavanagh also became president, a principal and an associated person of Dearborn Capital Brokers Ltd., an independent introducing broker. From 1983 to 2003, Mr. Kavanagh was a member in good standing of the Chicago Board of Trade. Between 1983 and October 1998, Mr. Kavanagh served as an institutional salesman in the financial futures area on behalf of Refco and Conti Commodity Services, Inc., which was acquired by Refco in 1984. His clients included large hedge funds and financial institutions. Since October 1998, Mr. Kavanagh has from time to time continued to perform introducing brokerage services for Man Financial Inc., formerly Refco, Inc., through Dearborn Capital Brokers. Neither Dearborn Capital Brokers nor Mr. Kavanagh provides brokerage services to Grant Park’s trading account. In the past, from time to time Mr. Kavanagh has provided brokerage services to Financial Consortium International LLC, a registered introducing broker, commodity pool operator and broker-dealer, since October 1999. In 1980, Mr. Kavanagh received an MBA from the University of Notre Dame, and in 1978, graduated with a B.S. in business administration from John Carroll University.
Mr. Tkatchew, chief operating officer of the general partner, is primarily responsible for the day to day operations of Dearborn. Prior to joining the general partner in December 2005, Mr. Tkatchew was a General Manager at the Commonwealth Bank of Australia from February 2002 to December 2005. Previously, he held senior roles in financial control, operations and audit working in Europe, Asia and the United States with Credit Suisse First Boston, JP Morgan, State Street and Dresdner Kleinwort Wasserstein. Mr. Tkatchew received his initial training as an accountant with Coopers and Lybrand, is a chartered accountant and has a B.Com in accounting and finance from the University of New South Wales in Australia and a M.B.A. (Executive) from the Australian Graduate School of Management.
Ms. O’Rourke, chief financial officer of the general partner, is responsible for financial reporting and compliance issues. Prior to joining the general partner in May 2003, Ms. O’Rourke was employed as assistant vice president at MetLife Investors Life Insurance Company from 1992 to September 2001. Before that, Ms. O’Rourke was employed as a tax senior at KPMG LLP (formerly KPMG Peat Marwick LLP) from 1987 to 1991. Ms. O’Rourke is a certified public accountant. She received a B.B.A. in accounting from the University of Notre Dame in 1987 and received a M.S. in Taxation from DePaul University in 1996.
Code of Ethics
Grant Park has not adopted a code of ethics because it does not have any officers or employees.
Section 16(a) Beneficial Ownership Reporting Compliance
Section 16 of the Securities Exchange Act of 1934, as amended, requires an issuer’s directors and certain executive officers and certain other beneficial owners of the issuer’s equity securities to periodically file notices of changes in their beneficial ownership with the SEC. Grant Park does not have any directors or officers. However, the officers of Grant Park’s general partner, as well as the general partner itself, file such notices regarding their beneficial ownership in Grant Park, if any. Grant Park believes that for 2006, all required filings were timely filed by each of these persons.
ITEM 11. EXECUTIVE COMPENSATION
Grant Park has no directors or officers. Its affairs are managed by Dearborn Capital Management, L.L.C., its general partner, which receives compensation for its services from Grant Park, as follows:
34

Each of the Class A units and Class B units pay the general partner a monthly brokerage charge. Effective September 1, 2005, Class A units pay the general partner a monthly brokerage charge equal to 0.6292%, a rate of 7.55% annually, of Class A’s month-end adjusted net assets. Class B units pay a monthly brokerage charge equal to 0.6667%, a rate of 8.0% annually, of Class B’s month-end adjusted net assets. The general partner pays from the brokerage charge all clearing, execution and give-up, floor brokerage, exchange and NFA fees, any other transaction costs, selling agent compensation and consulting fees to the trading advisors. The payments to the clearing brokers are based upon a specified amount per round-turn for each commodity interest transaction executed on behalf of Grant Park. The amounts paid to selling agents, trading advisors or others may be based upon a specified percentage of Grant Park’s net asset value or round-turn transactions. A round-turn is both the purchase, or sale, of a commodity interest contract and the subsequent offsetting sale, or purchase, of the contract. The balance of the brokerage charge not paid out to other parties is retained by the general partner as payment for its services to Grant Park.
Grant Park pays the general partner the brokerage charge, which is based on a fixed percentage of net assets, regardless of whether actual transaction costs were less than or exceeded this fixed percentage or whether the number of trades significantly increases. Assuming Grant Park’s brokerage charge was expressed on a per-transaction basis, it is estimated that the brokerage charge would equate to round-turn commissions of approximately $44.42, based on the average trading activity of the seven trading advisors for the last three calendar years and assuming allocations of net assets to the trading advisors as follows: 18% to Rabar; 20% to EMC; 6% to ETC; 8% to Graham; 21% to Winton; 8% to Saxon; and 19% to Welton.
The clearing brokers are also paid by the general partner, out of its brokerage charge, an average of between approximately $5.00 and $10.00 dollars per round turn transaction entered into by Grant Park. This round turn commission includes all clearing, exchange and NFA fees.
Effective April 1, 2004 through October 31, 2004, Class A units paid the general partner a monthly brokerage charge equal to 0.6583%, a rate of 7.9% annually, of Class A’s month-end adjusted net assets. This monthly charge was reduced to 0.6458%, a rate of 7.75% annually, effective November 1, 2004 and further reduced to a monthly charge of 0.6292%, a rate of 7.55% annually, effective September 1, 2005. Class B units paid the general partner a monthly charge equal to 0.675%, a rate of 8.1% annually, of Class B’s month-end adjusted net assets. Effective November 1, 2004, Class B units pay the general partner a monthly charge equal to 0.6667%, a rate of 8.0% annually, of Class B’s month-end adjusted net assets. The charge amounted to $27,576,195 for the year ended December 31, 2006, $23,665,571 for the year ended December 31, 2005, and $16,530,511 for the year ended December 31, 2004.
The Guidelines for the Registration of Commodity Pool Programs developed by the North American Securities Administrators Association, Inc., or NASAA Guidelines, require that the brokerage charge payable by Grant Park will not be greater than (1) 80% of the published retail commission rate plus pit brokerage fees, or (2) 14% annually of Grant Park’s average net assets, including pit brokerage fees. Net assets for purposes of this limitation exclude assets not directly related to trading activity, if any. The general partner intends to operate Grant Park so as to comply with these limitations.
Additionally, all expenses incurred in connection with the organization and the ongoing offering of the units are paid by the general partner and then reimbursed to the general partner by Grant Park. The limited partnership agreement provides that Grant Park shall be entitled to reimbursement for organization and offering expenses at a rate of up to 1.0% per annum, computed monthly, of which up to 10% of such amount is reimbursable by Class A and 90% is reimbursable by Class B. Effective April 1, 2004, Class A units bear organization and offering expenses at an annual rate of 20 basis points (0.20%)
35

of the adjusted net assets of the Class A units, calculated and payable monthly on the basis of month-end adjusted net assets. Effective September 1, 2005, Class B units bear these expenses at an annual rate of 60 basis points (0.60%) of the adjusted net assets of the Class B units, calculated and payable monthly on the basis of month-end adjusted net assets. In no event, however, will the reimbursement from Grant Park to the general partner exceed 1.0% per annum of the average month-end net assets of Grant Park. The general partner has the discretion to change the amounts assessed to each class for organization and offering expenses, provided the amounts do not exceed the limits set forth in the limited partnership agreement. In its discretion, the general partner may require Grant Park to reimburse the general partner in any subsequent calendar year for amounts that exceed these limits in any calendar year, provided that the maximum amount reimbursed by Grant Park in any calendar year will not exceed the overall limits set forth above.
The NASAA Guidelines require that the organization and offering expenses of Grant Park will not exceed 15% of the total subscriptions accepted. The general partner, and not Grant Park, will be responsible for any expenses in excess of that limitation. Since the general partner has agreed to limit Grant Park’s responsibility for these expenses to a total of 1% per annum of Grant Park’s average month-end net assets, the general partner does not expect the NASAA Guidelines limit of 15% of total subscriptions to be reached.
ITEM 12. SECURITY OWNERSHIP OF CERTAIN BENEFICIAL OWNERS AND MANAGEMENT AND RELATED STOCKHOLDER MATTERS
Grant Park has no officers or directors. Its affairs are managed by its general partner, Dearborn Capital Management, L.L.C. Set forth in the table below is information regarding the beneficial ownership of the officers of Grant Park’s general partner in Grant Park as of December 31, 2006.
Name
Number of Class A Limited
Partnership Units
Number of Class B Limited
Partnership Units
Number of General
Partnership Units
Percentage of
Outstanding Class A Limited
Partnership Units
Percentage of
Outstanding Class B Limited
Partnership Units
Percentage of General
Partnership Units
Dearborn Capital Management, LLC .... 3,058.853 — 339.873 6.16% — 100.00% David M. Kavanagh............................... 3,058.853 (1) — 339.873 (1) 6.16% — 100.00% Efim Tkatchew ...................................... — — — — — — Maureen O’Rourke ................................ 4.433 — — — — —
(1) Represents units directly held by Dearborn Capital Management, L.L.C., the general partner of Grant Park. The
managing member of Dearborn Capital Management, L.L.C. is Dearborn Capital Management Ltd. Mr. Kavanagh is the sole shareholder of Dearborn Capital Management Ltd.
Grant Park has no securities authorized for issuance under equity compensation plans.
ITEM 13. CERTAIN RELATIONSHIPS AND RELATED TRANSACTIONS, AND DIRECTOR INDEPENDENCE
See Item 11, “Executive Compensation” and Item 12, “Security Ownership of Certain Beneficial Owners and Management.”
36

ITEM 14. PRINCIPAL ACCOUNTING FEES AND SERVICES
The following table sets forth the fees billed to Grant Park for professional audit services provided by McGladrey & Pullen, LLP, Grant Park’s independent registered public accountant, for the audit of Grant Park’s annual financial statements for the years ended December 31, 2006 and 2005, and fees billed for other professional services rendered by McGladrey & Pullen, LLP and RSM McGladrey, Inc. (an affiliate of McGladrey & Pullen, LLP) during those years.
Fee Category 2006 2005
Audit Fees(1) ......................................... $127,500 $122,000 Audit-Related Fees............................... — — Tax Fees(2) ............................................ 5,000 5,000 All Other Fees...................................... — —
Total Fees ....................................... $132,500 $127,000 (1) Audit fees consist of fees for professional services rendered for the audit of Grant Park’s financial statements and review
of financial statements included in Grant Park’s quarterly reports, as well as services normally provided by the independent accountant in connection with statutory and regulatory filings or engagements.
(2) Tax fees consist of compliance fees for the preparation of original tax returns.
The Audit Committee of Grant Park’s general partner, Dearborn Capital Management, L.L.C., pre-approves all audit and permitted non-audit services of Grant Park’s independent accountants, including all engagement fees and terms. The Audit Committee of Dearborn approved all the services provided by McGladrey & Pullen, LLP and RSM MCGladrey, Inc. (collectively “McGladrey”) during 2006 and 2005 to Grant Park described above. The Audit Committee has determined that the payments made to McGladrey for these services during 2006 and 2005 are compatible with maintaining that firm’s independence.
ITEM 15. EXHIBITS AND FINANCIAL STATEMENT SCHEDULES
(a) The following documents are filed as part of this report:
(1) See Financial Statements beginning on page F-1 hereof.
(2) Schedules:
Financial statement schedules have been omitted because they are not included in the financial statements or notes hereto applicable or because equivalent information has been included in the financial statements or notes thereto.
(3) Exhibits
Exhibit Number Description of Document
3.1(1) Third Amended and Restated Limited Partnership Agreement of the Registrant.
3.2(2) Certificate of Limited Partnership of the Registrant.
10.1(2) First Amended and Restated Advisory Contract among the registrant, Dearborn Capital Management, L.L.C. and Rabar Market Research, Inc.
37

Exhibit Number Description of Document
10.2(2) First Amended and Restated Advisory Contract among the registrant, Dearborn Capital Management, L.L.C. and EMC Capital Management, Inc.
10.3(2) First Amended and Restated Advisory Contract among the registrant, Dearborn Capital Management, L.L.C. and Eckhardt Trading Company.
10.4(2) Advisory Contract among the registrant, Dearborn Capital Management, L.L.C. and Graham Capital Management, L.P.
10.5(3) Advisory Contract among the registrant, Dearborn Capital Management, L.L.C. and Winton Capital Management Limited.
10.6(3) Advisory Contract among the registrant, Dearborn Capital Management, L.L.C. and Saxon Investment Corporation.
10.7(4) Advisory Contract among the registrant, Dearborn Capital Management, L.L.C. and Welton Investment Corporation.
10.8(5) Subscription Agreement and Power of Attorney.
10.9(6) Request for Redemption Form.
24.1 Power of Attorney (included on signature page).
31.1 Certification of Principal Executive Officer pursuant to Rule 13a-14(a) under the Securities Exchange Act of 1934.
31.2 Certification of Principal Financial Officer pursuant to Rule 13a-14(a) under the Securities Exchange Act of 1934.
32.1 Certification pursuant to 18 U.S.C. Section 1350, as adopted pursuant to Section 906 of the Sarbanes-Oxley Act of 2002.
(1) Included as Appendix A to the prospectus which is part of the Registrant’s Registration Statement on Form S-1 (File
No. 333-119338) and incorporated herein by reference. (2) Filed as an Exhibit to the Registrant’s Registration Statement on Form S-1 (File No. 333-104317) and incorporated
herein by reference. (3) Filed as an Exhibit to the Registrant’s Registration Statement on Form S-1 (File No. 333-119338) and incorporated
herein by reference. (4) Filed as an Exhibit to the Registrant’s annual report on Form 10-K for the fiscal year ended December 31, 2005 and
incorporated herein by reference. (5) Included as Appendix B to the prospectus which is part of the Registrant’s Registration Statement on Form S-1 (File
No. 333-119338) (6) Included as Appendix D to the prospectus which is part of the Registrant’s Registration Statement on Form S-1 (File
No. 333-119338)
38

INDEX TO FINANCIAL STATEMENTS
Grant Park Futures Fund Limited Partnership Report of Independent Registered Public Accounting Firm .......................................................................... F-2
Statements of Financial Condition as of December 31, 2006 and 2005 .................................................... F-3 Condensed Schedule of Investments as of December 31, 2006................................................................. F-4 Condensed Schedule of Investments as of December 31, 2005................................................................. F-6 Statements of Operations for the years ended December 31, 2006, 2005 and 2004 ................................. F-7 Statements of Changes in Partners’ Capital for the years ended December 31, 2006, 2005 and 2004 ..... F-8 Notes to Financial Statements.................................................................................................................... F-9
F-1

REPORT OF INDEPENDENT REGISTERED PUBLIC ACCOUNTING FIRM
To the Partners Grant Park Futures Fund Limited Partnership Chicago, Illinois
We have audited the accompanying statements of financial condition, including the condensed schedules of investments, of Grant Park Futures Fund Limited Partnership as of December 31, 2006 and 2005, and the related statements of operations and changes in partners’ capital for each of the three years ended December 31, 2006. These financial statements are the responsibility of the Partnership’s management. Our responsibility is to express an opinion on these financial statements based on our audits.
We conducted our audits in accordance with the standards of the Public Company Accounting Oversight Board (United States). Those standards require that we plan and perform the audit to obtain reasonable assurance about whether the financial statements are free of material misstatement. An audit includes examining, on a test basis, evidence supporting the amounts and disclosures in the financial statements. An audit also includes assessing the accounting principles used and significant estimates made by management, as well as evaluating the overall financial statement presentation. We believe that our audits provide a reasonable basis for our opinion.
In our opinion, the financial statements referred to above present fairly, in all material respects, the financial position of Grant Park Futures Fund Limited Partnership as of December 31, 2006 and 2005, and the results of its operations for each of the three years ended December 31, 2006, in conformity with U.S. generally accepted accounting principles.
/s/ McGladrey & Pullen, LLP
Chicago, Illinois January 31, 2007
McGladrey & Pullen, LLP is a member firm of RSM International – an affiliation of separate and independent legal entities.
F-2
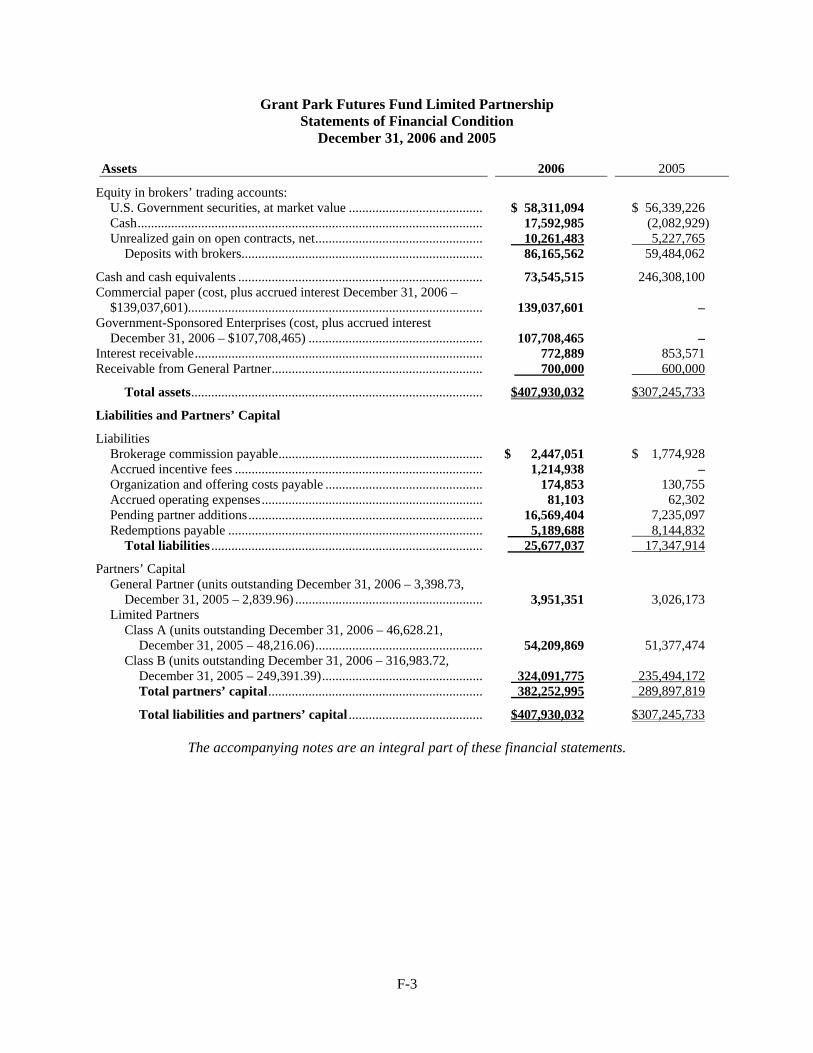
Grant Park Futures Fund Limited Partnership Statements of Financial Condition
December 31, 2006 and 2005
Assets 2006 2005
Equity in brokers’ trading accounts: U.S. Government securities, at market value ........................................ $ 58,311,094 $ 56,339,226 Cash....................................................................................................... 17,592,985 (2,082,929) Unrealized gain on open contracts, net.................................................. 10,261,483 5,227,765
Deposits with brokers........................................................................ 86,165,562 59,484,062
Cash and cash equivalents ......................................................................... 73,545,515 246,308,100 Commercial paper (cost, plus accrued interest December 31, 2006 –
$139,037,601)........................................................................................ 139,037,601 – Government-Sponsored Enterprises (cost, plus accrued interest
December 31, 2006 – $107,708,465) .................................................... 107,708,465 – Interest receivable...................................................................................... 772,889 853,571 Receivable from General Partner............................................................... 700,000 600,000
Total assets....................................................................................... $407,930,032 $307,245,733
Liabilities and Partners’ Capital
Liabilities Brokerage commission payable............................................................. $ 2,447,051 $ 1,774,928 Accrued incentive fees .......................................................................... 1,214,938 – Organization and offering costs payable ............................................... 174,853 130,755 Accrued operating expenses.................................................................. 81,103 62,302 Pending partner additions...................................................................... 16,569,404 7,235,097 Redemptions payable ............................................................................ 5,189,688 8,144,832
Total liabilities ................................................................................. 25,677,037 17,347,914
Partners’ Capital General Partner (units outstanding December 31, 2006 – 3,398.73,
December 31, 2005 – 2,839.96) ........................................................ 3,951,351 3,026,173 Limited Partners
Class A (units outstanding December 31, 2006 – 46,628.21, December 31, 2005 – 48,216.06).................................................. 54,209,869 51,377,474
Class B (units outstanding December 31, 2006 – 316,983.72, December 31, 2005 – 249,391.39)................................................ 324,091,775 235,494,172Total partners’ capital................................................................ 382,252,995 289,897,819
Total liabilities and partners’ capital ........................................ $407,930,032 $307,245,733
The accompanying notes are an integral part of these financial statements.
F-3
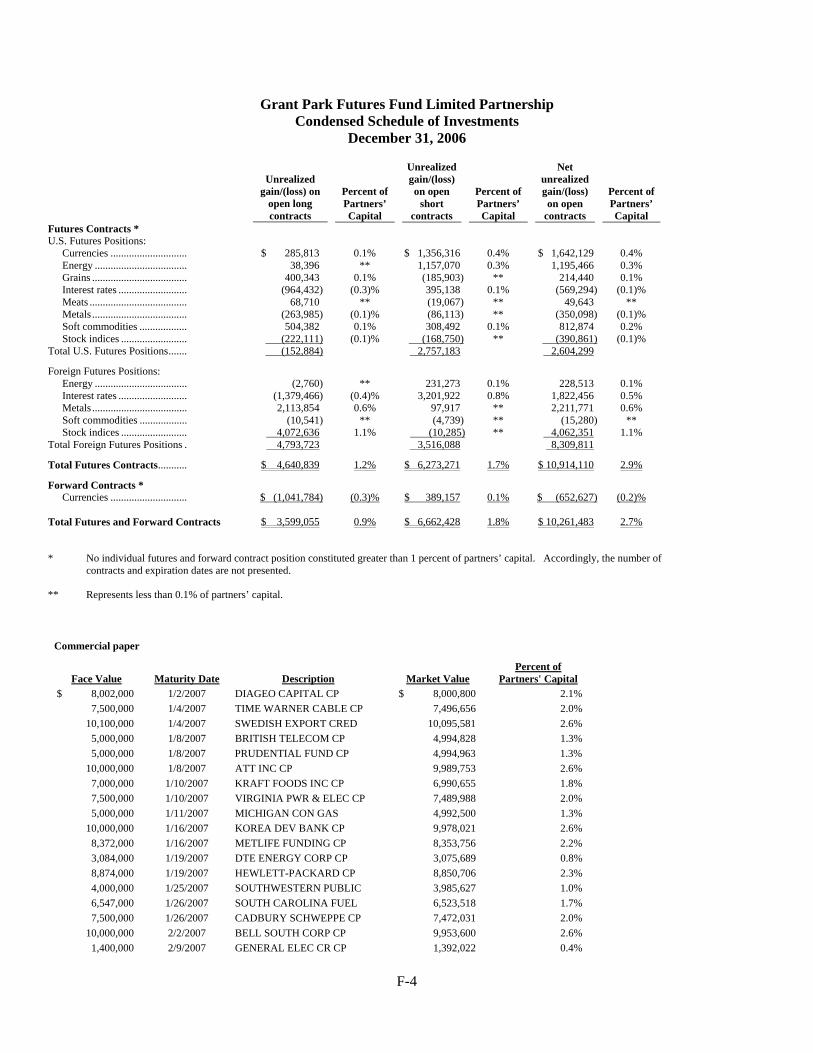
Grant Park Futures Fund Limited Partnership Condensed Schedule of Investments
December 31, 2006
Unrealized gain/(loss) on
open long contracts
Percent of Partners’ Capital
Unrealized gain/(loss) on open
short contracts
Percent of Partners’ Capital
Net unrealized gain/(loss) on open
contracts
Percent of Partners’ Capital
Futures Contracts * U.S. Futures Positions:
Currencies ............................. $ 285,813 0.1% $ 1,356,316 0.4% $ 1,642,129 0.4% Energy ................................... 38,396 ** 1,157,070 0.3% 1,195,466 0.3% Grains .................................... 400,343 0.1% (185,903) ** 214,440 0.1% Interest rates .......................... (964,432) (0.3)% 395,138 0.1% (569,294) (0.1)% Meats ..................................... 68,710 ** (19,067) ** 49,643 ** Metals .................................... (263,985) (0.1)% (86,113) ** (350,098) (0.1)% Soft commodities .................. 504,382 0.1% 308,492 0.1% 812,874 0.2% Stock indices ......................... (222,111) (0.1)% (168,750) ** (390,861) (0.1)%
Total U.S. Futures Positions....... (152,884) 2,757,183
2,604,299
Foreign Futures Positions: Energy ................................... (2,760) ** 231,273 0.1% 228,513 0.1% Interest rates .......................... (1,379,466) (0.4)% 3,201,922 0.8% 1,822,456 0.5% Metals .................................... 2,113,854 0.6% 97,917 ** 2,211,771 0.6% Soft commodities .................. (10,541) ** (4,739) ** (15,280) ** Stock indices ......................... 4,072,636 1.1% (10,285) ** 4,062,351 1.1%
Total Foreign Futures Positions . 4,793,723
3,516,088
8,309,811
Total Futures Contracts........... $ 4,640,839 1.2% $ 6,273,271 1.7% $ 10,914,110 2.9%
Forward Contracts * Currencies ............................. $ (1,041,784) (0.3)% $ 389,157 0.1% $ (652,627) (0.2)%
Total Futures and Forward Contracts $ 3,599,055 0.9% $ 6,662,428 1.8% $ 10,261,483 2.7%
* No individual futures and forward contract position constituted greater than 1 percent of partners’ capital. Accordingly, the number of contracts and expiration dates are not presented.
** Represents less than 0.1% of partners’ capital.
Commercial paper
Face Value Maturity Date Description Market ValuePercent of
Partners' Capital $ 8,002,000 1/2/2007 DIAGEO CAPITAL CP $ 8,000,800 2.1% 7,500,000 1/4/2007 TIME WARNER CABLE CP 7,496,656 2.0% 10,100,000 1/4/2007 SWEDISH EXPORT CRED 10,095,581 2.6% 5,000,000 1/8/2007 BRITISH TELECOM CP 4,994,828 1.3% 5,000,000 1/8/2007 PRUDENTIAL FUND CP 4,994,963 1.3% 10,000,000 1/8/2007 ATT INC CP 9,989,753 2.6% 7,000,000 1/10/2007 KRAFT FOODS INC CP 6,990,655 1.8% 7,500,000 1/10/2007 VIRGINIA PWR & ELEC CP 7,489,988 2.0% 5,000,000 1/11/2007 MICHIGAN CON GAS 4,992,500 1.3% 10,000,000 1/16/2007 KOREA DEV BANK CP 9,978,021 2.6% 8,372,000 1/16/2007 METLIFE FUNDING CP 8,353,756 2.2% 3,084,000 1/19/2007 DTE ENERGY CORP CP 3,075,689 0.8% 8,874,000 1/19/2007 HEWLETT-PACKARD CP 8,850,706 2.3% 4,000,000 1/25/2007 SOUTHWESTERN PUBLIC 3,985,627 1.0% 6,547,000 1/26/2007 SOUTH CAROLINA FUEL 6,523,518 1.7% 7,500,000 1/26/2007 CADBURY SCHWEPPE CP 7,472,031 2.0% 10,000,000 2/2/2007 BELL SOUTH CORP CP 9,953,600 2.6% 1,400,000 2/9/2007 GENERAL ELEC CR CP 1,392,022 0.4%
F-4

7,500,000 2/13/2007 UNITED HEALTHCARE CP 7,452,252 1.9% 7,000,000 2/14/2007 DUKE ENERGY CORP CP 6,954,655 1.8% Total Commercial paper $ 139,037,601 36.3%
Government-Sponsored Enterprises
Face Value Maturity Date Description Market ValuePercent of
Partners' Capital $ 10,000,000 1/3/2007 FED HOME DISC NOTE $ 9,997,167 2.6% 10,000,000 1/17/2007 FED HOME DISC NOTE 9,977,044 2.6% 10,000,000 1/19/2007 FED HOME DISC NOTE 9,974,650 2.6% 10,000,000 1/24/2007 FED HOME DISC NOTE 9,967,352 2.6% 10,000,000 1/29/2007 FARM CREDIT DISC NOTE 9,960,411 2.6% 13,000,000 2/16/2007 FARM CREDIT DISC NOTE 12,914,702 3.4% 10,000,000 5/1/2007 FARM CREDIT DISC NOTE 9,832,333 2.6% 10,000,000 5/3/2007 FED HOME LOAN FLOATR 10,039,356 2.6% 15,000,000 7/13/2007 FED HOME LOAN FLOATR 15,038,325 3.9% 10,000,000 10/26/2007 FED HOME LOAN FLOATR 10,007,125 2.6% Total Government-Sponsored Enterprises $ 107,708,465 28.1%
U.S. Government Securities: ***
Face Value Value Percent of
Partners’ Capital
$58,500,000 U.S. Treasury Bills, January 25, 2007 $58,311,094 15.3%
Total U.S. Government Securities (cost $58,289,761) $58,311,094 *** Pledged as collateral for the trading of futures, forward and option contracts.
The accompanying notes are an integral part of these financial statements.
F-5

Grant Park Futures Fund Limited Partnership Condensed Schedule of Investments
December 31, 2005
Unrealized gain/(loss) on
open long contracts
Percent of Partners’ Capital
Unrealized gain/(loss) on open
short contracts
Percent of Partners’ Capital
Net unrealized gain/(loss) on open
contracts
Percent of Partners’ Capital
Futures Contracts * U.S. Futures Positions:
Currencies ............................. $ (442,058) (0.2)% $ 134,786 0.1% $ (307,272) (0.1)% Energy ................................... 82,867 ** (351,494) (0.1)% (268,627) (0.1)% Grains .................................... 109,812 ** (537,600) (0.2)% (427,788) (0.2)% Interest rates .......................... 58,095 ** (192,668) (0.1)% (134,573) (0.1)% Meats ..................................... 67,012 ** 940 ** 67,952 ** Metals .................................... 1,158,952 0.4% – ** 1,158,952 0.4% Soft commodities .................. 1,974,357 0.7% (101,017) ** 1,873,340 0.6% Stock indices ......................... (1,154,901) (0.4)% 5,000 ** (1,149,901) (0.4)%
Total U.S. Futures Positions....... 1,854,136
(1,042,053)
812,083
Foreign Futures Positions: Energy ................................... 137,381 0.1% 13,770 ** 151,151 0.1% Interest rates .......................... 1,439,877 0.5% 355,445 0.1% 1,795,322 0.6% Metals .................................... 6,040,628 2.1% (2,479,122) (0.9)% 3,561,506 1.2% Soft commodities .................. 34,454 ** (10,785) ** 23,669 ** Stock indices ......................... 2,433,469 0.8% (141,720) ** 2,291,749 0.8%
Total Foreign Futures Positions . 10,085,809
(2,262,412)
7,823,397
Total Futures Contracts........... $ 11,939,945 4.1% $ (3,304,465) (1.1)% $ 8,635,480 3.0%
Forward Contracts * Currencies ............................. $ (3,417,240) (1.2)% $ 9,525 ** $ (3,407,715) (1.2)%
Total Futures and Forward Contracts $ 8,522,705 2.9% $ (3,294,940) (1.1)% $ 5,227,765 1.8%
* No individual futures and forward contract position constituted greater than 1 percent of partners’ capital. Accordingly, the number of contracts and expiration dates are not presented.
** Represents less than 0.1% of partners’ capital.
U.S. Government Securities: ***
Face Value Value Percent of
Partners’ Capital
$57,500,000 U.S. Treasury Bills, January 26, 2006 $56,339,226 19.4%
Total U.S. Government Securities (cost $56,346,912) $56,339,226 *** Pledged as collateral for the trading of futures, forward and option contracts.
The accompanying notes are an integral part of these financial statements.
F-6

F-7
GRANT PARK FUTURES FUND LIMITED PARTNERSHIP STATEMENTS OF OPERATIONS
Years Ended December 31, 2006, 2005 and 2004
2006 2005 2004
Income Trading gains (losses)
Realized ......................................... $ 37,256,330 $ 6,429,059 $ 5,332,965 Change in unrealized ..................... 5,033,718 715,870 (1,051,764)
Gains from trading..................... 42,290,048 7,144,929 4,281,201
Interest income .............................. 16,093,168 8,436,400 3,005,585
Total income............................. 58,383,216 15,581,329 7,286,786
Expenses Brokerage commission....................... 27,576,195 23,651,090 16,530,511 Incentive fees ..................................... 3,823,552 1,643,676 3,764,107 Operating expenses ............................ 669,774 643,036 700,616
Total expenses .............................. 32,069,521 25,937,802 20,995,234
Net income (loss) .......................... $ 26,313,695 $(10,356,473) $(13,708,448)
Net Income (Loss) per General Partner & Class A Unit Limited Partner (based on weighted average number of units outstanding during the year) $ 98.75 $ (36.11) $ (88.44)
Net Income (Loss) per Class B Unit Limited Partner (based on weighted average number of units outstanding during the year) $ 82.71 $ (35.34) $ (81.15)
Increase (decrease) in Net Asset Value per General Partner & Class A Unit Limited Partner $ 97.03 $ (37.96) $ (90.50)
Increase (decrease) in Net Asset Value per Class B Unit Limited Partner $ 78.14 $ (41.89) $ (90.42)
The accompanying notes are an integral part of these financial statements.

GRANT PARK FUTURES FUND LIMITED PARTNERSHIP
STATEMENTS OF CHANGES IN PARTNERS’ CAPITAL Years Ended December 31, 2006, 2005 and 2004
Limited Partners Limited Partners General Partner Class A Class B
Number of
Units Amount Number of
Units Amount Number of
Units Amount Total
Amount
Partners’ capital, December 31, 2003 707.62 $ 844,919 27,275.54 $ 32,567,704 31,586.19 $ 34,005,423 $ 67,418,046
Contributions...................... 1,804.98 2,022,500 39,552.87 45,844,665 195,825.69 200,180,244 248,047,409 Redemptions....................... — — (6,194.40) (6,567,208) (4,356.21) (4,091,833) (10,659,041) Offering costs ..................... — — — (103,680) — (1,340,255) (1,443,935) Net loss ............................... — (94,705) — (4,830,302) — (8,783,441) (13,708,448)
Partners’ capital, December 31, 2004 2,512.60 2,772,714 60,634.01 66,911,179 223,055.67 219,970,138 289,654,031
Contributions...................... 327.36 350,000 8,304.62 8,829,246 69,543.78 65,810,552 74,989,798 Redemptions ...................... — — (20,722.57) (21,908,315) (43,208.06) (40,781,188) (62,689,503) Offering costs ..................... — — — (106,640) — (1,593,394) (1,700,034) Net loss ............................... — (96,541) — (2,347,996) — (7,911,936) (10,356,473)
Partners’ capital, December 31, 2005 2,839.96 3,026,173 48,216.06 51,377,474 249,391.39 235,494,172 289,897,819
Contributions ...................... 558.77 645,000 7,990.87 9,336,899 110,603.12 111,541,043 121,522,942 Redemptions ...................... — — (9,578.72) (10,782,069) (43,010.79) (43,339,995) (54,122,064) Offering costs ..................... — — — (84,032) — (1,275,365) (1,359,397) Net income.......................... — 280,178 — 4,361,597 — 21,671,920 26,313,695
Partners’ capital, December 31, 2006 3,398.73 $3,951,351 46,628.21 $54,209,869 316,983.72 $324,091,775 $382,252,995
Net asset value per unit at December 31, 2003 $ 1,194.03 $ 1,076.59
Net asset value per unit at December 31, 2004 $ 1,103.53 $ 986.17
Net asset value per unit at December 31, 2005 $ 1,065.57 $ 944.28
Net asset value per unit at December 31, 2006 $ 1,162.60 $ 1,022.42
The accompanying notes are an integral part of these financial statements.
F-8

Grant Park Futures Fund Limited Partnership Notes to Financial Statements
NOTE 1. NATURE OF BUSINESS AND SIGNIFICANT ACCOUNTING POLICIES
Nature of business: Grant Park Futures Fund Limited Partnership (the “Partnership”) was organized as a limited partnership in Illinois in August 1988 and will continue until December 31, 2027, unless sooner terminated as provided for in the Limited Partnership Agreement. As a commodity investment pool, the Partnership is subject to the regulations of the Commodity Futures Trading Commission, an agency of the United States (U.S.) government which regulates most aspects of the commodity futures industry; rules of the National Futures Association, an industry self-regulatory organization; and the requirements of the various commodity exchanges where the Partnership executes transactions. Additionally, the Partnership is subject to the requirements of futures commission merchants (“FCMs”), interbank and other market makers through which the Partnership trades. Effective June 30, 2003, the Partnership became registered with the Securities and Exchange Commission (“SEC”), accordingly, as a registrant, the Partnership is subject to the regulatory requirements under the Securities Act of 1933 and the Securities Exchange Act of 1934.
The Partnership is a multi-advisor pool that carries out its purpose through trading by independent professional commodity trading advisors retained by Dearborn Capital Management, L.L.C. (the “General Partner”) and the Partnership. Through these trading advisors, the Partnership’s business is to trade, buy, sell, margin or otherwise acquire, hold or dispose of futures and forward contracts for commodities, financial instruments or currencies, any rights pertaining thereto and any options thereon, or on physical commodities. The Partnership may also engage in hedge, arbitrage and cash trading of commodities and futures.
The Partnership has elected not to provide statements of cash flows as permitted by Statement of Financial Accounting Standards No. 102, Statements of Cash Flows – Exemption of Certain Enterprises and Classification of Cash Flows from Certain Securities Acquired for Resale.
Classes of Interests: The Partnership has two classes of limited partner interests (the “Interests”), Class A and Class B. Both Class A and Class B Interests are traded pursuant to identical trading programs and differ only in respect to the General Partner’s brokerage commission and organization and offering costs (Note 4).
Significant accounting policies are as follows:
Use of estimates: The preparation of financial statements in conformity with generally accepted accounting principles requires management to make estimates and assumptions that affect the reported amounts of assets and liabilities and disclosure of contingent assets and liabilities at the date of the financial statements and the reported amounts of revenue and expenses during the reporting period. Actual results could differ from those estimates.
Cash and cash equivalents: Cash and cash equivalents include cash, overnight investments, U.S. treasury bills and short-term investments in interest-bearing demand deposits with banks and cash managers with maturities of three months or less. The Partnership maintains deposits with high quality financial institutions in amounts that are in excess of federally insured limits; however, the Partnership does not believe it is exposed to any significant credit risk.
F-9

Revenue recognition: Futures, options on futures, and forward contracts are recorded on a trade date basis and realized gains or losses are recognized when contracts are liquidated. Unrealized gains or losses on open contracts (the difference between contract trade price and market price) are reported in the statement of financial condition as a net unrealized gain or loss, as there exists a right of offset of unrealized gains or losses in accordance with the Financial Accounting Standards Board Interpretation No. 39 — “Offsetting of Amounts Related to Certain Contracts.” Any change in net unrealized gain or loss from the preceding period is reported in the statement of operations. Market value of exchange-traded contracts is based upon exchange settlement prices. Market value of non-exchange-traded contracts is based on third party quoted dealer values on the Interbank market. Government-Sponsored Enterprises and commercial paper are stated at cost plus accrued interest, which approximates market value.
Income taxes: No provision for income taxes has been made in these financial statements as each partner is individually responsible for reporting income or loss based on its respective share of the Partnership’s income and expenses as reported for income tax purposes.
Organization and offering costs: All expenses incurred in connection with the organization and the initial and ongoing public offering of partnership interests are paid by the General Partner and are reimbursed to the General Partner by the Partnership. This reimbursement is made monthly. Class A units bear organization and offering expenses at an annual rate of 20 basis points (0.20 percent) of the adjusted net assets of the Class A units, calculated and payable monthly on the basis of month-end adjusted net assets. Through August 31, 2005, Class B units incurred these expenses at an annual rate of 90 basis points (0.90 percent). Effective September 1, 2005, the annual rate was decreased to 60 basis points (0.60 percent) of the adjusted net assets of the Class B units, calculated and payable monthly on the basis of month-end adjusted net assets. “Adjusted net assets” is defined as the month-end net assets of the particular class before accruals for fees and expenses and redemptions. In its discretion, the General Partner may require the Partnership to reimburse the General Partner in any subsequent calendar year for amounts that exceed these limits in any calendar year, provided that the maximum amount reimbursed by the Partnership will not exceed the overall limit. Amounts reimbursed by the Partnership with respect to the initial and ongoing public offering expenses are charged against partners’ capital at the time of reimbursement or accrual. Any amounts reimbursed by the Partnership with respect to organization expenses are expensed at the time the reimbursement is incurred or accrued. If the Partnership terminates prior to completion of payment of the calculated amounts to the General Partner, the General Partner will not be entitled to any additional payments, and the Partnership will have no further obligation to the General Partner. At December 31, 2006, all organization and offering costs incurred by the General Partner have been reimbursed. The General Partner intends to remit back to the Partnership a portion of the Partnership’s organization and offering expenses to the extent actual expenses incurred were less than the actual amount the Partnership paid the General Partner. At December 31, 2006, included in receivable from General Partner is $500,000 related to the reimbursement of organization and offering expenses of the Partnership.
Foreign Currency Transactions: The Partnership’s functional currency is the U.S. dollar, however, it transacts business in currencies other than the U.S. dollar. Assets and liabilities denominated in currencies other than the U.S. dollar are translated into U.S. dollars at the rates in effect at the date of the statement of financial condition. Income and expense items denominated in currencies other than the U.S. dollar are translated into U.S. dollars at the rates in effect during the period. Gains and losses resulting from the translation to U.S. dollars are reported in income currently.
Recent Accounting Pronouncements: In September 2006, the FASB issued SFAS No. 157, "Fair Value Measurements." SFAS 157, among other things, defines fair value, establishes a framework for measuring fair value and enhances disclosures about fair value measurements required under other
F-10

accounting pronouncements, but does not change existing guidance as to whether or not an instrument is carried at fair value. SFAS 157 is effective for the Partnership on January 1, 2008. Management is currently evaluating the provisions of SFAS 157 and its potential effect on the financial statements.
In September 2006, the SEC issued Staff Accounting Bulletin No. 108 ("SAB 108"), "Considering the Effects of Prior Year Misstatements When Quantifying Misstatements in Current Year Financial Statements", providing guidance on quantifying financial statement misstatement and implementation (e.g., restatement or cumulative effect to assets, liabilities and retained earnings) when first applying this guidance. SAB 108 is effective for the Partnership for the year ending December 31, 2006. The adoption of SAB 108 did not have a material effect on the Partnership’s financial statements.
On July 13, 2006, the FASB released FASB Interpretation No. 48 Accounting for Uncertainty in Income Taxes (“FIN 48”). FIN 48 provides guidance for how uncertain tax positions should be recognized, measured, presented and disclosed in the financial statements. FIN 48 requires the evaluation of tax positions taken or expected to be taken in the course of preparing the Partnership’s tax returns to determine whether the tax positions are “more-likely-than-not” of being sustained by the applicable tax authority. Tax positions not deemed to meet the more-likely-than-not threshold would be recorded as a tax benefit or expense in the current year. Adoption of FIN 48 is required for the Partnership on January 1, 2007 and is to be applied to all open tax years as of the effective date. Management does not believe the guidance provided by FIN 48 will have a material effect on its financial statements.
NOTE 2. DEPOSITS WITH BROKERS
The Partnership deposits assets with brokers subject to Commodity Futures Trading Commission regulations and various exchange and broker requirements. Margin requirements are satisfied by the deposit of U.S. Treasury bills and cash with such brokers. The Partnership earns interest income on its assets deposited with the brokers.
NOTE 3. COMMODITY TRADING ADVISORS
The Partnership has entered into advisory contracts with Rabar Market Research, Inc., EMC Capital Management, Inc., Eckhardt Trading Co., Graham Capital Management, L.P., Winton Capital Management Limited, Saxon Investment Corporation and Welton Investment Corporation to act as the Partnership’s commodity trading advisors (the “Advisors”). The Advisors are paid a quarterly management fee ranging from 0 percent to 2 percent per annum of the Partnership’s month-end allocated net assets, which is paid by the General Partner from the brokerage commission (Note 4).
Additionally, the Advisors receive a quarterly incentive fee ranging from 20 percent to 24 percent of the new trading profits on the allocated net assets of the Advisor, which amounted to fees of $3,823,552, $1,643,676, and $3,764,107 for the years ended December 31, 2006, 2005, and 2004, respectively.
NOTE 4. GENERAL PARTNER AND RELATED PARTY TRANSACTIONS
The General Partner shall at all times, so long as it remains a general partner of the Partnership, own Units in the Partnership: (i) in an amount sufficient, in the opinion of counsel for the Partnership, for the Partnership to be taxed as a partnership rather than as an association taxable as a corporation; and (ii) during such time as the Units are registered for sale to the public, in an amount at least equal to the greater of: (a) 1 percent of all capital contributions of all Partners to the Partnership; or (b) $25,000; or such other amount satisfying the requirements then imposed by the North American Securities Administrators Association, Inc.(NASAA) Guidelines. Further, during such time as the Units are
F-11

registered for sale to the public, the General Partner shall, so long as it remains a general partner of the Partnership, maintain a net worth (as such term may be defined in the NASAA Guidelines) at least equal to the greater of: (i) 5 percent of the total capital contributions of all partners and all limited partnerships to which it is a general partner (including the Partnership) plus 5 percent of the Units being offered for sale in the Partnership; or (ii) $50,000; or such other amount satisfying the requirements then imposed by the NASAA Guidelines. In no event, however, shall the General Partner be required to maintain a net worth in excess of $1,000,000 or such other maximum amount satisfying the requirements then imposed by the NASAA Guidelines.
Effective June 1, 2003, 10 percent of the General Partner limited partnership interest in the Grant Park Futures Fund Limited Partnership is characterized as a general partnership interest. Notwithstanding, the general partnership interest will continue to pay all fees associated with a limited partnership interest.
Through August 31, 2005, the Partnership paid the General Partner a monthly brokerage commission equal to one twelfth of 7.75 percent (7.75 percent annualized) and effective September 1, 2005, one twelfth of 7.55 percent (7.55 percent annualized) of month-end net assets for Class A units. The Class B units pay the General Partner one twelfth of 8.00 percent (8.00 percent annualized) of month-end net assets. Included in the brokerage commission are amounts paid to the clearing brokers for execution and clearing costs, management fees paid to the Advisors, compensation to the selling agents and an amount to the General Partner for management services rendered.
NOTE 5. OPERATING EXPENSES
Operating expenses of the Partnership are paid for by the General Partner and reimbursed by the Partnership. Through August 31, 2005, operating expenses of the Partnership were limited to 0.35 percent per year of the average month-end net assets of the Partnership. Effective September 1, 2005, these expenses are limited to 0.25 percent per year of the average month-end net assets of the Partnership. To the extent operating expenses are less than 0.25 percent of the Partnership’s average month-end net assets during the year, the difference will be reimbursed pro rata to record-holders as of December 31 of each year. For the year ended December 31, 2006, the operating expenses incurred by the Partnership were less than the percentages outlined above. Accordingly, at December 31, 2006, included in receivable from General Partner is $200,000 related to the reimbursement of operating expenses to the Partnership.
NOTE 6. REDEMPTIONS
Limited Partners have the right to redeem units as of any month-end upon ten (10) days’ prior written notice to the Partnership. The General Partner, however, may permit earlier redemptions in its discretion. There are no redemption fees applicable to Class A Limited Partners or to Class B Limited Partners who redeem their units on or after the one-year anniversary of their subscription. Class B Limited Partners who redeem their units prior to the one-year anniversary of their subscriptions will pay the applicable early redemption fee. Redemptions will be made on the last day of the month for an amount equal to the net asset value per unit, as defined, represented by the units to be redeemed.
In addition, the General Partner may at any time cause the redemption of all or a portion of any Limited Partner’s units upon fifteen (15) days written notice. The General Partner may also immediately redeem any Limited Partner’s units without notice if the General Partner believes that (i) the redemption is necessary to avoid having the assets of the Partnership deemed Plan Assets under the Employee Retirement Income Security Act of 1974, as amended (“ERISA”), (ii) the Limited Partner made a misrepresentation in connection with its subscription for the units, or (iii) the redemption is necessary to avoid a violation of law by the Partnership or any Partner.
F-12

NOTE 7. FINANCIAL HIGHLIGHTS
The following financial highlights reflect activity related to the Partnership. Total return is based on the change in value during the period of a theoretical investment made at the beginning of each calendar month during the year. Individual investor’s ratios may vary from these ratios based on various factors, including and among others, the timing of capital transactions.
2006 2005 2004
Total return – Class A Units ................................... 9.11% (3.44)% (7.58)% Total return – Class B Units ................................... 8.28% (4.25)% (8.40)%
Ratios as a percentage of average net assets: Interest income .................................................. 4.78% 2.90% 1.62% Expenses ............................................................ 9.52% 8.92% 11.34% Expenses, net of interest income ....................... 4.74% 6.02% 9.72%
The interest income and expense ratios above are computed based upon the weighted average net
assets of the limited partners for the years ended December 31, 2006, 2005 and 2004.
The following per unit performance calculations reflect activity related to the Partnership.
Class A Units Class B Units Per Unit Performance
(for unit outstanding throughout the entire period): Net asset value per unit at December 31, 2003 ........................... $ 1,194.03 $ 1,076.59Income (loss) from operations Net realized and change in unrealized gain from trading ....... 12.91 7.98 Expenses net of interest income* ........................................... (101.35) (89.13) Total income (loss) from operations ................................. (88.44) (81.15) Organization and offering costs* ................................................ (2.06) (9.27) Net asset value per unit at December 31, 2004 ........................... 1,103.53 986.17Income (loss) from operations Net realized and change in unrealized gain from trading ....... 26.04 21.95 Expenses net of interest income* ........................................... (62.15) (57.29) Total income (loss) from operations ................................. (36.11) (35.34) Organization and offering costs* ................................................ (1.85) (6.55) Net asset value per unit at December 31, 2005 ........................... 1,065.57 944.28Income (loss) from operations Net realized and change in unrealized gain from trading ....... 148.32 131.24 Expenses net of interest income* ........................................... (49.57) (48.53) Total income (loss) from operations ................................. 98.75 82.71Organization and offering costs* ................................................ (1.72) (4.57)Net asset value per unit at December 31, 2006 ........................... $ 1,162.60 $ 1,022.42
* Expenses net of interest income per unit and organization and offering costs per unit are calculated by dividing the
expenses net of interest income and organization and offering costs by the average number of units outstanding during the period. The net realized and change in unrealized gain from trading is a balancing amount necessary to reconcile the change in net asset value per unit with the other per unit information.
.
F-13

NOTE 8. TRADING ACTIVITIES AND RELATED RISKS
The Partnership, through its Advisors, engages in the speculative trading of U.S. and foreign futures contracts, options on U.S. and foreign futures contracts, and forward contracts (collectively, derivatives). These derivatives include both financial and nonfinancial contracts held as part of a diversified trading strategy. The Partnership is exposed to both market risk, the risk arising from changes in the market value of the contracts; and credit risk, the risk of failure by another party to perform according to the terms of a contract.
The purchase and sale of futures and options on futures contracts require margin deposits with FCMs. Additional deposits may be necessary for any loss on contract value. The Commodity Exchange Act requires an FCM to segregate all customer transactions and assets from the FCM’s proprietary activities. A customer’s cash and other property (for example, U.S. Treasury bills) deposited with an FCM are considered commingled with all other customer funds subject to the FCM’s segregation requirements. In the event of an FCM’s insolvency, recovery may be limited to a pro rata share of segregated funds available. It is possible that the recovered amount could be less than the total of cash and other property deposited.
Net trading results from derivatives for the years ended December 31, 2006, 2005 and 2004, are reflected in the statements of operations. Such trading results reflect the net gain arising from the Partnership’s speculative trading of futures contracts, options on futures contract, and forward contracts.
For derivatives, risks arise from changes in the market value of the contracts. Theoretically, the Partnership is exposed to a market risk equal to the value of futures and forward contracts purchased and unlimited liability on such contracts sold short. As both a buyer and seller of options, the Partnership pays or receives a premium at the outset and then bears the risk of unfavorable changes in the price of the contract underlying the option. Written options expose the Partnership to potentially unlimited liability; for purchased options the risk of loss is limited to the premiums paid.
In addition to market risk, in entering into commodity interest contracts there is a credit risk that a counterparty will not be able to meet its obligations to the Partnership. The counterparty for futures and options on futures contracts traded in the United States and on most non-U.S. futures exchanges is the clearinghouse associated with such exchange. In general, clearinghouses are backed by the corporate members of the clearinghouse who are required to share any financial burden resulting from the nonperformance by one of their members and, as such, should significantly reduce this credit risk. In cases where the clearinghouse is not backed by the clearing members, like some non-U.S. exchanges, it is normally backed by a consortium of banks or other financial institutions.
In the case of forward contracts, over-the-counter options contracts or swap contracts, which are traded on the interbank or other institutional market rather than on exchanges, the counterparty is generally a single bank or other financial institution, rather than a clearinghouse backed by a group of financial institutions; thus, there likely will be greater counterparty credit risk. The Partnership trades only with those counterparties that it believes to be creditworthy. All positions of the Partnership are valued each day on a mark-to-market basis. There can be no assurance that any clearing member, clearinghouse or other counterparty will be able to meet its obligations to the Partnership.
F-14

The unrealized gain (loss) on open futures and forward contracts is comprised of the following:
Futures Contracts (exchange-traded)
Forward Contracts (non-exchange-traded) Total
December 31,
2006 December 31,
2005 December 31,
2006 December 31,
2005 December 31,
2006 December 31,
2005
Gross unrealized gains $20,243,989 $16,947,161 $5,208,155 $3,109,103 $25,452,144 $20,056,264 Gross unrealized (losses) (9,329,879) (8,311,681) (5,860,782) (6,516,818) (15,190,661) (14,828,499)
Net unrealized gain (loss) $10,914,110 $8,635,480 $(652,627) $(3,407,715) $10,261,483 $5,227,765
The General Partner has established procedures to actively monitor and minimize market and credit risks. The limited partners bear the risk of loss only to the extent of the market value of their respective investments and, in certain specific circumstances, distributions and redemptions received.
NOTE 9. INDEMNIFICATIONS
In the normal course of business, the Partnership enters into contracts and agreements that contain a variety of representations and warranties and which provide general indemnifications. The Partnership’s maximum exposure under these arrangements is unknown, as this would involve future claims that may be made against the Partnership that have not yet occurred. The Partnership expects the risk of any future obligation under these indemnifications to be remote.
NOTE 10. SUBSEQUENT EVENT
From January 1, 2007 to January 31, 2007, there were contributions and redemptions totaling approximately $23,209,000 and $2,335,000, respectively.
F-15

SIGNATURES
Pursuant to the requirements of Section 13 or 15(d) of the Securities Exchange Act of 1934, the registrant has duly caused this report to be signed on its behalf by the undersigned, thereunto duly authorized, in the City of Chicago, State of Illinois on the 1st day of February, 2007.
GRANT PARK FUTURES FUND LIMITED PARTNERSHIP
By: Dearborn Capital Management, L.L.C. its general partner
By: /s/ David M. Kavanagh David M. Kavanagh President
POWER OF ATTORNEY
KNOW ALL PERSONS BY THESE PRESENTS, that each person whose signature appears below hereby constitutes and appoints David M. Kavanagh and Maureen O’Rourke, and each of them, the true and lawful attorneys-in-fact and agents of the undersigned, with full power of substitution and resubstitution, for and in the name, place and stead of the undersigned, to sign any and all amendments to this Annual Report on Form 10-K, and to file the same, with all exhibits thereto and other documents in connection therewith, with the Securities and Exchange Commission, and hereby grants to such attorneys-in-fact and agents, and each of them, full power and authority to do and perform each and every act and thing requisite and necessary to be done, as fully as to all intents and purposes as each of the undersigned might or could do in person, hereby ratifying and confirming all that said attorneys-in-fact and agents, or any of them, or their or his substitutes, may lawfully do or cause to be done by virtue hereof.
Pursuant to the requirements of the Securities Exchange Act of 1934, this report has been signed below by the following persons on behalf of the registrant and in the capacities indicated on February 1, 2007.
Signature Title
/s/ David M. Kavanagh David M. Kavanagh
President (Principal Executive Officer)
/s/ Maureen O’Rourke Maureen O’Rourke
Chief Financial Officer (Principal Financial and Accounting Officer)

EXHIBIT INDEX
Exhibit Number Description of Document
3.1(1) Third Amended and Restated Limited Partnership Agreement of the Registrant.
3.2(2) Certificate of Limited Partnership of the Registrant.
10.1(2) First Amended and Restated Advisory Contract among the registrant, Dearborn Capital Management, L.L.C. and Rabar Market Research, Inc.
10.2(2) First Amended and Restated Advisory Contract among the registrant, Dearborn Capital Management, L.L.C. and EMC Capital Management, Inc.
10.3(2) First Amended and Restated Advisory Contract among the registrant, Dearborn Capital Management, L.L.C. and Eckhardt Trading Company.
10.4(2) Advisory Contract among the registrant, Dearborn Capital Management, L.L.C. and Graham Capital Management, L.P.
10.5(3) Advisory Contract among the registrant, Dearborn Capital Management, L.L.C. and Winton Capital Management Limited.
10.6(3) Advisory Contract among the registrant, Dearborn Capital Management, L.L.C. and Saxon Investment Corporation.
10.7(4) Advisory Contract among the registrant, Dearborn Capital Management, L.L.C. and Welton Investment Corporation.
10.8(5) Subscription Agreement and Power of Attorney.
10.9(6) Request for Redemption Form.
24.1 Power of Attorney (included on signature page).
31.1 Certification of Principal Executive Officer pursuant to Rule 13a-14(a) under the Securities Exchange Act of 1934.
31.2 Certification of Principal Financial Officer pursuant to Rule 13a-14(a) under the Securities Exchange Act of 1934.
32.1 Certification pursuant to 18 U.S.C. Section 1350, as adopted pursuant to Section 906 of the Sarbanes-Oxley Act of 2002.
(1) Included as Appendix A to the prospectus which is part of the Registrant’s Registration Statement on Form S-1 (File
No. 333-119338) and incorporated herein by reference. (2) Filed as an Exhibit to the Registrant’s Registration Statement on Form S-1 (File No. 333-104317) and incorporated
herein by reference. (3) Filed as an Exhibit to the Registrant’s Registration Statement on Form S-1 (File No. 333-119338) and incorporated
herein by reference.

(4) Filed as an Exhibit to the Registrant’s annual report on Form 10-K for the fiscal year ended December 31, 2005 and incorporated herein by reference.
(5) Included as Appendix B to the prospectus which is part of the Registrant’s Registration Statement on Form S-1 (File No. 333-119338)
(6) Included as Appendix D to the prospectus which is part of the Registrant’s Registration Statement on Form S-1 (File No. 333-119338)
F-2

EXHIBIT 31.1
CERTIFICATION
I, David M. Kavanagh, certify that:
1. I have reviewed this annual report on Form 10-K of Grant Park Futures Fund Limited Partnership;
2. Based on my knowledge, this report does not contain any untrue statement of a material fact or omit to state a material fact necessary to make the statements made, in light of the circumstances under which such statements were made, not misleading with respect to the period covered by this report;
3. Based on my knowledge, the financial statements, and other financial information included in this report, fairly present in all material respects the financial condition, results of operations and cash flows of the registrant as of, and for, the periods presented in this report;
4. The registrant’s other certifying officer and I are responsible for establishing and maintaining disclosure controls and procedures (as defined in Exchange Act Rules 13a-15(e) and 15d-15(e)) for the registrant and have:
a) Designed such disclosure controls and procedures, or caused such disclosure controls and procedures to be designed under our supervision, to ensure that material information relating to the registrant, including its consolidated subsidiaries, is made known to us by others within those entities, particularly during the period in which this report is being prepared;
b) Evaluated the effectiveness of the registrant’s disclosure controls and procedures and presented in this report our conclusions about the effectiveness of the disclosure controls and procedures, as of the end of the period covered by this report based on such evaluation; and
c) Disclosed in this report any change in the registrant’s internal control over financial reporting that occurred during the registrant’s most recent fiscal quarter (the registrant’s fourth fiscal quarter in the case of an annual report) that has materially affected, or is reasonably likely to materially affect, the registrant’s internal control over financial reporting; and
5. The registrant’s other certifying officer and I have disclosed, based on our most recent evaluation of internal control over financial reporting, to the registrant’s auditors and the audit committee of registrant’s board of directors (or persons performing the equivalent functions):
a) All significant deficiencies and material weaknesses in the design or operation of internal control over financial reporting which are reasonably likely to adversely affect the registrant’s ability to record, process, summarize and report financial information; and
b) Any fraud, whether or not material, that involves management or other employees who have a significant role in the registrant’s internal control over financial reporting.
Date: February 1, 2007
/s/ David M. Kavanagh David M. Kavanagh, President (Principal Executive Officer) Dearborn Capital Management, L.L.C. General Partner

EXHIBIT 31.2
CERTIFICATION
I, Maureen O’Rourke, certify that:
1. I have reviewed this annual report on Form 10-K of Grant Park Futures Fund Limited Partnership;
2. Based on my knowledge, this report does not contain any untrue statement of a material fact or omit to state a material fact necessary to make the statements made, in light of the circumstances under which such statements were made, not misleading with respect to the period covered by this report;
3. Based on my knowledge, the financial statements, and other financial information included in this report, fairly present in all material respects the financial condition, results of operations and cash flows of the registrant as of, and for, the periods presented in this report;
4. The registrant’s other certifying officer and I are responsible for establishing and maintaining disclosure controls and procedures (as defined in Exchange Act Rules 13a-15(e) and 15d-15(e)) for the registrant and have:
a) Designed such disclosure controls and procedures, or caused such disclosure controls and procedures to be designed under our supervision, to ensure that material information relating to the registrant, including its consolidated subsidiaries, is made known to us by others within those entities, particularly during the period in which this report is being prepared;
b) Evaluated the effectiveness of the registrant’s disclosure controls and procedures and presented in this report our conclusions about the effectiveness of the disclosure controls and procedures, as of the end of the period covered by this report based on such evaluation; and
c) Disclosed in this report any change in the registrant’s internal control over financial reporting that occurred during the registrant’s most recent fiscal quarter (the registrant’s fourth fiscal quarter in the case of an annual report) that has materially affected, or is reasonably likely to materially affect, the registrant’s internal control over financial reporting; and
5. The registrant’s other certifying officer and I have disclosed, based on our most recent evaluation of internal control over financial reporting, to the registrant’s auditors and the audit committee of registrant’s board of directors (or persons performing the equivalent functions):
a) All significant deficiencies and material weaknesses in the design or operation of internal control over financial reporting which are reasonably likely to adversely affect the registrant’s ability to record, process, summarize and report financial information; and
b) Any fraud, whether or not material, that involves management or other employees who have a significant role in the registrant’s internal control over financial reporting.
Date: February 1, 2007
/s/ Maureen O’Rourke Maureen O’Rourke, Chief Financial Officer Dearborn Capital Management, L.L.C. General Partner

EXHIBIT 32.1
CERTIFICATION PURSUANT TO 18 U.S.C. SECTION 1350,
AS ADOPTED PURSUANT TO SECTION 906 OF THE SARBANES-OXLEY ACT OF 2002
Pursuant to 18 U.S.C. §1350, as created by Section 906 of the Sarbanes-Oxley Act of 2002, each of the undersigned principal executive officer of Dearborn Capital Management, L.L.C., the general partner (the “General Partner”) of Grant Park Futures Fund Limited Partnership (“Grant Park”), and principal financial officer of the General Partner hereby certifies that:
(1) the accompanying Annual Report on Form 10-K of Grant Park for the fiscal year ended December 31, 2006 (the “Report”) fully complies with the requirements of section 13(a) or 15(d), as applicable, of the Securities Exchange Act of 1934, as amended; and
(2) the information contained in the Report fairly presents, in all material respects, the financial condition and results of operations of Grant Park.
Date: February 1, 2007
/s/ David M. Kavanagh David M. Kavanagh President (Principal Executive Officer) Dearborn Capital Management, L.L.C. General Partner
/s/ Maureen O’Rourke Maureen O’Rourke Chief Financial Officer Dearborn Capital Management, L.L.C. General Partner
This certification accompanies this Report pursuant to Section 906 of the Sarbanes-Oxley Act of 2002 and shall not be deemed filed by Grant Park for purposes of Section 18 of the Securities Exchange Act of 1934, as amended.