grant agreement no. 287596 d-liverd-liver.eu/wp-content/uploads/d-liver_d3.3_v1.0-public.pdf ·...
TRANSCRIPT
d-LIVER_D3.3_v1.0-Public.docx Page 1/13
Grant Agreement no. 287596
d-LIVER ICT-enabled, cellular artificial liver system incorporating
personalized patient management and support
INSTRUMENT: Collaborative Project (Integrating Project) OBJECTIVE: ICT-2011.5.1
D3.3: Improved sensor integration onto the platform for extended prototype platform
Due Date of Deliverable: 31st March 2014 Completion Date of Deliverable: 21st May 2014 Start date of project: 1st October 2011 Duration: 48 months Lead partner for deliverable: CEA-LETI
Revision: v1.0
Project co-funded by the European Commission within the 7th Framework Programme (2007-2013)
Dissemination Level
PU Public PP Restricted to other programme participants (including the Commission Services) RE Restricted to a group specified by the consortium (including Commission Services) CO Confidential, only for members of the consortium (including Commission Services)

d-LIVER_D3.3_v1.0-Public.docx Page 2/13
Document History Issue Date Version Changes Made / Reason for this Issue 25th March 2014 v0.1 First draft 7th May 2014 v0.2 Compilation of partner contributions 21st May 2014 v1.0 Final version of public deliverable
Document Main Author(s): Marie-Line Cosnier (CEA-LETI), Alex Fragoso (URV),
Frode Strisland (SINTEF) Document signed off by: Professor Calum McNeil (UNEW) Copyright © Copyright 2014 CEA-LETI, URV, SINTEF. This document has been produced within the scope of the d-LIVER Project. The utilisation and release of this document is subject to the conditions of the contract within the 7th Framework Programme, grant agreement no. 287596.

d-LIVER_D3.3_v1.0-Public.docx Page 3/13
Table of Contents
1. Executive Summary ............................................................................................................ 4 2. Introduction ......................................................................................................................... 5 3. Biomolecule platform .......................................................................................................... 6
3.1. Description of the final biomolecule platform ............................................................... 6 4. ISE platform ........................................................................................................................ 6
4.1. Description of the platform ............................................................................................ 6 4.2. Fluidic sequence ............................................................................................................. 8 4.3. Final characterisation and performance of creatinine sensor ......................................... 8
5. Clotting time platform ........................................................................................................ 9 5.1. Description of the final clotting time platform ............................................................... 9 5.2. Fluidic sequence ........................................................................................................... 10 5.3. Final characterisation and performance ........................................................................ 10
6. Electronic board and signal processing ........................................................................... 11 6.1. BBI cartridge readout electronics ................................................................................. 11
7. Conclusions ........................................................................................................................ 13

d-LIVER_D3.3_v1.0-Public.docx Page 4/13
1. Executive Summary Deliverable D3.3 is the third of the four deliverables due for WP3 in the d-LIVER project.
It describes the three sensor platforms in their final configuration.
With regard to the results and characterisation studies carried out on the different sensors, decisions have been made by the consortium since the production of deliverable D3.2. Overall, 6 sensors will be finally integrated within the fluidic cartridge: albumin, bilirubin, creatinine, sodium, potassium and blood clotting time. They are distributed in three independent platforms:
1. Biomolecule platform for albumin and bilirubin sensors Albumin is detected by impedance measurements using a 3 electrode system and bilirubin is measured by amperometry also using a 3 electrode system. This platform will be assembled in the fluidic cartridge using double-sided adhesive tape.
2. ISE platform for sodium, potassium and creatinine sensors Potassium and sodium ions are detected directly by potentiometry and creatinine is measured by indirect potentiometry. This platform will be assembled to the fluidic cartridge using double-sided adhesive tape.
3. Clotting time platform for clotting time sensor Clotting time is measured optically by detecting the speckle figure due to the stop in motion of the red blood cells during coagulation. This platform is part of the fluidic channels in the fluidic cartridge.
The electronic readout has been specified for all the sensors and is presented in this document.
d-LIVER_D3.3_v1.0-Public.docx Page 5/13
2. Introduction This document is deliverable D3.3 of the d-LIVER project. It presents the extended prototype platforms. The extended prototype is finally composed of three platforms: the first one is for biomolecule sensors (albumin and bilirubin) developed by URV, the second for ion sensors (sodium and potassium) developed by CEA-LETI and the third for clotting time, also developed by CEA-LETI. This platform is part of the fluidic cartridge itself. The major evolution concerning these platforms compared with those described in deliverable D3.2 is the substitution of the ammonium sensor by the creatinine sensor developed by URV. Indeed, the ammonium sensor will not be integrated into the cartridge at this stage and the creatinine sensor is based on indirect potentiometric detection. Consequently the creatinine sensor will be implemented within the ion sensor platform.
The platforms have been developed in close collaboration between URV, CEA-LETI, SINTEF - in charge of the development of the electronic readout - and FhG-ICT-IMM - in charge of the development of the fluidic cartridge in order to integrate in the best way all the sensors in the fluidic cartridge. The platforms presented in this document are in their final integrateable versions.
In this report, the detection principles chosen for each sensor will be described and then the platforms and the associated fluidic sequence reported. Some final results on characterisation will also be presented where appropriate.
The clinical significance has already been reported in deliverable D3.2 and details on integration of the different platforms within the cartridge are presented in deliverable D4.5.

d-LIVER_D3.3_v1.0-Public.docx Page 6/13
3. Biomolecule platform
3.1. Description of the final biomolecule platform Albumin and bilirubin will be detected electrochemically in diluted serum.
Albumin detection is based on changes in impedance measurements which are related to albumin concentration.
In the case of bilirubin, the sensor is based on amperometric measurement.
Both sensors are three-electrode systems on PCB with working, reference and counter electrodes made of gold and interfaced with the cartridge via double-sided adhesive tape (Figure 1).
Figure 1: Biomolecule sensors integration consisting of a PCB (in green) with gold electrodes (three electrode cells) and an adhesive channel foil (in yellow), which connects the PCB to the cartridge to
complete the microfluidic path.
Fluidic sequences for both the albumin and bilirubin sensors in the biochemistry cartridge have been devised and are undergoing testing.
4. ISE platform
4.1. Description of the platform Sodium, potassium and creatinine will be detected by integrated Ion Selective Electrodes (ISEs) in diluted serum. The detection principle is described in more detail in deliverables D3.1 and D3.2.
Sodium and potassium are detected directly by the ISE based on the interaction between the respective ions and specific PVC membranes. Creatinine will be detected by indirect potentiometry.
The 3 sensors will have a common integrated reference electrode. The platform will be thus constituted of 4 electrodes.
The platform has already been described in deliverable D3.2. The major change for the last version is the positioning of the 4 electrodes to save space on the cartridge. It is composed of 3 parts:
- A PCB with 4 gold electrodes and pads for connector (and a connector) - A module with 4 chambers (one for each electrode) with one smaller for reference
electrode - A fluidic cover containing the fluidic chamber in which the sample will be introduced
A 3D view and a picture of the platform in its final shape are shown in Figure 2.

d-LIVER_D3.3_v1.0-Public.docx Page 7/13
Figure 2: 3D view and picture of the final platform.
The PCB receives gold electrodes and connector. Gold electrodes have a diameter of 500 µm. The 4 electrodes are covered with a silver pellet and then chlorinated.
The module, manufactured by FhG-ICT-IMM, could be made in either PVC or polycarbonate (PC). The platform will be interfaced with the fluidic cartridge via a double sided adhesive tape (Figure 3).
Figure 3: ISE sensors integration consisting of a PCB (in green) with gold electrodes, a first adhesive
foil (in grey) to assemble a module (in blue) and a final adhesive channel foil (in yellow), which connects the whole assembly to the cartridge to complete the microfluidic path.
Location for reference electrode

d-LIVER_D3.3_v1.0-Public.docx Page 8/13
4.2. Fluidic sequence The fluidic sequence for the ISE measurements is depicted below:
4.3. Final characterisation and performance of creatinine sensor The sensors have been first characterised in a cone-shaped ISE format and then in a PCB format.
Sequential use of sensors
The sensors were tested for sequential use to simulate the measuring conditions in the cartridge. The sequence was as follows: PBS, 100 M creatinine, PBS, 1000 M creatinine, PBS and 100 µM creatinine. The reverse experiment was also performed (high-low-high concentration). As can be seen in Figure 4, the sensor responded to all these changes with good signal recovery (Ecreatinine-EPB) of the initial concentration. The sensors could be used at least three times. The required stabilisation time was 10 min after addition.
PB 100 uM PB 1000 uM PB 100 uM
-0.206
-0.204
-0.202
-0.200
-0.198
-0.196
-0.194
-0.192
-0.190
-0.188
-0.186
-0.184
-0.182
-0.180
E (
V)
PB 1000 uM PB 200 uM PB 1000 uM
-0.212
-0.210
-0.208
-0.206
-0.204
-0.202
-0.200
-0.198
-0.196
-0.194
-0.192
-0.190
-0.188
-0.186
E(V
)
Figure 4: Potential changes for the creatinine sensor under sequential use in cone format.

d-LIVER_D3.3_v1.0-Public.docx Page 9/13
This study has also been carried out on the PCB format sensor with the highest creatinine concentrations. Figure 5 illustrates the results:
Figure 5: Potential changes for the creatinine sensor under sequential use in PCB format.
The reproducibility has been evaluated as +/- 8% off chip.
5. Clotting time platform
5.1. Description of the final clotting time platform The decision was made to integrate the optical blood clotting sensor within the d-LIVER blood biochemistry instrument as a low-risk option. Results on electrical blood clotting sensor are promising but this approach would require significant further development.
The optical detection principle is based on imaging of red blood cell movement stopping when blood clots. It is described in more detail in deliverables D3.1 and D3.2. The sensor has already been described in D3.2. The major change for the last version of the sensor is the presence of a VCSEL (vertical-cavity surface-emitting laser) instead of a laser diode.
The sample has to be closed from the CMOS sensor and the VCSEL could be place at about 15mm from the sample. Therefore using a VCSEL allows reducing distance between sample and light source in order to save place for the integration within the instrument.
The reference of the CMOS sensor used is MT9M001C12STM (Figure 6).
Figure 6: Picture of the CMOS sensor.
The CMOS and VCSEL will part of the instrument and the clotting chamber will be part of the fluidic cartridge. A picture of the configuration of the sensor is shown in Figure 7.

d-LIVER_D3.3_v1.0-Public.docx Page 10/13
Figure 7: Clotting sensor integration consisting of a light source (in red), a light detector (in black) and
a clotting chamber which is part of the cartridge.
5.2. Fluidic sequence The complete measurement sequence has been defined as follows:
5.3. Final characterisation and performance The issue here is to have a clotting chamber with good optical quality. Indeed the parts of the cartridge which will be crossed by the light need to be minimally diffusive. That means surface has to be smooth. If the surface is too diffusive the signal will be lost within diffusive noise and the accuracy of the measurement will deteriorate.
Experiments on cartridges showed that the surface condition is much improved when using injection moulded cartridges compared with micro-machined ones.
In the final version of the cartridge surface treatment after injection moulding will further improve the optical quality.
Whole blood inlet
Cartridge Clotting chamber

d-LIVER_D3.3_v1.0-Public.docx Page 11/13
6. Electronic board and signal processing SINTEF is responsible for the development of the electrical readout circuitry from the BBI cartridges. It is also likely that parts of this technology will be employed to make ammonia measurements linked with the BAL reactors.
Specific developments concerning the ammonium sensor for the bioreactor are components of WP5 and are therefore reported in the associated deliverables.
6.1. BBI cartridge readout electronics A decision was made to design one PCB for the readout electronics. This decision was made after discovering the possibility of placing the readout electronics PCB vertically. This allowed larger board dimensions and made it possible to combine all electronics in one single PCB while still being able to place the sensitive Analog front-end in close proximity to the sensors. For this to work a new connector type was needed, and a solution was found in a low pitch right angle spring loaded connector from Preci-dip (Figure 8).
Figure 8 Preci-dip connector.
The readout PCB will contain:
‐ Analog front-end which will be placed in close proximity to the sensors and which will output low impedance value (buffered) signals from the sensitive sensor cells
‐ Readout electronics which will carry out the digital signal processing (DSP).
The sensor cells have very high impedance values and as a consequence they are very vulnerable to noise and discharging (i.e. leakage currents). Active shielding will therefore be implemented as a direct result of this.
Interfaces between the cartridge and the readout electronics will be accomplished using two Preci-dip connectors, one for each measurement technique. These connectors are spring loaded and will connect to the cartridge when the mechanical slider pushes it into place.

d-LIVER_D3.3_v1.0-Public.docx Page 12/13
Figure 9: Top level block diagram of readout electronics.
Sensors to be read out are; creatinine, potassium, sodium, albumin and bilirubin. The first three will be sensed using Open Circuit Potential (OCP) measurements, whereas albumin will be sensed using an impedimetric approach and bilirubin using amperometry, for which a small current will be measured using a potentiostat in a three electrode cell.
Additional pads to verify connectivity are also included on each side of one connector to ensure that the cartridge and analog front-end have established a secure electrical connection. The clotting time sensor (optical) is considered an external device and signals from this sensor will be forwarded directly to the main BBI instrument control independent of the read-out electronics described herein.
For read-out electronics, digital signal processing and communication with the BBI main instrument control will take place via RS485 serial communication. The command set with instructions and data transfer is being developed and the system will communicate via a 12 pin ERNI SMC cable assembly.
A suggestion for pin-out and layout for the ion sensors has been proposed and a datasheet with the recommended mating footprint provided to the biosensor development partners (Figure 10).
Figure 10: Suggested pin-out for ion sensors
d-LIVER_D3.3_v1.0-Public.docx Page 13/13
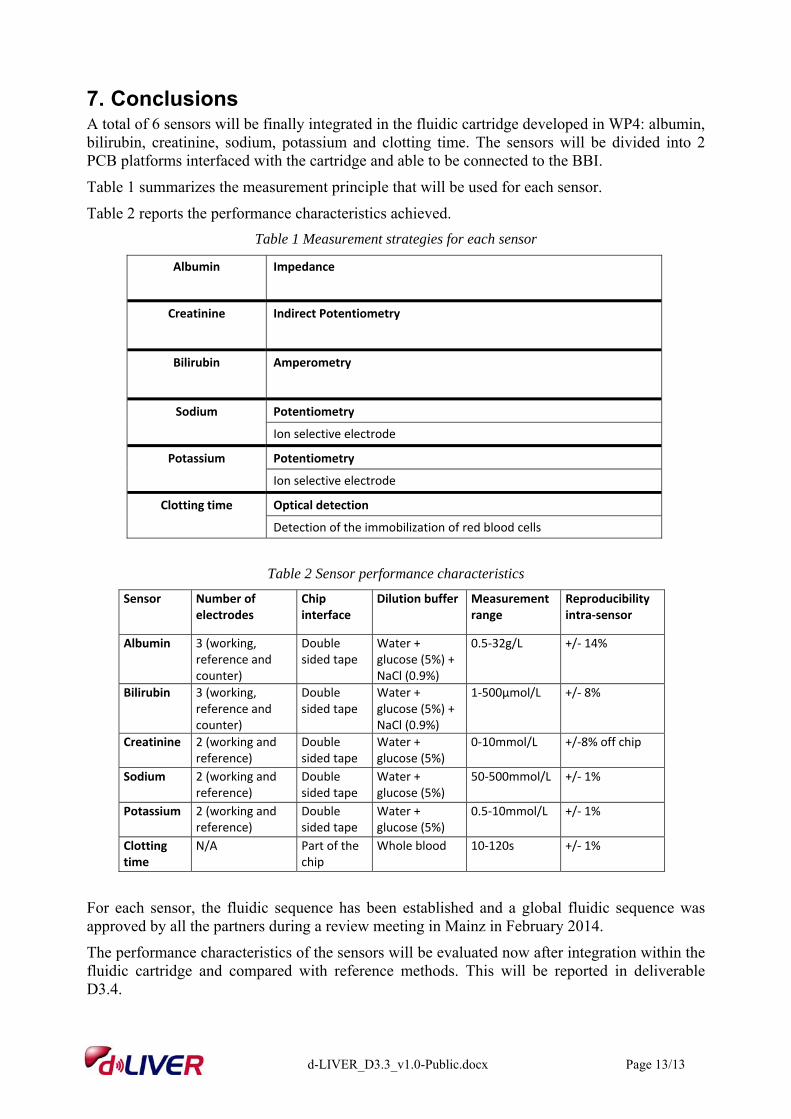
7. Conclusions A total of 6 sensors will be finally integrated in the fluidic cartridge developed in WP4: albumin, bilirubin, creatinine, sodium, potassium and clotting time. The sensors will be divided into 2 PCB platforms interfaced with the cartridge and able to be connected to the BBI.
Table 1 summarizes the measurement principle that will be used for each sensor.
Table 2 reports the performance characteristics achieved.
Table 1 Measurement strategies for each sensor
Albumin Impedance
Creatinine Indirect Potentiometry
Bilirubin Amperometry
Sodium Potentiometry
Ion selective electrode
Potassium Potentiometry
Ion selective electrode
Clotting time Optical detection
Detection of the immobilization of red blood cells
Table 2 Sensor performance characteristics
Sensor Number of electrodes
Chip interface
Dilution buffer Measurement range
Reproducibility intra‐sensor
Albumin 3 (working, reference and counter)
Double sided tape
Water + glucose (5%) + NaCl (0.9%)
0.5‐32g/L +/‐ 14%
Bilirubin 3 (working, reference and counter)
Double sided tape
Water + glucose (5%) + NaCl (0.9%)
1‐500µmol/L +/‐ 8%
Creatinine 2 (working and reference)
Double sided tape
Water + glucose (5%)
0‐10mmol/L +/‐8% off chip
Sodium 2 (working and reference)
Double sided tape
Water + glucose (5%)
50‐500mmol/L +/‐ 1%
Potassium 2 (working and reference)
Double sided tape
Water + glucose (5%)
0.5‐10mmol/L +/‐ 1%
Clotting time
N/A Part of the chip
Whole blood 10‐120s +/‐ 1%
For each sensor, the fluidic sequence has been established and a global fluidic sequence was approved by all the partners during a review meeting in Mainz in February 2014.
The performance characteristics of the sensors will be evaluated now after integration within the fluidic cartridge and compared with reference methods. This will be reported in deliverable D3.4.