static.azdeq.govstatic.azdeq.gov/wqd/wip_gc.pdfupper granite creek watershed improvement plan,...
TRANSCRIPT

Version 2.1
2012
PrescottCreeks&theGraniteCreek
WatershedImprovementCouncil
12/31/2012
ImprovementPlanfortheUpperGraniteCreekWatershed,
Arizona


Upper Granite Creek Watershed Improvement Plan, August 2012 i
ContentsAcknowledgements ........................................................................................................................ vii
Abbreviations .................................................................................................................................. 1
Executive Summary ......................................................................................................................... 4
Chapter 1: Background ................................................................................................................... 7
Watershed Description ................................................................................................................... 7
Watershed Topography and Hydrology .................................................................................... 11
USFS Watershed Condition Framework ................................................................................... 11
Impaired Waters ....................................................................................................................... 13
Evidence of Impairment ........................................................................................................ 13
Standards and Designated Uses ........................................................................................... 14
Evidence to Support Escherichia coli (E. coli) Impairment ................................................... 15
Critical Conditions ................................................................................................................. 16
TMDL Findings or Status of Development ............................................................................ 16
Bioassessments ..................................................................................................................... 17
Water Quality Concerns ................................................................................................................ 17
Potential Sources of Pollution .................................................................................................. 17
Aging Sewer Infrastructure ................................................................................................... 17
Failing or Ill‐Maintained Septic Systems ............................................................................... 18
Water Reuse (Treated Effluent and Gray Water) ................................................................. 19
Horses, Cattle, and Other Livestock ...................................................................................... 20
Wildlife .................................................................................................................................. 20
Pets ........................................................................................................................................ 21
Fire ........................................................................................................................................ 21
Impervious Cover and Stormwater ....................................................................................... 22
Recreation ............................................................................................................................. 24
Environmental and Health Risks ............................................................................................... 25
Algal Blooms .......................................................................................................................... 25
Fish Kill .................................................................................................................................. 25
Recreation ............................................................................................................................. 25
Public Health ......................................................................................................................... 26
Past Water Quality Improvement Projects and BMPs .............................................................. 26

Upper Granite Creek Watershed Improvement Plan, August 2012 ii
General Permit BMPs Applied in Watershed ............................................................................ 31
Yavapai County ..................................................................................................................... 31
City of Prescott ...................................................................................................................... 32
Arizona Department of Transportation ................................................................................ 32
Chapter 2: Watershed Investigations and Findings ...................................................................... 33
Water Quality Monitoring ............................................................................................................. 33
Nutrients and Bacteria .............................................................................................................. 33
Data Summary ....................................................................................................................... 34
Analysis of Creek Segments .................................................................................................. 34
Recommendations for Future Monitoring ............................................................................ 38
Microbial Source Tracking......................................................................................................... 38
Data Summary and Findings ................................................................................................. 39
Pharmaceuticals & Related Contaminants ............................................................................... 40
Data Summary and Findings ................................................................................................. 41
Preliminary Conclusions ........................................................................................................ 43
Recommendations ................................................................................................................ 43
Watershed field survey ................................................................................................................. 43
Survey Methods ........................................................................................................................ 43
Source Categories ..................................................................................................................... 45
Survey Analyses and Findings ................................................................................................... 45
Photos ................................................................................................................................... 45
Data Limitations .................................................................................................................... 47
Survey Summary by Stream .................................................................................................. 47
Conclusions ........................................................................................................................... 48
Riparian Buffer Assessment .......................................................................................................... 49
Survey Methods ........................................................................................................................ 49
Riparian Transect Analysis Methods ......................................................................................... 51
Riparian Scores ...................................................................................................................... 51
Bare Soil Scores ..................................................................................................................... 54
Conclusions ........................................................................................................................... 56
Watershed Residents’ Survey ....................................................................................................... 57
Delivery Modes ......................................................................................................................... 57
Data Analysis Methods ............................................................................................................. 57

Upper Granite Creek Watershed Improvement Plan, August 2012 iii
Limitations............................................................................................................................. 58
Survey Findings ......................................................................................................................... 58
Protection and Restoration in Relation to Knowledge, Involvement and Commitment ..... 58
Willingness to Support a Watershed Fee ............................................................................. 59
Information Sources.............................................................................................................. 60
Awareness of Pollution Sources............................................................................................ 60
Septic Tank Owners; Dog Walkers ........................................................................................ 61
Conclusions ............................................................................................................................... 62
Automated Geospatial Watershed Assessment (AGWA) ............................................................. 62
Data Integration and Analysis ....................................................................................................... 66
Findings ......................................................................................................................................... 68
Chapter 3: Watershed Improvement Strategy ............................................................................. 69
Watershed Improvement Plan Development ............................................................................... 69
Goals and Methods ................................................................................................................... 69
Work Plan .................................................................................................................................. 69
Watershed Improvement Council ............................................................................................. 70
Technical Resources .................................................................................................................. 71
Community Involvement .......................................................................................................... 71
Recommendations ........................................................................................................................ 71
Civic Commitment ..................................................................................................................... 72
Green Infrastructure ................................................................................................................. 72
Cost and Benefits of Green Infrastructure ............................................................................ 76
Green Streets & Parking Lots ................................................................................................ 76
Greenfield Development ...................................................................................................... 78
Redevelopment and Retrofits ............................................................................................... 78
Municipal Sewer System Upgrades .......................................................................................... 79
Septic Systems .......................................................................................................................... 79
Stormwater Infrastructure Improvements ............................................................................... 80
Forest Protection and Restoration ........................................................................................... 81
Opportunities for Sustainable Funding for Watershed Protection .......................................... 82
Public Education and Engagement ........................................................................................... 82
Print and Online Tools ........................................................................................................... 83
Community Groups ............................................................................................................... 84
Upper Granite Creek Watershed Improvement Plan, August 2012 iv
Educational articles ............................................................................................................... 84
Creek Signage ........................................................................................................................ 85
Storm Drain Markers ............................................................................................................. 85
Golf Course BMPs ..................................................................................................................... 86
Livestock BMPs ......................................................................................................................... 87
Manure Exchange/Share Program ........................................................................................ 87
Green Waste BMPs ................................................................................................................... 88
Phase I: Education ................................................................................................................. 88
Phase II: Annual Clean‐Ups ................................................................................................... 89
Highway Project BMPs .............................................................................................................. 89
Invasive Plants ........................................................................................................................... 90
Funding for Watershed Improvement Projects ............................................................................ 91
Arizona Water Infrastructure Authority Green Project Reserve .......................................... 91
Conserve to Enhance ............................................................................................................ 91
Army Corps of Engineers In‐Lieu Fee Mitigation Program ................................................... 92
Yavapai County Property Tax Incentive Program ................................................................. 93
Proposed BMP Projects ................................................................................................................ 94
Conclusions ................................................................................................................................... 94
Next steps ..................................................................................................................................... 94
References .................................................................................................................................... 95
ListofFiguresFigure 1: The Granite Creek Watershed in Relation to the State of Arizona, the Verde River Watershed, and Neighboring Watersheds ..................................................................................... 8
Figure 2: Land Ownership in the Upper Granite Creek Watershed ................................................ 9
Figure 3: Land Use in the Upper Granite Creek Watershed (2009) .............................................. 10
Figure 4: USFS Watershed Condition Framework for the Prescott National Forest .................... 12
Figure 5: Prescott Creeks, ADEQ, and City of Prescott Water Quality Monitoring Sites .............. 14
Figure 6: Impervious Cover in the Upper Granite Creek Watershed ........................................... 24
Figure 7: Past Water Quality Improvement and BMP Project Sites ............................................. 30
Figure 8: Reaches with High Total Nitrogen Concentrations ........................................................ 36
Figure 9: Reaches with High E. coli Concentrations ..................................................................... 37

Upper Granite Creek Watershed Improvement Plan, August 2012 v
Figure 10: Bacteroides Sampling Locations .................................................................................. 40
Figure 11: Sampling Locations for Pharmaceuticals & Related Contaminants ............................ 41
Figure 12: Field Survey Area & Impact Sites ................................................................................. 44
Figure 13: Stormwater Drainage Features .................................................................................... 46
Figure 14: Pollutant Hot Spots ...................................................................................................... 46
Figure 15: Buffer Impairments ...................................................................................................... 46
Figure 16: Riparian Buffer Transect Locations .............................................................................. 50
Figure 17: Riparian Scores Map .................................................................................................... 52
Figure 18: Examples of High Riparian Scores ................................................................................ 53
Figure 19: Examples of Low Riparian Scores ................................................................................ 53
Figure 20: Examples of Low Bare Soil Scores ................................................................................ 54
Figure 21: Examples of High Bare Soil Scores ............................................................................... 54
Figure 22: Bare Soil Scores Map ................................................................................................... 55
Figure 23: AGWA Water Yield ....................................................................................................... 64
Figure 24: AGWA Sediment Yield .................................................................................................. 65
Figure 25: Upper Granite Creek Subwatersheds .......................................................................... 67
Figure 26: Green Infrastructure Benefits and Practices ............................................................... 75
ListofTablesTable 1: USFS Watershed Condition Framework Indicators for the Prescott National Forest .... 13
Table 2: Designated Uses for Granite Creek and its Tributaries ................................................... 15
Table 3: Parameters of Interest and Applicable State Surface Water Quality Standards ............ 15
Table 4: Granite Creek Field Survey Data Summary ..................................................................... 47
Table 5: Source and Cause Comparison........................................................................................ 48
Table 6: Transect Comparisons by Creek Segment ...................................................................... 56
Table 7: Watershed Improvement Council Representatives and Member Organizations .......... 70
Table 8: Components of Seattle Public Utilities' Natural Drainage System (NDS) program ........ 77
Table 9: Potential Highway Project BMPs ..................................................................................... 89

Upper Granite Creek Watershed Improvement Plan, August 2012 vi
AppendicesAppendix A: Creek Segment Water Quality Analysis…………………………………………………………….99
Appendix B: Microbial Source Tracking Methods and Results……………………………………………..105
Appendix C: Watershed Residents’ Survey…………………………………………………….........................109
Appendix D: Watershed Residents’ Survey Analyses……………………………………………………………113
Appendix E: Upper Granite Creek Subwatershed Characterization Table ……………………………137
Appendix F: Newspaper Articles ………………………………………………………………………………………….145
Appendix G: Financial Survey Table………………………………………………………………………………………151
Appendix H: Priority BMP Project Descriptions…………………………………………………………………….157
Appendix I: Second‐Tier BMP Project Descriptions……………………………………………………………….171

Upper Granite Creek Watershed Improvement Plan, August 2012 vii
ACKNOWLEDGEMENTS
The development of this plan was funded by the Arizona Department of Environmental Quality (ADEQ) Water Quality Improvement Grant (WQIG) program. The WQIG program awards funding to water quality projects focused on nonpoint source
pollution throughout the state. Funding for this program is provided by the US EPA pursuant to Section 319(h) of the Clean Water Act.
Prescott Creeks Preservation Association Plan development oversight was provided by Prescott Creeks Preservation Association in conjunction with the Granite Creek Watershed Improvement Council (WIC). Prescott Creeks is a 501(c)(3) nonprofit organization with the mission to promote, protect and celebrate the ecological integrity of riparian systems and associated wetlands in the central Arizona watersheds through conservation, restoration and
education. Granite Watershed Improvement Council The WIC is a voluntary group of watershed stakeholders including local and state government and land management agencies, as well as local residents and community groups. Organizations represented on the WIC include: City of Prescott Yavapai County Arizona Department of Transportation (ADOT) Prescott National Forest (PNF) Technical Support Technical support was provided by: ADEQ Non‐point Education for Municipal Officials (NEMO) Master Watershed Stewards (MWS)

Upper Granite Creek Watershed Improvement Plan, August 2012 1
ABBREVIATIONS ACSP Audubon Cooperative Sanctuary Program ADEQ Arizona Department of Environmental Quality ADOT Arizona Department of Transportation AGI Agriculture Irrigation AGL Agriculture Livestock Watering AGWA Automated Geospatial Watershed Assessment ALEC Arizona Lab for Emerging Contaminants AWc Aquatic and Wildlife (cold water) AZGFD Arizona Game and Fish Department AZPDES Arizona Pollutant Discharge Elimination System BMP Best Management Practice CAFO Confined Animal Feeding Operation CFU Colony‐Forming Unit CWA Clean Water Act CWSRF Clean Water State Revolving Fund C2E Conserve to Enhance DEM Digital Elevation Model DU Designated Use EPA Environmental Protection Agency FBC Full Body Contact FC Fish Consumption FEMA Federal Emergency Management Agency GI Green Infrastructure GIS Geographic Information Systems GPS Global Positioning System HUC Hydrologic Unit Code IBA Important Bird Area LID Low Impact Development MOU Memorandum of Understanding MS4 Municipal Separate Storm Sewer System MST Microbial Source Tracking MWS Master Watershed Steward NDS Natural Drainage System NEMO Nonpoint Education for Municipal Officials NFIP National Flood Insurance Program NPDES National Pollutant Discharge Elimination System NPS Nonpoint Source PFOs Perfluorinated Surfactants PNF Prescott National Forest TKN Total Kjeldahl Nitrogen

Upper Granite Creek Watershed Improvement Plan, August 2012 2
TMDL Total Maximum Daily Load USFS United States Forest Service VBH Volume‐Based Hydrology WCF Watershed Condition Framework WIC Watershed Improvement Council WIFA Water Infrastructure Finance Authority WIP Watershed Improvement Plan WQIG Water Quality Improvement Grant YPIT Yavapai‐Prescott Indian Tribe YWMA Yavapai Weed Management Area

Upper Granite Creek Watershed Improvement Plan, August 2012 3

Upper Granite Creek Watershed Improvement Plan, August 2012 4
EXECUTIVE SUMMARY This document is a Watershed Improvement Plan (WIP) for the Upper Granite Creek Watershed, located in central Arizona in the Verde River Watershed (Fig. 1). The goal of the WIP is to identify and prioritize watershed improvement projects critical to restore water quality. This project originated as a community‐driven watershed survey and planning effort to address nutrient and bacteria water quality concerns in the watershed, funded by the Arizona Department of Environmental Quality (ADEQ) Targeted Watershed Improvement Plan Grant Program. The Granite Creek Watershed Improvement Council (WIC), a collaborative body with representatives from the City of Prescott, Yavapai County, Prescott National Forest, Arizona Department of Transportation, community members, and volunteers, participates in the planning. The purpose of the WIP Program is to address specific pollutants that are causing impairment within targeted Arizona watersheds, identify potential solutions, and to develop an implementation plan that will reduce pollutant loads from nonpoint sources that cause surface waters to be listed as “impaired” or “not attaining” surface water quality standards. The goal of the ADEQ Targeted Watershed Improvement Grant Program is to use developed WIPs to focus on future on‐the‐ground priority projects that will ultimately lead to bringing impaired waters back into attainment of surface water quality standards. Unlike pollution from industrial and sewage treatment plants or other discernible, confined and discrete conveyances (defined as point sources), nonpoint source (NPS) pollution comes from many diffuse sources. NPS pollution is caused by stormwater from rainfall, snowmelt, and irrigation moving over and through the ground. As the runoff moves, it picks up and transports natural and human‐made pollutants, and deposits them into lakes, rivers, wetlands, and ground waters. Due to its diffuse nature, NPS pollution is not regulated by ADEQ. As a result, ADEQ developed the Targeted Watershed Grant program to provide funding for WIP development and implementation to NPS pollution‐impaired watersheds around the state. Located in central Arizona, the Granite Creek Watershed is an important headwater of the Verde River, one of Arizona’s few perennial and Wild & Scenic Rivers. Roughly 50 square miles in size, the Upper Granite Creek Watershed includes nine named creeks totaling approximately 60 linear miles, with four lakes, and two impaired water bodies. The primary surface waters of interest for this project are Granite Creek and its main tributaries (Banning, Manzanita, Aspen, Butte, Miller, and North Fork Granite Creeks) from their headwaters downstream to Watson Lake. In 2004, Watson Lake was listed as “impaired” due to high nitrogen, high pH levels, and low dissolved oxygen. At the same time, Granite Creek was listed for low dissolved oxygen; in 2010, it received an additional impairment listing for Escherichia coli (E. coli) bacteria. As of August 2012, ADEQ is performing a Total Maximum Daily Load (TMDL) analysis for Watson Lake. Watershed investigations as part of the WIP comprised of volunteer water quality monitoring, a watershed field survey, watershed residents’ survey, and riparian buffer assessment. Water

Upper Granite Creek Watershed Improvement Plan, August 2012 5
quality monitoring was conducted between 2009 and 2012 for physical parameters like pH, dissolved oxygen, and temperature; chemical parameters like Total Nitrogen, Total Phosphorus, Total Kjeldahl Nitrogen (TKN), and Ammonia; and biological parameters like E. coli and Bacteroides for Microbial Source Tracking. Monitoring in Phase II included testing for pharmaceuticals with the Arizona Lab for Emerging Contaminants. Due to the intermittent nature of the creeks and irregular precipitation, monitoring data did not indicate specific sources. Instead, it pointed towards general urban land uses which vary along Granite Creek and its tributaries. In a 2010 watershed field survey, Creek Crew volunteers systematically walked 16.5 miles of stream to document sources and causes of excess nutrients and E. coli. Of the sources/causes documented, the majority of them were related to stormwater drainage, followed by structural and activity impacts to the riparian buffer. Miller, Butte, Granite, and Aspen Creeks had the most observations per mile of creek surveyed. This data points towards urban pollutants carried in stormwater, exacerbated by a lack of adequate riparian buffers along the urban creek reaches. A 2010 rapid vegetation assessment and physical survey of the Upper Granite Creek Watershed was undertaken to assess the current functionality of the watershed channels in terms of their ability to filter pollutants from runoff. Results indicate that riparian impacts are scattered across the watershed and are not isolated to a specific land use. Urban reaches of Miller, Butte, and Granite Creeks had the lowest riparian scores, signifying that these reaches had little to no vegetation, disturbances, and/or limited width due to human activities or structures. A Watershed Residents’ Survey was mailed to approximately 40,000 households between December 15, 2009 and March 15, 2010. The survey was designed to gather information about watershed residents’ knowledge of watershed and water quality issues; perceptions of water quality; attitudes and values about protection and restoration of local water ways; and environmental behaviors. Nearly 1,500 survey responses were received. Survey results demonstrate that there is general public support for protecting and restoring our waterways, yet there are large gaps in public knowledge about watersheds and sources of pollutants. Through these data collection activities and local knowledge of the watershed, potential sources of pollution were identified as: aging and degraded municipal sewer infrastructure; failing or ill‐maintained septic systems; water reuse; horses, cattle, and other livestock; and pets. Background sources such as wildlife and forest fires also contribute to nutrient loading. The lower subwatershed areas are highly urbanized. Therefore, the types of potential bacteria and nutrient sources are greater than in the mostly undeveloped upper subwatersheds. The urbanized creek segments have been channelized and separated from their natural floodplains, increasing the risk of flooding to nearby properties. The majority of natural riparian vegetation has been replaced by walls or other structures and cannot adequately perform biological filtration functions. Stormwater drainage from roads and neighborhoods is directed into the nearest waterway untreated. The data indicates that the primary factors leading to water quality impairments in the project area are nonpoint source pollutants, increased runoff

Upper Granite Creek Watershed Improvement Plan, August 2012 6
volumes due to impervious surfaces, and a lack of stormwater detention and infiltration/filtration. Green infrastructure (GI) is the primary recommendation for addressing stormwater and associated pollutants in the watershed. GI is a broad term for features that rely on natural processes such as soil, water, and plants to provide ecosystem services such as clean air, clean water, and temperature regulation. GI encompasses existing forests and green spaces as well as constructed bio‐retention features such as rain gardens, wetlands, and filter strips. Many of these practices were originally developed in temperate climates but are gaining popularity in municipalities in the arid southwest as a way to manage urban stormwater at a lower cost than the traditional “grey” infrastructure (pipes and culverts) while providing other economic, social, and environmental benefits (USEPA, 2009). The WIC recommends that GI be integrated with traditional grey infrastructure to the maximum extent possible within the watershed to effectively reduce stormwater quantity before it enters the already overburdened sewer system and discharges to the nearest water body. Because a watershed‐aware citizenry is key to improving surface water quality, the WIC also recommends a variety of education and outreach activities to engage the community and raise awareness to targeting different audiences and community groups. Public workshops, mailings, educational articles, and expanding the existing creek signage and storm drain marker programs are recommended. As part of a comprehensive strategy, the WIP also includes BMP recommendations for golf course turf management, manure management, green waste, forest protection and restoration, and invasive vegetation management. Specifically, the WIP identifies four priority BMP projects which are described in detail in Appendix H and listed below:
Bioretention and Sediment Basins at Prescott Rodeo Grounds
Whipple Street Bioretention Basins
Green Infrastructure Demonstration at Prescott Community/Adult Center
Green Industrial Site Practices at the APS Construction Yard To ensure continued investments in watershed health, the WIC recommends that continuous, local funding sources be investigated. In addition to federal, state, and private grant programs, an example of such funding is a “watershed protection fee” levied on municipal utility customers. The Watershed Residents’ Survey of 2010 found that the majority of respondents supported a fee to address local water quality and watershed issues in addition to supporting protection and restoration efforts within the watershed. The fee would be a property‐based charge calculated, for example, on the amount of impervious area on a property. In return, the fee would provide an incentive to reduce impervious cover, disconnect downspouts, and install rainwater harvesting features.

Upper Granite Creek Watershed Improvement Plan, August 2012 7
CHAPTER 1: BACKGROUND
WATERSHED DESCRIPTION
The Granite Creek Watershed is part of the larger Verde Watershed of central Arizona (Fig. 1). It is bordered by the Bill Williams, Hassayampa, and Agua Fria watersheds. It is roughly 359 square miles in size. The area of interest for the Targeted Watershed Improvement Planning project is the Upper Granite Creek Watershed, the Watson Lake Hydrologic Unit Code (HUC) 150602020102, which includes three lakes and eight named creeks totaling approximately 60 linear miles. The upper watershed area encompasses 45 square miles (28, 696 acres) with the Sierra Prieta and Bradshaw Mountain ranges forming its boundaries. The primary surface waters of interest for this project are Granite Creek and its main tributaries (Banning, Manzanita, Aspen, Butte, Miller, and North Fork Granite Creeks) from their headwaters downstream to Watson Lake. All of the aforementioned creeks are intermittent and are dry for portions of the year.
Land ownership (Fig. 2) and use (Fig. 3) in the watershed is diverse. The headwaters originate in the Prescott National Forest (PNF), descend through the forest and grasslands of unincorporated Yavapai County, parts of Yavapai‐Prescott Indian Tribe (YPIT) land, state lands, and through the urbanized areas of the City of Prescott, the county seat of Yavapai County. The Census Bureau estimated that Prescott’s population in 2009 was 43,217 people and the larger Prescott Metropolitan Area (the City of Prescott and the Towns of Prescott Valley, Chino Valley, and Dewey‐Humboldt) at just over 100,000 residents, making it the third‐largest metropolitan area in Arizona.
Jurisdiction in the watershed is equally diverse; the City of Prescott (17.56 mi2), unincorporated Yavapai County (4.46 mi2), PNF (18.11 mi2), YPIT (2.39 mi2), State of Arizona (2.24 mi2), and military lands (the Veteran’s Administration hospital, 0.08 mi2). There are approximately 1,800 private properties that border the main creeks and washes.

Upper Granite Creek Watershed Improvement Plan, August 2012 8
Figure 1: The Granite Creek Watershed in Relation to the State of Arizona, the Verde River Watershed, and Neighboring Watersheds
Located in central Arizona, the Granite Creek Watershed is an important headwater of the Verde River, one of Arizona’s few perennial and Wild & Scenic Rivers. Roughly 50 square miles in size, the Upper Granite Creek Watershed includes nine named creeks totaling approximately 60 linear miles, with four lakes, and two impaired water bodies.

Upper Granite Creek Watershed Improvement Plan, August 2012 9
Figure 2: Land Ownership in the Upper Granite Creek Watershed
Land ownership in the Upper Granite Creek Watershed is mostly National Forest (18.11 mi2) and private (22 mi2), with some Yavapai‐Prescott Indian Tribe (2.39 mi2), State of Arizona (2.24 mi2), and military lands (Veteran’s Administration Hospital, 0.08 mi2).

Upper Granite Creek Watershed Improvement Plan, August 2012 10
Figure 3: Land Use in the Upper Granite Creek Watershed (2009)
Land use in the watershed is primarily residential and commercial urban and national forest. While there are agricultural land uses in watershed, these do not encompass a significant land area. Seen here is a close‐up of land use in the urban portion of the watershed. Inset: An overview of land use in the entire project area.

Upper Granite Creek Watershed Improvement Plan, August 2012 11
Watershed Topography and Hydrology
The Upper Granite Creek Watershed ranges in elevation from 5,100 feet at Watson Lake to 7,979 feet at the top of Mount Union with a mean elevation of 5,595 feet. Nearly 47% of the watershed land area has a slope greater than 15%; 33% of the land area has a slope between 0 and 5%; and the remaining 20% of the land area has a slope between 5 and 15%. There are roughly 60 miles of intermittent creeks within the watershed, not including ephemeral streams and washes. Granite Creek is the primary water body in the watershed, with its headwaters originating in the Bradshaw Mountains at the southern end of the watershed, flowing 38 miles north to the Verde River. Below its confluence with Granite Creek, the Verde River is perennial, making Granite Creek an important headwater to the Verde River. Data from the USGS Granite Creek gage above Watson Lake estimates Granite Creek’s mean stream flow at 5.88 cubic feet per second (data from 7/1/1932 to 9/30/2003). The University of Arizona’s Nonpoint Education for Municipal Officials (NEMO) program’s Watershed Based Plan for the Verde Watershed classifies the Granite Creek subwatershed as high risk for metals; moderate risk for sediment; extreme risk for organics; and, moderate risk for selenium. The natural background condition of the soils within the watershed is being studied by the Arizona Department of Environmental Quality (ADEQ) as part of the Total Maximum Daily Load (TMDL) analysis.
USFS Watershed Condition Framework
In 2011, the United States Forest Service (USFS) released its Watershed Condition Framework (WCF), the agency’s first national assessment of watershed condition across all 193 million acres of National Forest System lands. The intent of the assessment is to help the agency to facilitate new investments in watershed restoration that will provide economic and ecological benefits to local communities. The framework characterizes the health and condition of forest land watersheds using 12 watershed condition indicators and prioritizes five years of watershed projects and attaches restoration plans to each. Watershed condition reflects a range of variability in three classes: healthy/pristine (functioning properly) to relatively healthy, but may require restoration work (functioning at risk), to degraded or damaged (impaired function) (Potyondy and Geier, 2011). Of the watersheds within the PNF, the Upper Granite Creek‐Watson Lake Watershed is one of twelve watersheds listed as “Functioning Properly” (Fig. 4). The neighboring Willow Creek ‐ Willow Creek Reservoir Watershed is listed as “Functioning at Risk.” The watershed indicator ratings for the Upper Granite Creek watershed are found in Table 1.

Upper Granite Creek Watershed Improvement Plan, August 2012 12
Figure 4: USFS Watershed Condition Framework for the Prescott National Forest
The majority of the watersheds within the Prescott National Forest are classified as “Functioning at Risk.” The Upper Granite Creek‐Watson Lake Watershed is one of twelve watersheds identified as “Functioning Properly.”

Upper Granite Creek Watershed Improvement Plan, August 2012 13
Table 1: USFS Watershed Condition Framework Indicators for the Prescott National Forest
Watershed Condition Indicator Rating
Aquatic Biota Condition Good
Riparian/Wetland Vegetation Condition
Good
Water Quality Condition Fair
Water Quantity Condition Fair
Aquatic Habitat Condition Good
Road and Trail Condition Poor
Soil Condition Good
Forest Cover Condition Good
Forest Health Condition Good
Terrestrial Invasive Species Condition
Good
Rangeland Vegetation Condition Poor
Impaired Waters
The Arizona’s 2004 Integrated 305(b) Assessment and 303(d) Listing Report resulted in the State designating Watson Lake and Granite Creek as “inconclusive” whereas the EPA listed Watson Lake “impaired” due to high nitrogen and pH levels, low dissolved oxygen and a fish kill in July 2000 and 13.4 miles of Granite Creek (from its headwaters to Watson Lake) due to low dissolved oxygen (Civiltech Engineering, 2009). Listing was based on data collected between 1998 and 2004. In 2010, Granite Creek received an additional impairment listing for Escherichia coli (E. coli) bacteria.
Evidence of Impairment
Water quality monitoring data collected between 2000 and 2010 by ADEQ, Prescott Creeks, and the City of Prescott was compiled and analyzed for the purposes of developing a preliminary Watershed Improvement Plan (1.0). Water quality information and samples were collected at the sites shown in Fig. 5.

Upper Granite Creek Watershed Improvement Plan, August 2012 14
Figure 5: Prescott Creeks, ADEQ, and City of Prescott Water Quality Monitoring Sites
Water quality data for surface waters are collected at widespread sites around the Upper Granite Creek Watershed by Prescott Creek, ADEQ, and the City of Prescott.
Standards and Designated Uses
The Clean Water Act (CWA) required each state to set water quality standards that delineate the goals and pollution limits for all waters within their jurisdictions (Killam, Gayle. 2005). The authority behind the CWA is water quality standards; these standards determine which waters need protection and which waters require restoration. Standards are specific to water bodies. To set standards, the states defined “Designated Uses” (DU) for each water body. Some states may have general DUs, such as “recreation” or “aquatic life” while others may be specific, such as “cold water fishery” or “swimming.” The CWA requires that each water body include “fishable/swimmable” DUs, meaning that states needs to maintain water quality to provide a balance for native aquatic life as well as safe recreation on or in the water. Establishing water quality standards consists of three connected actions: 1) designating uses, 2) establishing water

Upper Granite Creek Watershed Improvement Plan, August 2012 15
quality criteria (such as the maximum concentration of a pollutant allowable), and 3) developing and implementing antidegradation policies and procedures. The designated uses (Table 2) and standards (Table 3) apply to Granite Creek and its tributaries.
Table 2: Designated Uses for Granite Creek and its Tributaries
Creek Designated Uses (DU) DU Description
Tributaries AWc, FBC, FC Aquatic & Wildlife cold water; Full Body Contact; Fish Consumption
Granite AWc, FBC, FC, AGL, AGI,
Aquatic & Wildlife Cold Water; Full Body Contact; Fish Consumption; Agriculture Livestock Watering; Agriculture Irrigation
Table 3: Parameters of Interest and Applicable State Surface Water Quality Standards
Parameter Grab sample Annual or Geometric mean
Total Nitrogen 3 mg/l 1 mg/l (annual)
Total Phosphorus 1 mg/l 0.1 mg/l (annual)
E. coli 235 CFU/100 ml 129 CFU/100 ml (geometric)
Dissolved Oxygen >7 mg/l (A&Wc)
Ammonia *temperature dependent
pH 6.5 – 9.5
Evidence to Support Escherichia coli (E. coli) Impairment
In addition to the impairments for dissolved oxygen, pH, and nutrients, E. coli bacteria is also a pollutant of concern. Granite Creek was listed as impaired for E. coli bacteria in 2010 for exceeding state water quality standards. As of July 2012, 303 E. coli samples have been collected within the project area, 74 of which exceeded the state water quality standard of 235 CFU/100 ml. Nineteen of the samples are considered ‘elevated’ (129 CFU/100ml or higher). All exceedances occurred under storm flow or high flow conditions with presently heavy or recent heavy precipitation. Only one sample exceeding state standards was collected during base/low flow conditions.

Upper Granite Creek Watershed Improvement Plan, August 2012 16
Critical Conditions
Critical conditions—the conditions under which most of the exceedances have occurred—are identified as winter storm events that result in overland runoff and high creek flows.
143 exceedances (out of 615 samples) of state water quality standards have been documented as a result of water quality monitoring by ADEQ and Prescott Creeks as of May 2012.
68 percent of those exceedances (98) occurred in December and January.
91 percent (98) of those exceedances occur as a result of overland flow after “recently heavy” or “presently heavy” precipitation resulting in “storm flow” or “higher flow” conditions.
TMDL Findings or Status of Development
ADEQ initiated the TMDL process in 2007, sampling both Watson Lake and Willow Creek Reservoir for comparison, Granite Creek, and all the main tributaries to Granite Creek. Results to date indicate that wide‐spread nutrient loading is occurring throughout the watershed. Although most of the nitrogen and phosphorus load appears to be of non‐point origin, there have also been periodic discharges from manholes inundated with stormwater directly to the creeks. As of this writing, the TMDL is in progress. The TMDL, as projected, will provide quantitative endpoints for total nitrogen, total phosphorus, and dissolved oxygen for all major drainages sampled, as well as the main loading site to Watson Lake on Granite Creek. Watson Lake will also receive quantitative endpoints addressing total nitrogen, total phosphorus, chlorophyll‐a, dissolved oxygen, pH, and aquatic vegetation. Tasks completed during 2011‐2012:
Intensive peak season lake sampling
Sediment coring study (NAU)
Phase I of limnocorral study (UA)
Initiated Phase II limnocorral study (UA)
Lake modeling study (Tetra Tech) Tetra Tech used BATHTUB for lake modeling. With an explicit Margin of Safety of 10%, the modeling resulted in a need for 37% reduction in TN (down to 0.8 mg/L from > 1.0 mg/L) and a 35% reduction in TP (down to 0.06 mg/L from > 0.08 mg/L). Various scenarios were evaluated by the model. The most effective and least costly scenarios were a combination of watershed reductions and alum treatments in the lake. Based on the model results, Tetra Tech recommends biofiltration use in low‐gradient watershed areas, as well as infrastructure improvements in wastewater and stormwater conveyance systems. The final TMDL is expected in 2012.

Upper Granite Creek Watershed Improvement Plan, August 2012 17
Bioassessments
Bioassessments of aquatic macroinvertebrate communities were conducted in 2011‐2012 by Patrice Spindler to monitor the effectiveness of the restoration work at Watson Woods Riparian Preserve, funded by a grant from the Arizona Water Protection Fund. Baseline biological data was collected at nine sites along Granite Creek and its tributaries, including macroinvertebrates, habitat, and water chemistry. The bioassessment of aquatic macroinvertebrate communities is an important and widely accepted environmental indicator of water quality (Barbour et al., 1999). Because the creeks of the Upper Granite Creek Watershed are seasonally intermittent, the amount of streamflow is not sufficient to sustain the long‐lived macroinvertebrates of perennial streams. The bioassessments revealed a well‐developed riparian corridor at most of the study sites with the exception of those along Manzanita Creek and Granite Creek headwaters.
WATER QUALITY CONCERNS
The pollutants of concern contributing to the impairments in the Upper Granite Creek Watershed are nutrients—nitrogen and phosphorus—and E. coli bacteria.
Potential Sources of Pollution
Aging Sewer Infrastructure
Thirty‐three percent (14.94 sq. mi) of the project area is connected to Prescott’s municipal sewer. Prescott has over 300 miles of wastewater collection infrastructure (City of Prescotta, 2010) that relies primarily on gravity for transporting liquid waste to the primary wastewater treatment plant, located above Watson Lake at the base of the watersheds. There are 185 municipal lines and five miles of private service lines within the WIP project area. Many of the sewer lines, sewer mains, and manholes are located in the creek beds or adjacent to the creeks. This becomes an acute water quality problem if a pipe leaks or breaks or if sewage overflows at a manhole. With some of this
infrastructure as old as 90 years (City of Prescotta, 2010) and even recent infrastructure in need of upgrades, sewer overflows are not entirely uncommon. During a heavy winter storm in January 2010, stormwater inundated aging sewer lines, resulting in sewer overflows from five manholes along Granite Creek and Miller Creek. The cumulative effect of the inflow and infiltration forced the sewage plant to discharge three million gallons of partially treated effluent into nearby Granite Creek just above Watson Lake (Dodder, 2010).
Above: A sheet of metal acts as a temporary cover on a sewer manhole in Miller Creek that overflowed during a storm.

Upper Granite Creek Watershed Improvement Plan, August 2012 18
In response to this unintended discharge, the City of Prescott has made further efforts to prevent sewer overflows. They have closely surveyed all manholes in waterways throughout the city, replaced manhole covers that were ripped off in the storm, locked all covers that currently have the locking ability, and identified all manhole lids that will be upgraded to incorporate the locking ability. A manhole insert program is also being implemented to reduce the amount of inflow water that enters manholes from the streets. The City approved water and sewer rate increases to fund upgrades to the wastewater treatment facility and maintenance to the system. Private service lines connecting individual residences to the city’s mainline also represent potential sources of nutrients and bacteria in the case of a leak or blockage. It is difficult to know how frequent these types of occurrences are or how they are handled and, therefore, quantify the impact to water quality. The discharge of untreated sewage directly to bodies of water poses serious environmental and human health risks. Human waste contains organic material; bacteria in the water decompose the organic material which produces additional nutrients for plant growth. The decomposition process requires oxygen, leading to a decrease in the amount of oxygen available to aquatic life. In addition to increased nutrient and decreased oxygen levels, untreated sewage contains bacteria (such as Salmonella), viruses (such as Hepatitis A) and parasites (such as Giardia and Cryptosporidium) that are capable of causing disease in humans. In this document, the term ‘sewer’ refers to the municipal sanitary sewer system. Prescott is considered a Municipal Separate Storm Sewer System (MS4), meaning that the sanitary sewer and stormwater sewer systems are not connected (See General Permit BMPs Applied in Watershed).
Failing or Ill‐Maintained Septic Systems
The exact number of on‐site wastewater treatment systems, or septic systems, in the Upper Granite Creek Watershed is not known. However, residences in the unincorporated area of Yavapai County typically use these systems to dispose of household wastewater. Nearly 10% of the watershed is unincorporated land that is not national forest, tribal, or other state or federal lands. Additionally, a small percentage of residences within the City of Prescott that have not been connected to the municipal sewer infrastructure rely on septic systems for wastewater disposal. There are approximately 5,000 customers of the city’s water service that are not connected to the sewer system; this includes both city and county residents.
One in four homes in the US depends on septic systems to treat wastewater, particularly in less densely populated areas (USEPA, 2008). When operating properly, septic systems remove many pollutants and provide some measure of protection for human health and for the environment. However, even properly functioning septic systems pose a potential impact to nearby surface waters and groundwater, contributing a substantial source of nutrient loads in some settings (EPA, 2008). All continuously operated septic systems are expected to discharge to

Upper Granite Creek Watershed Improvement Plan, August 2012 19
groundwater eventually. It is estimated that 20 – 25% of septic systems nationwide are not operating as designed, and are failing (USEPA 2008a). Nitrate, a highly soluble chemical, is the primary constituent that septic systems contribute to groundwater. Microbial action in soil or water decomposes wastes containing organic nitrogen into ammonia, which is then oxidized to nitrite and nitrate. Because nitrite is easily oxidized to nitrate, nitrate is the compound predominantly found in groundwater and surface waters. It is a reasonable estimate that a septic system discharges a total load of 19 lbs. /year of nitrate and 0.4 lbs. /year of orthophosphate (Tri‐State Water Quality Council, 2005). While the impact to local surface waters by septic systems is unknown, it is a rough estimate that there are 166 residential parcels outside of the municipal sewer infrastructure (parcels likely to have one or more septic systems) that are within the 100‐year floodplain. Due to their proximity to the creeks and higher groundwater levels, the potential water quality impact from these systems—properly functioning or not—is increased.
Water Reuse (Treated Effluent and Gray Water)
Water reuse is an important conservation measure in arid regions where groundwater and drinking water supplies are limited. However, there are potential environmental and public health risks to its use, if not properly managed. Over‐application or application of treated effluent or gray water prior to a rain event may result in runoff to the nearest surface water or groundwater contamination. Municipal wastewater effluent is purchased from the City of Prescott by local golf courses for irrigating turf. Golf courses within the project area encompass 55 acres. The effluent produced by the Sundog Wastewater Treatment Plant is a grade B+, meaning that nitrogen management is not a condition of its reuse (ADEQ, 2012). Effluent produced at the new Airport Water Reclamation Facility, expected to go online in 2014, will be grade A+. This grade indicates that the concentration of Total Nitrogen is less than 10 mg/l. Even though the effluent used today has been treated, there may be salts, nutrients, metals, synthetic organic chemicals and certain long‐lived pathogens that remain in the water after treatment. Gray water is residential wastewater collected from clothes washers, bathtubs, showers, and laundry or bathroom sinks (ADEQb) and piped to a storage tank for later outdoor watering use, generally non‐edible landscape plants. As its name connotes, gray water is of lesser quality than potable water, but of higher quality than black water (from toilets). If properly collected and stored, it can be safely re‐used, thereby reducing fresh water consumption. Reuse of gray water can also reduce the load on septic tanks and leach fields. While there are many benefits to gray water use, it may contain food particles, detergent or soap residue, and possibly some human pathogens. In Arizona, gray water use at the private, residential level requires a Type 1 Reclaimed Water General Permit for Gray Water for less than 400 gallons per day.

Upper Granite Creek Watershed Improvement Plan, August 2012 20
Horses, Cattle, and Other Livestock
Five acres within the project area are zoned for horses or boarding stables. There are no grazing leases on national forest land within the project area, nor are there any Confined Animal Feeding Operations (CAFOs). The only known grazing within the project area is on Yavapai‐Prescott Indian Tribe (YPIT) property as well as on private and State Trust Lands off of Prescott Lakes Parkway east of Highway 89. YPIT encompasses roughly two miles along Granite Creek and a quarter‐mile segment of the North Fork of Granite Creek. YPIT land spans Highway 89 just north of the interchange with Highway 69. The tribe grazes a small herd of cattle (maximum 30 head) for a few weeks out of the year in pastures along Granite Creek. Other cattle that may exist within the project area are most likely individual, backyard animals. Numerous residents of the Upper Granite Creek Watershed keep animals on their property. Large livestock animals include a few hundred horses and probably no more than a few dozen cattle. In addition, backyard livestock animals may include chickens, ducks, geese, turkeys, sheep, goats and pigs. Livestock can have detrimental impacts to stream ecosystems if not managed properly. Livestock that are allowed access to a stream can destroy riparian vegetation, compact the soil, and cause bank erosion. Livestock waste can have serious water quality impacts, as well. Manure can contain bacteria, parasites, and nutrients. Pathogens may be present that can cause gastrointestinal illness, posing a public health risk. Excess nutrients from manure input can foster rapid algae growth that is unsightly and will eventually lead to lower dissolved oxygen levels when the algae die and decompose. Proper management of animal waste can be done through implementing Best Management Practices (BMPs), which are land management practices meant to reduce or prevent runoff of pollutants to waterways.
Wildlife
The upper Granite Creek Watershed provides suitable habitat for a range of wildlife species. The non‐urbanized areas of the watershed are comprised of ponderosa pine and mixed conifer forests, pinyon‐juniper woodlands, and interior chaparral. The area is home to known populations of mountain lion, bobcat, mule deer, tassel‐eared squirrel and other mammal species. The pine forests of the upper watershed provide habitat for wild turkeys and a host of other avian species. Federally protected species known or suspected to occur in the watershed include bald eagles (known winter roosts at Goldwater Reservoir), American peregrine falcons (known to nest at Thumb Butte), and Mexican spotted owls (the watershed includes designated critical habitat).
Above: A horse corral along Banning Creek.

Upper Granite Creek Watershed Improvement Plan, August 2012 21
Due to the proximity of residential areas to the national forest, wildlife sightings in town are common. Skunks, raccoons, and javelina are common wildlife species in and around town and are drawn to scavenging in gardens, compost piles, and garbage. Wildlife scat could be a significant contributor of nutrients and bacteria in local creeks, especially if their presence is encouraged by human activities.
Pets
Research shows that a significant source of bacterial contamination in urban watersheds can be attributed to non‐human waste—in some cases up to 95% of bacteria being from non‐human origins (Alderserio, 1996; Trial, 1993). In urban watersheds, a likely culprit is pet waste in stormwater runoff. Every time it rains, pet waste in yards, parks, or on sidewalks washes down storm drains and into streams, rivers and lakes. If not disposed of properly, pet waste flows directly into nearby streams and creeks without being treated at wastewater treatment facilities. When pet waste is washed into lakes or streams the waste decays, using up oxygen and sometimes releasing ammonia. Low oxygen levels and ammonia combined with warm temperatures can kill fish. Pet waste also contains nutrients that encourage weed and algae growth. Overly fertile water becomes cloudy and green – unattractive for swimming, boating and fishing. Perhaps most importantly, pet waste carries diseases which make water unsafe for swimming or drinking. Domestic dogs and cats are the most commonly kept animals in the Upper Granite Creek Watershed. Dogs are commonly walked at parks and trails within the watershed, including the Greenways Trail System and West Granite Creek Park in downtown Prescott, as well as at numerous recreation areas within the city and Prescott National Forest. There are several dog boarding and veterinary facilities located near creeks, with one facility actually spanning a creek. The waste collection practices of these facilities are not known. The Willow Creek Dog
Park, the only designated dog park in Prescott, is outside of the WIP project area.
Fire
Fire plays an important role in the Upper Granite Creek watershed. The predominant vegetation types
Above: Javelina are a common sight in yards in and around Prescott.
Above: Our beloved pets can be water quality nuisances, if their waste is not properly disposed of.
Above: The haze from a fire in School House Gulch hangs in the air.

Upper Granite Creek Watershed Improvement Plan, August 2012 22
in the upper portions of the watershed are ponderosa pine forest and interior chaparral, both of which are fire adapted ecosystems. In 2002, the Indian Fire burned more than thirteen hundred acres just south of the city of Prescott, in the southern portion of the watershed. This human caused wildfire burned with high severity and created a lasting impact on the vegetation and watershed condition. As a result, burned areas were treated by the Prescott National Forest to prevent catastrophic flooding and possible loss of life and property in post burn precipitation events. Treatments included aerial seeding, broadcast mulching (hydro‐mulch), contour tree felling, straw bale check dams, and roadwork. In the time since the fire, vegetation in the burned area has regenerated, and the area currently supports chaparral species, oak trees and a healthy grass component. Numerous other wildfires have occurred in the upper watershed over the past decade, though all have been smaller in scale than the Indian Fire. Prescribed fire also plays an integral role in the upper watershed. Approximately 40% of the project area is managed by the Prescott National Forest. Given the proximity of this forested land to the adjacent and imbedded private property, a major goal of the Prescott National Forest is the reduction and treatment of fuels. Prescribed fire (planned ignitions) occurs throughout much of the USFS lands within the project area. Areas of treatment are burned on a recurring basis with an objective of reducing hazardous fuel loading in areas near private property, and restoring fire to its natural role in the ecosystem. The Prescott National Forest takes every precaution to protect creeks and riparian areas from directly receiving ignition while still reducing fuel buildup; however fires, both wild and prescribed, are likely to have a water quality impact in the watershed. Fires can have both positive and negative effects on the physical, chemical, and biological components of aquatic systems (Forest Encyclopedia Network, 2010). The effects of a fire on water quality depend on the size of the fire, intensity, and severity of the burn. Fires have the potential to increase stream nutrients, particularly nitrate and phosphorus. Nitrate, a highly mobile ion, is at risk of leaching from the burned area. Phosphorus, which readily binds to sediments, is more likely to be transported to a nearby water body through soil erosion; the rate at which soil erosion occurs post‐burn depends on how much ground cover was burned and the surrounding topography. Fires may also increase stream temperature, which in turn will reduce the dissolved oxygen level.
Impervious Cover and Stormwater
Impervious cover in the project area is 5,310 acres or 18.6% (Fig. 6). Impervious surfaces, or hardscapes such as asphalt, concrete, and rooftops, do not allow water to infiltrate the ground. When it rains, or when snow melts, the runoff moves quickly over these surfaces, picking up contaminants and depositing them into receiving water ways. Alteration of the natural landscape with impervious surfaces also increases the volume and velocity of runoff and peak flow, increasing problems with flooding and erosion in streams and washes (Clarke and Stoner, 2001).

Upper Granite Creek Watershed Improvement Plan, August 2012 23
Above: Stormwater from a road drains directly into Butte Creek.
Science generally agrees that impacts on water quality are relatively minimal as long as impervious cover in a subwatershed stays below 10%. Around 10%, water quality and creek health will show signs of stress, and beyond 10%, severe degradation begins to occur (USEPA; CWP, 2003). A subwatershed with 10 – 25% impervious cover is classified as a “degraded” or “impacted” system (USEPA, 2008). Any stream’s watershed having greater than 25% impervious cover is classified as a “non‐supporting” water body with characteristics such as eroding banks, poor biological diversity, and high bacteria levels. Additionally, research shows that annual phosphorus, nitrogen, chemical oxygen demand, and metal loads increase in direct proportion with increasing impervious area (USEPA). Impervious cover in all but the headwater subwatersheds are well above 10% ‐ in some cases over 50% ‐ indicating serious degradation in most of the Upper Granite Creek Watershed. While impervious cover and stormwater are not direct pollutants, they play a well‐recognized role in the degradation of water quality (CWP, 2009; Reese, 2009). Different schools of thought, such as Volume‐Based Hydrology (VBH), have developed around the concept of runoff volume as something to mitigate and manage in order to improve or protect water quality. As in other urban watersheds, the Granite Creek Watershed faces challenges to managing stormwater and the nutrients and bacteria transported in stormwater. Both the City of Prescott and Yavapai County are MS4 entities, meaning that their stormwater system is separate from a municipal sewer system. Stormwater is not treated before it is directly discharged into the nearest waterway through ditches, scuppers, drainpipes, concrete slides and other features (City of Prescottb). With a portion of the Upper Granite Creek Watershed being urbanized, existing riparian vegetation and topography often have been altered, graded, or paved, removing natural detention, filtration/infiltration functions. In total, Prescott has 400 miles of streets and storm sewers.

Upper Granite Creek Watershed Improvement Plan, August 2012 24
Figure 6: Impervious Cover in the Upper Granite Creek Watershed
Impervious cover within the Upper Granite Creek Watershed is estimated at 18.6%. This figure demonstrates that impervious cover is primarily clustered in the urban, developed areas of the watershed. Impervious surfaces are hardscapes such as asphalt, concrete, and rooftops that impede natural infiltration. Even low levels of imperviousness can have detrimental impacts to stream health.
Recreation
There is a significant amount of recreation within the watershed, from the Greenways Trail System downtown to the Prescott National Forest’s system of motorized and non‐motorized trails. There are recreation sites, dispersed camping areas, and numerous summer camps in the upper watershed. Lack of adequate restroom facilities and poor sanitation practices by recreationists (swimmers, boaters, campers, hikers, etc.) can introduce human waste and, therefore, E. coli bacteria and other pathogens, into waterways. The risk to water quality increases with heavier use and proximity to a waterway. ADEQ studies along Oak Creek, a popular recreation area in central Arizona, determined that recreation was a human source of E. coli more so than a source of nutrients. Oak Creek is currently impaired for E. coli bacteria; the 1999 TMDL analysis determined that there were no nitrogen or phosphorus impairments within the Oak Creek

Upper Granite Creek Watershed Improvement Plan, August 2012 25
watershed (ADEQ, 2010). For the purposes of this project, recreation is considered a source of E. coli, not nutrients.
Environmental and Health Risks
Algal Blooms
Every summer, hot weather and low water levels in Watson Lake result in the prolific growth of algae and aquatic plants. These blooms are unsightly and hinder recreational opportunities on the lake. Additionally, certain types of algae pose a health risk to humans and wildlife (see “fish kill” below). The condition of the lake has drawn the scrutiny of the public and elected officials and was the focus of a series of articles printed in The Daily Courier in the summer of 2010:
Algae creates nuisance on Watson and Willow Lakes, 7/5/2010
Solution for lakes starts upstream (Editorial), 7/11/2010
Lake algae on Tuesday agenda for Prescott City Council; solutions range from weed harvesting to added fee, 7/11/2010
Prescott Council looks at solutions for water quality issues in Willow, Watson Lakes, 7/13/2010
Fish Kill
A fish kill occurred in Watson Lake in July 6, 2000. The kill consisted entirely of Golden shiner (Notemiqonus crysoleucus) (AZGFD, 2009). There was an algal bloom, identified as Aphanizomenon, occurring during the kill, high pH between 9.5 ‐ 9.8, and chlorophyll‐a levels were 10 to 15 times higher than typical for the summer (AZGFD, 2009; ADEQa, 2004; Civiltech Engineering, 2009). Aphanizomenon is a type of algae from a genus that causes nuisance algal blooms and can produce a toxin that can kill fish. This type of algae is normally associated with lakes that have a high pH and elevated nutrient levels (AZGFD, 2009). Fish kills can also occur as a result of low dissolved oxygen. Excess nutrients can fuel the growth of algae and aquatic plants; when the vegetation decays oxygen is consumed, resulting in low dissolved oxygen levels.
Recreation
Watson and Willow Lakes are touted gems of the Prescott area that attract recreationists and tourists from across the state and beyond. As mentioned above, the growth of algae and aquatic plants can hinder recreational opportunities on the lakes for boating, fishing, wildlife viewing, and sight‐seeing. Bacteria in surface runoff may make waters unsafe for fishing, boating, and other forms of water‐based recreation. When E. coli exceeds the permissible level
Above: Filamentous green algae below the surface of Watson Lake.

Upper Granite Creek Watershed Improvement Plan, August 2012 26
for safe recreation, it may result in the closing of beaches, ponds, lakes, swimming and fishing beaches to public use.
Public Health
E. coli bacteria are a member of a group of organisms known as coliforms, commonly found in the intestinal tract of warm blooded animals. Fecal coliform bacteria may occur in ambient water as a result of domestic sewage contamination or nonpoint sources of human and animal waste. Bacteria and pathogens are nearly always present in high concentrations in urban surface runoff (Clarke and Stoner, 2001). The presence of E.coli bacteria in aquatic environments indicates that the water has been contaminated with the fecal material of man or other animals. This organism is not generally a concern to human health as there are only a few strains that cause serious disease in humans (Lewis, 2010). However, the presence of E.coli is an indicator that the source water may have also been contaminated by more harmful microbes such as Cryptosporidium, Giardia, Shigella, and Norovirus and that a potential health risk exists for individuals exposed to this water. Diseases acquired from contact with contaminated water can cause gastrointestinal illness, skin, ear, respiratory, eye, neurologic, and wound infections. The most commonly reported symptoms are stomach cramps, diarrhea, nausea, vomiting, and low‐grade fever (Lewis, 2010). The USEPA’s recreational water quality standard for E. coli is 235 Colony‐Forming Units (CFU) per 100 milliliters. This standard corresponds to approximately eight incidences of gastrointestinal illness per 1000 swimmers.
In response to the expected E. coli impairment listing for Granite Creek, a partnership with the Yavapai County Public Health Department should be pursued to educate the public about the public health implications of NPS and how the public can protect themselves from the public health risks of aquatic microbes.
Past Water Quality Improvement Projects and BMPs
Below is a list of water quality improvement and BMP projects that Prescott Creeks and WIC partner organizations have undertaken within the watershed. A map of project sites is shown in Fig. 7. 1. Granite Creek Cleanup, ca. 1989‐2012 Project goal(s): To engage the community in beautifying their local creeks by removing trash from the riparian habitat that is harmful to native riparian wildlife and vegetation Accomplishments: 3.4 to 10 tons of waste removed annually; 300 – 500 volunteers per year Pollutants of concern: Debris, petrochemicals, and nutrients Implemented by: Prescott Creeks Funded by: Community and corporate sponsors Project cost: Approximately $4,000 per year

Upper Granite Creek Watershed Improvement Plan, August 2012 27
2. Yavapai Reservation Slaughterhouse Gulch wetland restoration, 2000 Project goal(s): to restore wetland habitat along Granite Creek, an impaired waterway Accomplishments: 40 acres restored; 4,800 trees and native vegetation planted Pollutants of concern: urban stormwater (nitrogen, phosphorus, metals, bacteria) and sediments Implementation by: Yavapai‐Prescott Indian Tribe Funded by: EPA Project cost: $88,000
3. Creek Signing Project (Phase I), 2000 Project goal(s): Increase public awareness regarding existence of creeks, creeks names and number of road crossings Accomplishments: Approximately 80 signs installed at roads crossing streams Pollutants of concern: N/A Implemented by: Initiated by Prescott Creeks and implemented by City of Prescott Funded by: Prescott Creeks (private donations) and City of Prescott Project cost: Approximately $3,000
4. Creek Signing Project (Phase II), 2001 Project goal(s): Increase public awareness regarding existence of creeks, creeks names and number of road crossings Accomplishments: Approximately 20 signs installed at roads crossing streams Pollutants of concern: N/A Implemented by: Initiated by Prescott Creeks and implemented by Yavapai County and Prescott Creeks’ volunteers Funded by: Yavapai County Community Foundation, JA McDougal Fund for the Environment Project cost: Approximately $750
5. Watershed Posters, 2004‐present Project goal(s): Increase public awareness regarding watershed concept and boundary, origin of creek names, existence of creeks, creeks names and number of road crossings Accomplishments: Approximately 5000 map/posters printed Pollutants of concern: N/A Implemented by: Prescott Creeks Funded by: Yavapai County Community Foundation Fund for the Environment; sponsoring contributions also from Kiwanis Club of Prescott, Prescott Unified School District, City of Prescott Keep Prescott Beautiful Committee, and Sharlot Hall Museum Project Cost: Approximately $5,000 (included graphic design and printing)
6. Stormwater Detention Basin, Prescott Lakes Parkway, 2007

Upper Granite Creek Watershed Improvement Plan, August 2012 28
Project goal(s): To manage runoff from a recently constructed four‐lane roadway that drains into Granite Creek and Watson Lake, both impaired waterways Accomplishments: Constructed basin encompassing approximately four acres; planted 200 trees Pollutant concern: Urban stormwater (nitrogen, phosphorus, metals, bacteria) and sediment from erosion Implementation by: Prescott Creeks Funded by: ADEQ 319 grant Project cost: $123,000
7. Storm Drain Markers, 2007 Project goal(s): To educate the public about stormwater pollution and the connection to surface water quality of local water bodies; to discourage illicit dumping and littering Accomplishments: Approximately 1,000 children reached through education efforts while developing design, 400 storm drain markers produced, approximately 200 markers placed (remainder with City of Prescott to replace when current ones go missing) Pollutants of concern: Urban stormwater (nitrogen, phosphorus, metals, bacteria) Implemented by: Prescott Creeks and City of Prescott Funded by: ADEQ 319 grant Project cost: $15,000 8. Watson Woods Riparian Preserve Restoration, 2008‐current Project goal(s): to restore 126 acres of floodplain and a one‐mile stretch of Granite Creek, currently listed as impaired. Accomplishments: Four reaches realigned; 23,000 native trees (primarily cottonwoods/willows) planted since 1992; six ephemeral wetlands constructed Pollutants of concern: Urban stormwater (nitrogen, phosphorus, metals, bacteria) and sediment from erosion Implementation by: Prescott Creeks Funded by: ADEQ 319 and Arizona Water Protection Fund grants Project cost: $1.4 million 9. Manure Management Brochure, ca. 2008 Project goal(s): To educate property owners about water quality impacts of manure and proper manure management Accomplishments: 1,000 brochures printed. Pollutants of concern: Nutrient and bacteria input to the creeks through manure Implemented by: Prescott Creeks. Distributed through ADEQ, Arizona Water Protection Fund, NEMO, and Yavapai County Cooperative Extension. Funded by: ADEQ 319 grant Project cost: $7,000 10. Yavapai County Stormwater Quality Improvement Project at Pioneer Park, 2009

Upper Granite Creek Watershed Improvement Plan, August 2012 29
Project goal(s): To construct a 24‐acre demonstration project that removes pollutants from stormwater that discharges into Granite Creek, an impaired waterway, and to recharge the Prescott aquifer with clean water Accomplishments: Construction of detention basins, channel filtration trenches, and vegetation improvements to slow down, filter and remove solids and oils from the first‐flush; slopes terraced, rip‐rapped and landscaped to prevent further erosion; public education, outreach and partnership program on site with information signs, and kiosks Pollutants of concern: Urban stormwater (nitrogen, phosphorus, metals, bacteria) and sediment from erosion Implementation by: Yavapai County Flood Control District Funded by: ADEQ 319 grant Project cost: $620,000 11. Rambling River (originally funded as: From Education to Action in the Granite Creek
Watershed), 2009 Project goal(s): Educate community members through active participation in BMP implementation at Watson Woods Riparian Preserve and through interaction with a stream‐table/watershed model Accomplishments: Design and construction of Rambling River ‐ a trailer‐mounted, mobile, interactive stream‐table/watershed model Pollutants of concern: N/A Implemented by: Prescott Creeks Funded by: ADEQ Water Quality Improvement Education grant Project cost: $67,875.50
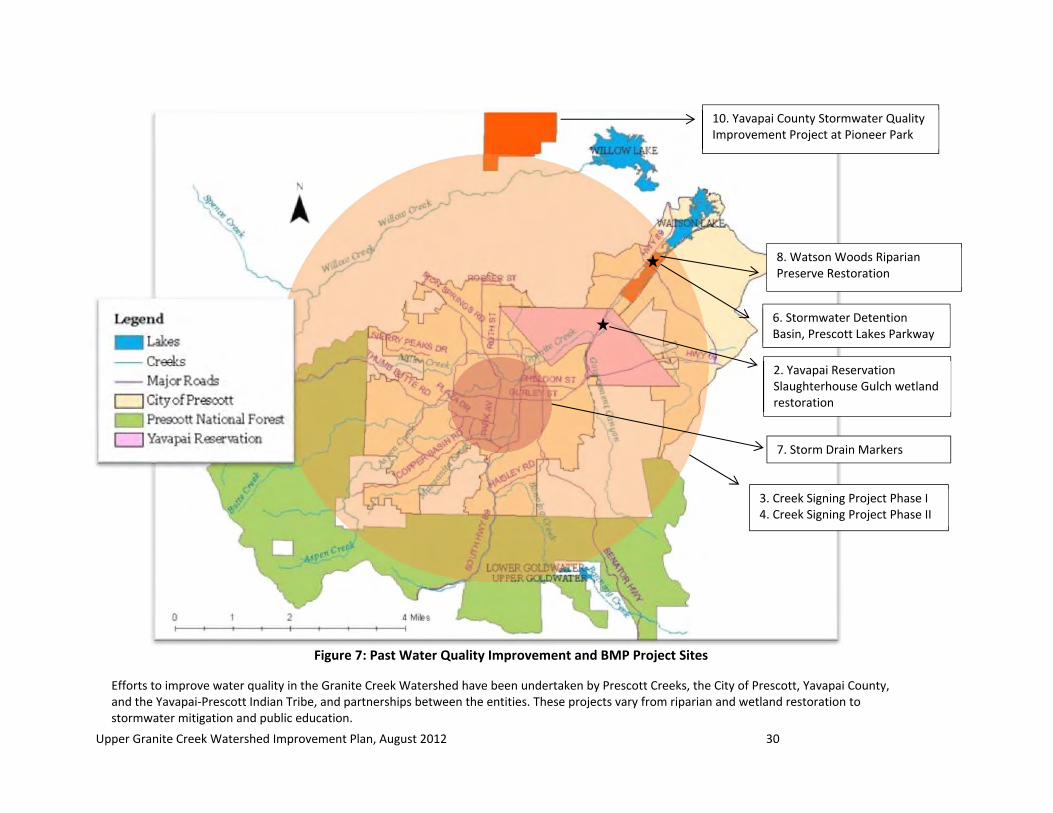
Upper Granite Creek Watershed Improvement Plan, August 2012 30
Figure 7: Past Water Quality Improvement and BMP Project Sites
Efforts to improve water quality in the Granite Creek Watershed have been undertaken by Prescott Creeks, the City of Prescott, Yavapai County, and the Yavapai‐Prescott Indian Tribe, and partnerships between the entities. These projects vary from riparian and wetland restoration to stormwater mitigation and public education.
3. Creek Signing Project Phase I4. Creek Signing Project Phase II
7. Storm Drain Markers
6. Stormwater Detention Basin, Prescott Lakes Parkway
8. Watson Woods Riparian Preserve Restoration
2. Yavapai Reservation Slaughterhouse Gulch wetland restoration
10. Yavapai County Stormwater Quality Improvement Project at Pioneer Park

Upper Granite Creek Watershed Improvement Plan 31
General Permit BMPs Applied in Watershed
This document has previously detailed that stormwater carries pollutants from streets, parking lots, and roofs into water bodies. Amendments to the CWA in 1987 defined a process for controlling municipal and industrial stormwater pollution in two phases (Killam, G. 2005). In the early 1990’s, Phase I required cities, or Municipal Separate Stormwater Sewer System (MS4s), with populations over 100,000 to obtain a permit through the National Pollutant Discharge Elimination System (NPDES). Phase II followed in 2003, requiring MS4 communities with “urbanized areas” or populations over 50,000 to obtain a permit. The permit requires MS4s to develop and implement storm water management plans to reduce pollutant loadings to the maximum extent practicable. In Arizona, ADEQ is the NPDES permitting authority. Most stormwater discharges are considered point sources and require a NPDES permit. Yavapai County, the City of Prescott, and Arizona Department of Transportation (ADOT) each have an Arizona Pollutant Discharge Elimination System (AZPDES) permit for stormwater discharges. Yavapai County and the City of Prescott both operate under the Phase II MS4 General Permits while ADOT was issued an Individual Permit. However, activities to mitigate stormwater runoff that are not specifically required by a draft for final AZPDES permit may still be eligible for nonpoint source grant funding under Section 319(h) of the Clean Water Act. The December 8, 1999 stormwater phase II rule requires operators of small Municipal Separate Storm Sewer Systems (MS4s) in urbanized areas to develop and implement a stormwater management program that addresses six minimum control measures:
1. Public Education and Outreach 2. Public Participation/Involvement 3. Illicit Discharges Detection and Elimination 4. Construction Site Stormwater Runoff Control 5. Minimum Control Measures for Post Construction Stormwater Management in New
Development and Redevelopment 6. Pollution Prevention/Good Housekeeping for Municipal Operation
Yavapai County
Yavapai County has been operating under the AZPDES General Permit since 2003 and has satisfied the requirements of the six control measures. For more information on Yavapai County’s Stormwater Management Program contact: Yavapai County Flood Control District 500 South Marina Street Phone: (928) 771‐3197 Flood Status/Message Line: (928) 771‐3196

Upper Granite Creek Watershed Improvement Plan 32
City of Prescott
The City of Prescott has been operating under the National Pollutant Discharge Elimination System’s General Permit since 2003 and has satisfied the requirements of the six control measures. For more information on the City of Prescott’s Stormwater Management Plan contact: Stormwater Management 430 North Virginia Street, Prescott, AZ 86301 Phone: 928‐777‐1140 Illicit Discharge: 928‐777‐1140 (business hours, from 7:00 a.m. to 3:30 p.m.) 928‐445‐5357 (non‐business hours)
Arizona Department of Transportation
The Individual Stormwater Permit, issued in September of 2008, recognizes ADOT’s unique qualities as a Municipal Stormwater Separated Sewer System (MS4) because its primary activities resemble those of a municipality, an industry, and a construction site operator on a statewide basis. For more information on ADOT Prescott District’s Stormwater Management contact: Prescott District Environmental Coordinator 1109 East Commerce Drive Phone: (928) 777‐5966 Or ADOT Statewide Water Quality Manager 1611 West Jackson Street Phoenix, AZ Phone: (602) 712‐8353

Upper Granite Creek Watershed Improvement Plan 33
CHAPTER 2: WATERSHED INVESTIGATIONS AND FINDINGS In order to better understand the condition of the Upper Granite Creek Watershed and identify sources of excess nutrients and bacteria causing water quality impairments, efforts were undertaken as part of the WIP process to collect various types of data. These efforts included water quality monitoring, a riparian buffer assessment, watershed field survey, and a social survey of watershed residents. Each dataset was analyzed individually for what it reveals about the condition of the watershed; the datasets were then combined and analyzed for a more comprehensive analysis of the watershed. The sections below describe each data collection effort and the analysis and findings of the associated dataset.
WATER QUALITY MONITORING
A volunteer water quality monitoring program was initiated in 2010 to address gaps in existing water quality data. Monitoring consisted of physical parameters like pH, dissolved oxygen, and temperature; chemical parameters like Total Nitrogen, Total Phosphorus, TKN, and Ammonia; and biological parameters like E. coli and Bacteroides. Targeted monitoring in 2011‐2012 focused on E. coli, Bacteroides, and included testing for pharmaceuticals with the Arizona Lab for Emerging Contaminants (ALEC). Local “Creek Crew” volunteers received training in the collection and handling of field data and water samples during a day‐long event with the Sierra Club Water Sentinels on January 31, 2010. Nearly 40 people attended the event.
Nutrients and Bacteria
The Creek Crew conducted water quality monitoring primarily during winter and spring months to gather data on nutrient and bacteria concentrations. One monitoring event occurred during the monsoon season. Monitoring that occurred in 2011‐2012 was targeted on bacteria sampling only. Creek Crew monitoring events occurred on:
December 15, 2009
February 11, 2010
March 8, 2010
April 12, 2010
August 2, 2010
December 7, 2011
December 20, 2011
April 17, 2012 In addition to Creek Crew data, ADEQ water quality data from 2000‐2011 was included in this analysis.

Upper Granite Creek Watershed Improvement Plan 34
Data Summary
1. Levels of nutrients (nitrogen and phosphorus) and E. coli exceed state water quality standards during high stream flow and runoff from precipitation. Exceedances are rare during low flow or as the creeks dry out in the spring.
2. Low dissolved oxygen levels in Granite Creek (originally believed to indicate nutrient loading) occur only during lower flows – not when nutrients or bacteria exceeded standards. Low dissolved oxygen is likely related either to natural groundwater upwelling and/or stagnant pools as the stream flows dry to a trickle.
3. Exceedances of state water quality standards during high stream flows seem to indicate that the nutrients and bacteria are the result of many sources. These pollutants are washed into the streams with stormwater runoff from roofs, streets, parking areas, dog droppings, horse corrals, gardens, yard trimmings dumped along the stream banks, etc. Stormwater transports these pollutants to the nearest waterway. Impervious cover within the watershed generates a greater volume of stormwater runoff, compounding the problem. Stormwater inundating aging sewer lines may also be a source.
4. High nutrient and bacteria levels during runoff events may indicate that riparian areas along the creeks are not functioning properly because they should intercept surface flow and filter out pollutants. This may be due to degraded riparian condition and also because hard (impervious) surfaces and engineering have routed stormwater directly into the stream, thereby avoiding the natural riparian filters.
5. E. coli exceedances have occurred during at least one stormwater runoff event when aging wastewater sewer lines became inundated with floodwater and overflowed with untreated sewage into the creeks.
6. Bacterial pollution is more widespread in the watershed than nutrient pollution based on the number of samples exceeding water quality standards. Assessing only samples taken during critical conditions (high flow) and looking at sites with at least four samples during these conditions, standards were exceeded at more than 25% of the samples:
a. For nutrients, at three sampling sites: lower Manzanita (MAN007), lower Aspen (ASP040), and upper Granite (GRA811). Upper Granite’s status is most likely due to excess nutrients from the 2002 Indian Fire. The most recent monitoring does not show nutrients to be a continuing issue at that site.
b. For E. coli, at eight sites: lower Manzanita (MAN007), lower Aspen (ASP040), lower Butte (BUT005), Miller above Butte (MIL038), lower North Fork Granite (NFG025), Granite at Granite Creek Park (GRA350), Granite at Industrial Way (GRA135), and Granite at Watson Woods (GRA063).
Analysis of Creek Segments
An analysis was undertaken to determine which creek segments exhibit spikes in nutrient or bacteria concentrations by averaging the water quality measurement collected by ADEQ, Prescott Creeks, and the City of Prescott. These measurements were collected at different times before, during, and after storm events throughout the wet season, resulting in a variable dataset. Therefore, sampling sites were grouped into segments, and sampling data for those

Upper Granite Creek Watershed Improvement Plan 35
sites averaged. This grouping/averaging allowed for differences in runoff, flow conditions, and sampling frequency to be accounted for and reflected in the analysis. The segments were defined as Outlying, Residential, and Urban to reflect the increase in measured pollutants as well as land use changes. Sequential sampling sites are grouped into segments based on their location along the creek, such as in Outlying areas (PNF and unincorporated areas), through Residential neighborhoods, and finally to Urban areas with more dense and mixed land uses. These groupings by geographic location and land use also reflect potential pollution sources as the creeks flow from mountain forest areas with wildlife and recreation, to lightly‐populated but non‐sewered areas with livestock, to more densely populated neighborhoods with greater impervious surfaces, and finally urban areas with mixed commercial, light industrial, and residential land uses. This allows for more accurate assessment with greater numbers of measurements over years and storm seasons, and for land use changes along the creeks. The grouping and averaging also demonstrates how pollutants accumulate in creeks as they flow downstream. For both E. coli and Total Nitrogen concentrations, the averaged value of measurements was expected to increase reflecting accumulation of NPS from upstream to downstream. Averaging methods varied depending on the pollutant. Bacteria concentrations varied drastically depending on when, during a storm, the sample was collected. Averaging values from 50 to 1000 CFUs can be made more representative with a geometric mean, and the water quality standard for E. coli of 235 CFUs/100ml (for a single sample), 129 CFUs/100ml for a geometric mean, is then central to that scale. Values of 2400 CFU/100ml represent a distortion of averaging, and thus were excluded as outlying values which would undermine attempts to assess accumulation of bacteria pollution across reaches and sectors. Overall, Total Nitrogen concentrations seem to elevate in the residential areas, whereas E. coli concentrations increase in urban areas, although there is some overlap between residential and urban reaches (Fig. 8, 9). See Appendix A for data tables.

Upper Granite Creek Watershed Improvement Plan 36
Figure 8: Reaches with High Total Nitrogen Concentrations
An analysis that averaged concentrations across reaches and varying land uses revealed that higher concentrations are primarily found in residential creek uses rather than outlying or urban areas. Some of these areas are unsewered and zoned for livestock.

Upper Granite Creek Watershed Improvement Plan 37
Figure 9: Reaches with High E. coli Concentrations
An analysis that averaged concentrations across reaches and varying land uses revealed that higher concentrations are primarily found in urban creek reaches rather than residential or outlying areas. Urban areas are characterized by having mixed land uses and a high degree of impervious cover.

Upper Granite Creek Watershed Improvement Plan 38
Recommendations for Future Monitoring
After compiling state data and volunteer data, we have concluded that further monitoring for these pollutants should be conducted during “critical conditions” – conditions or activities in the watershed when past exceedances occurred. The data indicates that critical conditions occur during winter months when precipitation events are more widespread and tend to linger, as opposed to the localized, “flashy” monsoon events. Winter precipitation events are more likely to result in sustained flows in the creeks. When possible, sampling should also be targeted above and below potential sources or along a creek to try to identify sources. Sampling the “first flush” ”— the first few hours of precipitation that washes over surfaces (streets and rooftops) — yields misleading results for the purposes of this project. The first flush consists of highly turbid, flood waters contaminated with sediment, bacteria, and nutrients; these samples will normally exceed standards for only a short period of time and are not helpful in identifying the sources of these pollutants. Therefore, regular storm fronts such as Prescott’s winter rains produce ideal conditions for monitoring.
Microbial Source Tracking
In addition to E. coli testing, the University of Arizona has been employing molecular methods to detect the presence of host‐specific strains of Bacteroides in order to discriminate between human, bovine, and other sources of fecal bacteria. Bacteria belonging to the genus Bacteroides have been suggested as alternative fecal indicators to E. coli or fecal coliform. This is due to the fact that they make up a significant portion of the fecal bacteria population, have little potential for re‐growth in the environment (unlike E. coli), and have a high degree of host specificity that likely reflects differences in host animal digestive systems. The use of fecal bacteria to determine the host animal source of fecal contamination is based on the assumption that certain strains of fecal bacteria are associated with specific host animals and that strains from different host animals can be differentiated based on genotypic markers. The goal of the Bacteroides testing was to help discern where the bacteria in the watershed are coming from, with a specific interest in bacteria from human sources (i.e.; sewer infrastructure, septic systems). Both the sewer infrastructure and septic systems have long been suspected as contributing to water quality problems in the creeks and lakes. Prior to this investigation, no data was collected and this remained speculation. By identifying where sewer infrastructure or septic systems are failing, appropriate solutions can be designed and measures taken to alleviate the situation.
Above: The “first flush” results in black, murky water in local creeks.

Upper Granite Creek Watershed Improvement Plan 39
Data Summary and Findings
In addition to testing by the University of Arizona, the samples were analyzed at the USEPA National Risk Management Research Laboratory in October 2010 using a variety of different analyses, including those for avian, bovine, and swine molecular markers. The following markers have been used to assess water quality:
1) All – Total Bacteroides 4) All2 – Total Bacteroides 2) Hu – Human Bacteroides 5) Bov2 – Bovine Bacteroides 3) Bov – Bovine Bacteroides 6) Av – Avian Bacteroides
A total of 46 samples were collected across 23 sites across the watershed. Figure 10 displays the sites where these samples were collected. Ninety‐one percent of the samples collected within the project area were positive for the human genetic marker, meaning that human bacteria were present in those samples. Each sample was tested three times; the results are displayed as the number of times each of those three samples tested positive. If a sample tested positive each of the three times (3/3) it was tested, this is considered a “strong positive”; a sample that tested positive two out of three times (2/3) is considered “medium positive”; and samples that tested positive only one out of three (1/3) samples is considered a “weak positive.” Twenty‐two samples at 14 sites are considered to be strong positives. These samples were primary collected on lower reaches of tributaries and Granite Creek with the exception of a few that were collected on middle reaches. Seven samples at six sites are considered medium positives. Thirteen samples at ten sites are considered weak positives. Only four samples at three sites were negative for the human genetic marker. Of the samples collected for Bacteroides testing, only one tested positive for the bovine marker. This same sample was positive for the swine marker. This sample was collected in January 2010 from Granite Creek in the Watson Woods Riparian Preserve during a heavy winter storm. This site is downstream of the YPIT land where a small herd of cattle had been grazing in pastures near the creek. None of the samples were positive for the avian marker. MST has revealed that human fecal contamination of surface waters is widespread in the watershed. Samples that were a strong positive for the human genetic marker occur at sites in the lower, middle, and upper subwatersheds, although the majority occurs in the middle and lower reaches. These samples occur in both unsewered areas and areas connected to the municipal sewer system, and in varying types of development and land use. Therefore, no strong conclusion can be made regarding the source of human fecal contamination. More detail on the data can be found in Appendix B.

Upper Granite Creek Watershed Improvement Plan 40
Pharmaceuticals & Related Contaminants
During targeted monitoring in 2011‐2012, samples were collected for testing at ALEC at the University of Arizona. Testing focused on human‐health pharmaceuticals, artificial sweeteners, personal care products, and other emerging contaminants, presence of which would indicate sewer or septic pollution in surface waters. While there are no federal or state standards for the vast majority of these contaminants, a confirmation of wastewater inputs will allow the WIC to specifically address these issues with appropriate BMPs.
Figure 10: Bacteroides Sampling Locations
Water samples were collected at 23 sites around the watershed for molecular testing at a University of Arizona lab for host‐specific strains of bacteria from the genus Bacteroides. The sites were chosen to target potential sources of fecal contamination.

Upper Granite Creek Watershed Improvement Plan 41
Due to dry winter conditions, samples were not collected until April 2012. Thirteen samples were collected primarily at the confluence of tributaries with Granite Creek and at the border of nonsewered areas. A map of sampling locations can be found in Figure 11 below.
Figure 11: Sampling Locations for Pharmaceuticals & Related Contaminants
Samples were collected at 13 sites in April 2012 and sent to the Arizona Lab for Emerging Contaminants (ALEC) at the University of Arizona for testing for pharmaceuticals, personal care products, and related contaminants. This sampling was added to targeted water quality monitoring II to help identify sewer and septic contributions.
Data Summary and Findings
Before delving into the analysis, limitations inherent in this data should be considered. While the data is the first of its kind collected in the Prescott area and provides a snapshot of pharmaceuticals and related contaminants in Prescott’s surface waters in April 2012, sampling conditions were not considered ideal and only one sampling event was conducted. This data should be considered baseline and further sampling events, if conducted, will provide more in‐

Upper Granite Creek Watershed Improvement Plan 42
depth data and comparability. As there are no water quality standards for many emerging contaminants, there is no reference point to which the Prescott samples can be assessed. Leif Abrell at ALEC provided the interpretation below. Samples collected were tested for: Acesulfame K (artificial sweetener); Sucralose (artificial sweetener); Carbamazepine (pharmaceutical); Sulfamethoxole (pharmaceutical); Tonalide (fragrance); salicylic acid (used in beauty products); Perfluourinated Surfactant (PFO); Ibuprofen (analgesic); and Estrone (natural estrogen). Sucralose is an artificial sweetener with a chemical structure similar to saccharin that does not provide calories. Because the body does not metabolize it, it is excreted in urine without being changed. This artificial sweetener has recently been shown to be a widespread contaminant of wastewater, surface water, and groundwater, persisting despite chlorinated treatments (Mawhinney, Young, Vanderford, Borch, and Snyder, 2011). Sucralose was detected in relatively high concentrations from all samples except blanks. The sample collected at MAN1 was above the average for all sampling sites around Prescott, indicating a stronger anthropogenic influence at that site. Carbamazepine, an antiepileptic medicine, appeared to be present in high concentrations at sites along Butte and Manzanita Creeks – BUT1, BUT3, MAN1, and MAN2. The MIL5 sample also exhibited a strong signal. Sulfamethoxole, an antibiotic, appeared in strong concentrations in samples collected at MIL8, NFG1, and MAN1. Tonalide, a fragrance compound found in shampoos and other personal care products, had a similar geographic profile as sucralose, with MAN1 showing the highest concentration and NFG1 a close second. A combination test for Tonalide and other isobaric fragrances revealed that the sample collected at MAN1 contained much high concentrations than the other sites. Salicylic acid was found in almost equal concentrations in all samples; this data does not contribute to distinguishing geographic differences in anthropogenic influence on Prescott waters. Samples collected at MAN1 and MIL5 samples nearing the upper limit of detection. The persistent perflourinated surfactant molecule (PFOs), perflourocrane sulfonate, while not particularly associated with residential wastewater, was included to provide an environmental health outlook. In 2009, the EPA established a provisional health advisory of 0.2 micrograms per liter (μg/L; or 200 ppt), for PFOs to protect against the potential risk. Sources of PFOs into surface and ground waters are thought to be multivariate, including from industrial and manufacturing sites and storm runoff from roads and streets. In Prescott, water sample collection locations MAN3 and NFG1 show the highest amounts of PFOS, with sites BUT1, MAN1, MIL1, and NFG4 showing lower, but significant levels of PFOS > 10 ppt.

Upper Granite Creek Watershed Improvement Plan 43
Ibuprofen levels in all samples were measured in trace amounts; this analyte does not provide information about wastewater influences in the watershed. Estrone, a natural estrogenic hormone produced by mammalian females, was detected at, or below, the limit of detection in 64% of the samples. However, samples collected at MAN1 and MIL5 contained significantly higher concentrations. While these high concentrations are not generally in the concentration range to be considered a threat to aquatic life, the relative increase in concentrations at MAN1 and MIL5 indicate potential anthropogenic (residential wastewater, animal husbandry) effects on surface water.
Preliminary Conclusions
The emerging contaminant data resulting from a singular sampling event reveals a correlation with the Bacteroides sampling results, further supporting the supposition that Prescott’s surface waters are contaminated by wastewater. The level of contamination varies by geographic location in the watershed, surrounding land use, weather and flow patterns, and time of sampling event. Both the ALEC monitoring and MST testing reveal strong anthropogenic influences on lower Manzanita Creek, lower Butte Creek, North Fork of Granite Creek, and lower Miller Creek with the North Fork of Miller Creek possibly contributing significantly to water quality problems downstream. Data for the North Fork of Miller Creek to‐date is limited.
Recommendations
While this data may indicate wastewater sources in the watershed, it is not conclusive. The WIC recommends further monitoring of this nature under different flow and weather conditions to provide a comprehensive baseline.
WATERSHED FIELD SURVEY
To gather physical data about land uses and pollutant sources, a field survey of the Upper Granite Creek Watershed was conducted in 2010 by Prescott Creeks and the Granite Creek Watershed Improvement Council. Creek Crew volunteers walked 16.5 miles of stream in this watershed to systematically document potential sources and causes of excess nutrients and E. coli bacteria in Granite Creek and its tributaries.
Survey Methods
A field survey data form was developed to provide a consistent approach to documenting volunteer observations along the creeks. The design of the data form was based on watershed surveys in other parts of the country, but adapted to the specific conditions and pollutants of concern in the Granite Creek watershed. This was the first field survey of its type in Arizona. Creek Crew volunteers walked 16.5 creek miles in the Upper Granite Creek Watershed from March 27 to July 28, 2010, with nearly ¾ of the segments visited on March 27th during a full day training and field event. The field survey focused on the developed portion of the watershed

Upper Granite Creek Watershed Improvement Plan 44
within the City of Prescott and unincorporated Yavapai County jurisdictions. Because of the locations and lengths of creek within the developed areas, the mileage of each creek assessed was highly variable. The survey did not include segments in the Prescott National Forest. The survey also excluded a few urban segments as requested by land owners after a preliminary public notification by Prescott Creeks about the field survey. The drainage area covered by the field survey, stream segments assessed, urban areas, and all sites documented are illustrated in Figure 12. During the field survey event held on March 27, 2010, Creek Crew volunteers received training in local water quality issues, nonpoint source pollution, field survey protocols, and Global Positioning System (GPS) unit operation before assessing their assigned stream segments in small groups. The in‐class training portion of the event lasted for approximately three hours. After lunch, volunteers spent three to four hours in the field. Volunteers were assigned segments based on their familiarity with the area, physical ability, and access to transportation. Nearly 40 volunteers participated in the day‐long event.
Figure 12: Field Survey Area & Impact Sites

Upper Granite Creek Watershed Improvement Plan 45
The Upper Granite Creek Watershed Field Survey focused on the developed portion of the watershed within the City of Prescott and unincorporated Yavapai County. Drainage features, impacted riparian buffers, and other potential pollution sources were observed in the 16.5 miles of creek covered by the survey.
Source Categories For analysis purposes, the information collected can be grouped into the following three categories:
Stormwater drainage features – Pipes, ditches, and culverts are used in the watershed to directly convey stormwater discharges to the stream from roads, roofs, and parking lots
Impaired buffer –Buffer impairments within 30 feet of the stream were recorded in two sub‐categories:
o Structures built within the riparian area, such as: buildings, walls, roads, bridges, patios, sewer manholes
o Activities or land uses that might negatively impact riparian vegetation and stream bank stability: hiking paths, grazing, landscaping, animal corrals
Pollutant hot spots – The survey focused on identifying and documenting the following: o Wastewater sources: gray‐water discharges, sewer lines and manholes, and
leaking septic systems within the riparian area o Garbage and yard waste o Drainage from fertilized areas such as lawns, golf courses, gardens, and crop land o Disposal of pet wastes and drainage from animal corrals or grazing areas o Recreation or gathering areas without toilet facilities
Survey Analyses and Findings
Creek Crew volunteers walked along the creeks and recorded activities, drainage features, and structures in the stream channel or within about 30 feet of the stream. Although the survey width varied due to terrain and structures, the area immediately along the stream was the focus of this survey. Activities, structures and piped discharges within 30 to 50 feet of a creek were assumed to have the most likely impact on surface water quality or riparian vegetation.
Photos
Figures 13, 14 and 15 provide examples of the types of impacts documented by volunteers through the field survey by source category.

Upper Granite Creek Watershed Improvement Plan 46
Figure 13: Stormwater Drainage Features
Stormwater drainage features observed were pipes and culverts associated with the city and county stormwater infrastructure and also unofficial pipes and ditches draining roofs and properties.
Figure 14: Pollutant Hot Spots Pollutant hot spots were potential sources of nutrients and bacteria that were not a land use or activity within the buffer or associated with stormwater drainage. Examples of pollutant hot spots were household garbage/waste; tree and lawn trimmings; sewer lines and manholes; animal corrals or waste; and drainage from fertilized areas.
Figure 15: Buffer Impairments
Buffer impairments were recorded as any structure or land use/activity occurring within 30 feet of the creek. Common buffer impairments included roads and driveways; walls, fences, and buildings; debris and bank stabilization efforts.

Upper Granite Creek Watershed Improvement Plan 47
Data Limitations
Certain limitations are inherent in this data. A relatively large number of volunteers collected most of the data with only one morning of training. The ability to identify sources of nutrient and/or bacteria pollution and buffer impairments differed among the volunteers. Documentation of potential sources was also more difficult in older and more complex urban areas of town where multiple sources are embedded in the landscape. To mitigate such problems, the information collected was screened prior to data analyses to provide more consistency in documentation and to further focus on causes and sources of fecal bacteria and nutrient contamination. For example, sites where construction wastes (i.e.; concrete blocks) were noted but were unlikely sources of nutrients or bacteria were dropped from this analysis. Also, photos taken by the volunteers were used to fill in some missing information.
Survey Summary by Stream
A summary of the field survey findings is shown in the Table 5. “Sites per mile surveyed” were calculated to allow comparisons of the findings between streams.
Table 4: Granite Creek Field Survey Data Summary
A total of 328 sites were observed during the field survey. Miller, Granite, and Butte Creeks had the highest number of sites per mile surveyed while Banning and Manzanita Creeks had the lowest number of sites per mile surveyed. The majority of sites surveyed fell into the impacted buffer category.
CREEKS
TOTAL SITES
SURVEYED (miles)
SITES PER MILE SURVEYED
MAJOR CATEGORIES
Stormwater Drainage (sites)
Impacted Buffer (sites)
Pollutant Hot Spots (sites)
Aspen 51 2.75 18.5 18 48 35
Banning 17 1.50 11.3 14 7 4
Butte 63 2.75 22.9 31 47 31
Granite 66 2.50 26.4 35 49 22
Manzanita 22 2.25 9.8 15 10 3
Miller 82 3.00 27.3 39 64 39
North Fork Granite 27 1.75 15.4 18 19 14
TOTALS 328 16.5 19.9 (avg) 170 244 148
Compared to the average sites per mile surveyed of 19.9, both Banning and Manzanita had fewer sites, while Miller and Granite more sites per mile. This suggests that pollutant loading is comparatively lower on Banning and Manzanita Creeks, and higher on Miller and Granite Creeks. For further explanation of each category, please refer to the document titled “Analysis

Upper Granite Creek Watershed Improvement Plan 48
of a field survey in the Upper Granite Creek Watershed, Prescott, Arizona in 2010: an assessment to identify major sources and causes of nutrients and E. coli bacteria.”
Conclusions
A summary of findings is provided in Table 6. It shows the major causes and sources identified in the field survey. To support comparisons among creeks, the sites per mile surveyed on each creek is provided. Higher than average scores (red numbers) occur in more than one category along Miller, Granite, and Aspen creeks. Therefore, watershed improvement and education projects should be targeted in these areas. Scores well below average (green numbers) indicate that Banning and Manzanita Creeks have lower scores in several categories. Therefore, areas along these streams likely provide good reference conditions – the conditions that improvements in other drainages would hope to meet in the future. It is important to consider why the individual drainages are different as we explore potential sites for future water quality improvement projects. This includes land use restrictions or riparian area protection policies along different streams. If land along Banning and Manzanita is simply less developed than along Miller, Granite, and Aspen, we must also consider development or land use changes in the future.
Table 5: Source and Cause Comparison
Scores well above average are shown in red italics (problem areas), while scores well below average are in green italics (reference conditions). Out of the seven source and cause categories, Miller Creek had the highest number of problem areas in five categories, followed by Granite with three categories.
CREEKS SITES
STORM WATER DRAINAGE
IMPACTED BUFFER POLLUTANT HOT SPOTS
Structure Activity Waste‐water
Fertilizer Trash & Yard Waste
Animals
SITES PER MILE SURVEYED
Aspen 51 6.5 14.9 11.6 6.9 7.6 2.2 2.2
Banning 17 9.3 4.0 0.7 2.7 0 0 0
Butte 42 11.3 13.8 6.9 3.6 4.4 2.2 0.7
Granite 66 14.0 16.4 8.0 6.8 0.4 1.2 1.2
Manzanita 22 6.7 4.0 0.9 0.4 0 0.4 0
Miller 82 13.0 19.7 6.0 7.7 2.3 4 2.7
No. Fork Granite
27 10.3 10.3 2.9 5.1 1.1 4 0
AVERAGE 10.3 12.8 5.9 5.0 2.6 2.1 1.2

Upper Granite Creek Watershed Improvement Plan 49
RIPARIAN BUFFER ASSESSMENT
A rapid vegetation assessment and physical survey of the Upper Granite Creek Watershed was undertaken to assess the current functionality of the watershed channels in terms of their ability to filter pollutants from runoff. This assessment was completed by Dr. Marc Baker of Southwest Botanical Research of Chino Valley, AZ. Properly functioning riparian areas are more likely to be able to slow down surface runoff and filter out both nutrients and E. coli bacteria, which are pollutants of concern in this watershed.
Survey Methods
Channel features affecting the effectiveness of the riparian area at intercepting and filtering surface runoff included percent cover of substrates, diversity of vegetation species and height classes, vegetative area width, roughness, and angle and length of bank slope. Measurements were taken along 10 meter transects that ran perpendicular to stream reaches. Data was collected along the following creeks, within the City of Prescott, unincorporated Yavapai County, and Prescott National Forest: Aspen, Banning, Butte, Granite, North Fork Granite, Manzanita, and Miller. Three hundred and sixty transects were completed along 39 creek miles in the upper watershed (Fig. 16). To provide a representative sample of varying buffer conditions within the watershed, transect location coordinates were selected based on the length in meters from the beginning point to the end point of each creek using a table of random numbers to determine the distance between transects. A 10‐meter transect length was selected. Literature indicates that the 10 meters of vegetation immediately bordering a waterway is desired minimum width of a buffer zone (Mayer, Reynolds, and Canfield, 2005). Wider riparian areas would be more effective, but not frequently observed in this watershed. Creeks and their associated transects were categorized as either Urban (City of Prescott or unincorporated Yavapai County) or Forest (Prescott National Forest). At least 30 transects in each category were collected along each creek so that data analyses could determine the impact of urban development on riparian conditions.

Upper Granite Creek Watershed Improvement Plan 50
Figure 16: Riparian Buffer Transect Locations
Locations for the riparian buffer assessment transects were randomly selected with at least 30 transects in the urban area and forested area along each creek.

Upper Granite Creek Watershed Improvement Plan 51
Riparian Transect Analysis Methods
The information gathered along each transect was used to develop two scores: a Riparian Score (Fig. 17) and a Bare Soil Score (Fig. 22). The higher the Riparian Score, the more effective the riparian area along that transect is likely to be at removing nutrients and bacteria. The riparian conditions could be compared at these transect locations along the creek, between streams, and between land uses (forest or urban). The highest Riparian Scores indicate reference conditions – conditions that could be used for setting goals or benchmarks for future water quality improvement projects in this watershed. The amount of bare soil along a transect (the Bare Soil Score) indicates potential for riparian enhancement or restoration projects to improve habitat conditions along the creek, and therefore, water quality in the creek. It is important to note that severe flooding occurred in January 2010, prior to the assessment. Riparian improvement projects and education would have the greatest potential for making a difference in water quality by targeting areas with transects that had both a low Riparian Score and a high Bare Soil Score. Riparian Scores Each transect was given a Riparian Score based on four categories:
Percent vegetation (0 to 100)
Potential nutrient and bacteria uptake based on vegetation classes (0 to 100)
Surface roughness (0 to 100)
Slope (0 to 90) Riparian scores are shown in Figure 17. Those transects with higher riparian scores were more likely to have more vegetative cover, a greater diversity of vegetation species and height classes present, greater ground cover such as litter or duff, a lower slope, and a wider riparian area. Transects with lower riparian scores are likely to have little to no vegetation, occur in disturbed areas, or have limited width due to human activities or structures. Examples of transects with high and low riparian scores are shown in Figures 18 and 19.

Upper Granite Creek Watershed Improvement Plan 52
Figure 17: Riparian Scores Map
Each transect was assigned a “riparian score” based on the percent vegetation along the transect, vegetation classes, surface roughness and slope. Transects receiving the highest and lowest riparian scores are scattered across the watershed, appearing in both the urban and forested areas. Riparian impacts are not isolated to only a couple of streams.

Upper Granite Creek Watershed Improvement Plan 53
Figure 18: Examples of High Riparian Scores
Transects along Granite Creek near the headwaters (left) and Banning Creek (right) received some of the highest riparian scores. Higher riparian scores reflect greater vegetation cover and surface roughness along the transect as well as a low percentage of bare soil encountered along the transect.
Figure 19: Examples of Low Riparian Scores
Transects along Granite Creek downtown (left) and Manzanita Creek (right) received some of the lowest riparian scores. Contrasted with the photos depicting high riparian scores above, these photos demonstrate that less vegetation, more bare soil, and structures—like rock walls and paths—contributed to low riparian scores.

Upper Granite Creek Watershed Improvement Plan 54
Bare Soil Scores The percentage of bare soil along a transect is reflected in the Bare Soil Score. The score was calculated by assigning the following values to the substrate or vegetation categories recorded:
a) 1 if soil b) 0 if any other category
The amount of bare soil encountered along a transect may indicate opportunity for re‐vegetation or other methods to improve riparian conditions. Transects crossing structures (roads, paths, buildings) may have a very low riparian score, but these structures are too costly to remove, therefore limiting the opportunity for riparian improvement at that site. In general, the Bare Soil Scores indicate potential “opportunities” for improving riparian conditions. Examples of high and low bare soil scoring transects are shown in Figures 20 and 21. Bare soil scores are shown on Figure 22.
Figure 21: Examples of High Bare Soil Scores
Transects along Banning Creek (left) and Granite Creek (right) received some of the highest bare soil scores. Contrasted with the photos below, these photos show less ground cover and more exposed soil and rock.
Figure 20: Examples of Low Bare Soil Scores
Transects along Manzanita Creek (left) and Granite Creek (right) received some of the lowest bare soil scores. These photos portray transects where ground cover—vegetation, litter, or duff—was prominent.

Upper Granite Creek Watershed Improvement Plan 55
Figure 22: Bare Soil Scores Map
Each transect was assigned a bare soil score based on the percent of bare soil encountered along the transect. High bare soil scores are correlated with low riparian scores, generally indicating a lack of vegetation. In some cases, a high bare soil score indicates opportunity for improvement through riparian restoration.

Upper Granite Creek Watershed Improvement Plan 56
Conclusions
Transects receiving the highest and lowest riparian scores are scattered across the watershed, appearing in both the urban and forested areas. The highest and lowest scoring transects are not segregated by land use even though the upper portion of the watershed (PNF) should be less affected by human activities. Riparian impacts are not isolated to only a couple of streams. Poor riparian conditions can appear adjacent to the best riparian conditions. Transects in the highest bare soil category (50‐100%) occur across the watershed. Transects in the 50‐100% bare soil category frequently occur in clusters along Miller, North Fork of Granite, and Butte creeks. The lowest bare soil category (0‐9%) occurs in clusters along Manzanita, Granite, and Butte creeks. Banning Creek, which had the highest riparian scores, also has a mixture of bare soil scores. Another comparison of stream segments looked at the number of transects in the highest and lowest categories and the average riparian scores along each creek segment (Table 6). The highest average scores occur on Banning Creek in both the urban and forested segments. Urban Banning Creek has the greatest number of transects in the highest‐scoring category. Only Miller Creek and urban Manzanita Creek did not have any transects in the highest riparian score category. Miller Creek had the greatest number of transects in the lowest riparian score category with at least 25% bare soil – in both urban and forested areas. Transects with the lowest riparian scores with at least 25% bare soil occurred in both urban and forest areas.
Table 6: Transect Comparisons by Creek Segment
Urban and forest creek segments were compared by the number of transects falling into the highest and lowest riparian score categories. Banning Urban and Banning Forest had the most transects in the highest riparian score category while Miller Urban and Miller Forest had the most transects in the lowest riparian score category.
Creek Segments Riparian Score Category
Average Riparian Score
Highest Lowest
With High Bare Soil Score
Aspen Urban 1 5 168
Aspen Forest 1 4 171
Banning Urban 7 0 217
Banning Forest 4 3 201
Butte Urban 1 6 151
Butte Forest 1 0 162
Granite Urban 3 5 151
Granite Forest 1 2 175
Manzanita Urban 0 3 149
Miller Urban 0 13 146
Miller Forest 0 7 151
N. Fork Granite Urban 1 3 149

Upper Granite Creek Watershed Improvement Plan 57
Further details on the methods and findings of the riparian buffer assessment can be found in the document “Analyses of a vegetation and physical survey of the upper Granite Creek Watershed, Prescott, Arizona in 2010: an assessment of riparian function.”
WATERSHED RESIDENTS’ SURVEY
A social survey of residents within the Upper Granite Creek Watershed was conducted between December 15, 2009 and March 15, 2010. The survey was designed to gather information about watershed residents’ knowledge of watershed and water quality issues; perceptions of water quality; attitudes and values about protection and restoration of local water ways; and environmental behaviors. A copy of the survey can be found in Appendix C. The goal of the survey was to identify gaps in public knowledge to improve outreach and education strategies associated with the WIP and project implementation.
Delivery Modes
The survey was a self‐administered questionnaire distributed by mail as an insert in the City of Prescott water bill, through Valpak of Northern Arizona, and available on the internet using SurveyMonkey™ online software. The mail survey reached 21,000 households on the City’s water and sewer service and 30,000 people through Valpak Neighborhood Trading Areas for Prescott (East, South, and West), which includes Skull Valley and Bagdad.
Data Analysis Methods
Survey data was analyzed by Eugene Schmidt, a retired statistician and a WIC volunteer. Mr. Schmidt has a background in data analysis for organizations such as Maricopa Community Colleges where he taught, Phoenix Children's Hospital, Maricopa Association of Governments, Salt River Pima Maricopa Indian Community, and, most recently, the City of Prescott Water Conservation Committee. Survey questions, presented in scales (from one to five) and dichotomized (Male/Female or Yes/No) were correlated with each other, or more often grouped into aggregates of closely related survey items and then correlated with other aggregates. For example, survey items about protection were grouped and contrasted with items about restoration, producing two generalized aggregate measures. Other aggregates concerned commitment to, or knowledge of, waterway protection efforts. Other measures scaled importance of water quality for economic development or quality of life. Then comparisons could be made, for example of the aggregated scoring of concerns about protection versus restoration, relative to the importance of water quality for economic development or quality of life. Because of the large sample size, differences cited were almost certainly each statistically significant, usually at high confidence levels.

Upper Granite Creek Watershed Improvement Plan 58
Limitations
Because survey respondents were “self‐selected” (i.e.; chose to complete the survey and return it), the data was subject to self‐selection bias, or the distortion of the statistics based on how the sample was selected. In other words, one could speculate that those who chose to respond to the survey did so because they were already interested in and had knowledge about the survey topic. However, because the survey return was so great the effect of this bias on the statistical reliability of the results was negligible. The diversity in the responses to many survey questions further supports confidence in the reliability of the data.
Survey Findings
Protection and/or restoration of waterways, and the values reflected in reasons for protection, were aligned in the analysis of the survey results with the knowledge, commitment and active involvement in environmental efforts demonstrated by individual respondents. Respondents’ concerns and awareness of water quality threats, aligned with demographic characteristics such as education and income levels, as well as age, and particularly gender, were closely examined in the hopes of designing outreach efforts to broaden support for watershed improvement through education and awareness. Those many residents who responded to the survey (numbering 1,482) were mostly strong in favoring protection and restoration of water quality and ecological vitality of the creek and lake system. Variation in respondent knowledge and awareness of pollution sources was analyzed in conjunction with variability in commitment to learning more about the topic, willingness to pay a monthly fee to assist watershed protection and maintenance, involvement in recycling, learning of household and community wide pollution sources, and following government and agency reports on water quality. The detailed analyses, including graphs and charts, can be found in Appendix D.
Protection and Restoration in Relation to Knowledge, Involvement and Commitment
A number of survey items questioned general attitudes on the importance of protection and/or restoration, often similarly worded but emphasizing one or the other. Thus while endorsement of both protection and restoration was typically coupled, they could also be contrasted where one or the other was rated a bit higher in importance. Protection was associated with ecological concerns such as for wildlife, as well as for water quality and environmental stewardship. Restoration was associated with pollution abatement or waterway improvement efforts, and concern over water quality deterioration over time. Some other restoration items emphasized a sense of urgency in addressing pollution, so that in contrast to the general endorsement of protection, restoration with urgency reflected a “just fix it” emphasis. Females were more likely to favor Protection survey items and males to favor restoration items, with the “just fix it” emphasis. Restoration was more often associated with economic development rationales for water quality, and protection associated with quality of life and ecological rationales, such as for wildlife protection.

Upper Granite Creek Watershed Improvement Plan 59
While protection and restoration are the primary themes resulting from the survey, crafting messages specifically to increase knowledge of local water quality problems, engagement in pollution control, and commitment to sustainable solutions are the means by which public support for watershed improvement efforts can be increased. The survey assessments of respondents’ knowledge, involvement, and commitment showed strong, positive and discriminating correlations with ratings of pollution threats and also creek system benefits. Stronger endorsement of protection and restoration matched evidence of greater knowledge, involvement and commitment, far more so than demographic determinants like age, occupation and income. But also, knowledge, involvement and commitment was found to amplify gender differences, especially the agreement with protection concerns by females compared to males. Those who endorsed both protection and restoration, and also those who more regularly endorsed protection over restoration, scored higher on knowledge items from correctly identifying the watershed and a nearby creek or lake, to citing agency reports on water quality over media reports as a source of information, and reported more knowledge demanding occupations and avocation interests. Similarly those endorsing survey items worded more toward prevention than repair of waterway problems had more knowledge‐demanding occupations and interests, better knew their watershed, and were much more likely to rely on government or environmental reports than on media reports.
Willingness to Support a Watershed Fee
Asked whether they would be willing to pay a monthly fee to “support local watershed management activities”, and then asked to indicate the amount they would be willing to pay (through check boxes), respondents showed their instrumental support for watershed protection and restoration. Over half of the respondents (54%) indicated that they would be willing to pay a monthly fee; 25% indicated that they would not be willing to pay a fee; and 20% indicated that they “didn’t know.” A final question on the survey also explicitly questioned respondents’ commitment by asking if they were “interested in learning more about this project.” Yes or no responses to these questions, and the amount suggested by those willing to pay a monthly fee, formed the commitment measure. Respondents more positive on ecology concerns were more willing for a monthly fee and also to learn more about watershed improvement. Respondents more positive on economic reasons for increased protection and restoration were less willing for a fee and less willing to learn more. But these differences were not impressive until coupled with gender. Female respondents were more likely to be willing to pay a fee and to learn more, while also more often offering ecological concerns over economic reasons for waterway protection. Public support for watershed improvement is most likely to arise from a vanguard of women responding to protection and prevention arguments. There was also evidence for those female respondents lacking commitment (unwilling to pay a fee), who were younger and with lower income, were perhaps rejecting an additional

Upper Granite Creek Watershed Improvement Plan 60
household cost, not a disregard for water quality. This last finding showed through clearly in other comparisons. For example, for females with either an ecology or economy emphasis to their concerns, a fee cost seemed to undermine commitment even when they were active and knowledgeable. Fees for watershed protection that are not presented as clearly progressive would undercut support from otherwise very supportive females.
Information Sources
Another commitment predictor for respondents was their declared source of information on water quality and watershed issues. Their responses showed very steep declines from reliance on government or environmental organization’s reports to reliance on media reports or personal observation, across all levels of fee endorsement, with lessened commitment and involvement indicator ratings. Those respondents who relied on media as a source of water quality information were less likely to favor a fee and less likely to agree to the broader selection of support indicators. There would appear to be those outside the reach of reliable information on water quality whose awareness and support could be increased because they do favor a fee, if only information were to find its way inside their sphere of knowledge sources. Information on types of pollution threats in the waterways, their sources, and both public and individual corrective efforts need to come from many sources which should include the media, but also from outreach to influential groups, which might also receive media coverage.
Awareness of Pollution Sources
Respondents were asked to rate the twelve sources of pollution for their local impact. Analysis of the pollution ratings revealed a tendency for waste sources (leaking sewers, septic tanks, livestock manure, pet waste) and run‐off sources (storm run‐off from roads and roofs, lawn fertilizer or pesticides, commercial/industrial spills, construction site run‐off) to be grouped with similar ratings. Within the sets of waste and run‐off sources were additional differences in problem ratings for more obvious, perceivable and conceivable sources, or those sources more demanding of imagination, which apparently elicited different reasons for diminishing or dismissing the sources as important problems. Beyond lower ratings (“Not a problem”, “slight problem”, “moderate . . .) there were differences in proportions of “Don’t Know” or ratings left blank. When analyzed in terms of differences in ratings for those most knowledgeable, versus most committed (willing for a fee), or low on both knowledge and commitment, yet additional reasons for low ratings or non‐ratings seemed to be suggested. Non‐response options were greater for the six waste items, suggesting an aversion to contemplating, especially human waste sources, and especially for those lowest on both knowledge and commitment. The “less obvious” set of sources was consistently seen as a greater local problem by more sophisticated respondents. These were those respondents most involved, committed, and concerned about ecology. The differences were largest and most consistent for the most committed to a monthly fee. The “more obvious” pollution sources were rated lower in importance by those specifically not so concerned about pollution; these respondents were less likely to consider pollution “a problem that needs to be addressed,” held the opinion that

Upper Granite Creek Watershed Improvement Plan 61
current water quality is no worse than it was ten years ago, and that it is less important to promote economic development. The differences in the importance ratings of these two sets of pollution sources were not so much large as consistent across a range of other survey items assessing involvement and commitment. For other demographic measures, such as gender, education level, income, or occupation, the differences between the less and more obvious sources were not as great. In comparing those with a repair attitude to those with a prevent attitude, those who wanted repair (“just fix it”), found all the sources, both more and less obvious, important. It seems likely that ecologically oriented respondents attributed greater importance to the less obvious sources because they wanted to learn more about them. Also likely is that less committed respondents indicated little concern about pollution threats that they “didn’t want to hear about”, such as septic and commercial sources of pollution.
Septic Tank Owners; Dog Walkers
Respondents with septic systems were 21% of those surveyed. Awareness of their septic system’s age was good (77%), with a strong majority reporting have performed recent maintenance, for either those with standard or alternative system types. Those with standard systems who also knew the age of their system were most likely to have maintained the system recently. The respondents with standard systems were significantly stronger than alternative system respondents on general ecological protection items on the survey. Alternative system users scored lower than all respondents on ecology. Compared to respondents on the city sewer system, respondents with septic systems were more proactive (rainwater harvesting and composting) and more concerned about pollution. Respondents with dogs were 40% of those surveyed, and 86% of those with dogs walked them regularly. Those who reported they always picked droppings while walking their dog were three to one a majority over those who reported they seldom, rarely or never picked‐up. Dog walkers who regularly picked up after their dog were almost as likely to agree pet waste was an important pollution problem as those without a dog, but those who didn’t pick up or didn’t walk their dog saw the pollution problem from pet waste less important. All those who walked their dogs were more willing to pay a monthly fee for watershed management than those without a dog or who didn’t walk their dog. All dog walkers were more concerned about the environment than those who didn’t walk or did not have a dog. Fewer respondents with a septic tank and a dog picked up after their dog, but those who did pick up regularly were much more likely to have their septic system serviced recently. Surprisingly, those who seldom picked up after their dog were younger, more active, with more education, more challenging occupations, interests, and better earnings. They also show more awareness of worsening waterway pollution, and claim they know what to do, and that individuals can make a difference in local water quality improvement. Those who didn’t walk their dog and also those who picked up after their dog regularly were older and had higher income. A mixed picture on septic maintenance and appropriated collection and disposal of pet waste suggests an area in need of education and encouragement.

Upper Granite Creek Watershed Improvement Plan 62
Conclusions
The mostly positive relationships between knowledge, commitment, awareness and ecological concern were taken to bode well for the planning and success of community education and awareness efforts, especially when focused on gender, education level, and information source differences. Knowledge and commitment tied to protection and pollution concern promise outreach receptivity among interest and activity groups such as garden clubs, hikers, activists, volunteer, or natural history groups. Protection and restoration were both clearly endorsed by those responding to the survey, with the more knowledgeable respondents favoring protection a bit more than restoration. Support for restoration was favored more by those wanting repair, wanting to “just fix it”, especially those viewing restoration as critical to local economic development. Females, especially those more knowledgeable, were the vanguard of protection and prevention concerns, while males, especially those with economic concerns favored more restoration and repair. The contingent of respondents who disliked social/community values as a reason for protection, represented the perspective of a small minority, compared to the wider favoring of waterway stewardship and ecological reasons for protection. Commitment among respondents, measured by support for a monthly fee and indicators of active involvement, was the most evident correlate of protection and restoration both. While knowledge was the best predictor of whether a respondent favored protection, both public and individual action measures were strong predictors of both protection as well as restoration. Thus, public outreach emphasizing education and mechanisms for engaging the community might be most likely to strengthen attitudes favoring protection and restoration efforts. Further details on the survey data, analyses, and findings are contained in the document titled “Watershed knowledge, perceptions, and preferences of residents in the Upper Granite Creek Watershed, Arizona.”
AUTOMATED GEOSPATIAL WATERSHED ASSESSMENT (AGWA)
The WIC worked closely with NEMO to identify which portions of the project area have a higher risk of pollutant transport based on sediment and water yield using the Automated Geospatial Watershed Assessment (AGWA) model. AGWA is a GIS‐based hydrologic modeling tool that provides estimates of runoff and erosion based on model inputs, watershed elements such as a Digital Elevation Model (DEM), subwatershed discretization, land use/cover, soil, and precipitation. AGWA simulated a high precipitation event, which occurred on August 22, 1960 and resulted in 3.15 inches of precipitation over a 24‐hour period. Water yield results (Fig. 23) demonstrate a direct relationship between water yield and impervious cover; the more developed and urbanized subwatershed units in the lower watershed yielded higher water runoff than the forested, upper watershed units. Sediment yield results (Fig. 24) demonstrate an inverse

Upper Granite Creek Watershed Improvement Plan 63
relationship between impervious cover and sediment yield; the undeveloped, forested subwatershed units (most frequently in the upper watershed) were more likely to yield a higher sediment load during a precipitation event.

Upper Granite Creek Watershed Improvement Plan 64
Figure 23: AGWA Water Yield
AGWA simulated a high precipitation event from August 22, 1960 that resulted in 3.15 inches of precipitation over a 24‐hour period. Water yield results demonstrate a direct relationship between water yield and impervious cover. The more developed and urbanized subwatershed units in the lower watershed yielded higher water runoff than the upper watershed units containing natural ground cover (forest).

Upper Granite Creek Watershed Improvement Plan 65
Figure 24: AGWA Sediment Yield
AGWA simulated a high precipitation event, which occurred on August 22, 1960 and resulted in 3.15 inches of precipitation over a 24‐hour period. Sediment yield results demonstrate an inverse relationship between impervious cover and sediment yield; the undeveloped, forested subwatershed units (most frequently in the upper watershed) were more likely to yield a higher sediment load during a precipitation event than the urbanized subwatersheds lacking natural ground cover.

Upper Granite Creek Watershed Improvement Plan 66
DATA INTEGRATION AND ANALYSIS
To fully understand the condition of the Upper Granite Creek Watershed, the WIC engaged in a data analysis process of integrating, or layering, the primary datasets—water quality data during critical conditions, riparian buffer data, and field survey data—as well as existing data such as land use, sewer data, parks and open space, golf courses, recreation and dispersed camping sites, trails, roads, and fire history. The Granite Creek Subwatershed Characterization Table (Appendix E) is the culmination of the data integration process. It contains the subwatersheds (Fig. 25) and associated water quality data, description of the riparian buffer and notable land uses, and potential sources of bacteria and nutrients. Based on the subwatershed characterization, five priority subwatersheds were identified for targeted monitoring in Phase II as well as BMP development. The five priority subwatersheds are: Lower Manzanita, Lower Aspen, Lower Butte, Lower Miller, and the North Fork Granite Creek.
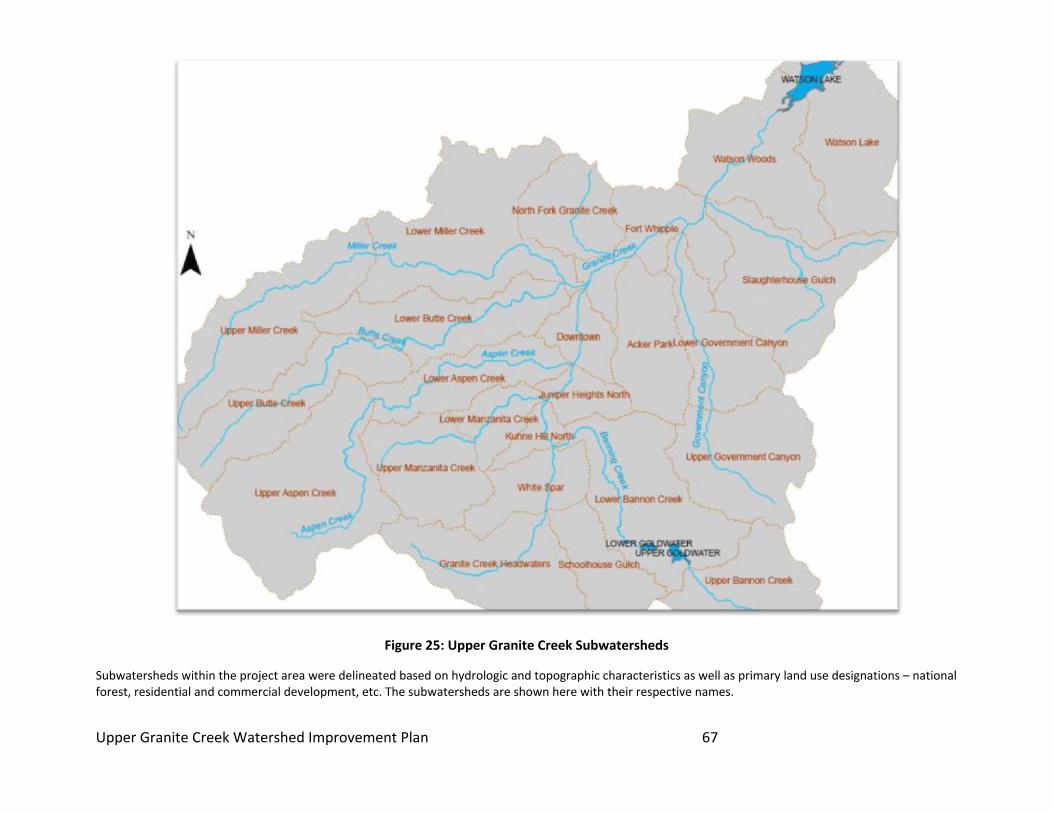
Upper Granite Creek Watershed Improvement Plan 67
Figure 25: Upper Granite Creek Subwatersheds
Subwatersheds within the project area were delineated based on hydrologic and topographic characteristics as well as primary land use designations – national forest, residential and commercial development, etc. The subwatersheds are shown here with their respective names.

Upper Granite Creek Watershed Improvement Plan 68
FINDINGS
The lower subwatershed areas are highly urbanized. Therefore, the types of potential bacteria and nutrient sources are greater than in the mostly undeveloped upper subwatersheds. The urbanized creek segments have been channelized and separated from their natural floodplains, increasing the risk of flooding to nearby properties. The majority of natural riparian vegetation has been replaced by walls or other structures and cannot adequately perform biological filtration functions. Stormwater drainage from roads and neighborhoods is directed into the nearest waterway untreated. The data indicates that the primary factors leading to water quality impairments in the project area are nonpoint source pollutants, increased runoff volumes due to impervious surfaces, and a lack of stormwater detention and infiltration/filtration. Two possibly significant sources in parts of the watershed are septic systems and the City of Prescott’s aging sewer infrastructure. While the water quality monitoring data to‐date does not conclusively indicate where these are primary sources of bacteria and nutrients (most likely due to sampling conditions and locations) their potential for contributing pollutants to surface waters is pronounced. There are residential areas in the City of Prescott and unincorporated Yavapai County that are not connected to the municipal sewer system and rely on septic systems for wastewater treatment. The existence of septic systems is not inherently a problem; soil suitability, leach field location, and proximity to a water body are all factors that can lead to inadequate septic system performance and, therefore, pose a risk to water quality. An ill‐maintained or malfunctioning septic system poses a much greater risk. It must be highlighted that effluent from septic systems will eventually reach water—seeping into ground water; subsurface flow to surface water; or surface water via ground water upwelling. Septic systems were not designed to effectively remove nitrate from the effluent, even when functioning or properly maintained. In short, where septic systems impact, and how much they impact, the water quality of the local creek system will require further study in Phase II. As with septic systems, Prescott’s aging sewer infrastructure poses a significant threat to water quality. This risk is more widespread in the watershed as 33% of the project area is connected to Prescott’s 300+ miles of sewer infrastructure. Sewer overflows from manholes in or near local creeks have been documented and are known to frequently occur during heavy storms due to “inflow & infiltration,” another side effect of increased runoff volumes and a lack of detention due to impervious cover. Sampling data is not needed to prove the detrimental impact to water quality when untreated sewage is discharged directly into a water body. Consistent, slight leaks from sewer lines that run in the creek bottoms would be more challenging to discern from water quality data.

Upper Granite Creek Watershed Improvement Plan 69
CHAPTER 3: WATERSHED IMPROVEMENT STRATEGY The WIC intends for the WIP to be a tool for use by all residents within the watershed and ensures that the findings and recommendations contained within this document reflect the needs and goals of each stakeholder. Improvements in water quality will require coordinated, long‐term efforts before any significant change is realized. Therefore, the success of the Planning process lies in the commitment of all parties to the collaborative process and holistic approach outlined here. Improving our watershed should be a priority for citizens and leaders, as watershed health is connected to the well‐being of our local economy, tourism, quality of life and human health and safety. Water quality can be addressed indirectly when other pressing civic issues are addressed such as stormwater, flooding, sewer infrastructure, new development, preservation of natural areas, and downtown revitalization/beautification. Conversely, specific water quality improvements can provide a host of other benefits to the community. The WIP represents a “living” document that outlines a strategy for improving the watershed in phases. As projects are implemented and as the community grows and changes, the document is to be revised to reflect current conditions and priorities.
WATERSHED IMPROVEMENT PLAN DEVELOPMENT
Goals and Methods
The goal of the Granite Creek Watershed Improvement Plan is to improve water quality in local creeks and lakes so that all water bodies meet state water quality standards. Project objectives include: 1) identifying primary sources of nutrients and E. coli bacteria in the watershed, and 2) developing a plan to reduce the pollutant concentrations entering surface waters. Primary methods to meet objectives included identifying gaps in the data, monitoring to fill those gaps, data analysis, and BMP identification through multi‐stakeholder collaboration. This WIP, the final product, establishes a list of priority water quality improvement and education projects (BMPs) that can be implemented by individuals and jurisdictional entities to achieve the desired result of reducing the nutrient and bacteria concentrations in our surface waters. The plan also includes a financial survey that examines a diversity of funding mechanisms for BMP implementation to bolster the value of the plan by making it self‐sustaining.
Work Plan
The chief components of the Watershed Improvement Planning process include: 1. Existing data compilation 2. Water quality monitoring 3. Physical survey

Upper Granite Creek Watershed Improvement Plan 70
4. Social survey 5. BMP identification and prioritization 6. Financial survey 7. Watershed Improvement Plan 8. Project implementation
Watershed Improvement Council
The Granite Creek Watershed Improvement Council (WIC) was formed to administer the planning process (Phase I) and on‐the‐ground implementation project (Phase II). The group’s purpose statement is “The Granite Creek Watershed Improvement Council is working to improve watershed health and water quality in local streams and lakes through a community planning effort.” The WIC was formed in June of 2008 with the intent of coordinating and communicating efforts to understand and improve water quality in the Upper Granite Creek Watershed, specifically as it relates to the impairment listings of Granite Creek and Watson Lake. The WIC represents the diverse interests and stakeholders within the watershed: the City of Prescott, Yavapai County, Prescott National Forest, the Yavapai‐Prescott Indian tribe, and ADOT. Citizens, business, and property owners were invited to attend and represent the public interest in the watershed. The primary organizations represented in the WIC are shown in Table 7.
Table 7: Watershed Improvement Council Representatives and Member Organizations
Name Title Organization Website
Amanda Richardson
Watershed Program Coordinator
Prescott Creeks www.PrescottCreeks.org
Max Wahlberg Image Analyst, Regional Riparian Mapping Project
U.S. Forest Service, Southwestern Region
www.fs.fed.us/r3
Greg Olsen Hydrologist Prescott National Forest www.fs.fed.us/r3/prescott/
Greg Toth Drainage Engineer/Environmental Coordinator
City of Prescott www.cityofprescott.net
Steve Gushue GIS Specialist City of Prescott www.cityofprescott.net
Ron Bell Stormwater Quality Program Coordinator
Yavapai County Flood Control District
www.co.yavapai.az.us
Jeff Whitham GIS Programmer Analyst Yavapai County www.co.yavapai.az.us
Chuck Budinger Prescott District Environmental Coordinator
Arizona Department of Transportation
www.azdot.gov/highways/districts/prescott
Above: The WIC at a monthly meeting in 2010.

Upper Granite Creek Watershed Improvement Plan 71
Technical Resources
The WIC receives technical guidance and support from ADEQ in addition to the University of Arizona’s Master Watershed Stewards (MWS) and NEMO programs.
Community Involvement Watershed Improvement Planning is designed to be a community‐driven process, therefore, involving and educating the citizens of Prescott was essential to the success of the WIP. The Creek Crew is the primary avenue for community involvement. The Creek Crew is comprised of citizen volunteers who assist the WIC through the collection of physical and chemical data that are the basis for the recommendations contained in this document. Creek Crew volunteers receive training and participate in water quality monitoring and boots‐on‐the ground activities, such as the watershed field survey. These activities, and interpretations of the data collected through these activities, are detailed in Chapter 2.
RECOMMENDATIONS
The recommendations herein follow the basic principles: minimize impervious areas, slow stormwater, reduce pollution sources, and establish protected areas. It is critical to integrate these principles into municipal operations and ordinances and formalize a civic commitment to watershed protection. Impervious areas can be reduced by incorporating open spaces and GI into urban areas and developments, reducing road widths, parking requirements, and using permeable alternatives such as porous pavement. Addressing stormwater on site by disconnecting downspouts from impervious surfaces and directing runoff to rain gardens, basins, swales, or trenches reduce the energy and flow rate of stormwater and allows for improved filtration and infiltration. These features also address peak flows which will reduce flooding and increase subsurface water storage and groundwater recharge. It is generally less expensive to prevent contaminants from entering stormwater than to treat contaminated water. Many contaminants can be prevented through good management practices such as encouraging proper disposal of pet wastes and green wastes; reducing fertilizer and pesticide use on lawns, gardens, parks, and golf courses; and community hazardous waste collection events.
Above: Creek Crew volunteers participate in a watershed field survey.

Upper Granite Creek Watershed Improvement Plan 72
Establishing protected areas such as buffer zones, open space, and “green belts” along waterways can improve water quality while providing wildlife habitat and excellent recreation areas for residents. The cumulative effect of implementing these principles in concert will have greater impact on surface water quality while providing many social and economic benefits. Integrating these principles into all aspects of government planning and operations, permitting, codes, and ordinances will provide the greatest efficiency and benefit. The following recommendations are based on current knowledge of local water quality impairments for bacteria and nutrients and best science collected during Phase I of the Watershed Improvement Planning process.
Civic Commitment
With the Watershed Improvement Planning phase coming to an end, the implementation of watershed improvement projects and BMPs is dependent on the commitment of the stakeholders to carry out the Plan. Moving forward, the WIC recommends that the stakeholder group be broadened to include representatives from the business and private sectors. Additionally, the stakeholder commitment should be formalized through a Memorandum of Understanding (MOU), signing on to a “Watershed Declaration,” or a similar agreement that will commit each partner. These actions will promote trust among stakeholders and confidence that the group is working towards common goals.
Green Infrastructure
The greater Prescott community is both defined by and dependent on the surrounding natural environment for its quality of life and tourism‐driven economy. As Prescott looks to the future, it is critical to protect our natural resources and make concerted efforts to restore degraded ecosystems, in undeveloped and urban areas. Enhancing or creating green infrastructure in the urban areas will provide multiple environmental, social, and economic benefits. In actuality, preventing pollution and ecological damage is less expensive than remedial/retroactive efforts, which is especially critical in the currently weak economy. ‘Green infrastructure’ (GI) is a broad term for features that rely on natural processes such as soil, water, and plants to provide ecosystem services such as clean air, clean water, and temperature regulation. GI encompasses existing forests and green spaces as well as constructed bio‐retention features such as rain gardens, wetlands, and filter strips. Many of these practices were originally developed in temperate climates but are gaining popularity in municipalities in the arid southwest as a way to manage urban stormwater at a lower cost than the traditional “grey” infrastructure (pipes and culverts) while providing other economic, social, and environmental benefits (USEPA, 2009). The WIC recommends that GI be integrated with tried and true grey infrastructure to the extent possible within the watershed to effectively

Upper Granite Creek Watershed Improvement Plan 73
reduce stormwater quantity before it enters the already overburdened sewer system and water bodies. While GI is not a “silver bullet,” cities such as Austin, Texas; Portland, Oregon; Los Angeles, California; Philadelphia; and Tucson, Arizona have adopted green infrastructure practices in response to water shortages, water pollution, flooding, and energy consumption with proven success and cost‐effectiveness. Cookeville, Tennessee embraced GI in updating the city’s master plan, stating that “the fostering of an interconnected network of green spaces along streams, greenways, parks and neighborhoods is the most cost effective way to manage stormwater, enhance water and air quality, mitigate climate change and contribute to overall community growth and prosperity” (City of Cookeville, 2010). Figure 26 describes five GI practices and examines the range of benefits associated with this type of infrastructure. Please note that these benefits accrue at varying scales depending on local factors such as climate and population. Some of the environmental, social, and economic benefits of GI are listed below (USEPA, 2009).
Environmental Benefits:
Reduces flooding: Increasing infiltration, evapotranspiration, and storage where precipitation falls will reduce runoff and flooding.
Improves water quality: Reducing runoff and allowing runoff to be treated by soils and vegetation will reduce pollutant loads to receiving water bodies.
Provides habitat: Native and drought‐adapted plants that thrive on infrequent precipitation can provide habitat for native birds and insects.
Reduces the urban heat island effect: Removing pavement and planting vegetation can cool and shade urban neighborhoods in the hot summer months.
Improves air quality: Urban vegetation removes pollutants from the air and can mitigate smog formation by reducing temperatures.
Mitigates climate change: By sequestering carbon dioxide in soils and plant biomass, urban vegetation can reduce carbon dioxide concentrations and mitigate global warming.
Increases groundwater recharge: GI practices that reduce impervious cover and enhance infiltration can increase the flow of water to the groundwater.
Social Benefits
Improves public health: Cooler summer temperatures and cleaner air can dramatically improve health, particularly for children and the elderly.
Beautifies neighborhoods: Private gardens and public rights‐of‐way irrigated with passive and active rainwater harvesting can create beautiful landscapes.
Calms traffic: By reducing street widths and introducing curves, green street techniques can slow traffic.

Upper Granite Creek Watershed Improvement Plan 74
Builds communities: By beautifying neighborhoods and creating a unique sense of place, GI practices can increase neighborhood interaction.
Reduces crime: Urban forest/urban greening research shows that people are more likely to be outside and walk in neighborhoods and cities that foster natural vegetation along streets and open spaces. This, in turn, deters acts of crime, violence, and graffiti (Wolf, 2010).
Economic Benefits
Reduces landscape maintenance costs: Passive rainwater harvesting and drought adapted plants will require less irrigation and maintenance than conventional, turf‐based landscaping.
Increases groundwater resources: GI practices that increase groundwater recharge can provide significant cost savings by averting increased pumping costs or increased water imports.
Reduces water imports: GI practices that manage stormwater through passive and active rainwater harvesting can reduce the demand for municipal water and reduce water imports.
Reduces energy use: The energy required to import, treat, and distribute municipal water could be significantly reduced by using precipitation where it falls.

Upper Granite Creek Watershed Improvement Plan 75
Figure 26: Green Infrastructure Benefits and Practices
Green infrastructure, also known as Low Impact Development (LID), is a method of construction and stormwater management that conserves natural systems and hydrologic functions of a site, thereby mitigating development impacts to land, water, and air. The goal of LID is to mimic a site’s predevelopment hydrology by using design practices and techniques that effectively capture, filter, store, evaporate, detain, and infiltrate runoff close to its source. Adapted from: Value of Green Infrastructure: A Guide to Recognizing Its Economic, Environmental and Social Benefits. Center for Neighborhood Technology & American Rivers. 2010

Upper Granite Creek Watershed Improvement Plan 76
Cost and Benefits of Green Infrastructure
Low impact development (LID) and GI practices can cost less to install, have lower operation and maintenance costs, and provide more cost‐effective stormwater management and water quality services than conventional stormwater practices/grey infrastructure projects. Although the planning and development of green infrastructure practices are more dependent on local conditions (Odefey et al., 2012), this allows for tailored solutions that are more resilient and ultimately more affordable than grey infrastructure projects. Despite limited or preliminary economic research (MacMullen and Reich, 2007), GI can provide significant ecosystem services and associated economic benefits, even when used to complement grey infrastructure projects. Early adopter communities have demonstrated that an across‐the‐board commitment to including GI stormwater approaches on public and private properties can result in long‐term fiscal savings for local governments (Odefey et al., 2012). For this reason, the WIC recommends identifying opportunities to implement GI practices through general maintenance, upgrades, and retrofitting of existing infrastructure such as roads, sidewalks, utilities, parks, and stormwater and begin with small pilot or demonstration projects. These small projects can test their effectiveness in Prescott’s arid climate as well as public response to GI projects. With success, GI elements can then be standardized in public works projects. The EPA Green Infrastructure Municipal Handbook reports that the most successful municipal green streets programs began with pilot or demonstration projects that included thorough documentation and monitoring.
Green Streets & Parking Lots
The Local Government Commission of California reports that of our nation’s impervious surfaces, roughly 65% are automobile‐related (parking, driveways, roads) while only 35% of the total is for structures, such as residences and commercial buildings, etc. These auto‐oriented impervious surfaces are primary culprits for collecting heavy metals, oil, antifreeze, grease, and hydrocarbons. Not only do these surfaces prevent water from filtering through the soil, they increase urban runoff which carries contaminants to the nearest waterway. According to USGS, an impervious manmade surface will generate 2 – 6 times more runoff than a natural surface (USEPA 2008b). Many GI practices can be adapted and implemented in the right‐of‐way to address stormwater quality and quantity while providing aesthetically pleasing landscapes. Examples are stormwater tree trenches, planters, bump‐outs, pervious pavement, vegetated strips and swales, infiltration beds and trenches, and rain gardens. The Seattle Public Utilities started a Natural Drainage System (NDS) program in 1999 as an approach to stormwater retrofitting. Rather than directing rainwater into an underground series of pipes with direct outfalls to watersbodies, this program is designed to improve subsurface infiltration and allow natural and chemical processes within the soil to remove pollutants. The Street Edge Alternatives (SEA Streets) project was the pilot study into the practicality and efficacy of the NDS program. One residential block was retrofitted, including reduction in impervious surfaces by narrowing the

Upper Granite Creek Watershed Improvement Plan 77
width of streets, making the streets curvilinear, and moving parking areas to the street side. Vegetated swales and rain gardens were created to increase runoff detention time. Monitoring of this pilot project demonstrated a 98 percent reduction of stormwater flow for a 2‐year storm event. Other components of the NDS program are listed in Table 8.
Table 8: Components of Seattle Public Utilities' Natural Drainage System (NDS) program
Water Environment Research Foundation. (2009). Using Rainwater to Grow Livable Communities: Sustainable Stormwater Best Management Practices. Accessed February 23, 2012.

Upper Granite Creek Watershed Improvement Plan 78
GI cost savings can increase when considering project costs beyond the direct stormwater management structures. Green streets in Seattle require less pavement, reducing pavement costs by 49% (Odefey et al., 2012). A preliminary analysis of properties that were redeveloped by Seattle’s NDS Program indicates that green streets modifications can add 6% to the value of the property (MacMullan, E. 2007). Replacing curbs, gutters, and storm sewers with roadside swales in one residential subdivision saved the developer $70,000 per mile, or $800 per residence (Dreher and Price, 1997).
Greenfield Development
Greenfield development – develop of previously undeveloped land – increases the burden on stormwater infrastructure by creating impervious surfaces and contributing additional runoff from new roofs, driveways, and streets. Updating local standards for parking lot size, street width, cul‐de‐sac design, and other rules governing the amount of pavement created by new development will minimize additional impervious cover and provide substantial incentives for adhering to these standards. Allowing GI or LID techniques into the process of permitting of new development is an investment that sustains nature and divides the costs of infrastructure operations, maintenance, repair, and mitigation of impaired receiving water bodies more equitably among developers, the municipality, and taxpayers. While City and County ordinances require new development to capture the first half inch of rainfall (the “first flush”) on site, the ordinance does not go any further to incentivize disconnected impervious area, minimizing impervious areas, incorporating existing trees and green spaces into the site design, and disconnecting downspouts. Well‐planned green spaces have been shown to increase property values and decrease the costs of public infrastructure and public services, including the costs for stormwater management and water treatment (greeninfrastructure.net). One study estimated that adopting LID practices throughout a watershed would reduce downstream flooding and would provide in $54 ‐ $343 in benefits per developed acre (Johnston et al., 2004). The benefits of GI or LID techniques extend to all parties. The development community will see benefits arising from the increased demand and pricing for “green” properties, through premiums, reduced stormwater expenses, and increased lots per area due to decentralized stormwater management. Municipalities benefit through reductions in structural costs throughout the stormwater management chain, sewer overflows, and flood control needs. Municipalities may also see increased energy efficiency and landscape water use reductions around municipal facilities where GI practices are in place. There are multiple public benefits such as flood control, improved air quality, increased habitat and open spaces, enhanced health, and groundwater recharge.
Redevelopment and Retrofits
As our city expands, older neighborhoods and commercial complexes will be redeveloped for new uses. These property updates are necessary to keep the community vibrant, rather than

Upper Granite Creek Watershed Improvement Plan 79
overrun with vacant properties in a state of disrepair. One estimate is that 42% of land currently considered “urban” in the U.S. will be redeveloped by 2030 (Odefey et al., 2012). Both development and redevelopment have the potential to contribute additional pollutants to our waterways; they also represent opportunities to shift our approach to methods which can preserve, protect, and restore the waters that sustain and add value to our communities. Standards for stormwater management on redevelopment sites should adhere to the same performance standards as greenfield development.
Municipal Sewer System Upgrades
In 2010, the City of Prescott approved water and wastewater rate increases to provide revenue for operation and maintenance, capital projects, and debt service (City of Prescott, 2010). The proposed increases will raise rates by 15% in 2011, 2012, and 2013, followed by a 10% increase in 2014, and 5% increases in 2015 and 1016. The City asserts that the increases are needed “to assure that the City's highly complex and aged water and wastewater systems are rehabilitated and improved to provide adequate, safe, and reliable utilities services” (City of Prescott, 2010). The City of Prescott’s Capital Improvement Plan has a limited list of projects that repair and rehabilitate the wastewater pipelines in the upper watershed in the next five years and, instead, focusing on upgrades to the Airport Wastewater Reclamation Facility. Therefore, funding to address faulty sewer infrastructure that is contributing to water quality degradation within the next five years will have to come from another source. Sewer overflows into creeks are known to have occurred as a result of stormwater inundation into cracked subsurface sewer pipes. This prevents a serious threat to water quality and public health. A watershed‐wide program to address stormwater through GI or LID practices would likely keep more stormwater on site, decreasing stormwater inundation and the potential for overflows. While GI implementation is not a substitute for sewer infrastructure upgrades, it would help to minimize these issues until improvements to the actual sewer system can be executed. For the purposes of preventing stormwater inundation of sewer pipes, those subwatersheds with the greatest area of impervious surfaces, or subwatersheds where sewer overflows have consistently occurred, could be the priority areas for stormwater retrofits using GI. It is not known whether the plan includes extending sewer connections to residences within the City of Prescott or unincorporated areas using municipal water that rely onsite wastewater treatment systems.
Septic Systems
There is a pronounced risk of surface and groundwater contamination from septic systems in the Granite Creek Watershed due to a prevalence of bedrock, rocky soils, and steep terrain, all of which limit the microbiological functions in the soil from providing adequate secondary treatment (Tri‐State Water Quality Council, 2005). Any measures that remove septic systems

Upper Granite Creek Watershed Improvement Plan 80
and leach fields within the 100‐year floodplain should be taken, with priority given to the oldest septic systems and residences. In addition, alternatives to traditional septic systems (such as tank and leach fields) should be explored. While data collected to‐date has not concluded that septic systems are a significant source of nutrients or bacteria in the watershed, this can be attributed gaps in data due to the timing and duration of precipitation events that saturate the ground and timing of sampling events. Options for addressing septic systems in the Upper Granite Creek Watershed include:
Conduct dye tests to determine the impact of septic systems on Miller, Aspen, and Manzanita Creeks.
Create a septic management utility that collects a fee from all septic owners within the 100‐year floodplain or a certain distance of a creek or lake
Develop a management protocol that dedicates a portion of the fee to regular maintenance of all systems
Draw up a long‐range capital investment plan for using the balance of the fee to fund the upgrade or replacement of failing septic systems or to acquire and pay back Arizona Water Infrastructure Finance Authority (WIFA) below‐market loans through the Clean Water State Revolving Fund (CWSRF)
Prioritize areas for septic system upgrades based on likelihood of failure and impacts to surface waters
Require inspection of and repairs to septic systems as a condition of sale or transfer of land
Implement a septic impact fee on new septic systems These options will be explored when deemed appropriate.
Stormwater Infrastructure Improvements
Similar to upgrades to the municipal sewer infrastructure, the WIC recommends that stormwater infrastructure improvements and greater efforts to detect illicit discharges within the Granite Creek Watershed be developed. Nonpoint source pollution, impervious cover, and topography continue to compound the quantity and quality of stormwater within the watershed which, in turn, contributes to impaired surface water quality. While both the City of Prescott and Yavapai County are participants in the federally mandated NPDES Phase II program, the WIC believes stormwater programs deserve greater support and funding. Stormwater management is related to other important civic issues such as flood risk, public health and safety, city beautification, tourism, lakes management, etc. A “Watershed Protection Fee” (discussed in Sustainable Funding for Watershed Protection below) is one method to fund efforts that support NPDES compliance without taking away from other municipal programs. For example, the City of Flagstaff approved and adopted an LID ordinance in three phases, starting with a voluntary program in 2009 and progressing into the requirement that developers retain the first inch of runoff of new development in 2011.

Upper Granite Creek Watershed Improvement Plan 81
Although both Yavapai County and the City of Prescott have ordinances in place that require a defined volume of stormwater from new development to be captured and filtered on site, the WIC recommends that a LID ordinance be adopted as part of a suite of stormwater upgrades and retrofits that would provide further stormwater quality protections. An ordinance such as this would require the retention/infiltration of a specified volume of runoff from all impervious areas, not just from new development or redevelopment sites. LID measures – similar to green infrastructure – would address stormwater at its source using small, cost‐effective projects, rather than address large volumes of stormwater downstream using traditional grey infrastructure. Because LID techniques take into consideration natural drainage patterns and existing conditions into site design, the WIC recommends that a BMP Design Criteria Manual be developed by the municipalities to provide guidance for installing and measuring the performance of stormwater BMPs. The City of Prescott’s ongoing hydraulic analysis and mapping of the 100‐year floodplains and floodways of Granite Creek and its main tributaries in accordance with Federal Emergency Management Agency (FEMA) guidelines is an important step to protecting and improving the watershed. By first identifying and delineating the floodplains and, consequently, identifying risks to proper drainage and stream function, preventative and corrective measures can be taken to reduce the risk of flooding, property damage, and loss of life. Because spikes in pollutants typically occur during high flow events, moderating those flow events will have an impact on water quality.
Forest Protection and Restoration
The Prescott National Forest encompasses 41% of the Upper Granite Creek Watershed. This significant percentage of land area and subsequent ecological services provided make forest management a critical element to downstream water quality and water quantity. While national forest lands are primarily undeveloped and maintain more natural groundcover, effective management of these lands becomes ever‐more important. In recent years, the US Forest Service has shifted its agency priorities to watershed health and the supply of clean drinking water for more than 60 million Americans. The WCF is one of the first major steps in that direction. USDA Secretary Tom Vilsack said as much in this quote from 2009:
“Restoration, for me, means managing forest lands first and foremost to protect our water resources while making our forests more resilient to climate change. In many of our forests, restoration will also include efforts to improve or decommission roads, to replace and improve culverts, and to rehabilitate streams and wetlands. Restoration will also mean rehabilitation of declining ecosystems.”
The Upper Granite Creek – Watson Lake Watershed was rated as “Functioning Properly” by the WCF. However, heavy recreational use in the forest, long‐term drought, the threat of future development downstream, and the effects of climate change on the forest ecosystems make the protection of healthy forest cover and forest resiliency a high priority.

Upper Granite Creek Watershed Improvement Plan 82
The WCF, besides providing a roadmap for the future of our forest lands also provides opportunities for current and future partners in watershed restoration and maintenance. The WIC supports the management direction of the USFS and any opportunity for local partnerships to implement restoration projects on the Prescott National Forest.
Opportunities for Sustainable Funding for Watershed Protection
The WIC recommends that opportunities for creating continuous, local funding sources be investigated to ensure ongoing investments in watershed health. One source of funding could be levied through a “Watershed Protection Fee.” The Watershed Residents’ Survey of 2010 found that the majority of respondents supported a fee to address local water quality and watershed issues in addition to supporting protection and restoration efforts within the watershed. The fee would be paid by individual property owners based on methods such as calculating the amount of impervious cover and expected runoff volumes of a property. Arizona municipalities such as the City of Flagstaff and the Town of Oro Valley have similar fees; however, income generated by these fees is dedicated to improvements in drainage and stormwater infrastructure. The WIC envisions that funds collected through a watershed protection fee in the Granite Creek Watershed could be used to address a broader range of urban watershed issues. Coordination with stakeholders, research, and development of public support would be necessary before implementation of such a fee. With these considerations, another potential funding source is through the Yavapai County Flood Control District, a special political subdivision that collects secondary property taxes used for floodplain management. Cities and towns that pay taxes to the Flood Control District have the opportunity to receive funds from the district for special flood control and stormwater projects. Regardless of the funding mechanism, a clear institution to receive the funds and plan for the how the funds will be spent are needed. Determination of the appropriate entity to collect, manage, and disperse the funds will be a significant endeavor as there are multiple jurisdictions within the watershed. One challenge is determining the appropriate institution to collect the fee and how to equitably tax residents of the watershed whether they reside in the City of Prescott or in unincorporated Yavapai County.
Public Education and Engagement
The long‐term vision for the watershed is to improve surface water quality to a level that will remove Granite Creek and Watson Lake from the impaired waters list. Watershed‐awareness among the populace and local policymakers is the key to making this vision a reality. The WIC recommends specific education and outreach tasks to raise public awareness.

Upper Granite Creek Watershed Improvement Plan 83
Print and Online Tools
In 2011, the WIC developed a Creek Care: Your Stewardship Guide to the Granite Creek Watershed to raise public awareness about the watershed and nonpoint source pollution. The guide offers practical tips on creek‐friendly practices that will keep local creeks, lakes, and community healthy. It covers topics such as: Storm Sewer vs. Sanitary Sewer; Pollution Pathways; Yard and Pasture Maintenance; Drainage; Erosion Prevention; Riparian Areas; Native Vegetation; Septic Maintenance; and Local Codes, Ordinances, and Permitting. 25,000 booklets were printed; 15,000 were mailed to residents and businesses located in the City of Prescott and unincorporated Yavapai County within ¼ mile of a major waterway. The remainder of the booklets was distributed to WIC partner entities, local colleges and universities, businesses, etc. It is also available for download on the Prescott Creeks’ website. Creek Care is a tool that can be used when engaging new partners, community groups, student groups, and individuals. The booklet will be updated and reprinted as necessary. In addition to Creek Care, other print and online tools can be developed to educate the public about NPS issues. In 2012, the City of Phoenix released an online interactive stormwater website that allows users to explore potential stormwater pollution from business, residential, and construction sites and BMPs that are appropriate for each site (www.phoenix.gov/waterservices/esd/stormwater/interactive/index.html).
Above: The cover of Creek Care.

Upper Granite Creek Watershed Improvement Plan 84
Community Groups
The Watershed Residents’ Survey found a link between social involvement, knowledge about watershed issues, and commitment to watershed efforts. It suggested that one way to increase public support for water quality improvements is through outreach to community groups already engaged in community activities. Homeowner and neighborhood groups, garden clubs, hiking clubs, civic and faith‐based groups are ideal audiences to engage around their specific interests.
Educational articles
The survey found that local media was a common source of water quality information for residents. The respondents that relied on local media as opposed to government agency or organization reports were less likely to favor a watershed protection fee and scored low on commitment to other restoration or protection efforts. In order to increase public support by raising awareness, the WIC could target these respondents through local media articles about watershed and water quality issues. By providing these residents with reliable information through their preferred news outlet, the WIC may be able to reach a group characteristically outside the reach of the WIC. The WIC recommends that a series of articles on watershed topics be submitted as columns to The Daily Courier, Prescott’s local newspaper. The WIC published a column in The Daily Courier in April 2010 recognizing the importance of the public and volunteers in the Watershed Improvement Planning effort (Appendix F). Another
Above: the City of Phoenix’s interactive stormwater webpage

Upper Granite Creek Watershed Improvement Plan 85
column was published in August 2011 on the topic of nutrient pollution that fuels unsightly algal and aquatic plant blooms on the lakes during the summer (Appendix F).
Creek Signage
As an effort to connect the people of the Upper Granite Creek Watershed to the many waterways that flow through their community, Prescott Creeks worked with Yavapai County and community volunteers in 2000‐2001 to place 100 signs on roads that cross creeks. The WIC recommends that existing creeks signs be maintained and replaced as‐needed and that additional signs be installed at currently un‐signed crossings. By knowing the names of the creeks that we drive across every day in our community, citizens of, and visitors to, the Upper Granite Creek Watershed will gain a greater sense of stewardship for these special features. The WIC recommends a program to assess, maintain, and expand the creek sign program in the following phases:
1. Identify which creek crossings currently have creek signs; 2. Assess current signs for their existence and condition; and 3. Identify road modifications or new creek crossings that should have signage
The proposed approach allows the creek sign program to be expanded as time and funding allows. The phases of the program could be a piece of the public education and outreach component of other watershed improvement projects implemented by the WIC or its project partners.
Storm Drain Markers
In 2007, a storm drain marker program was initiated as a partnership between Prescott Creeks and the City of Prescott with the intent of educating the public about stormwater pollution, the connection to surface water quality, and to discourage illicit dumping and littering. Approximately 1,000 children participated in the design of the markers; 200 markers were affixed to storm drains in the downtown Prescott vicinity. Since then, many of the markers have gone missing due to the adhesive failing and prying fingers.
The WIC recommends that efforts to draw attention to stormwater pollution by marking storm drains with markers or stencils and a public outreach campaign. The first phase of this project would consist of the assessment and maintenance of existing markers as well as replacing missing markers using the 200 remaining markers. This could be done in concert with the City of Prescott’s Stormwater Management program and local volunteers.
The second phase of the storm drain marker program would include an expansion to a wider project area and the development and purchase of a stencil rather than a physical marker. Properly stenciled
Above: An example of a storm drain stencil

Upper Granite Creek Watershed Improvement Plan 86
messages will last for approximately two years on a paved surface. A maintenance program would be developed to regularly assess and reapply the stencils as needed. The public would be invited to participate in the design of the stencil and development of a catchy stormwater slogan. Posters, bumper stickers, and street signs would be produced that boast the same design and message. An interactive stormwater pollution website would be developed to raise awareness about pollution sources and practices around the home that can minimize pollution. This can be an online interactive version of Creek Care: Your Stewardship Guide to the Granite Creek Watershed that can be hosted on the Prescott Creeks or City of Prescott website and linked to on WIC partner and local visitor information websites.
Golf Course BMPs
There are three golf courses in the Upper Granite Creek Watershed; assayampa Golf Club, Antelope Hills Golf Course, and the Prescott Lakes Golf Club which discharge stormwater to Butte and Aspen Creeks, Granite Creek, and Willow Creek/Lake, respectively. These courses have potential to adversely impact water quality within these waterways. Golf courses’ most pressing environmental challenge is the pollution of ground water and surface water caused by the use of fertilizers, pesticides, and other contaminants (Clark Throssel, 2011). Golfer expectations for “perfect” playing conditions oftentimes drive high maintenance costs and large quantities of inputs, resulting in an unsustainable maintenance system. The three local golf courses purchase treated effluent from the City of Prescott for irrigation. Treated effluent likely contains a variety of nutrients from the waste as well as other chemicals, like pharmaceuticals, that are not removed during treatment. Effluent applied to turf can impact surface water quality from direct runoff or contamination of groundwater and subsurface transport. There are a host of BMPs that can prevent water pollution from golf courses, such as rain gardens and bioswales ‐ practices that detain surface water and allow for filtration and infiltration before discharging to a waterway. Changes to the turf management, such as the quantity of fertilizer/pesticide/herbicide applied, as well as the timing and frequency of the application, can also prevent excess nutrients from washing off the turf into nearby waterways. Another BMP is for local courses to receive certification through the Audubon Cooperative Sanctuary Program (ACSP) for Golf Courses. The ACSP awards certification to recognize golf courses that protect the environment, conserve natural resources, and provide wildlife habitats. In more than 20 years of its existence, the program has certified more than two thousand golf courses in 36 countries (Golf & Environment, 2010). The 2010 Sustainable Golf Survey results demonstrate that there is a strong business benefit for voluntary environmental action. Significant percentage of members have seen reduced water costs (52%), and reduced pesticide costs (70%), reduced fertilizer costs (66%) among other fuel, electricity, and waste management cost savings (Golf & Environment, 2010). As of 2010, Arizona has one Certified Silver Audubon Signature Sanctuary golf course and 15 Certified Audubon Cooperative Sanctuaries, proving that ‘green’ golf course management can

Upper Granite Creek Watershed Improvement Plan 87
Above: Horse manure piled along Miller Creek.
prove economically, socially, and environmentally beneficial in Arizona’s arid climate (Audubon International, 2012). In Prescott, a community with diverse wildlife habitats, including an Audubon‐designated Important Bird Area (IBA), local golf club participation in the ACSP demonstrates a commitment to environmental stewardship. The WIC encourages golf courses to take voluntary measures to protect the local environment and water quality because not only does it make business sense but it is the right thing to do. The WIC acknowledges that building relationships with the private golf clubs will take time to both recognize the benefits of “greening” their maintenance regime and to implement changes to their systems. The City of Prescott should take the lead and model these BMPs at the municipal Antelope Hills Golf Courses. The public, especially members of the private golf clubs, should demand that maintenance programs address environmental concerns and are in‐line with community environmental stewardship ideals.
Livestock BMPs
In addition to contributing large amounts of nitrogen and phosphorus to the creek, manure is also a source of E. coli. A single horse can produce up to 190 pounds of nitrogen and an additional 60 pounds of phosphorus annually. Some properties observed along the creeks have up to four horses. Oftentimes, “manure management” in and around Prescott consists of establishing piles along the creek, allowing storm flows and surface runoff to carry it downstream. Prescott City Code Chapter 5‐3‐4 Section B prohibits the piling of manure on any property and requires stables and other animal enclosures to be cleared of manure at least once weekly and stored in fly proof containers.
The following programs, proposed by Ecosa Institute students in 2011, seek to address the manure stockpiles in an alternative manner that is independent of city code regulation, by creating a viable fertilizer trade network to support local farmers and gardeners who are always in need of manure.
Manure Exchange/Share Program
This program seeks to connect livestock owners with excess manure with residents searching for free organic fertilizer for gardening and compost purposes. This will benefit water quality by removing excess nutrients from properties with livestock and reduce the amount of non‐organic fertilizer used by local gardeners.

Upper Granite Creek Watershed Improvement Plan 88
At a minimum, the program could consist of an online directory of livestock owners that have manure and a list of farms or gardeners looking for manure. Livestock owners would provide basic information such as their name, contact information, type of manure, organic, bedding, composted, tractor or loader, accessibility, amount, or best times to call. Besides the cost of building the webpage and promoting the site, it would be a self‐sustaining program. Phase I could be a static online directory; Phase II of the program could be a more interactive online directory/map. Many Cooperative Extension offices and Conservation Districts around the country run manure exchange programs. The University of Illinois Extension operates a Manure Share program that covers five states. The creator of the Illinois program reports that the program was developed to be very simple and straightforward (Ellen Phillips, personal communication, June 25, 2012). The bulk of the work is organizational – approving participants who have registered and managing the “I have manure” and “I want manure” lists. Extension simply hosts the directory and stays out of negotiations between users. It is recommended that a base group of participants be organized before launching publicly to avoid participant frustrations due to a lack of manure availability (Ellen Phillips, personal communication, June 25, 2012).
Green Waste BMPs
Another potential source of nutrients is “green” waste – plant debris such as yard waste, grass clippings, tree trimmings, etc. Currently there is no local program for managing and utilizing green waste. As with manure, many properties have been observed to dump green waste in the creek bed or in piles alongside the creek, which represents a significant source of nitrogen and phosphorus and a major contributor to eutrophication in Granite Creek and Watson Lake. Green waste has many potential uses. The following programs, proposed by Ecosa Institute in 2011, seek to teach residents how to manage yard waste responsibly and utilize green waste. This program could be combined with the manure exchange program to create a larger, city‐wide composting program.
Phase I: Education
Disperse an educational pamphlet to encourage BMPs for yard waste, including information about the nutrient loads yard waste adds to the creek. This pamphlet could include information about composting yard waste, using it as mulch, and proper yard waste disposal, including information for local composting projects that accept yard waste. Information or informational links about how to create a neighborhood compost project in residential areas could also be included.

Upper Granite Creek Watershed Improvement Plan 89
Phase II: Annual Clean‐Ups
Grow the City of Prescott’s annual cleanup to be conducted several times annually to allow for more people to properly dispose of their yard waste. Yard waste could then be taken to composting areas and broken down and given away or resold as mulch. Phase III: Municipal Green Waste Program If there is community demand, a municipal green waste program could be developed to collect yard waste on a weekly or bi‐weekly basis. This program could be more fit for city operation rather than done on an individual basis due to the many precedents set by existing programs in other cities throughout the nation. If green waste could be separated into leaves and grasses (easily composted material) versus tree clippings (branches, and more difficult to compost woody materials) there could be greater potential for composting and the production of mulch and firewood materials. This program would also be seasonal, most likely operating from April through October, when residents are most likely to be accumulating green waste through property maintenance. The cities of Gilbert, Tempe, Mesa, and Phoenix all include green waste collection in their municipal solid waste programs. Gilbert has a monthly bulk trash pick‐up that includes bulky household items and green waste. However, the green waste is taken to the landfill instead of being diverted to a composting operation. Tempe picks up green waste as part of monthly bulk and brush collection which is taken to a landfill. Mesa offers green waste barrels and a weekly pickup for an additional monthly fee. The City of Phoenix supports a contract mulching program to divert organic material from entering the waste stream by collecting green waste, converting it to mulch, and sending it to a contractor to be composted. Green waste collection programs provide jobs and, when attached to a commercial composting, operation, a potential revenue source while protecting water quality and community cleanliness.
Highway Project BMPs
The maintenance and long term use of roads and highways also presents an opportunity to utilize a broad list of BMPs. In addition to construction BMPs designed to capture sediment, oil and grease, and minimize erosion, Table 9 contains a list that focuses more on the management of these roads to provide a long term benefit to water quality.
Table 9: Potential Highway Project BMPs
BMP Goals Principles Control stormwater runoff Velocity dissipation
Detention of stormwater to reduce peak flows after rain events

Upper Granite Creek Watershed Improvement Plan 90
Collaborate with local flood control agencies to time releases from ADOT projects to coincide with local efforts
Stormwater quality improvements Monitoring and sampling of outfalls during rain events
Monitoring outfalls during dry weather to evaluate presence of illicit discharges
Development of post‐construction BMPs to reduce pollutants commonly found in roadway runoff
Collaborate on projects with local jurisdictions to enhance or restore natural drainage systems
Groundwater recharge Evaluate potential for using stormwater runoff to infiltrate surface soils
Evalutate potential for diverting stormwater from highways to drywell systems
Collaborate with local jurisdictions to construct drainage basin inclusive detention/infiltration basins
Riparian habitat enhancement Wildlife crossings
Enhancement of the biological resources at bridge crossings and areas where roads parallel waterways
Collaborate with local jurisdictions to complete projects for riparian habitat preservation, enhancement, or restoration
Invasive Plants
The term “invasive species” is often used interchangeably with the terms “exotics”, “aliens”, “nonnatives”, and “weeds.” However, Federal Executive Order 13112 defines an invasive species, specifically, as “an alien species whose introduction does or is likely to cause economic or environmental harm or harm to human health.” Invasive plants can seriously damage plant and animal communities, increase soil erosion and sedimentation, and interfere with outdoor recreation (Westbrooks, 1998). While invasive plants don’t have a direct impact on water quality, they do affect the functionality of riparian buffers in terms of their ability to filter pollutants from surface runoff. Variable land ownership and jurisdictions within the watershed makes the management of invasive species complex. However, as watershed improvement projects that involve channel or riparian restoration or revegetation, the success of these projects could be hindered by the perpetual source of seeds from upstream non‐native and invasive vegetation. For example, years of hard work and millions of dollars has gone towards restoring Watson Woods Riparian Preserve. However, because of its downstream location within the watershed, Watson Woods

Upper Granite Creek Watershed Improvement Plan 91
is susceptible to infestation and provides an ideal geomorphic setting for the establishment of these species. All BMP projects that involve restoration or revegetation should also contain an active management plan for invasive species control at the project site. Managing invasive plants at the project site will promote establishment and growth of native plant species and an overall functioning native ecosystem. Site‐specific treatments are only able to go so far to maintain or reduce invasive plant populations. In order to tackle invasive plant infestation, there must be broad coordination between the WIC and land management entities with invasive species programs. The Southwest Vegetation Management Association’s Yavapai Weed Management Area (YWMA) is the primary coordinating authority on invasive plant management and research. The YWMA represents an ideal partner for the WIC to establish a watershed‐based invasive species program. The YWMA is comprised of entities such as the AZGFD and PNF. These entities are actively seeking partnerships and projects that involve invasive species management and have access to several volunteer databases and resources that would assist in implementing a project.
FUNDING FOR WATERSHED IMPROVEMENT PROJECTS
A goal of the WIC is to identify sustainable local funding sources that will provide a continued investment in watershed health. In addition to grant makers in Appendix G, below is a list and general description of federal, state, and private foundations that represent potential funding sources.
Arizona Water Infrastructure Authority Green Project Reserve
The Arizona Water Infrastructure Financing Authority (WIFA) has Green Project Reserve monies available through the Arizona Clean Water State Revolving Fund (CWSRF). The CWSRF is a low‐interest loan program that provides funds for publicly‐owned municipal wastewater systems. Green Projects are specifically projects that promote water efficiency, energy efficiency, green stormwater infrastructure, and environmental innovations. Green stormwater infrastructure projects include stormwater harvesting and reuse at the wastewater facility as well as the establishment or restoration of permanent riparian buffers or soft bioengineered streambanks. Many of the GI/green streets projects envisioned by the WIP would be eligible for this type of funding in partnership with the City of Prescott.
Conserve to Enhance
The Water Resources Research Center at the University of Arizona is researching and developing a Conserve to Enhance (C2E) program which provides a tangible connection between individual water use behavior and environmental concerns. C2E allows users who conserve water to donate their savings for environmental purposes. Voluntary reductions in

Upper Granite Creek Watershed Improvement Plan 92
water consumption are measured against the previous year’s usage during the same month; participants donate the difference to support local environmental enhancement projects. Donations can go towards the purchase of water (reclaimed water/effluent or groundwater), water leases, secure instream flows, acquire easements and retire pumping, recharge groundwater, riparian enhancement, or other environmental projects. This program creates a simple accounting mechanism and a sustainable funding source while raising awareness about water conservation and waterway restoration. Participants never pay more to support environmental enhancement, but rather redirect the savings. A C2E Pilot program was launched in Tucson in January 2011 involving sixty participants. Program Partners are local NGOs, utilities, and the funding organizations, the USEPA and Bureau of Reclamation. At the end of the year, donations totaled just under $1,500, approximately $3‐6 per household per month (Lacroix and Rupprecht, 2012). A total of 1.1 million gallons of water was conserved through the program. The pilot enhancement project selected was in Atterbury Wash, a highly visible community park, partnering with Tucson Audubon Society. The majority of the money is being used to provide short‐term, supplemental water to support the establishment of native vegetation along the wash. Based on figures from Tucson and other similar programs around the west, a community like Prescott is estimated to have at least a 1,000 customers participating in the program. This would generate $56,000 per year for local environmental projects. A simpler version of this program is a “check box” on the utility bill. Customers can choose to donate to environmental projects without having to conserve water. Examples of other check box programs are the Albuquerque Bernalillo County Water Utility Authority’s Living River Fund which allows water rights to be purchased so that water can be kept in the Rio Grande rather than being diverted for other uses (ABCWUA.org). The Avion Water Company has partnered with the Deschutes River Conservancy to provide water customers with the opportunity to donate to sustain flows in the Middle Deschutes that are otherwise diverted for irrigation (deschutesriver.org). The Bonneville Environmental Foundation provides Water Restoration Certificates, an effective way for businesses to take responsibility for their water consumption by returning an amount of water equal to what they’ve used back to the environment (b‐e‐f.org). Developing criteria for selecting environmental enhancement projects.
Army Corps of Engineers In‐Lieu Fee Mitigation Program
The US Army Corps of Engineers (USACE) Wetland Mitigation Program represents a potential source of funding to implement BMP Projects that focus on riparian habitat restoration, enhancement, or preservation. As Waters of the US (i.e., wetlands, streams, riparian habitats, etc.) are impacted through the Section 404 Permitting Program, permittees are required to mitigate for their impacts in order to achieve federal mandates of “no‐net loss” of wetlands. Whereas in the past permittees

Upper Granite Creek Watershed Improvement Plan 93
would perform their own “project specific” mitigation, new federal regulations now require that mitigation plans be developed and/or implemented in advance of wetland impacts, through “Mitigation Banks” or “In‐Lieu Fee Mitigation Programs (ILF),” typically at an off‐site location, but within the same watershed. Both mitigation methods are managed by entities known as “Sponsors.” Developing a mitigation project through a mitigation bank or ILF requires a ‘watershed approach’, which considers current conditions and needs of the watershed, and addresses how the mitigation project will fulfill those needs. As projects are identified and/or implemented, Mitigation Sponsors are given “credit” which varies in both amounts and value. As wetlands or other waters are impacted through the Section 404 Permitting Program, permittees pay monies to a Mitigation Sponsor to either reimburse the costs associated with implementing mitigation projects, or to fund the implementation of previously planned mitigation projects. These compliance fees serve as a funding source for wetland and/or riparian restoration, creation, enhancement, and preservation of wetlands and other aquatic resources. Prescott Creeks is an ILF Sponsor organization in Arizona. BMP projects identified in the WIP might fit the mitigation requirements, depending on the size and location of impact and type of habitat addressed by the BMP. Therefore the USACE Mitigation Program is, potentially, a source of sustainable funding for watershed protection and restoration.
Yavapai County Property Tax Incentive Program
The majority of creek corridors in the Upper Granite Creek Watershed are under private ownership, resulting in limited opportunities for riparian and floodplain restoration. Additionally, the City of Prescott and Yavapai County do not have access for routine maintenance of channels and removal of drainage hazards. The general concept behind the program is that property owners that place a swath of property put under a conservation easement receive financial incentives. The action of donating land or placing a conservation easement on that property would trigger a change in the property use and, therefore, the market value of that property. The reduced property value would result in reduced property taxes. To recoup the loss in property value, property owners would receive a tax write‐off. The City of Prescott may also offer local tax write‐offs to encourage participation in this program. Incentives to place creek corridor property under conservation easements may appeal to residents who own creekside properties may find the edges bordering the creek “unusable” space due to flooding, erosion, or channel movement. This program may also contribute to the National Flood Insurance Program’s (NFIP) Community Rating System for Yavapai County. The NFIP is a voluntary incentive program that encourages community floodplain management activities that go above and beyond the minimum NFIP requirements. As a result, flood insurance premium rates are discounted to reflect the reduced flood risk. Georgia Conservation Tax Credit Program provides a financial incentive for willing landowners to donate land or place a conservation easement on their property (Georgia Land Conservation

Upper Granite Creek Watershed Improvement Plan 94
Program). Taxpayers can claim a credit against their state income tax of up to 25% or the fair market value of the donated property, up to $250,000 for individuals. The property must be donated to a government entity or qualified non‐profit organization.
PROPOSED BMP PROJECTS
The WIC has identified project locations for BMP implementation in the Upper Granite Creek Watershed to improve surface water quality. These projects have been prioritized for their feasibility in terms of property ownership, access, visibility as a demonstration project, and ability to provide water quality treatment. The top‐priority projects are the Prescott Rodeo Grounds, Prescott Community Center, Whipple Street Detention Basins, and APS Construction Yard. Descriptions of these projects can be found in Appendix H. Brief descriptions of second‐tier projects that the WIC would like to complete can be found in Appendix I.
CONCLUSIONS
The vision for the WIP is to outline priority water quality improvement and education projects, or BMPs that can be implemented by local stakeholders (residents, landowners, municipalities, government agencies, etc.) to achieve the desired result of reducing nutrient and bacteria concentrations in our surface waters of the Granite Creek Watershed.
NEXT STEPS
The WIC will seek funding to implement BMP projects identified in Appendix H while continuing to identify additional potential partners, projects, and sustainable local funding mechanisms. The WIP will be revised periodically to reflect changes in watershed condition.

Upper Granite Creek Watershed Improvement Plan 95
REFERENCES Alderserio, K., D. Wait & M. Sobsey. 1996. Detection and Characterization of Male‐Specific RNA Coliphages in a New York City Reservoir to Distinguish Between Human and Non‐human Sources of Contamination. Proceedings of a Symposium on New York City Water Supply Studies, ed. McDonnell et al. TPS‐96‐2. American Water Resources Association. Herndon, VA.
Arizona Department of Environmental Quality. 2012. Water Quality Divisions: Permits: Reclaimed Water. Retrieved August 15, 2012 from http://www.azdeq.gov/environ/water/permits/reclaimed.html#class Arizona Department of Environmental Quality. 2010. Oak Creek and Spring Creek Total Maximum Daily Loads for Escherichia coliform. Retrieved from http://www.azdeq.gov/environ/water/assessment/download/Oak_Creek_TMDL_Final‐12‐10.pdf
Arizona Department of Environmental Qualitya. 2004 Surface Water Assessments. VI: How Clean is Surface Water in Arizona? Retrieved from http://www.azdeq.gov/environ/water/assessment/download/303‐04/ch6.pdf
Arizona Department of Environmental Qualityb. Using Gray Water at Home: Arizona Department of Environmental Quality's Guide to Complying with the Type 1 General Permit. Retrieved from http://www.azdeq.gov/environ/water/permits/download/graybro.pdf
Arizona Game and Fish Department. 2009. Information pertaining to the investigation of the Watson Lake fish kill in July 2000. Audubon International. (March 21, 2012). Audubon International Certified Golf Courses. Retrieved June 4, 2012, from http://auduboninternational.org/PDFs/CACS%20Golf%20list.pdf Barbour, M.T., J. Gerritsen, B.D. Snyder, and J.B.Stribling. 1999. Rapid bioassessment protocols for use in streams and wadeable rivers: periphyton, macroinvertebrates and fish, Second edition. EPA 841‐B‐99‐02. U.S. Environmental Protection Agency; Office of Water; Washington D.C. Center for Neighborhood Technology and American Rivers. 2010. The Value of Green Infrastructure: A Guide to Recognizing Its Economic, Environmental and Social Benefits. Retrieved from http://www.americanrivers.org/library/reports‐publications/the‐value‐of‐green‐
infrastructure.html Center for Watershed Protection (CWP). Is Runoff Volume the "Real" Pollutant? If So, Can I Still Get My Plan Approved? Runoff Rundown. Fall 2009, Issue #36. Retrieved from http://archive.constantcontact.com/fs045/1101639006674/archive/1102792062443.html

Upper Granite Creek Watershed Improvement Plan 96
Center for Watershed Protection (CWP). March 2003. Impacts of Impervious Cover on Aquatic Systems. Watershed Protection Research Monograph No.1. Retrieved from http://www.mckenziewaterquality.org/documents/ImpactsofImperviousCover‐CWPReport.pdf City of Prescotta.Water and Wastewater Rates‐October 2010 Update. October 14 & 21, 2010. Public Informational Meetings. Retrieved from http://www.cityofprescott.net/_d/waterwastewaterratespres2.pdf
City of Prescottb. Stormwater Management. Retrieved from http://cityofprescott.net/services/engineering/storm.php
Civiltech Engineering. Summary Report: Water Quality Characterization for the City of Prescott Surface Water Recharge Pipeline Replacement Project. November 2009. Clarke, George A. & N. Stoner. 2001. Stormwater Strategies: The Economic Advantage. Stormwater. January/February 2001. Retrieved from http://www.stormh2o.com/january‐february‐
2001/stormwater‐strategies‐economics.aspx
Cookeville Municipal Planning Commission. Cookeville 2030 Plan. Cookeville, TN. Retrieved from http://www.cookeville‐tn.org/planning/uploads/pdf/2030%20Comprehensive%20Plan.pdf
Dodder, Joanna. 2010, May 12. State issues violation notices to Prescott, PV sewer plants. The Daily Courier. Retrieved from http://dcourier.com/main.asp?Search=1&ArticleID=81023&SectionID=1&SubSectionID=1086&S=1
Dreher, D.W. and T.H. Price. 1997. Reducing the Impacts of Urban Runoff: The Advantages of Alternative Site Design Approaches. Northeastern Illinois Planning Commission. Fact Sheet: Livable Communities and Water. Local Government Commission. Retrieved on February 14, 2012 from http://www.lgc.org/freepub/docs/water/water_livable_communities.pdf Fire Effects on Water Quality. 2010. In Forest Encyclopedia Network (FEN). Retrieved November 9, 2010 from http://www.forestencyclopedia.net/p/p621 Georgia Land Conservation Program. Georgia Tax Credit. Retrieved March 2012 from http://glcp.georgia.gov/00/channel_title/0,2094,82613131_114687036,00.html Golf & Environment. (2010). 2010 Sustainable Golf Survey Results. Retrieved June 4, 2012, from http://www.golfandenvironment.com/index.php/latestmenu/124‐survey‐results
Johnston, D.M., J.B. Braden, and T.H. Price. 2006. Downstream Economic Benefits from Conservation Design Practices. Journal of Water Resources Planning and Management, 132:1(35). Retrieved August 21, 2012 from http://cedb.asce.org/cgi/WWWdisplay.cgi?150235 Killam, Gayle. 2005. The Clean Water Act Owner’s Manual (2nd Edition). River Network.

Upper Granite Creek Watershed Improvement Plan 97
Reese, A.J. (2009). Volume Based Hydrology: Examining the shift in focus from peak flows and pollution treatment to mimicking predevelopment volumes. Stormwater. Retrieved from http://www.stormh2o.com/september‐2009/volume‐based‐hydrology‐9.aspx
Lacroix, Kelly Mott and Candice Ruprecht. February, 2012. University of Arizona Water Resources Research Center projects aimed at meeting the challenge of providing water for the environment in Arizona. Presented to the Citizen’s Water Advocacy Group, Prescott, AZ. Lewis, Lori. 2010. Health Implications of Escherichia coli (E. coli) in Recreational and Drinking Water. The Water Project, Inc. Retrieved from: http://thewaterproject.org/health‐implications‐of‐e‐
coli.asp#ixzz1PGrE6Uve MacMullen, Ed. “Assessing Low Impact Developments Using a Benefit‐Cost Approach.” 2nd National Low Impact Development Conference. Wilmington, NC. 12‐14 March 2007. http://www.econw.com/our‐work/presentations/assessing‐low‐impact‐development‐using‐a‐benefit‐cost‐approach
MacMullen, Ed & Sarah Reich. 2007. The Economics of Low‐Impact Development: A Literature Review. ECONorthwest. Retrieved January 25, 2012 from http://www.econw.com/reports/ECONorthwest_Low‐Impact‐Development‐Economics‐Literature‐Review.pdf/
Mawhinney, DB; Young, RB; Vanderford, BJ; Borch, T; and Snyder, SA. (2011). Artificial sweetener sucralose in U.S. drinking water systems. Environmental Science & Technology, 5(20), 8716‐22. doi: 10.1021 Odefey, J., Detwiler, S., Rousseau, K., Trice, A., Blackwell, R., O’Hara, K., Buckley, M., Souhlas, T., Brown, S., & Raviprakash, P. 2012. Banking on Green: A Look at How Green Infrastructure Can Save Municipalities Money and Provide Economice Benefits Community‐wide. American Rivers, American Society of Landscape Architects, ECONorthwest, Water Environment Federation. Retrieved from: http://www.americanrivers.org/assets/pdfs/reports‐and‐publications/banking‐on‐green‐
report.pdf
Potyondy, John P. & T. W. Geier. 2011. Watershed Condition Classification Technical Guide. FS‐978. United States Department of Agriculture, Forest Service. http://www.fs.fed.us/publications/watershed/watershed_classification_guide.pdf
Throssel, C. (2011, October). Follow the Water to Protect the Environment. Golfdom. Retrieved June 4, 2012, from http://www.golfdom‐digital.com/golfdom/201110/#pg28 Trial, W. et al. 1993. Bacterial Source Tracking: Studies in an Urban Seattle Watershed. Puget Sound Notes. 30:1‐3. Tri‐State Water Quality Council. 2005. Septic System Impact on Surface Waters: A Review for the Inland Northwest.

Upper Granite Creek Watershed Improvement Plan 98
United States Environmental Protection Agency. 2009. Green Infrastructure in Arid and Semi‐Arid Climates: Adapting innovative stormwater management techniques to the water‐limited West. Retrieved from http://www.epa.gov/npdes/pubs/gi_arid_climate_fs.pdf United States Environmental Protection Agency. 2008a. Eight Tools of Watershed Protection. Watershed Academy Web. http://cfpub.epa.gov/watertrain/pdf/modules/new_eighttools.pdf United Stated Environmental Protection Agency. 2008b. Green Parking Lot Resource Guide (EPA‐510‐B‐08‐001). Retrieved from http://www.streamteamok.net/Doc_link/Green%20Parking%20Lot%20Guide%20(final).PDF United States Environmental Protection Agency, Ecosystem Research Division. Land Cover Characterization and Change: Impervious Cover. Retrieved from http://www.epa.gov/athens/research/impervious/
Westbrooks, R. 1998. Invasive plants, changing the landscape of America: Fact book. Federal Interagency Committee for the Management of Noxious and Exotic Weeds (FICMNEW), Washington, D.C. 109 pp. Retrieved June 22, 2012 from http://www.weedcenter.org/inv_plant_info/docs/invasive‐plants‐factbook.pdf Wolf, K.L. 2010. Crime and Fear ‐ A Literature Review. In: Green Cities: Good Health (www.greenhealth.washington.edu). College of the Environment, University of Washington. Retrieved from http://depts.washington.edu/hhwb/Thm_Crime.html

Appendix A:
Creek Segment Water Quality Analysis
An analysis was undertaken to determine which creek segments exhibit spikes in nutrient or bacteria
concentrations by averaging the water quality measurement collected by ADEQ, Prescott Creeks, and
the City of Prescott. Overall, Total Nitrogen concentrations seem to elevate in the residential areas,
whereas E. coli concentrations increase in urban areas, although there is some overlap between
residential and urban reaches.
Upper Granite Creek Watershed Improvement Plan, August 2012 99

Upper Granite Creek Watershed Improvement Plan, August 2012 100

Pollutant Increases Outlying to Urban Sites
Pollutant Residential Sites Urban Sites
All 6 CREEKSSampling Sites
% Exceedance Samples
% Exceedance Samples
% Exceedance Samples
% Exceedance Samples
19 Outlying Sites 11 Urban Sites
N = 44 samplings N = 79 samplings
E. Coli (CFU) 23.7 (± 8.2) 181.5 (± 9.75)
14% (7 of 51) 47% (37 of 79)
Organic N (TKN mg/l) 0.67 (± 0.71) 0.76 (± 0.60)
2% (1 of 44) 10% (8 of 78)
Total Nitrogen (mg/l) 1.10 (± 0.87) 1.50 (± 0.90)
2% (1 of 44) 8 % (6 of 78)
Phosphorus (mg/l) 0.25 (± 0.46) 0.28 (± 0.36)
7% (3 of 44) 13% (10 of 78)
Upper Granite Creek Watershed Improvement Plan, August 2012 101
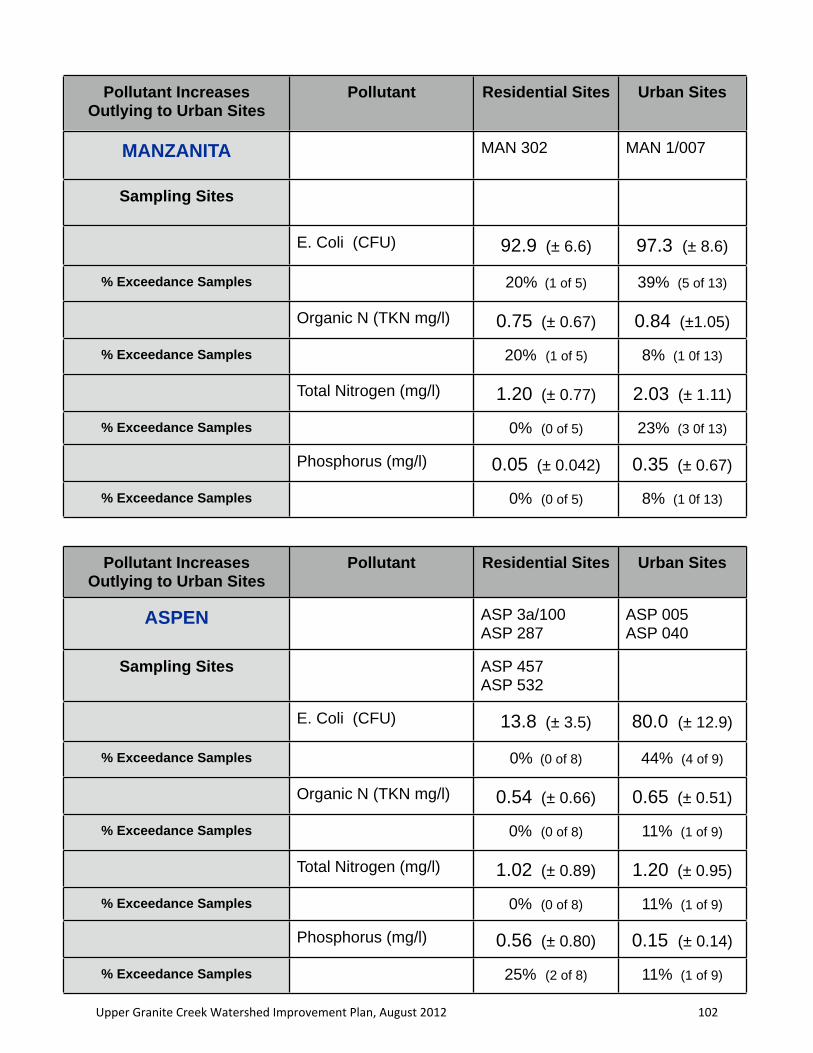
Pollutant Increases Outlying to Urban Sites
Pollutant Residential Sites Urban Sites
ASPEN
Sampling Sites
% Exceedance Samples
% Exceedance Samples
% Exceedance Samples
% Exceedance Samples
ASP 3a/100ASP 287
ASP 005ASP 040
ASP 457ASP 532
E. Coli (CFU) 13.8 (± 3.5) 80.0 (± 12.9)
0% (0 of 8) 44% (4 of 9)
Organic N (TKN mg/l) 0.54 (± 0.66) 0.65 (± 0.51)
0% (0 of 8) 11% (1 of 9)
Total Nitrogen (mg/l) 1.02 (± 0.89) 1.20 (± 0.95)
0% (0 of 8) 11% (1 of 9)
Phosphorus (mg/l) 0.56 (± 0.80) 0.15 (± 0.14)
25% (2 of 8) 11% (1 of 9)
Pollutant Increases Outlying to Urban Sites
Pollutant Residential Sites Urban Sites
MANZANITA
Sampling Sites
% Exceedance Samples
% Exceedance Samples
% Exceedance Samples
% Exceedance Samples
MAN 302 MAN 1/007
E. Coli (CFU) 92.9 (± 6.6) 97.3 (± 8.6)
20% (1 of 5) 39% (5 of 13)
Organic N (TKN mg/l) 0.75 (± 0.67) 0.84 (±1.05)
20% (1 of 5) 8% (1 0f 13)
Total Nitrogen (mg/l) 1.20 (± 0.77) 2.03 (± 1.11)
0% (0 of 5) 23% (3 0f 13)
Phosphorus (mg/l) 0.05 (± 0.042) 0.35 (± 0.67)
0% (0 of 5) 8% (1 0f 13)
Upper Granite Creek Watershed Improvement Plan, August 2012 102

Pollutant Increases Outlying to Urban Sites
Pollutant Residential Sites Urban Sites
MILLER
Sampling Sites
% Exceedance Samples
% Exceedance Samples
% Exceedance Samples
% Exceedance Samples
MIL 223MIL310
MIL020MIL 038
MIL 382MIL 620
E. Coli (CFU) 14.9 (± 5.2) 380.7 (± 9.0)
0% (0 of 15) 64% (9 of 14)
Organic N (TKN mg/l) 0.66 (± 0.57) 0.90 (± 0.61)
0% (0 of 15) 14% (2 of 14)
Total Nitrogen (mg/l) 0.99 (± 0.80) 1.83 (± 0.70)
0% (0 of 15) 7% (1 of 14)
Phosphorus (mg/l) 0.26 (± 0.45) 0.27 (± 0.29)
0% (0 of 15) 7% (1 of 14)
Pollutant Increases Outlying to Urban Sites
Pollutant Residential Sites Urban Sites
BUTTE
Sampling Sites
% Exceedance Samples
% Exceedance Samples
% Exceedance Samples
% Exceedance Samples
BUT 010BUT180
BUT 005
BUT 2
E. Coli (CFU) 38.8 (± 12.0) 98.3 (± 8.5)
25% (2 of 8) 38% (3 of 8)
Organic N (TKN mg/l) 0.63 * 1 sample 0.70 (± 0.46)
0% (0 of 1) 0% (0 0f 8)
Total Nitrogen (mg/l) 0.81 * 1 sample 1.42 (± 0.66)
0% (0 of 1) 0% (0 0f 8)
Phosphorus (mg/l) 0.06 1 sample 0.37 (± 0.35)
0% (0 of 1) 25% (2 0f 8)
Upper Granite Creek Watershed Improvement Plan, August 2012 103

Pollutant Increases Outlying to Urban Sites
Pollutant Residential Sites Urban Sites
North Fork Granite
Sampling Sites
% Exceedance Samples
% Exceedance Samples
% Exceedance Samples
% Exceedance Samples
NFG 058 NFG 025
E. Coli (CFU) 162.4 (± 45.6) 243.4 (± 19.5)
50% (1 of 2) 50% (4 of 8)
Organic N (TKN mg/l) 0.48 (± 0.14) 0.60 (± 0.27)
0% (0 of 2) 0% (0 of 8)
Total Nitrogen (mg/l) 1.77 (± 0.13) 1.57 (± 1.15)
0% (0 of 2) 13% (1 of 8)
Phosphorus (mg/l) 0.15 (± 0.05) 0.24 (± 0.18)
0% (0 of 2) 13% (1 of 8)
Pollutant Increases Outlying to Urban Sites
Pollutant Residential Sites Urban Sites
Upper Granite (South)
Sampling Sites
% Exceedance Samples
% Exceedance Samples
% Exceedance Samples
% Exceedance Samples
GRA 477GRA 561
GRA 063GRA 166
GRA 634GRA 710 / 811
GRA 321GRA 350
E. Coli (CFU) 24.8 (± 13.7) 251.5 (± 7.9)
23% (3 of 13) 46% (12 of 26)
Organic N (TKN mg/l) 0.77 (± 0.97) 0.74 (± 0.45)
0% (0 of 13) 15% (4 of 26)
Total Nitrogen (mg/l) 1.17 (± 1.06) 1.17 (± 0.70)
8% (1 of 13) 0% (0 of 26)
Phosphorus (mg/l) 0.14 (± 0.16) 0.28 (± 0.29)
8% (1 of 13) 15% (4 of 26)
Upper Granite Creek Watershed Improvement Plan, August 2012 104

Appendix B:
Microbial Source Tracking Methods and Results
Bacteria belonging to the genus Bacteroides have been suggested as alternative fecal indicators to E. coli
or fecal coliform. This is due to the fact that they make up a significant portion of the fecal bacteria
population, have little potential for re‐growth in the environment (unlike E. coli), and have a high degree
of host specificity that likely reflects differences in host animal digestive systems. A total of 46 samples
were collected across 23 sites across the watershed. Testing at the University of Arizona Maricopa
Agricultural Center has revealed that 91% of the samples collected within the project area were positive
for the human genetic marker, meaning that human bacteria were present in those samples.
Upper Granite Creek Watershed Improvement Plan, August 2012 105

Upper Granite Creek Watershed Improvement Plan, August 2012 106

Appendix B
WIP CreekSite ID Name Description Date EC MS S All Hu Bov
Sampled Allbac296 HF183 CowM2
GRA634 Granite abv confluence with Banning 12/8/2009 1299 0 0 +++ + +
MAN007 Manzanita abv confluence with Granite 12/8/2009 > 2419 0 220 +++ ++ +
BUT005 Butte Lower Butte 12/8/2009 > 2419 0 0 +++ + +
MIL038 Miller abv confluence with Butte 12/8/2009 > 2419 0 50 +++ + ‐
GRA350 Granite at Granite Creek Park 12/8/2009 > 2419 0 140 +++ ++ ‐
GRA063 Granite Watson Woods Preserve 12/8/2009 > 2419 0 130 +++ +++ ++
BAN002 Banning abv confluence with Granite 12/16/2009 63.1 NT NT +++ +++ ‐
MAN007 Manzanita abv confluence with Granite 12/16/2009 866.4 NT NT +++ + ‐
ASP020 Aspen abv confluence with Granite 12/15/2009 166.4 NT NT +++ ++ +
BUT005 Butte abv confluence with Miller 12/15/2009 85.7 NT NT +++ +++ +++
MIL038 Miller abv confluence with Granite 12/15/2009 75.4 NT NT +++ ‐ ‐
MIL620 Miller at headwaters 1/26/2010 0 0 <1 +++ ‐ ‐
MAN007 Manzanita abv confluence with Granite 1/26/2010 178.2 4 5 +++ ++ ‐
ASP100 Aspen at Middlebrook Rd. 1/26/2010 30.5 0 2 +++ + ‐
MIL310 Miller at Lower Pine Rd. 1/26/2010 9.7 0 5 +++ + ‐
MIL223 Miller at Downer Trail 1/26/2010 58.1 2 2 +++ ++ ‐
GRA063 Granite Watson Woods Preserve 1/25/2010 261.3 0 22 +++ +++ ‐
GRA350 Granite at Granite Creek Park 7/31/2010 > 2419 0 782 +++ ++ +
NFG025 North Fork Granite at 6th St. 7/31/2010 > 2419 0 183 +++ +++ ‐
MAN007 Manzanita abv confluence with Granite 10/5/2010 > 2419 0 403 +++ +++ ‐
BUT005 Butte abv confluence with Miller 10/5/2010 > 2419 0 406 +++ +++ ‐
MIL038 Miller abv confluence with Granite 10/5/2010 > 2419 0 1890 +++ + ‐
GRA063 Granite Watson Woods Preserve 10/5/2010 > 2419 40 500 ‐ ‐ ++
CFU/PFU/100 mL water† Bacteroides molecular genes‡
Upper Granite Creek Watershed Improvement Plan, August 2012 107

Appendix B
ASP005 Aspen Abv confluence with Granite 12/20/2011 1046.2 NT NT +++ +++ ++
NFG005 North Fork Granite At confluence with Granite Cr 12/20/2011 60.2 NT NT +++ +++ +++
NFG056 North Fork Granite At West Merritt St 12/20/2011 10.7 NT NT +++ +++ +++
MAN 3 Manzanita At Rolling Hills Dr. 12/20/2011 275.5 NT NT +++ ++ +++
MAN007 Manzanita abv confluence with Granite 12/20/2011 96 NT NT +++ + +++
MIL038 Miller abv confluence with Granite 12/20/2011 920.8 NT NT +++ +++ ++
MIL382 Miller Abv Thumb Butte Park 12/20/2011 41.4 NT NT +++ + +++
BUT180 Butte At Stricklin Park 12/20/2011 46.4 NT NT +++ ‐ ++
BUT005 Butte Abv confluence with Miller 12/20/2011 32.8 NT NT +++ +++ +
ASP 3b Aspen At Poplar Dr. 12/20/2011 190.4 NT NT +++ + +++
MIL038 Miller abv confluence with Granite 4/17/2012 1 <1 <1 +++ +++ +
MIL5 Miller North Fork of Miller abv Sunset 4/17/2012 9.6 <1 <1 +++ +++ ‐
MIL223 Miller at Downer Trail 4/17/2012 2 <1 <1 +++ + ‐
MIL382 Miller Abv Thumb Butte Park 4/17/2012 1 <1 <1 +++ ++ ++
MAN007 Manzanita abv confluence with Granite 4/17/2012 9.8 <1 <1 +++ +++ ++
MAN 3 Manzanita At Rolling Hills Dr. 4/17/2012 4.1 <1 <1 +++ + ‐
NFG005 North Fork Granite At confluence with Granite Cr 4/17/2012 44.8 40 <1 +++ +++ +
NFG 4 North Fork Granite In North Fork Grove, Las Fuentes Vill 4/17/2012 31.8 <1 <1 +++ +++ +
BUT005 Butte Abv confluence with Miller 4/17/2012 2 <1 <1 +++ +++ ‐
BUT180 Butte At Stricklin Park 4/17/2012 < 1 <1 <1 +++ +++ ‐
ASP005 Aspen Abv confluence with Granite 4/17/2012 248.1 <1 <1 +++ +++ +++
ASP100 Aspen at Middlebrook Rd. 4/17/2012 < 1 <1 <1 +++ +++ ‐
ASP287 Aspen at Rancho Vista Rd 4/17/2012 < 1 <1 <1 +++ +++ +
† EC, E.coli ; MS, Male Specific Phage; S, Somatic Phage.
‡ All, Total; Hu, Human; Bov, Bovine.
§ NT, not tested.
± PA, pending analysis.
Upper Granite Creek Watershed Improvement Plan, August 2012 108

Appendix C:
Watershed Residents’ Survey
A social survey of residents within the Upper Granite Creek Watershed was conducted between
December 15, 2009 and March 15, 2010. The survey was designed to gather information about
watershed residents’ knowledge of watershed and water quality issues; perceptions of water quality;
attitudes and values about protection and restoration of local water ways; and environmental
behaviors. The goal of the survey was to identify gaps in public knowledge to improve outreach and
education strategies associated with the WIP and project implementation. 1,482 survey responses were
received.
Upper Granite Creek Watershed Improvement Plan, August 2012 109

Upper Granite Creek Watershed Improvement Plan, August 2012 110

1. Of the following, which best fits your definition of what a watershed is? Area that retains water like a swamp or a marsh Water intake area that feeds a water treatment plant Area that drains into a specific water body None of the above Don’t know 2. Please write the name of the watershed within which you reside. ______________________________________ 3. Please name the creek or lake that you live closest to: ______________________________ 4. How concerned are you regarding the environmental condition of your local area? Not concerned Not very concerned Neutral Somewhat concerned Very concerned Don’t know 5. Compared to the condition of Prescott’s local waters (streams and lakes) 10 years ago, do you believe that the water bodies are: More polluted The same condition Less polluted Don’t know 6. The items listed below are sources of water pollution across the country. In your opinion, how much of a problem are the following in your area? PLACE AN X IN THE APPROPRIATE CATEGORY:
7. What is the most important factor affecting your perception of local water quality? State or federal agency reports Personal observation Media reports Local environmental group reports Don’t know Other, please list: 8. How important is the protection or restoration of Prescott’s water bodies? Not at all important Not important Neutral Somewhat important Very important Don’t know
Watershed Residents’ SurveyWatershed Residents’ SurveyWatershed Residents’ Survey Your opinion matters! The Granite Creek Watershed Improvement Council is working to improve watershed health and water quality in our creeks and lakes through a community planning effort. Public comment and participation is a critical part of this planning process. This survey is designed to collect citizen opinions on local watershed and water quality issues.
Please take a few minutes to complete this survey, and 1) return it with your utility payment, OR 2) drop it in a public library book
drop, OR 3) take it online at www.GraniteCreekWatershed.org. Please return by March 15, 2010.
Watersh
ed R
esiden
ts Survey
PO
Bo
x 3
00
4
Presco
tt, AZ
86
30
2
T TO O
RE
TU
RN
RE
TU
RN
TH
IST
HIS SU
RV
EY
SUR
VE
Y: :
1)In
clud
e it in
yo
ur u
tility p
ay
me
nt
OR
2
)Dro
p it in
a p
ub
lic libra
ry b
oo
k d
rop
O
R
3)T
ak
e it o
nlin
e a
t ww
w.G
ran
iteC
ree
kW
ate
rshe
d .org
a. Discharge from sewage treatment plants b. Soil erosion from construction sites c. Use of lawn fertilizers and pesticides d. Improper disposal of household wastes (ex. chemicals, batteries, fluorescent lights, used motor oil and/or antifreeze)
e. Inadequate or improperly maintained septic systems f. Inadequately maintained sewer system g. Manure from farm animals h. Urban storm runoff (paved roads, rooftops, parking lots) i. Lack of riparian buffers (a naturally vegetated area around streams or rivers) j. Commercial or industrial spill/runoff k. Homeless/Day laborers l. Improper disposal of pet waste m. Other (please list):
Not a
Problem
Don’t
know
Slight P
roblem
Moderate
Problem
Severe P
roblem
Upper Granite Creek Watershed Improvement Plan, August 2012 111

9. Current restoration efforts in your area are: Too little Just enough Too much Don’t know 10. Please indicate your level of agreement with the following statements. PLACE AN X IN THE APPROPRIATECATEGORY.
11a. Would you be willing to pay a monthly fee to support local watershed management activities? Yes No Don’t Know If no….skip to Q #12 11b. How much? (CHECK ONE): $0.50/mo. $1.00/mo. $1.50/mo. Other:_________ 12. Please rate the following reasons for the protection/restoration of water ways by their level of importance. PLACE AN X IN THE APPROPRIATE CATEGORY.
13a. Do you have a septic system? Yes No Don’t know if no….skip to Q 14 13b. What type of system is it? Standard Alternative Unknown 13c. Do you know what year it was installed? Yes No, if yes...when? ________ (yr) 13d. When did the system last receive maintenance? Within one year Within 5 years Within10 years Never Don’t know
14a. Do you own a dog? Yes No if no….skip to Q15 14b. Do you walk your dog? Yes No 14c. When on walks, how frequently do you pick up your dog’s waste? Never Rarely Sometimes Always 14d. When you pick up your dog’s waste, how do you dispose of it? Trash Can Compost Toilet Storm drain Other 15. Please indicate how frequently you do the following activities by PLACING AN X IN THE APPROPRIATE CATEGORY.
...And finally, a few questions about you… 16. How old are you? 18 -24 25-34 35-44 45-54 55-64 65-74 75+ 17. What is the highest grade in school you have completed? Some high school High school graduate/GED Some college/post high school 4-year college graduate Post-graduate Other: ______________ 18. Please indicate your average annual household income: <$14,999 $15-29,000 $30-49,999 $50-74,999 $75-99,999 >$100K 19. What is your gender? M F 20. What is your zip code? _____________ 20. What is your occupation? _____________________ Retired 21. Please list your hobbies/interests:________________________________________ 22. Are you interested in learning more about this project? Yes No
23. Please write any additional comments below:
Thank you for your participation!
a. My local waterways are unspoiled by pollution b. Pollution is affecting local fish and wildlife populations
c. Pollution is a problem that needs to be addressed
d. My everyday actions adversely affect water quality
e. One person can make a difference in improving local water quality
f. I know how to get involved with improving local water quality
g. The economic stability of my community depends upon good water quality
h. The quality of life in my community depends on good water quality in our creeks and lakes
i. It is important to protect water quality in order to promote economic development
Disagree
Strongly D
isagree
Agree
Don’t
know
Strongly A
gree
Neutral
Important
Don’t
know
Neutral
Not
important
Somew
hat im
portant
Very
Important
a. General environmental stewardship b. Protecting creeks and neighboring habitat for ecological value
c. Protecting creeks and neighboring habitat for wildlife
d. Protecting creeks and neighboring habitat for recreation and social/community value
If you have questions regarding this survey or the results, please contact: Amanda Richardson, Watershed Program Coordinator · (928) 445-5669 · [email protected]
a. Harvest rainwater b. Recycle c. Compost kitchen/organic waste d. Use the local Greenways Trail system
Never Rarely Some- times
Often Don’t Know
My mailing and/or e-mail address is:
If ye
s….
Upper Granite Creek Watershed Improvement Plan, August 2012 112

Appendix D:
Watershed Residents’ Survey Analyses
Those many residents who responded to the survey (numbering 1,482) were mostly strong in favoring
protection and restoration of water quality and ecological vitality of the creek and lake system. Variation
in respondent knowledge and awareness of pollution sources was analyzed in conjunction with
variability in commitment to learning more about the topic, willingness to pay a monthly fee to assist
watershed protection and maintenance, involvement in recycling, learning of household and community
wide pollution sources, and following government and agency reports on water quality.
Upper Granite Creek Watershed Improvement Plan, August 2012 113

Upper Granite Creek Watershed Improvement Plan, August 2012 114

Comparison: Yes/No on a Monthly Fee; Amount of Fee Suggested; Other Items
No, on Fee
N = 715No,
Flat No
No,Donʼt Know
N = 372
N = 343
$4+
$3
$2
$1.50
N = 86
N = 211
N = 339
N = 131
N = 372, 25.1% No, Flat No
N = 343, 23.1% No, Donʼt Know
N = 86, 5.8% Yes $4+
N = 211, 14.2% Yes $3
N = 339, 22.9% Yes $2
N = 131, 8.8% Yes $1.50
Yes, FeeAmt:
N = 767
The survey question (below) on willingness to pay a monthly fee for watershed support proves to be essential for assessment of instrumentality, or commitment. Other ratings such as for willingness to learn more, demographic variables, or aggregate ratings of protection, restoration or action orientations can be compared to the Fee question, to the willingness to provide substantive support. Two classes of pollution sources are identified, differentially related to support for a fee, which may offer insights into current perceptions of pollution threats. The two classes, apparently viewed as more, or less, comprehensible and surmountable may help steer outreach efforts.
Summary of Findings on Fee Endorsement Those responding Yes to a fee and higher amounts were:! Higher income; Younger; Likely female! More demanding interests; Willing to learn more! More knowledge demanding occupation! Correct in naming the watershed, and a nearby creek
Aggregated scoring on items of concern and focus: Respondents favoring a Fee rated stronger on:! Protection, Restoration, Action, and Knowledge
Importance ratings on pollution sources: Respondents favoring a Fee saw more problems with:! Sources which were less obvious or understandable;! Lack of riparian buffers! Storm runoff from roads or roofs! Soil erosion from construction sites! Lawn fertilizers and pesticides! and those favoring fees saw a bit less threat from ! sources more obvious, and more readily repairable:! Sewer system not maintained! Septic systems not maintained! Manure from farm animals! Commercial or industrial spills
! More and Less Obvious sources of pollution were ! discerned, which contrasted in scoring on importance! between respondents who chose No, Flat no on the fee,! and those who chose Donʼt know. More and Less ! “Obvious” sets were further analyzed with correlation ! and patterns of scoring on importance, to better ! interpret the vague meaning of “obvious” as a basis for ! the quantitative differences for the two sets of items.
! A preliminary conclusion based on correlation with other ! respondent emphases such as Protection, Restoration! or Action suggest those sources seen as More Obvious! are those that are both more easily comprehended! and also more easily fixed (though perhaps expensive),! such as Sewer and Septic sources. Less Obvious then ! seemed to suggest less easily comprehended, and less! readily corrected, but paradoxically rated as a more ! important, or threatening source of pollution.
! If respondents are identifying those pollution sources ! which they see as needing clarification, and perhaps ! also somewhat more threatening, that would seem to! offer a green light for education and awareness efforts.
Q11a Would you be willing to pay a monthly fee to support local watershed management activities? Yes No Donʼt Know
Q11b How much? $0.50/mo $1.00/mo $1.50/mo Other
Upper Granite Creek Watershed Improvement Plan, August 2012 115

Comparison: Yes/No on a Monthly Fee; Amount of Fee Suggested; Other ItemsOlder
9% 27% 31% 21% 12%
20% 30% 27% 16% 7%
19% 37% 17% 21% 5%
No, on
FeeN=715 48%
Yes, on
FeeN=767 52%
16% 26% 33% 19% 7% $4+
$3
Amount would
pay
$2
$1.50
11%
28%
44%
17%
Q 16 How old are you?
75+ yrs65 -75 yrs
55 -65 yrs45 -55 yrs
18 -45 yrs
Older
Yes $4+$3$2
$1.50No and No SeNo Se
No (only)
4.0 3.5 3.0
Age brackets identified by respondents were given values, 1 to 5, and averaged separately for the half choosing No on the Fee, and the categories among those choosing Yes on the Fee but with differing amounts. The average age scoring is represented by the positioning of the blocks, here groups with Older average ages to the left. The data points in the plot at the bottom of the page are arranged similarly, with .
Scoring is adjusted to an identical scale for all items. Here an average “score” on age, 3.5, represents near 60 years old.
26% 28%" 24% 17% 6%
Age interacts with household income, in determining fee amount, perhaps with those willing to suggest $3 being youngest, but not the highest income bracket (shown elsewhere).
The data points, color coded, include the Yes of the various Fee groups, and the combined group of No and No Se (Donʼt know). Those two groups have separate data points, light and dark gray, near the bottom of the plot. They are important for the data analysis in subsequent pages.
Trend lines are fitted to the data points “by eye” to indicate trends over the entire set of groups on the willingness to pay a fee. Here the slope is to the right indicating lower ages in more fee endorsing groups.
Both No, Flat Noand No, Donʼt know
Upper Granite Creek Watershed Improvement Plan, August 2012 116

Comparison: Yes/No on a Monthly Fee; Amount of Fee Suggested; Other ItemsHigher Income
17% 17% 24% 31% 7% 4%
13% 12% 25% 40% 5% 4%
8% 6% 19% 44% 16% 8%
No, on
FeeN=715 48%
Yes, on
FeeN=767 52%
23% 13% 21% 29% 11% 1% $4+
$3
Amount would
pay
$2
$1.50
11%
28%
44%
17%
Q 18 Please indicate your average annual household income
< $15
10% 10% 18%" 43% 13% 5%
$100 k + $75-100 k
$50-75 k $30-50 k $15-30 k
Higher Income
Yes $4+$3$2
$1.50No and No SeNo Se
No (only)
4.0 3.5 3.0
That those who can afford another bite at their income would favor a fee, and be willing to pay more, is not surprising. But as noted below, there is a clear fall-off in household income for those who agree to a small fee, and also those who choose No, Donʼt know on the Fee, compared to Flat No.
The greater decline in household income for the group suggesting $1.50/mo is matched by this groupʼs older age, less education much higher likelihood of being female. Analyses (elsewhere) have also indicated a larger proportion of those who are lower income females say No to a Fee.
Both No, Flat Noand No, Donʼt know
Scoring is adjusted to an identical scale for all items. Here an average “score” on income, 3.5, represents near $50K/a.
The cluster of data points for those favoring fee amounts over $1.50 is off to the left creating a low slope to the trend line. But the lower income of those who responded Donʼt know, compared to those who flat rejected a fee, creates an opposite slope. This is very atypical; those who Donʼt know usually score closer to those favoring a low fee.
Upper Granite Creek Watershed Improvement Plan, August 2012 117

Comparison: Yes/No on a Monthly Fee; Amount of Fee Suggested; Other ItemsFemales, more than Males
" 43% 57%
50% 50%
54% 46%
No, on
FeeN=715 48%
Yes, on
FeeN=767 52%
42% 58%
Q 23 Gender
% Female% Male
43% 57%"
$4+
$3
$2
$1.50
11%
28%
44%
17%
Amount would
pay
Yes $4+$3$2
$1.50No and No SeNo Se
No (only)
4.0 3.5 3.0
Both No, Flat Noand No, Donʼt know
The gender make-up of the groups is irregular, with males predominating among those say Yes, and suggest a higher fee, and also predominating among those who say No to a fee (especially those saying Flat No, seen in plot below)
The gender proportion differences are not great, but present an unexpected pattern. Males are more generous on fee amounts, but then are also more likely to reject a fee outright.
The slope of the trend line is to the right, when the No and No Se data point is left out. The trend line slopes the opposite way between the No (only) and No Se groups.
Upper Granite Creek Watershed Improvement Plan, August 2012 118

Comparison: Yes/No on a Monthly Fee; Amount of Fee Suggested; Other ItemsMore sophisticated source of information
27% 22% 46% 5%
28% 23% 44% 5%
24% 24% 41% 11%
No, on
FeeN=715 48%
Yes, on
FeeN=767 52%
33% 23% 38% 6% $4+ .
$3
Amount would
pay
$2
$1.50
11%
28%
44%
17%
Q 7 (Information Source) What is the most important factor affecting your perception of local water quality?
Local environmental group reportsState or federal agency reports
Media reports or personal observation
Donʼt know 18% 22%" 48% 13%
More sophisticated source of information
Yes $4+$3$2
$1.50No and No SeNo Se
No (only)
4.0 3.5 3.0
Both No, Flat Noand No, Donʼt know
Sophistication in oneʼs information source noted as most important is central to awareness efforts. The voluntary survey responses are likely biased toward government and non-profit groups as sources, but particularly relevant to Prescott is the emphasis on media sources. What local media, with what reach, touch on watershed issues?
Here, a typical trend line for change over the scale from Yes, high fee, to No, Flat No is seen, with very similar slope for both the overall comparison across groups to the difference between No, Flat No and No, No Se.
Respondentsʼ indication of more sophisticated information source was correlated with other measures of Knowledge, and a bit less well correlated for the No, Flat No group.The No, No Se group showed a stronger correlation between Info Source and Knowledge, especially compared to the No, Flat No group, suggesting their failure to check Yes on the Fee was not due to lack of awareness, rather maybe a disinclination to flatly reject a fee.
Knowledge
1
2
3
4
5
6
6 9 12 15 18 21 24
Info
rmat
ion
Sour
ce
No, Flat No r = 0.51
Info
rmat
ion
Sour
ce
1
2
3
4
5
6
6 9 12 15 18 21 24
No, No Se r = 0.64
Knowledge
Knowledge and pre-ference for Information source are only a bit less correlated for for the No, Flat No group of nay- sayers on the fee, but the lower slope of the calculated trend line illustrates the lack of No, Flat No respondents with high Knowledge and preference for reliable sources (square), as well as a greater number with high knowledge but preferring media sources or not choosing (circle).
Correlation plots do not show each and every respondent as a discreet circle. Each circle may represent a half dozen scorers.
Upper Granite Creek Watershed Improvement Plan, August 2012 119

Comparison: Yes/No on a Monthly Fee; Amount of Fee Suggested; Other ItemsLearn More Yes/No AND Name Watershed Correct/Incorrect
" 45% 23% 18% 13%
37% 27% 17% 19%
28% 28% 18% 26%
No, on
FeeN=715 48%
Yes, on
FeeN=767 52%
50% 21% 17% 12%
Q 23 Learn more Yes/No AND Q 2 Name Watershed" Correct/Incorrect
Yes AND CorrectYes AND Incorrect
No AND CorrectNo AND Incorrect
19% 18%" 26% 37%
$4+
$3
$2
$1.50
11%
28%
44%
17%
Amount would
pay
Yes $4+$3$2
$1.50No and No SeNo Se
No (only)
4.0 3.5 3.0
Both No, Flat Noand No, Donʼt know
Average on Learning more AND Naming of the watershed correctly show a clear shift from the strongest endorsements of the fee, to the strongest rejections (No, Flat No). Fifty percent of those suggesting $4 or more for the fee checked the box to learn more at the end of the survey, and correctly named their watershed at the beginning of the survey. Forty five percent of those suggesting $3 were knowledgeable and wanted to learn more.
The trend lines are low, indicating strong differences in scoring along the scale of fee endorsement. Here too the No, No Se group performs more like a low fee group than a rejection group, while the naysayers differentiate themselves to the lowest scoring on the joint markers of interest and awareness.
While the choice at the end of the survey to Learn more reflected concordance with the watershed concerns noted through the survey, the ability to name the watershed assessed respondent awareness. The combination was thought to select the most thoughtful respondents, and indeed showed a strong relationship to responses on the fee.
Upper Granite Creek Watershed Improvement Plan, August 2012 120

Comparison: Yes/No on a Monthly Fee; Amount of Fee Suggested; Other ItemsProtection items
No Fee
YesFee
Amt:$4+ .
$3 .
$2
$1.50
Restoration items
Yes $4+$3$2
$1.50No and No SeNo Se
No (only)
4.0 3.5 3.0 4.0 3.5 3.0
Q4,Q8, Q10h, Q12a,b,c,dItems (7) Protection theme33 -34
31 -32 27 -30
21 -26
18% 11% 34% 20% 16%
10 -20
8% 33% 20% 35% 4%
Q5, Q9, Q10a,b,c,g,iItems (7) Restoration theme30 -33
25 -29 21 -24
15 -209 -14
58% 19% 19% 5% 0
51% 23% 21% 4% 0
44% 20% 29% 6% 0
28% 18% 40% 10% 3%
30% 45% 13% 10%1%
30% 49% 9%11%
19% 47% 17% 17%
17% 39% 24% 19% 2%
4.0 3.5 3.0
More difference Protection minus Restoration
More approval Restoration items
More approval Preotection items
** Comments to these findings are on the next page, overlying the data.
Upper Granite Creek Watershed Improvement Plan, August 2012 121

Comparison: Yes/No on a Monthly Fee; Amount of Fee Suggested; Other ItemsProtection items
No Fee
YesFee
Amt:$4+ .
$3 .
$2
$1.50
Restoration items
Yes $4+$3$2
$1.50No and No SeNo Se
No (only)
4.0 3.5 3.0 4.0 3.5 3.0
Q4,Q8, Q10h, Q12a,b,c,dItems (7) Protection theme33 -34
31 -32 27 -30
21 -26
18% 11% 34% 20% 16%
10 -20
8% 33% 20% 35% 4%
Q5, Q9, Q10a,b,c,g,iItems (7) Restoration theme30 -33
25 -29 21 -24
15 -209 -14
58% 19% 19% 5% 0
51% 23% 21% 4% 0
44% 20% 29% 6% 0
28% 18% 40% 10% 3%
30% 45% 13% 10%1%
30% 49% 9%11%
19% 47% 17% 17%
17% 39% 24% 19% 2%
4.0 3.5 3.0
More difference Protection minus Restoration
More approval Restoration items
More approval Protection items
Additive scoring of the 7 items in each aggregate were distributed as shown, to reflect typical scoring on single items. Average scores were calculated to be used for the position and slope comparisons at the bottom of the page.
For these two aggregate indicators of reasons and means of watershed support, the No group is off in the opposite direction, to the right, with lower scoring, seen in the positions here and in the plots below.
The differences in scoring for the two aggregates, Protection scores minus Restoration, should be near zero if there is little difference in the valuation of the two concepts. Thus the slope of the differences in scoring across fee endorsement groups should be nearly vertical. Here the slope favors Protection as the concept more closely related to fee endorsement. The higher fee amount groups are stronger on protection, and naysayers are more rejecting of protection statements.
Slopes of the trend lines reveal the strength of the relationship between the aggregate measure (Protection or Restoration) and endorsement of a fee.The lower slope for Protection indicates a stronger fee endorsement matches greater Protection concerns.
Additional explanation of the Protection with Restoration comparison is on the next page.
Upper Granite Creek Watershed Improvement Plan, August 2012 122

Comparison: Yes/No on a Monthly Fee; Amount of Fee Suggested; Other ItemsProtection items
No Fee
YesFee
Amt:$4+ .
$3 .
$2
$1.50
Restoration items
Yes $4+$3$2
$1.50No and No SeNo Se
No (only)
4.0 3.5 3.0 4.0 3.5 3.0
Q4,Q8, Q10h, Q12a,b,c,dItems (7) Protection theme33 -34
31 -32 27 -30
21 -26
18% 11% 34% 20% 16%
10 -20
8% 33% 20% 35% 4%
Q5, Q9, Q10a,b,c,g,iItems (7) Restoration theme30 -33
25 -29 21 -24
15 -209 -14
58% 19% 19% 5% 0
51% 23% 21% 4% 0
44% 20% 29% 6% 0
28% 18% 40% 10% 3%
30% 45% 13% 10%1%
4.0 3.5 3.0
More difference Protection minus Restoration
More approval Restoration items
More approval Protection items
(7) items on protection theme:
Q4 How concerned...environmental condition...your local areaQ8 How important...protection...water bodiesQ10h Quality of life...depends, water qualityQ12a Protect creeks...general stewardshipQ12b Protect creeks...ecological valueQ12c Protect...habitat for wildlifeQ12d Protect...social/community value
(7) items on restoration theme:
Q5 Compared...10 years ago...water bodies are: __ More polluted? __Less polluted?Q9 Current restoration efforts: __Too little? __Just enough? __Too much?Q10a Waterways unspoiled… (inverted)Q10b Pollution affecting wildlifeQ10c Pollution...problem...needs addressingQ10g Economic stability depends...water...Q10i Important...water quality...development
30% 49% 9%11%
19% 47% 17% 17%
17% 39% 24% 19% 2%
12
18
24
30
36
6 12 18 24 30 36
12
18
24
30
36
6 12 18 24 30 36
Restoration
Prot
ectio
n
Restoration
Prot
ectio
n
Yes $3 - $4+ r = 0.49
No, Flat No r = 0.65
Correlation: Protection with" RestorationYes $3 - $4+" 0.49Yes $1.50 - $2 " 0.43No, No Se " 0.58No, Flat No" 0.65
Protection and Restoration were well correlated for all groups, with No, Flat No showing the highest similarity in scoring. But one of the shortcomings of correlation is evident in the plots, where the closer fit the the line for the lower No group is an artifact of the shorter ranges of higher scoring on both Protection and Restoration for the top Yes $3 to $4+ group.
Survey items with the Protection theme garner more positive responses than those with the Restoration theme, but it is the Restoration emphasis that differentiates those with more of an economic than ecological set of concerns (noted elsewhere), and loses its positive relationship with Action and Knowledge for those identified on this analysis as those who are No, Flat No, on the fee.
Though the correlations are high between Protection and Restoration, the drop-off in those who rate both values highly is seen clearly in this comparison of those who most strongly endorse the fee and those who reject it.
Upper Granite Creek Watershed Improvement Plan, August 2012 123

Comparison: Yes/No on a Monthly Fee; Amount of Fee Suggested; Other ItemsKnowledge items
No Fee
YesFee
Amt:$4+
$3
$2
$1.50
Action items
Yes $4+$3$2
$1.50No and No SeNo Se
No (only)
4.0 3.5 3.0 4.0 3.5 3.0
Q3, Q7 Q10f, Q17, Q21Items (5) Knowledge theme20 -24
18 -19 16 -17
13 -15
11% 10% 26% 28% 25%
8 -16
10% 17% 19% 32% 23%
Q10e, Q15b,c,d, Q22Items (5) Action theme
19 -2317 -18
15 -1612 -14
6 -11
4.0 3.5 3.0
29% 13% 20% 21% 17%
27% 12% 31% 20% 9%
27% 12% 29% 25% 14%
12% 16% 28% 23% 21%
28% 17% 29% 19% 7%
33% 18% 21% 20% 8%
25% 22% 23% 21% 9%
18% 21% 24% 25% 12%
More difference Knowledge minus Action
More approval Action items
More approval Knowledge items
** Comments to these findings are on the next page, overlying the data.
Upper Granite Creek Watershed Improvement Plan, August 2012 124

Comparison: Yes/No on a Monthly Fee; Amount of Fee Suggested; Other ItemsKnowledge items
No Fee
YesFee
Amt:$4+
$3
$2
$1.50
Action items
Yes $4+$3$2
$1.50No and No SeNo Se
No (only)
4.0 3.5 3.0 4.0 3.5 3.0
Q3, Q7 Q10f, Q17, Q21Items (5) Knowledge theme20 -24
18 -19 16 -17
13 -15
11% 10% 26% 28% 25%
8 -16
10% 17% 19% 32% 23%
Q10e, Q15b,c,d, Q22Items (5) Action theme
19 -2317 -18
15 -1612 -14
6 -11
4.0 3.5 3.0
29% 13% 20% 21% 17%
27% 12% 31% 20% 9%
27% 12% 29% 25% 14%
12% 16% 28% 23% 21%
28% 17% 29% 19% 7%
33% 18% 21% 20% 8%
25% 22% 23% 21% 9%
18% 21% 24% 25% 12%
More difference Knowledge minus Action
More approval Action items
More approval Knowledge items
Scoring on both Knowledge and Action was similar over the Yes groups to the No group on the fee, so the difference scores for the two aggregates, Knowledge score minus Action score, showed a steep slope, favoring Action.Scoring was similar for No, Flat No and No, No Se groups here, but the correlations tell a different story(scatter plots at left), with lack of relationship between the variables for the No, Flat No group.
The Pattern that emerges from the scoring and correlation comparisons of the Yes groups, and the two No groups, is that the No, Flat No group is nay-saying on more than the Fee, with a less cogent relationship among variables like Knowledge and Action, Protection and Restoration. Perhaps while awareness measures can be tailored to those with one basis or another for their concerns about the watershed, there may be little that can influence the substantial cohort of nay-sayers.
(5) items with a Knowledge ThemeQ3 Name closest creek (correctly)Q7 Which is ...important…(source): __Environ. grps, _Gov grps,_MediaQ10f I know how...improve...waterQ17 Ed. level: HS, Some college …Q21 Hobbies/Interests: rated for knowledge, activity, social demands
(5) items with a Action ThemeQ10e One person makes a diff-erence...improve water qualityQ15b How frequently...recycleQ15c How frequently...compostQ15d How freq...use GreenwaysQ22 Are you interested...learning more about this project: _Yes_No
1216202428323640
4 8 12 16 20 24
1216202428323640
4 8 12 16 20 24
Correlation: Action with" RestorationYes $3 - $4+" 0.34Yes $1.50 - $2 " 0.36No, No Se" 0.45No, Flat No" 0.15
The regression trend line is very low for the No, Flat No group for the correlation of Action with Restoration, there is almost no relationship for that group. For the No, No Se group there is a relation ship, as for the Yes groups noted in the table above. Similarly with Protection and Knowledge, the No, Flat No group shows lower correlations than the Yes or No, No Se groups.
No, No Se r = 0.45
No, Flat No r = 0.15
Restoration
Restoration
Act
ion
Act
ion
Slopes for Knowledge and Action over the fee endorsement scale from Yes to No were nearly identical. The two aggregates were independent of each other but paralleled fee preferences, except for the No, Flat No group where the parallel dissipated.
Upper Granite Creek Watershed Improvement Plan, August 2012 125

More pollution (less obvious sources)
YesFee
Amt:
More pollution (more obvious sources)
Yes $4+$3$2
$1.50No and No SeNo Se
No (only)
4.0 3.5 3.0 4.0 3.5 3.0
4.0 3.5 3.0
30% 27% 24% 13% 6%
10% 18% 37% 21% 14%
8% 19% 38% 23% 12%
6% 24% 36% 26% 9%
5% 15% 40% 26% 14%
6% 11% 37% 24% 21%
No, on Fee
N = 715No,
Flat No
No,Donʼt Know
N = 372
N = 343 15% 21% 40% 15% 10% 8% 12% 42% 23% 16%
$4+ .
$3 .
$2
$1.50
N = 86
N = 211
N = 339
N = 131
28% 31% 26% 12% 2%
20% 27% 29% 17% 2%
More pollution Less obvious sources
More difference More obvious minus Less obvious sources
More pollution More obvious sources
Comparisons: More / less “obvious” pollution sources, for Yes, No Se, No, on Fee
** Comments to these findings are on the next page, overlying the data.Listings of these six contrasting sources, and reduced sets of four, are three pages down.
The distinction between the halves of pollution source items called less or more “obvious” derives from the differences in the scoring for the No, Flat No and No, No Se groups. The distinction offered an opportunity to classify pollution sources for perhaps more directed outreach strategies.
6-1222-25 17-21 13-16
26-30
6% 10% 30% 31% 24%
Q6 e,f,g, j,k,l (6) clear sources
6-1222-25 17-21 13-16
7% 13% 32% 21% 28%
26-30Q6 a,b,c,d, h,i (6) vague sources
Upper Granite Creek Watershed Improvement Plan, August 2012 126

More pollution (less obvious sources)
YesFee
Amt:
More pollution (more obvious sources)
Yes $4+$3$2
$1.50No and No SeNo Se
No (only)
4.0 3.5 3.0 4.0 3.5 3.0
Q6 a,b,c,d, h,i (6) vague sources
6-1222-25 17-21 13-16
7% 13% 32% 21% 28%
26-30
4.0 3.5 3.0
30% 27% 24% 13% 6% 8% 19% 38% 23% 12%
6% 24% 36% 26% 9%
5% 15% 40% 26% 14%
6% 11% 37% 24% 21%
No, on Fee
N = 715No,
Flat No
No,Donʼt Know
N = 372
N = 343 15% 21% 40% 15% 10%
Q6 e,f,g, j,k,l (6) clear sources
6-1222-25 17-21 13-16
26-30
6% 10% 30% 31% 24%
8% 12% 42% 23% 16%
$4+ .
$3 .
$2
$1.50
N = 86
N = 211
N = 339
N = 131
28% 31% 26% 12% 2%
20% 27% 29% 17% 2%
More pollution Less obvious sources
More difference More obvious minus Less obvious sources
More pollution More obvious sources
Comparisons: More / less “obvious” pollution sources, for Yes, No Se, No, on Fee
The weaker ratings and steeper slope for the More Obvious sources is key to the view of these as easily remediated.
There was more dismissal of the Less Obvious sources of pollution, lower scoring (rightward shift) by those who were flat-out No on the fee compared to those No, No Se, who left the fee question blank or checked Donʼt know.
There was less difference between No, Flat No and No, No Se groups for the More Obvious sources of pollution.
10% 18% 37% 21% 14%
While there was more dismissal of the Less Obvious sources as a pollution problem for the No, Flat No group, there were ever stronger indications of the sources as a problem for the Yes, on fee groups. The higher the amount of fee suggested, the more the citing of problems with the Less Obvious set of sources. this is see with the leftward scores indicated by block location (above) and low slope in the data point plot (below).
The slope of the trend line for the difference, More obvious minus Less obvious for each group is counterintuitive. It slopes in the direction of negative differences for the highest fee endorsement groups. The Less obvious sources are seen as more of a pollution threat for each group from Yes, higher fee, to No.
Upper Granite Creek Watershed Improvement Plan, August 2012 127

More pollution (less obvious sources)
YesFee
Amt:
More pollution (more obvious sources)
Yes $4+$3$2
$1.50No and No SeNo Se
No (only)
4.0 3.5 3.0 4.0 3.5 3.0
Q,b,c, h,i (4 items) Runoff,spills
4-7
15-1811-148-10
4% 14% 36% 19% 28%
19-20
4.0 3.5 3.0
20% 36% 27% 13% 5%
7% 19% 44% 18% 14%
15% 40% 31% 7% 7%
19% 35% 33% 4% 9%
13% 31% 34% 8% 15%
11% 18% 32% 18% 32%
No, on Fee
N = 715No,
Flat No
No,Donʼt Know
N = 372
N = 343 8% 29% 40% 14% 10%
Q e,f,g, j (4 items) Sewer, septic
4-7
14-1711-138-10
18-20
8% 18% 30% 16% 28%
12% 21% 43% 10% 15%
$4+ .
$3 .
$2
$1.50
N = 86
N = 211
N = 339
N = 131
19% 40% 28% 9% 3%
13% 37% 27% 15% 9%
More pollution Less obvious sources
More difference More obvious minus Less obvious sources
More pollution More obvious sources
Comparisons: More / less “obvious” pollution sources, for Yes, No Se, No, on Fee
The original 6 items were reduced to 4 Less and More obvious sources, for reasons of excess variability in the two items removed in each case. All items are listed on the next page.
For the reduced set of 4 items, the difference between No, Flat No and No, No Se is still very similar for both Less and More obvious pollution sources.
Upper Granite Creek Watershed Improvement Plan, August 2012 128

More pollution (less obvious sources)
YesFee
Amt:
More pollution (more obvious sources)
Yes $4+$3$2
$1.50No and No SeNo Se
No (only)
4.0 3.5 3.0 4.0 3.5 3.0
Q,b,c, h,i (4 items) Runoff,spills
4-7
15-1811-148-10
4% 14% 36% 19% 28%
19-20
4.0 3.5 3.0
20% 36% 27% 13% 5%
7% 19% 44% 18% 14%
15% 40% 31% 7% 7%
19% 35% 33% 4% 9%
13% 31% 34% 8% 15%
11% 18% 32% 18% 32%
No, on Fee
N = 715No,
Flat No
No,Donʼt Know
N = 372
N = 343 8% 29% 40% 14% 10%
Q e,f,g, j (4 items) Sewer, septic
4-7
14-1711-138-10
18-20
8% 18% 30% 16% 28%
12% 21% 43% 10% 15%
$4+ .
$3 .
$2
$1.50
N = 86
N = 211
N = 339
N = 131
19% 40% 28% 9% 3%
13% 37% 27% 15% 9%
More pollution Less obvious sources
More difference More obvious minus Less obvious sources
More pollution More obvious sources
Comparisons: More / less “obvious” pollution sources, for Yes, No Se, No, on Fee
With the reduced set of four pollution sources, with less variability, the scoring patterns are very similar: The Less obvious sources have a lower slope, more dramatically increasing pollution threat ratings from the most fee endorsing, highest suggested fee groups, as seen in the lower slope.
4 items; Less Obvious sourcesQ6b Soil erosion…constructionQ6c Lawn fertilizer...pesticidesQ6h Urban runoff...roads, roofsQ6i Lack of riparian buffersAdditional items in original 6Q6a Discharge...sewage treatmentQ6d Improper disposal...household wastes (Chemicals oil)
The reduced set of four More obvious sources still has a bit higher slope.
4 items; More Obvious sourcesQ6e Inadequately maintained septicQ6f Inadequately maintained sewerQ6g Manure from farm animalsQ6j Commercial spill/RunoffAdditional items in original 6Q6k Homeless/day laborersQ6l Improper disposal of pet waste
The differences, More obvious minus Less obvious, still have a rightward sloping trend line, but it is nearer to vertical, indicating that the differences are not that more pronounced for the highest fee endorsement groups compared to the lesser fee amount groups, except for those rejecting a fee.
More analysis follows on the next pages, concerned with the distinction between More and Less Obvious sources of pollution.
Upper Granite Creek Watershed Improvement Plan, August 2012 129

.44
.40.43
.41.54
.52
(b) Road, roof runoff
(c) Lawn fertilizer, pesticide
(b) Construction site erosion
(i) Lack of riparian buffer
.54
.44.49
.47
.48.49
(i) Lack of riparian buffer
(b) Road, roof runoff
(c) Lawn fertilizer, pesticide
(b) Construction site erosion
.51
.50
.46
.48
.44.48
(i) Lack of riparian buffer
(b) Road, roof runoff
(c) Lawn fertilizer, pesticide
(b) Construction site erosion
No, Flat No, on Fee N=372
No, Donʼt know, on Fee N=343
$1.50 - $2.00, on Fee N=470
$3.00 - $4.00+, on Fee N=297
Those who did not commit on the Fee showed a clearly lower correlation, greater distance, between Construction erosion and Road, roof runoff, though they saw both as a problem (larger circles).
Those who flat out rejected the Fee showed clearly less concern for these four pollution sources (smaller circles), and modest correlations among the sources (shorter lines are higher correlations. The Flat No group dismissed all four of the less obvious pollution sources, and did not discriminate much among the four.
Comparisons: More / less “obvious” pollution sources, for Yes, No Se, No on FeeImportance scoring and correlations, (scaled as Percent Variance Accounted For, r 2 ).Circle diameters are average importance scoring; separating lines show similarities in scoring as shorter lines.
For this modest Fee endorsement group, and the higher amount suggested below, Lack of riparian buffer and Road, roof run off were scored similarly, as sources, but Road runoff and Lawn chemicals were not scored similarly, thus questioning any literal, visual or conceptual basis for “less obvious”.
Less “obvious”pollution sources
Elsewhere noted as more sophisticated, the higher Fee amount advocates may be expected to be more discriminating, thus producing lower correlations.
“Less obvious” could mean requiring more inference, such as for the means by which erosion is a source versus how lack of buffer is a source.
The jump in scoring from Flat No to Donʼt know could be a jump from resistance to something not easily imagined, to acceptance of a problem, albeit with little understanding.
.42.46
.39
.49
.45
.51 (b) Construction site erosion
(i) Lack of riparian buffer
(b) Road, roof runoff
(c) Lawn fertilizer, pesticide
For this and subsequent analyses the four levels of Yes, with fee amounts, are reduced to two Yes groups: $1.50 up to $2, and $3 to $4+. The intent was to rarefy comparisons, emphasizing No, Flat No versus No, No Se differences.
Upper Granite Creek Watershed Improvement Plan, August 2012 130

.49
.52
.43 .48
.61
.46
.40 .53
.44 .51
.42 (e) Septic systems not maintained
(d) Manure from Farm animals
(j) Commercial, industrial spill or runoff
(f) Sewer system not maintained
.58
No, Flat No, on Fee N=372
.45
.42 .49 .50
.54 .59
(j) Commercial, industrial spill or runoff
(f) Sewer system not maintained
(d) Manure from farm animals
(e) Septic systems not maintained
No, Donʼt know, on Fee N=343
(j) Commercial, industrial spill or runoff
(f) Sewer system not maintained (e) Septic systems
not maintained
(d) Manure from farm animals
$1.50 - $2.00, on Fee N=470
.55
.39
.37
.31
.39 .41
(e) Septic systems not maintained
(j) Commercial, industrial spill or runoff
(d) Manure from farm animals
(f) Sewer system not maintained
$3.00 - $4.00+, on Fee N=297
For all Fee endorsement groups Manure from farm animals and Septic systems were closely correlated (high values, short distances) and farm manure and Sewer systems were more distantly correlated. (The correlations within this More obvious cluster, and within the Less obvious cluster, are all higher than between items in the two different clusters.)
Comparisons: More / less “obvious” pollution sources, for Yes, No Se, No, on FeeImportance scoring and correlations, (scaled as Percent Variance Accounted For, r 2 ).Circle diameters are average importance scoring; separating lines show similarities in scoring as shorter lines.
More “obvious”pollution sources
Perhaps runaway Manure and Septic system maintenance can both be blamed on individuals, and Sewer system and Commercial pollution blamed on civic sources, but correlations across clusters were not high between lawn chemicals and manure, nor between commercial spills and construction erosion.
If Commercial spills and leaking sewers are “out of sight, out of mind” but still easily imagined, as would be Manure and Septic overflow, as sources, that would set these sources in contrast to the Less “obvious” sources of the other set. But they would have to be then “out of sight”, and not easily imagined (riparian buffer), but still a greater threat.
Agreement with both Protect and Restore survey items, especially Restore items, and also Action items, showed higher correlations with the Less ! obvious cluster of sources than these More obvious sources. Perhaps these sources are more comprehensible and easily fixed.
Upper Granite Creek Watershed Improvement Plan, August 2012 131

1
2
3
4
5
6
0 1 2 3 4 5 6
Sewer Maintain
Sept
ic M
aint
ain
1
2
3
4
5
6
0 1 2 3 4 5 6
Sewer Maintain
Sept
ic M
aint
ain
1
2
3
4
5
6
0 1 2 3 4 5 6
Sewer MaintainSe
ptic
Mai
ntai
n
1
2
3
4
5
6
0 1 2 3 4 5 6
Sewer Maintain
Sept
ic M
aint
ain
3.64
3.24
3.16
2.80
3.26
2.80
2.88
2.51
Averageimportance Septic source
Averageimportance Sewer source
No, Flat No
No, No Se
Y $1.50-$2
Y $3-$4+
Correlations:" " Septic Sewer Protection 0.21 0.20 Restoration 0.32 0.28
Correlations:" " Septic Sewer Protection 0.17 0.12 Restoration 0.28 0.20
Correlations:" " Septic Sewer Protection 0.14 0.18 Restoration 0.35 0.26
Correlations:" " Septic Sewer Protection 0.19 0.18 Restoration 0.31 0.26
r = 0.42
r = 0.54
r = 0.52
r = 0.37
Comparison: Two more “obvious” pollution sources
The correlations for the four groups between Importance ratings on two key pollution sources are shown: Q6e Improperly maintained septic systems Q6f Inadequately maintained sewer systemsThe two sources do not show much difference in correlations, but the pattern is similar with lower correlations for the more discriminating higher fee endorsement groups, and also for the non-discriminating No. Flat No group. The correlations in scoring are independent of the average importance scoring, shown with lines and numbers through each axis, (The peculiar spread pattern is an artifact of “jitter” produced to systematically separate data points for discreet scores.)
Another explanation, noted elsewhere, for the difference between the More and Less obvious sources is based on observations of the differential correlations of the two sets of four sources, the four More or four Less Obvious sources, with aggregates, such as with Protection, Restoration or Action, and to a lesser extent with Knowledge and Information Source. Here the correlations of just the two sources at hand, Septic and Sewer, with Protection and Restoration are shown across the four groups from No to Yes on the fee. Consistently, both sources showedhigher correlations with Restorationthan Protection, and clearlyRestoration with Septic even more strongly than with Sewer. If thedifference between More “Obvious” and Less “Obvious” pollution sourcesis based on the more comprehensible and more easily fixed of sources, that might be most easily seen here.
Even though Protection is the most universal theme of those most concerned about creeks, and most willing to self assess a fee, the higher correlations with Restoration, the second place universal theme, especially in combination with Action, suggests that the plain spoken “just fix it” emphasis supports the interpretation of the more comprehensible and more readily repaired sources of pollution as being those that are the “More Obvious”.
If these scatter plots are viewed in conjunction with the set of blue circles,for the 4 More Obvious pollution sources (other page) the separation differences (lower correlations) for these two sources over the four groups can be seen. Also note that the separation distances, correlation values, are very close for Septic maintenance and Manure from farms, across all groups, which prompts a guess that the similarity in importance rating is due to the blame to be put on Individuals. The correlations between Sewer and Manure from farms are low across groups, while those between Sewer and Commercial run-off are higher across groups. But a distinction between individual and “civic” as a locus of blame falls down in comparing thatdimension within four Less Obvioussources, and it also fails in comparisons of sources between the More and Less Obvious sources.
Upper Granite Creek Watershed Improvement Plan, August 2012 132

Comparisons: More / less “obvious” pollution sources, for Yes, No Se, No, on Fee
More “obvious”pollution sourcesLess “obvious”pollution sources
No, Flat Noon Fee N=372
No, Donʼt know on Fee N=343
$1.50 - $2.00 on Fee N=470
$3.00 - $4.00+ on Fee N=297
ProtectRestore
KnowledgeAction
Learn more/Define water-shed
ProtectRestore
KnowledgeAction
Learn more/Define water-shed
ProtectRestore
KnowledgeAction
Learn more/Define water-shed
ProtectRestore
KnowledgeAction
Learn more/Define water-shed
Correlations between semantically clustered items and More or Less “obvious” pollution source ratings.Correlation values are scaled as Percent Variance Accounted For, r 2 ,or PVAC.
The four More obvious pollution source items are not as similarly highly rated, not as closely correlated, with the other aggregate measures of Protection, Knowledge, etc., as the four Less obvious pollution source items.
This difference is most obvious for the No, Flat No group, and has been described in terms of the lowered importance ratings of pollution as “dismissal”, in that alternative measures such as Knowledge, Action and involvement (willing to Learn more and/or awareness of the concept of a watershed) are low for this group and bear no relationship to the ratings of the importance of pollution sources.
For the group with highest willingness for a Fee, the lower correlations would suggest their ratings of pollution sources are more closely related to the descriptions of the sources themselves, discriminating the sources, utilizing their higher Knowledge scoring. They also show lower correlations between and among the four items in the respective More and Less Obvious groupings.
Individuals scoring higher on Restoration and Action scored in turn higher on the four pollution items in both the More and Less obvious clusters, regardless of whether choosing No or Yes on the Fee. But there were higher correlations for the Less obvious sources, perhaps perceived as needing more action, and there was less relationship to Action for the No, Flat No respondents.
The classification of the More versus Less obvious pollution sources was based on the much lower scoring of the No, Flat No on Fee respondents, compared to the No, Donʼt know respondents, with the biggest difference being for the Less obvious sources. The No, Flat No group was also much lower than the No, No Se group on Protection and Restoration scoring, and the correlations here suggest those rejecting a fee and dismissing pollution were also those unimpressed by calls for either protection or restoration.
More analysis of these correlationsfollows, next page.
Upper Granite Creek Watershed Improvement Plan, August 2012 133

0.050
0.100
0.150
0.200
0.050
0.100
0.150
0.200
0.050
0.100
0.150
0.200
0.050
0.100
0.150
0.200
0.050
0.100
0.150
0.200
No, Flat NoNo, No Se
$1.50 - $2 $3 - $4+
No, Flat NoNo, No Se
$1.50 - $2 $3 - $4+
No, Flat NoNo, No Se
$1.50 - $2 $3 - $4+
No, Flat NoNo, No Se
$1.50 - $2 $3 - $4+
No, Flat NoNo, No Se
$1.50 - $2 $3 - $4+
Difference in r 2, (Percent Variance Accounted For)Less minus More “obvious” pollution sources
Less
- M
ore
r 2Le
ss -
Mor
e r 2
Less
- M
ore
r 2Le
ss -
Mor
e r 2
Less
- M
ore
r 2
Restoration
Action
Protect
Knowledge
Learn More and Correctly Define Watershed
3.00
3.50
4.00
4.50
No, Flat No No, No Se $1.50 - $2 $3 - $4+
Protection
Action
Restoration
2.50
Average score values
0.13
0.25
0.38
0.50
0.13
0.25
0.38
0.50
0.13
0.25
0.38
0.50No, Flat No No, No Se $1.50 - $2 $3 - $4+
No, Flat No No, No Se $1.50 - $2 $3 - $4+
No, Flat No No, No Se $1.50 - $2 $3 - $4+
Restoration
Action
Protection
Correlation, r values
Less" " “obvious”"More " " pollution sources
Fig. a Fig. b
Fig. c
Comparisons: More / less “obvious” pollution sources, for Yes, No Se, No on FeeWhether for the r values in Figure a or the r 2 in Figure b, the difference between the Less and More “Obvious” items in similarity in scoring with various aggregates is clearly present across all groups. The correlations with the various aggregates, Restoration, Action and Protection (less so Knowledge and Learn More), show stronger correlations with the Less than the More Obvious sources.
The take-away here is that the distinctions underlying More versus Less “Obvious”, probably more versus less comprehensible and readily repairable pollution sources, hold true across the range of fee endorsement groups, and across aggregates representing respondent characteristics.
Figure c shows the regular increase in the aggregate scoring over the increasing fee endorsement groups. ! The correlations, and! correlation differences, do ! not appear due to differences! in scoring on the aggregates very different from the scoring on fee endorsement. It is true that the correlations for the No.Flat No group, for example, are due more to coincident rejection of Action or Restoration statements at the same time as rejection of a fee. While correlations for the Yes on Fee ! groups are due to coincident! endorsement of Action as! well as a fee.
Upper Granite Creek Watershed Improvement Plan, August 2012 134

2.53.03.54.0
2.53.03.54.0
-0.11
-0.17 (a) Discharge treated sewage
(a) Disposal household waste
2.53.03.54.0
2.53.03.54.0 (l) Non-disposed
pet wastes (k) Homeless, day laborers
Comparisons: More / less “obvious” pollution sources, for Yes, No Se, No on FeeAs an additional check on the classification of More versus Less “Obvious” pollution sources the slope over all four Yes groups and the two No groups was compared. A clear uniformity of pattern was seen for the reduced set of four Less obvious items, and four more obvious items.
The slopes, and also intercepts with the importance rating y axes were consistently higher for the Less Obvious pollution sources (red bubbles), than the More Obvious (purple bubbles). The more local slopes from the No, No Se to the No, Flat No groups were also uniformly higher for the Less Obvious (red lines) than for the More Obvious (purple lines) items.
Avg.
Impo
rtanc
e
2.5
3.0
3.5
4.0
(b) Construction site erosion
-0.17
2.5
3.0
3.5
4.0
(c) Lawn fertilizer, pesticide
Avg.
Impo
rtanc
e -0.22
2.5
3.0
3.5
4.0
(b) Road, roof runoff
-0.21
2.5
3.0
3.5
4.0
(i) Lack of riparian buffer
-0.23
Avg.
Impo
rtanc
eAv
g. Im
porta
nce
Fee Endorse Group Yes $4+ Y $3 Y $2 Y $1.50 No, No," " " Flat No No Se
2.5
3.0
3.5
4.0
2.5
3.0
3.5
4.0
2.5
3.0
3.5
4.0
2.5
3.0
3.5
4.0
-0.16
-0.14
-0.12
-0.16
(e) Septic systems not maintained
(d) Household wastes wrongly disposed
(j) Commercial, industrial spill or runoff
(f) Sewer system not maintained
Avg
Impo
rtanc
eAv
g Im
porta
nce
Avg
Impo
rtanc
eAv
g Im
porta
nce
Fee Endorse Group Yes $4+ Y $3 Y $2 Y $1.50 No, No," " " Flat No No Se
Less Obvious Max. Avg.
Constrct. erosion 4.01 3.36
Lawn Chemicals 4.13 3.27
Road runoff 4.05 3.23
Lacking buffer 4.00 3.12
More Obvious Max. Avg.
Septic systems 3.84 3.24
Sewer system 3.40 2.85
Household waste 2.95 2.48
Commerce spill 3.66 3.06
Importance as a problem scoring is higher, and correlations higher with other aggregate importance ratings, for the Less “Obvious” pollution sources. These pollution sources are rated as a more important problem by respondents who are the most supportive of improve-ment. They are rated much less important by those least supportive of improvement.
Less Obvious
" More Obvious
Upper Granite Creek Watershed Improvement Plan, August 2012 135

Upper Granite Creek Watershed Improvement Plan, August 2012 136

Appendix E:
Upper Granite Creek Subwatershed Characterization Table
To fully understand the condition of the Upper Granite Creek Watershed, the WIC engaged in a data
analysis process of integrating, or layering, the primary datasets—water quality data during critical
conditions, riparian buffer data, and field survey data—as well as existing data such as land use, sewer
data, parks and open space, golf courses, recreation and dispersed camping sites, trails, roads, and fire
history. The Granite Creek Subwatershed Characterization Table is the culmination of the data
integration process. It contains the subwatersheds and associated water quality data, description of the
riparian buffer and notable land uses, and potential sources of bacteria and nutrients.
Based on the subwatershed characterization, five priority subwatersheds were identified for targeted
monitoring. The five priority subwatersheds are: Lower Manzanita, Lower Aspen, Lower Butte, Lower
Miller, and the North Fork Granite Creek.
Upper Granite Creek Watershed Improvement Plan, August 2012 137

Upper Granite Creek Watershed Improvement Plan, August 2012 138

Appendix E
ID Sub-watershed Impervious Cover (%)
Sampling Sites and WQ data
(during critical conditions) Riparian Condition Notable Land Uses Potential Sources
(nutrients, bacteria, or both)
1 Watson Lake
1 None No data
Mostly State Trust Land; CoP around Lake.
Watson Lake Park and open space.
E. coli: Recreation. Both: Cattle grazing on state trust land. Wildlife.
2 Watson Woods
15
GRA063* Lowermost sampling site
E exc (3/10), el (6/10) N exc (1/9), el (6/9) P exc (2/9), el (6/9)
GRA135* E exc (3/4), el (3/4)
No nutrient data
No data. Likely good condition due to
Riparian Preserve.
CoP, County, and State Trust Lands. Residential off Rosser St. (west of
89). Commercial/industrial along 89.
Both: Stormwater drainage from Hwy 89, Rosser Street residential, and Prescott Lakes Parkway. Known drainage issues in Cliff Rose. Cattle grazing on state trust land. Wildlife.
3 Slaughterhouse
Gulch
21 None
(GRA166 is just downstream of confluence)
No data. Likely good conditions due to YPIT
wetland restoration downstream of 89
bridge.
Western section is YPIT; eastern is mostly CoP, some state land. Major commercial: Lowe’s,
Frontier Village, Prescott Resort, Canyon Estates.
E. coli: Known camping/squatting on YPIT land. Both: Drainage off Hwy 69. Canyon Estates--sewered residential. Unsewered residential in southwest quadrant. Wildlife.
4 North Fork
Granite
70
NFG005 No data during critical conditions
NFG025* E exc (3/6), el (5/6) N exc (4/7), el (6/7) P exc (4/7), el (6/7)
N & P annual exceedances in 2010
NFG056 E exc (1/1), el (1/1) N exc (0/1), el (1/1) P exc (0/1), el (1/1)
Mostly poor condition. 1 “best” scoring transect; 3
“bad” or “worst” transects with a high
bare soil score. 3 erosion sites.
Mostly dense urban CoP. Some undeveloped YPIT. Dense structural impacts in buffer. PHS, Badger
Park, Little League fields, Las Fuentes Resort and
Good Samaritan hospital.
E. coli: Known camping in open space at confluence with Granite. Nutrients: Household trash/yard waste. Fertilized turf—football/baseball fields and park, landscaping around hospital and resort. Both: Stormwater drainage. Sewer.
5
Upper Government
Canyon
3 No data No data Half forested. Some
residential.
Nutrients: Wildfire/prescribed burning. Natural soil conditions. Both: Unsewered residential areas. Wildlife.
6 Upper Miller
3
MIL382 E exc (0/4), el (0/4) N exc (0/4), el (0/4) P exc (0/4), el (1/4)
MIL620 E exc (0/1), el (0/1) N exc (0/1), el (1/1) P exc (0/1), el (0/1)
No ‘best” scoring transects. 7 “worst” or
“bad” transects with high bare soil scores.
Entirely forested. Recreation—trails, dispersed camping. Frequent prescribed
burning.
E. coli: Recreation, dispersed camping. Nutrients: Wildfire/prescribed burning. Natural soil conditions. Both: Wildlife.
Upper Granite Creek Watershed Improvement Plan, August 2012 139

Appendix E
ID Sub-watershed Impervious Cover (%)
Sampling Sites and WQ data
(during critical conditions) Riparian Condition Notable Land Uses Potential Sources
(nutrients, bacteria, or both)
7 Fort Whipple
29
GRA350* High E, N, & P
E exc (3/4), el (3/4) N exc (0/4), el (4/4) P exc (0/4), el (4/4)
GRA321 High N & P
E exc (0/1), el (0/1) N exc (0/1), el (1/1) P exc (0/1), el (0/1)
GRA 166 E coli exc (0/1), el (0/1)
N exc (0/1), el (0/1) P exc (0/1), el (0/1)
Partial data--good riparian scores through
Granite Creek Park. Bad and worst scores at MIL
confluence. YPIT wetlands east of Hwy 89
bridge.
Mostly YPIT. Some VA and northern downtown
area, Granite Creek Park.
E. coli: Homeless camping/congregating along Granite Creek and open space at NFG confluence. Nutrients: Fertilizer/drainage off park turf. Both: Developed areas all sewered. Small herd of cattle grazes on YPIT land. Wildlife. Stormwater drainage from Hwy 89.
8 Upper Butte
2 BUT575
No data during critical conditions
Bad-moderate-good scoring. 1 “best” scoring
transect, no “worst” scoring transects.
Majority forested. Small portion sewered CoP.
Some dispersed camping and motorized trails
(Sierra Prieta).
E. coli: Dispersed camping, recreation. Nutrients: Wildfire/prescribed burning. Natural soil conditions. Both: Wildlife.
9 Upper Aspen
4
ASP457 E exc (0/2), el (0/2) N exc (0/2), el (0/2) P exc (0/2), el 1/2)
ASP532 E exc (0/2), el (0/2) N exc (1/1), el (1/1) P exc (0/1), el (0/1)
Mostly bad-to-moderate scores. 1 “best” scoring
transect; 4 “bad” and “worst” transects with high bare soil scores.
Unsewered camps: Camp Tepeyac, Camp
Pearlstein, Copper Basin Bible Camp. Some
sewered (High Valley Ranch) and unsewered
development. Some dispersed camping and
non-motorized trails.
E. coli: Dispersed camping, recreation. Nutrients: Wildfire/prescribed burning. Natural soil conditions. Both: Wildlife, sewered and unsewered development.
10 Upper Banning
6 BAN291 No data
No data Mostly forested. Some residential and summer
camps
Nutrients: Wildfire/prescribed burning. Natural soil conditions. Both: Unsewered residential and summer camps. Agriculture (horses). Wildlife.
11 Granite Creek Headwaters
5
GRA811 Background site.
E exc (0/5), el (0/5) N exc (1/4) el (2/4) P exc (0/4) el (2/4)
High nutrients occurred 12/07-1/08
Moderate riparian scores. 1 “best” scoring
transect; 2 “bad” or “worst transects with high bare soil scores.
Mostly forested. Highway 89 drainage.
Nutrients: Wildfire/prescribed burning. Natural soil conditions. Both: Wildlife.
12 Acker Park
45 No data
(No major watercourse) No data
Mostly sewered residential. Recreation (Acker Park). Yavapai
College, Roughrider Park, Ken Lindley Park.
E. coli: Recreation. Nutrients: Fertilizer/drainage off of park turf (Ken Lindley/Roughrider).
Upper Granite Creek Watershed Improvement Plan, August 2012 140

Appendix E
ID Sub-watershed Impervious Cover (%)
Sampling Sites and WQ data
(during critical conditions) Riparian Condition Notable Land Uses Potential Sources
(nutrients, bacteria, or both)
13 Lower Miller
43
MIL020 Below confluence with Butte
E exc (1/3), el (1/3) N exc (1/2), el (2/2) P exc (0/2), el (2/2)
MIL038* Above confluence with Butte
E exc (4/8), el (4/8) N exc (2/8), el (7/8) P exc (2/8), el (6/8)
N & P annual exceedances in 2008
MIL088 E exc (0/4), el (0/4)
No nutrient data MIL223
E exc (0/8), el (1/8) N exc (2/4), el (4/4) P exc (0/4), el (3/4)
N annual exceedance in 2008 MIL310
E exc (0/1), el (0/1) N exc (0/1), el (1/1) P exc (0/1), el (0/1)
Mostly poor condition. No ‘best” scoring
transects. Fairly high bare soil scores. 4
erosion sites.
Mostly CoP (sewered), some unincorporated County (unsewered)
upstream of Oregon at Downer Trail. Dense
urban in lower watershed, residential/commercial/industrial. APS. Open space
near confluence with Granite. Agricultural land
uses (horses). Silver inflow. Homeless.
E. coli: Homeless congregating below Lincoln St. Nutrients: Household trash/yard waste. Both: Agriculture (horses). Prescott Rodeo Grounds. Sewer (known overflows). Unsewered residential parcels in the 100-yr floodplain (upper 1/3).
14 Lower Butte
58
BUT005* E exc (2/6), el (2/6) N exc (3/6), el (5/6) P exc (2/5), el (4/5)
N & P annual exceedances in 2008
BUT010 No data during critical conditions
BUT180 No data during critical conditions
Mostly bad riparian scores with a few
moderate and good scores. 1 “best” score; 6 “bad” or “worst” scores. High bare soil scores. Frequent erosion sites
(10).
Upper ¼ forested. ¾ developed. High density of structures in the buffer throughout. Activities in
the buffer. Prescott College. Golf course.
Thumb Butte and Stricklin Parks.
E. coli: Recreation. Nutrients: Fertilizer (golf course). Both: Developed areas sewered. Stormwater drainage.
15 Downtown
83
GRA463—Middle School E exc (0/4), el (1/4)
No nutrient data GRA477—below ASP
confluence; above downtown No data during critical conditions
Mostly bad-worst scores. High bare soil scores. One erosion
site.
Entirely City of Prescott. High density of structures in the buffer: Greenways
trails, business, residences, walls,
bridges.
E. coli: Recreation (Greenways trails). Nutrients: Household trash/yard waste. Both: Pet waste, stormwater drainage. Gurley St. Bridge suspicious drainage (suspected sewage).
16 Juniper Heights
North
52
None Just below confluence with Manzanita (see MAN007 &
GRA561)
Variable condition—some best and worst riparian scores. Some high and low bare soil
scores.
Mixed residential and commercial along White
Spar. Low density of structures in buffer.
E. coli: Homeless camping under White Spar bridge. Both: Mostly sewered development.
17 Upper Manzanita
18
MAN203 E exc (0/4), el (0/4) N exc (1/4), el (1/4) P exc (0/4), el (0/4)
N annual exceedance in 2010
Mostly moderate. No ‘best” scoring transects.
Low bare soil scores
Over half forested. Few structures or activities in
the buffer.
Nutrients: Natural soil conditions. Both: Dense residential (Timber Ridge) is sewered. Some unsewered developments above. Wildlife.
Upper Granite Creek Watershed Improvement Plan, August 2012 141

Appendix E
ID Sub-watershed Impervious Cover (%)
Sampling Sites and WQ data
(during critical conditions) Riparian Condition Notable Land Uses Potential Sources
(nutrients, bacteria, or both)
18
Lower Government
Canyon
22 No sites No data
No data
Lower tip is YPIT & VA. Middle portion developed. Upper third is State Trust
Land.
E. coli: Recreation (Boy Scout trail 126). Nutrients: Natural soil conditions. Both: Unsewered residential (S of Hwy 89-69 interchange). Stormwater drainage from Hwy 89 & 69.
19 Kuhne Hill North
42 GRA561
No data during critical conditions One high E. coli sample in 2008.
Moderate-to-bad riparian scores.
Density of structures in the buffer. Some homes, some businesses. White Spar—highway drainage.
Both: Fully sewered but downstream of unsewered area. Manholes frequent along creek. Dog boarding facility crosses creek—prior to that, it was a large animal vet. Historical homeless camping.
20 Lower Aspen
68
ASP005 E exc (0/2) el (0/2) N exc (0/3) el (2/3) P exc (0/3) el (0/3)
ASP020 E exc (0/1), el (1/1)
ASP040†* High E, N, & P
E exc (3/6) el (3/6) N exc (1/6) el (3/6) P exc (0/6) el (4/6)
ASP045 No data during critical conditions
ASP 100 E exc (0/1), el (0/1) N exc (0/1), el (1/1) P exc (0/1), el (1/1)
ASP211 E exc (0/1), el (0/1) N exc (0/1), el (1/1) P exc (0/1), el (0/1)
ASP287 E exc (0/1), el (0/1) N exc (0/1), el (0/1) P exc (0/1), el (0/1)
Bad-moderate-good riparian buffer scores. 5 “Best” scoring transects,
5 “Worst” or “Bad” transects
Consistent high density of structures and activities in
the buffer. Agricultural land use (horses). Pet
waste at confluence with Granite (condos).
Nutrients: Fertilizer/compost (gardens, golf course, horses). Both: Dense residential, UCYC & Copper Basin Bible camps (sewered). Unsewered residential above golf course (upper ¼)—parcels in 100 yr flood plain. Stormwater drainage from Copper Basin (lower third).
21 White Spar
19
GRA 634 E exc (1/1), el (1/1) N exc (0/2), el (2/2) P exc (0/2), el (2/2)
GRA650 E exc (0/8), el (0/8)
No nutrient data GRA710
E exc (0/1), el (0/1) N exc (0/1), el (0/1) P exc (0/1), el (0/1)
Variable condition—some best and worst riparian scores. High
bare soil scores.
Structures dense around GRA650 at Hidden Valley and Walden Rd. Mostly
PNF land.
Both: Unsewered residential along GRA—parcels in 100 yr floodplain. Prescott Pines Mobile Home Resort (unsewered).
Upper Granite Creek Watershed Improvement Plan, August 2012 142

Appendix E
ID Sub-watershed Impervious Cover (%)
Sampling Sites and WQ data
(during critical conditions) Riparian Condition Notable Land Uses Potential Sources
(nutrients, bacteria, or both)
22 Lower Banning
11
BAN002 E exc (1/5), el (1/5) N exc (0/4), el (0/4) P exc (0/4), el (1/4)
Lowest E. coli, N, & P during critical conditions. Only
exceedances during first flush when all sites exceed standards.
Best scoring urban reach, even in
residential housing area. HOA’s activily manage
natural vegetation (thinning) and buffer.
Homesites designed to include “natural
aesthetic?
Only lower portion is developed. Mostly forested. Narrow
floodplain. FEMA study found very few structures
in floodplain.
Nutrients: Wildfire/prescribed burning. Both: Mostly sewered. Approx. 60 homes on septic on hilltop. Wildlife.
23 Schoolhouse
Gulch
2
No sample sites. GRA710 is just downstream
GRA710 E exc (0/1), el (0/1) N exc (0/1), el (0/1) P exc (0/1), el (0/1)
No data. Mostly forested. Closest national forest to town.
E. coli: Known camping, squatting. Nutrients: Frequent prescribed burning. Natural soil conditions.
24 Lower Manzanita
54
MAN007†* High N, P, & E. coli E exc (2/8) el (3/8) N exc (4/9) el (9/9) P exc (2/9) el (7/9)
MAN055 No data during critical conditions
Mostly bad riparian scores with few
moderate and good scores interspersed. No ‘best” scoring transects.
Residential, larger lots, low density. “Natural”
aesthetic. Few structural buffer impacts.
Both: Unsewered residential—parcels in 100 yr floodplain. Old homes--Mountain Club is oldest planned community in AZ (1926). Camp Pine Rock. Wildlife.
* E. coli exceedance rate of 25% or more † Nitrogen or Phosphorus exceedance rate of 25% or more ABBREVIATIONS: Exc = exceeded standard El = elevated or exceeded standard E = Escherichia coli (E. coli). Standard exceeded if above 235 colony forming units (CFU). Elevated if above 129 CFU N = Total nitrogen. Standard exceeded if above 3 mg/L. Elevated if above 1 mg/L P = Total phosphorus. Standard exceeded if above 1 mg/L. Elevated if above 0.1 mg/L
Upper Granite Creek Watershed Improvement Plan, August 2012 143

Upper Granite Creek Watershed Improvement Plan, August 2012 144

Appendix F:
Newspaper Articles
The WIC published a column in The Daily Courier in April 2010 recognizing the importance of the public and volunteers in the Watershed Improvement Planning effort. Another column was published in August 2011 on the topic of nutrient pollution that fuels unsightly algal and aquatic plant blooms on the lakes
during the summer.
Upper Granite Creek Watershed Improvement Plan, August 2012 145

Upper Granite Creek Watershed Improvement Plan, August 2012 146

Upper Granite Creek Watershed Improvement Plan, August 2012 147

Upper Granite Creek Watershed Improvement Plan, August 2012 148

8/23/12 The Prescott Daily Courier | Talk of the Town: Green habits mean less green goo in lakes
1/2dcourier.com/print.asp?SectionID=36&SubsectionID=1120&ArticleID=97066
Wednesday, August 17, 2011
Talk of the Tow n: Green habits mean less green goo in lakes
By AMANDA RICHARDSONSpecial to the Courier
Wednesday, August 17, 2011
A lake choked with aquatic plants and algae is no place for boating, fishing or scenic viewing. Thiswill soon be the case in Watson and Willow lakes, Prescott's gems. Eyesores in this condition, thelakes have drawn the scrutiny of the public and elected officials. Many have offered "solutions," butwhat is the reason behind the prolific growth of the green stuff?
Last summer it was reported that Watson Lake has "excess" nutrients. Nutrients, primarily nitrogenand phosphorus, are essential for life - human, plant, and animal. These nutrients occur naturally insoil and water, but the levels are intensified by urban and agricultural land uses. Excess nutrients fuelthe growth of algae and aquatic plants, leading to reduced water clarity and, when the vegetationdecays, low dissolved oxygen levels.
You've probably heard the adage that "we all live downstream." When it comes to understanding thenutrient problems in the lakes, this adage provides a clue: we must look upstream for answers.
Upstream nutrients, however, are not the only culprits contributing to the summer greening of ourlakes. Nutrients already in the lake are caught up in an annual cycle. They are deposited in thesediment in the fall and winter as algae and aquatic plants die, are decomposed by bacteria, dissolveback into the water and then feed another year's crop of plants and algae.
The Big Picture: The rain and snow that falls in the Prescott area and isn't absorbed by the groundends up in Watson and Willow lakes. Before that water reaches the lakes, it flows over our forestlands, streets and highways, golf courses, parks, houses and yards, businesses and parking lots inurban and rural areas and empties into our creeks. It carries nutrients and other contaminants fromthese surfaces into the lake.
Closer to home: To determine the sources of excess nutrients that fuel problems downstream, wemust examine the various land uses and activities occurring all over the watershed. Each land useand activity contributes nutrients, however minor the concentration. It is after the nutrients from allover the watershed accumulate in Watson Lake that it becomes noticeable - in the form ofunattractive "green goo."
A look upstream reveals many potential culprits. What are they?
Residential: Grass clippings, tree trimmings and animal waste (pets, horses, chickens) decompose andrelease nutrients. Fertilizers for lawns, golf courses and gardens are high in phosphorus and nitrogen,much of which washes off during a rain. Detergents for car-washing, household cleaning and laundrygray water are all nutrient-rich.
Septic Systems: Even properly functioning and maintained septic systems may only remove 20percent of the nitrogen and 90 percent of the phosphorus. What is not removed may eventuallycontaminate groundwater and flow underground to our creeks. Inappropriate soils, improperly placed
Upper Granite Creek Watershed Improvement Plan, August 2012 149

8/23/12 The Prescott Daily Courier | Talk of the Town: Green habits mean less green goo in lakes
2/2dcourier.com/print.asp?SectionID=36&SubsectionID=1120&ArticleID=97066
leach fields and septic tank malfunctions will lead to effluent discharges that contribute nitrogen,phosphorus and bacteria into groundwater and, eventually, surface waters.
Sanitary sewers: Raw sewage is transported in our sanitary sewers to the wastewater treatmentplant. A leaking pipe or overflow can contribute nutrients directly into groundwater or surface water.
Stormwater runoff: Surface runoff after rain or snow is called stormwater. Stormwater carriesnutrients into nearby water bodies. Hard surfaces such as roofs, driveways, and streets increase theamount and velocity of stormwater, thereby increasing the amount of pollutants carried to surfacewater. Soil erosion may occur when stormwater moves across bare or disturbed ground or saturatedclay soils.
Natural sources: Wildfires may increase nutrient loads and runoff in the short-term before the forestrebounds. Wildlife waste, like domestic animal waste, and forest vegetation will decompose andrelease nutrients.
Riparian vegetation: The habitat adjacent to a stream or lake is the riparian zone. Riparian areasdegraded by land uses or development will not effectively intercept nutrients in runoff before theyenter surface waters and end up downstream. Riparian vegetation slows surface runoff, allowing it tosettle, and infiltrate the soil. Plant roots take up many contaminants, particularly nutrients, and usethem for growth.
While a case of many nutrient sources makes designing solutions for our local creeks and lakes morecomplex, it also means that every resident in the watershed can make a difference. If the causes arecumulative, so are the solutions.
Amanda Richardson is Watershed Program Coordinator for Prescott Creeks and facilitates theGranite Creek Watershed Improvement Council.
Related Links:
">Content © 2012">Software © 1998-2012 1up! Software, All Rights Reserved
Upper Granite Creek Watershed Improvement Plan, August 2012 150

Appendix G:
Financial Survey Table
A goal of the WIC is to identify sustainable local funding sources that will provide a continued
investment in watershed health. The financial survey contains a list of federal, state, and private
foundations that represent potential funding sources for watershed improvement projects.
Upper Granite Creek Watershed Improvement Plan, August 2012 151

Upper Granite Creek Watershed Improvement Plan, August 2012 152

Appendix G
Grant Maker Grant Name Location Deadline Application Type
Funding Range (Match) Purpose and Activities
State Grant Makers AZ Department of Environmental Quality
Statewide Water Quality Improvement Grants
Phoenix, AZ Full proposal Projects that implement sufficient, economically and scientifically sound management practices that result in quantifiable improvements to surface water quality. Other outcomes: education and public awareness of water quality issues, active citizen involvement, innovative approaches to problem solving, and long-term project maintenance and results.
AZ Department of Environmental Quality
Water Quality Improvement Education Grants
Phoenix, AZ Full proposal Education and outreach projects focused on nonpoint source pollution in Arizona
AZ Water Infrastructure and Finance Authority
Green Project Reserve: Stormwater Infrastructure
Phoenix, AZ Full proposal 1. Stormwater harvesting and reuse—at the facility.
2. Establishment or restoration of permanent riparian buffers or soft bioengineered streambanks (clean water)
Private Grant Makers SB Foundation Albuquerque,
NM Up to $20,000 Environmental conservation
Weatherup Family Foundation
Scottsdale, AZ $1,500 - $1M Environment, natural resources
Freeport-McMoRan Copper & Gold Foundation
Social investment program
Phoenix, AZ August 30 Full application $10,000 - $1 M Primarily company operations. Environmental quality, conservation, management
Dorrance Family Foundation
Scottsdale, AZ None Letter of inquiry $18,500 - $1.9M
Stardust Foundation Scottsdale, AZ Letter of inquiry $20,000 - $1.2 M Endowments, General/operating support. Community/economic development. Environment, natural resources
Upper Granite Creek Watershed Improvement Plan, August 2012 153

Appendix G
J.W. Kieckhefer Foundation
Prescott, AZ Letter of inquiry $20,000 - $170,000 Ecology and conservation
Craig and Barbara Barrett Foundation
Paradise Valley, AZ
Letter of inquiry $2,500 - $10, 000 Environmental conservation
Earth Friends Wildlife Foundation
Scottsdale, AZ Letter of inquiry $7,500 - $45,000 Environment, wildlife
Cadeau Foundation Patagonia, AZ Letter of inquiry Environmental conservation Margaret T. Morris Foundation
Prescott, AZ Letter of inquiry $5,000 - $75,000 Environment
Yavapai County Community Foundation
Yavapai County Community Foundation
Prescott, AZ 21 April, 2011
Full proposal $500-$20,000 Environment, education, and various others
Waste Management Charitable Giving Houston, TX None Full proposal Environment (preserve or enhance); Environmental Education (middle & high school students); Community (clean, better places to live)
Water Blue Community Action Grants
None Online application $1,000 - $5,000 Grassroots initiatives; improving water resources in the community; educate children, youth, or others in the community about the importance of watersheds
Audubon Partners network
Together Green Innovation Grants
May 2, 2011
Full proposal * if not in the Audubon partners network, contact [email protected]
$5,000 - $80,000 Conserve or restore habitat and protect species, improve water quality or quantity, and reduce the threat of global warming; Engage new and diverse audiences in conservation actions; and Inspire and use innovative approaches and technologies to engage people and achieve conservation results.
CedarTree Foundation
Grant Program Boston, MA Letter of inquiry Environmental education; environmental health; sustainable agriculture—with particular consideration to proposals demonstrating elements of environmental justice and/or conservation
Upper Granite Creek Watershed Improvement Plan, August 2012 154

Appendix G
Captain Planet Foundation
Grants Atlanta, GA May 31, 2011
Full application $2,500 Environmental education for children and youth
Norcross Wildlife Foundation
Grants None Full application Up to $10,000
Federal Grant Makers National Fish and Wildlife Foundation
Five Star Restoration Grant Program
February 4, 2011
Online application 1yr: $10,000 - $25,000 2yr: $10,000 -$40,000 (1:1)
Community-based restoration, stewardship through education, outreach, and training
National Fish and Wildlife Foundation
Acres for America
Pre: April 1 and Sept 1 Full: June 1 and Nov 1
Discuss with Regional NFWF Director Pre-proposal RFP Response
(1:1) Conserve important habitat for fish, wildlife, and plants through acquisition of real property. The goal of the program is to offset the footprint of Walmart’s domestic facilities on at least an acre by acre basis through these acquisitions.
National Forest Foundation
Collaboration Support Program Capacity Grants
Missoula, MT Up to $5,000
Organizational development needs in collaborative efforts
National Forest Foundation
Collaboration Support Program Innovation Grants
Missoula, MT Up to $10,000 Implementation of new ideas or strategies that will move the field of collaboration forward and that have the potential to be transferred to other collaborative efforts across the country.
National Forest Foundation
Community Assistance Program
Missoula, MT Start-up funds for newly forming (or significantly re-organizing) groups or nonprofit organizations that intend to proactively and inclusively engage local stakeholders in the community in forest management and conservation issues on and around National Forests and Grasslands.
Upper Granite Creek Watershed Improvement Plan, August 2012 155

Upper Granite Creek Watershed Improvement Plan, August 2012 156

Appendix H:
Priority BMP Project Descriptions
The WIC has identified project locations for BMP implementation in the Upper Granite Creek Watershed
to improve surface water quality. These projects have been prioritized for their feasibility in terms of
property ownership, access, visibility as a demonstration project, and ability to provide water quality
treatment. The top‐priority projects are the Prescott Rodeo Grounds, Prescott Community Center,
Whipple Street Detention Basins, and APS Construction Yard.
Upper Granite Creek Watershed Improvement Plan, August 2012 157

Upper Granite Creek Watershed Improvement Plan, August 2012 158

Appendix H
Load Reduction Estimates
Total load reductions as a result of the installation of bioretention basins along the perimeter of the
grounds, and a manure exchange program:
Sediment 6.6 tons/yr
N – 77.8 lbs/yr
P – 19.4 lbs/yr
Figure 1: Prescott Rodeo Grounds Project Location
The Prescott Rodeo Grounds is a 39‐acre site located in the City of Prescott along
Miller Creek near the confluence of the North Fork Miller Creek. Home to the
“World’s Oldest Rodeo”, which takes place annually in July, the Rodeo Grounds
host events year‐round events.
Upper Granite Creek Watershed Improvement Plan, August 2012 159

Appendix H
Education & Outreach Strategy
Outreach and education components linked to the installation of bioretention basins will greatly
increase the effectiveness of this BMP. Community volunteers, conceivably from the Master Gardener
and Master Watershed Stewards programs, will be recruited to help install the rock lining and plant the
vegetation in the basins. Interpretive signs will be installed explaining how bioretention basins function.
Community workshops can be held providing interested residents on how to install similar features,
such as rain gardens, on their own properties.
Schedule & Cost Analysis
This project will be implemented in the 2013 dry season prior to the Frontier Days Rodeo in July and the
start of the monsoon.
Task Date Cost Range
Planning & Development Jan. – Mar. 2013 $5,000 ‐ $7,000
Permitting Mar. – May 2013 $3,000 ‐ $5,000
Engineering & Design Apr. – May 2013 $8,000 ‐ $12,000
Materials Jan. – May 2013 $30,000 ‐ $50,000
Construction May – June 2013 $50,000 ‐ $100,000
Public Education Materials July – Oct. 2013 $7,000 ‐ $10,000
Community Workshops June – Sept. 2013 $5,000 ‐ $7,000
Initial Monitoring Monsoon/Winter 2013 $2,000 ‐ $4,000
Maintenance Ongoing
TOTAL $110,000 ‐ $195,000
Project evaluation and monitoring
Criteria to determine the effectiveness of this project include the following:
Reduction in E. coli and nitrogen discharged to Miller Creek from the Rodeo Grounds
Reduction in sediment discharged to Miller Creek from the Rodeo Grounds
Monitoring for E. coli, Total Nitrogen, and sediment will be conducted by trained community volunteers.
Samples will be collected upstream and downstream of the Rodeo Grounds in addition to the discharge
from the bioretention basins.
References
Prescott Rodeo Grounds Preliminary Master Plan. Spring 2011. ECOSA Institute.
Upper Granite Creek Watershed Improvement Plan, August 2012 160

Appendix H
ProposedBMPProject2:WhippleStreetDetentionBasinsTwo detention basins exist on the north and south sides of Whipple St at the Whipple St – Willow Creek
Road intersection (Fig. 2). These vegetated detention basins are not currently functioning to their
greatest potential; during heavy precipitation and runoff events, the north basin will be filled to capacity
while the south basin remains dry. At just under one acre each, these basins have the potential to
capture and treat runoff from the Yavapai Regional Medical Center (YRMC) complex, Willow Creek Rd,
Iron Springs Rd, and Miller Valley Rd.
Need
Located in the North Fork Granite Creek Subwatershed, the detention basins drain to North Fork Granite
Creek less than half a mile to the east. The North Fork Granite Creek is a highly impacted urban creek; its
headwaters are in a residential neighborhood in the City of Prescott and flows into Granite Creek at the
border of the Yavapai‐Prescott Indian Tribe reservation. Analysis of water quality data shows a spike in
E. coli bacteria on a stretch of creek just downstream of where the Whipple St. detention basins
discharge to the creek. The North Fork Granite Creek also exhibits consistently elevated nutrient levels,
resulting in exceedances of the annual mean standard for both Total Nitrogen and Total Phosphorus in
2010.
Project Description
To improve the function of the south basin – and possibly the north basin ‐ it will be excavated and
graded to allow for proper flow‐through and extended treatment train before discharge downstream.
Curb cuts will allow the south basin to capture additional runoff from Miller Valley Rd. Rocks, mulch, and
native vegetation will be installed; some of the trees and shrubs from the existing basins will be salvaged
and replanted, if appropriate.
Load Reduction Estimates
TBD
Education & Outreach Strategy
This project provides a great opportunity to raise awareness and educate the public because it is a highly
visible project location at a busy intersection. Benches can be installed at points around the basins for
use by the public or the many employees of the nearby YRMC complex and businesses. A walking path
along the south basin will meander along the basin and connect to the sidewalk. Interpretive signs on
the topic of stormwater and natural treatment mechanisms can be installed along both basins where
public access is most convenient.
The public will be notified when monitoring studies are conducted. Community volunteers will be
recruited to participate in monitoring and volunteer trainings conducted.
Upper Granite Creek Watershed Improvement Plan, August 2012 161

Appendix H
Figure 2: Whipple Street Detention Basins Project Location
Two detention basins exist on the north and south sides of Whipple Street at the intersection with
Willow Creek Road. The south basin, at a minimum, could be updated to provide secondary treatment
from the north basin in addition to capturing and treating runoff before discharging to the North Fork
of Granite Creek to the east. When completed, the detention basins, vegetated with native vegetation
species, will provide a park‐like setting for employees and visitors to the nearby Yavapai Regional
Medical Center complex and businesses.
Upper Granite Creek Watershed Improvement Plan, August 2012 162

Appendix H
Schedule & Cost Analysis
Task Date Cost Range
Planning & Development Jan. – Mar. 2013 $5,000 ‐ $7,000
Permitting Mar. – May 2013 $3,000 ‐ $5,000
Engineering & Design Apr. ‐ July 2013 $8,000 ‐ $12,000
Materials Jan. – July 2013 $12,000 ‐ $16,000
Construction July – Sept. 2013 $30,000 ‐ $60,000
Public Education Materials Sept. – Nov. 2013 $10,000 ‐ $12,000
Initial Monitoring Winter 2013/Monsoon 2014 $2,000 ‐ $4,000
Maintenance Ongoing
TOTAL $70,000 ‐ $120,000
Project evaluation and monitoring
Criteria to determine the effectiveness of this project include the following:
Reduction in E. coli and nitrogen in stormwater discharged from the site
Reduction in volume of stormwater discharged from the site
Monitoring for E. coli and Total Nitrogen will be conducted by trained community volunteers. Samples
will be collected from stormwater entering and leaving the basins.
Photo monitoring of the flow and volume of stormwater as it moves through the site.
Upper Granite Creek Watershed Improvement Plan, August 2012 163

Appendix H
ProposedBMPProject3:PrescottCommunityCenter/CliffRoseSubdivision
The Cliff Rose subdivision in north Prescott (Fig. 3) contains the Rowle P. Simmons Community Center,
known as a “Place to Play” for Prescott area adults. The Community Center houses private operations,
such as the Adult Center of Prescott and Prescott Meals‐on‐Wheels. The City of Prescott owns this 19‐
acre tract that contains the Community Center facility ‐ one building with a large parking lot. The City
plans to expand recreational facilities within the remaining undeveloped portion of the site.
Need
The City of Prescott develops master drainage studies and mitigation designs for localized drainage
improvement projects, funded by the Yavapai County Flood Control District. These studies are generally
prompted by complaints from residents after heavy precipitation events result in damage to homes and
properties. One of the localized drainage studies completed in 2011 was for the Cliff Rose subdivision, a
development in North Prescott with many impervious surfaces and dense housing. Cliff Rose is located
on a hill that slopes to the east; the stormwater generated by the Cliff Rose subdivision drains to Granite
Creek, less than a mile away in the Watson Woods Riparian Preserve, just south of Watson Lake.
Project Description
The WIC would work with the City of Prescott to design a green infrastructure (GI) “demonstration” site
that would incorporate an array of GI designs – rainwater harvesting, bioretention basins, tree trenches,
etc. As most successful municipal GI programs began with pilot or demonstration projects, this project
would allow for the study of the performance and benefits of GI practices in Prescott’s arid climate and
comparison with conventional stormwater management implemented as result of the Master Drainage
Study. The long term vision is to institutionalize GI practices so they are routinely integrated into private
and public development, redevelopment, and infrastructure projects. However, with only limited GI
practices in place locally, the codes, ordinances, and political will to support the implementation of GI
are limited. Although GI is being embraced nationally and neighboring Tucson, Arizona offers a model
for implementing GI in arid environments, local practitioners lack the familiarity with techniques, tools,
or training to recognize the applicability or benefits of GI practices to municipal and private projects.
Upper Granite Creek Watershed Improvement Plan, August 2012 164

Appendix H
Load Reduction Estimates
Total load reduction as a result of using pervious pavement, tree trenches, infiltration basins, and rain
gardens enhancing natural drainage:
Sediment – 8.3 tons/yr
N – 57.4 lbs/yr
P – 12.6 lbs/yr
Figure 3: Prescott Community Center Location
The Prescott Community Center is located in Cliff Rose, a north Prescott subdivision. This 19‐acre tract is only partially developed. The Community Center site was included in a 2010 assessment of drywell and bioretention feasibility and was ranked as the most suitable site for bioretention and drywell development.
Upper Granite Creek Watershed Improvement Plan, August 2012 165

Appendix H
Education & Outreach Strategy
The Adult Center is a popular community gathering spot for a variety of audiences, so a demonstration
of BMPs at this location would have a broad reach. BMPs will be promoted through interpretive signs,
an open house and/or environmental fair, and newspaper articles.
Schedule & Cost Analysis
Task Date Cost Range
Planning & Development Apr. – Sept. 2013 $8,000 ‐ $12,000
Permitting Sept. – Oct. 2013 $2,000 ‐ $4,000
Engineering & Design Oct. 2013 – Feb. 2014 $12,000 ‐ $16,000
Materials Dec. 2013 – May 2014 $20,000 ‐ $30,000
Construction May – July 2014 $60,000 ‐ $80,000
Public Education Materials Aug. 2014 – Apr. 2015 $10,000 ‐ $12,000
Initial Monitoring Monsoon/Winter 2014 $2,000 ‐ $4,000
Maintenance Ongoing
TOTAL $114,000 ‐ $158,000
Project evaluation and monitoring
Criteria to determine the effectiveness of this project include the following:
Reduction in E. coli and nitrogen in stormwater discharged from the site
Reduction in volume of stormwater discharged from the site
Monitoring for E. coli and Total Nitrogen will be conducted by trained community volunteers. Samples
will be collected from stormwater entering and leaving the site and from the Cliff Rose drainage where it
discharges on the east side of Highway 89 in Watson Woods Riparian Preserve.
Photo monitoring of the flow and volume of stormwater as it moves through the site.
Upper Granite Creek Watershed Improvement Plan, August 2012 166

Appendix H
ProposedBMPProject4:APSConstructionYardLocated along lower Miller Creek just downstream of its confluence with Butte Creek and upstream of
its confluence with Granite Creek at Granite Creek Park is the Arizona Public Service (APS) construction
yard (Fig. 4). This 7.5‐acre industrial site consists of buildings and paved lots for parking and storage for
service vehicles and materials.
Figure 4: APS Construction Yard Project Location
The APS Construction Yard is located along lower Miller Creek just downstream of the Butte
Creek confluence and upstream of the confluence of Miller and Granite Creeks at Granite
Creek Park. It is bordered by designated City of Prescott Open Space to the east.
Upper Granite Creek Watershed Improvement Plan, August 2012 167

Appendix H
Need
Lower Miller Creek flows through an area of mixed residential, industrial, and recreation land uses. It has
been highly impacted by historical and current land uses. In the late 1800’s it was dammed as a drinking
water source, known as the Maier Dam and Reservoir. Remnants of the dam can be seen today near the
APS Service Yard; at the same location, the right bank of the creek has been replaced by a wall (Fig. 5).
The Miller Creek trail, part of the City of Prescott’s Greenways Trail System, parallels the creek and the
APS Service Yard to the north, connecting to the downtown trail at the confluence with Granite Creek.
The trail and creek corridor is widely used by the area’s homeless and transient population for travel,
congregating, and camping. The nearby residential neighborhood, the low‐income Dameron Tract to the
north, is affected by flooding during high flow events. The east and north sides of the APS construction
yard are bordered by City of Prescott Open Space and the Prescott Community Gardens.
Analysis of water quality data shows high increases in both E. coli and Total Nitrogen along Lower Miller
Creek. While there are contributing sources upstream, it is suspected that land uses and activities along
Lower Miller Creek are also contributing factors.
Figure 5: Miller Creek Dam and APS Yard
This photo, taken on March 27, 2010 during a volunteer Watershed Field Survey,
shows Miller Creek flowing at the site of the decommissioned dam and the wall that
bolsters the APS Service Yard.
Upper Granite Creek Watershed Improvement Plan, August 2012 168

Appendix H
Project Description
APS is sensitive to their potential impact to Miller Creek and is interested in partnering on projects that
will minimize their impact and demonstrate how industrial sites can be “greened.” The WIC will work
with APS to assess runoff from the construction yard and identify an appropriate suite of green
infrastructure techniques to minimize runoff and provide treatment, such as pervious pavement,
bioretention basins, vegetated basins, tree trenches, etc. The level of compaction and percolation rate
of soil beneath the pavement will need to be assessed and may pose a challenge to green infrastructure
installation. Additionally, any impact to the structural integrity of the stabilizing wall resulting from
installation of these techniques must be assessed.
Load Reduction Estimates
Install Bio‐retention cells which will treat all the water and assume a 60% reduction.
Average Total Nitrogen Load = 3.21 kg/year (‐73.3% change)
Education & Outreach Strategy
APS has a corporate commitment to environmental stewardship and the communities they serve; this
commitment has been demonstrated at the local level through their partnership with Prescott Creeks
for work done at Watson Woods Riparian Preserve and their support of the annual Granite Creek Clean‐
Up. APS has coordinated with Prescott Creeks on clearing around power lines in Watson Woods so that
trees and/or cuttings could be harvested and replanted. In early 2012, APS provided a crew for four days
to “mop up” downed wood in Watson Woods that posed a fire hazard. This donation was valued at
$12,000. Their demonstrated values make them an ideal partner for structural and education projects in
the area.
Using the public reach of APS, a structural BMP could be promoted through mailers and an open house.
Schedule, Milestones, and Maintenance
Partner meetings
Site assessment
Design and permitting
Installation
Mailings, open house
Monitoring
Maintenance conducted by APS
Upper Granite Creek Watershed Improvement Plan, August 2012 169

Appendix H
Project evaluation and monitoring
Criteria to determine the effectiveness of this project include the following:
Reduction in nitrogen and stormwater discharged to Miller Creek from the APS Yard
Monitoring for E. coli, Total Nitrogen, and sediment will be conducted by trained community volunteers.
Samples will be collected upstream and downstream of the APS Yard in addition to the discharge from
the outfalls from the site to Miller Creek.
Cost Analysis
TBD
Upper Granite Creek Watershed Improvement Plan, August 2012 170

Appendix I:
Second‐Tier Priority BMP Project Descriptions
The WIC has identified second‐tier priority BMP projects in the Upper Granite Creek Watershed to
improve surface water quality. These are conceptual project ideas, elements of which can be
undertaken as singular projects, or combined to create more multifaceted projects.
Upper Granite Creek Improvement Plan 171

Upper Granite Creek Improvement Plan 172

Neighborhood‐ScaleWaterQualityImprovementProjects Description To continue the work of the WIP implementation projects in teaching residents about the connection between surface water quality, NPS, and water harvesting and reuse practices, the WIC recommends collaborating with a “pilot” neighborhood or group of homeowners to install practices around residences. Practices may consist of rain/infiltration gardens and active rainwater harvesting through rain barrels and other water quality BMPs – downspout disconnections, replacing impervious surfaces with permeable alternatives, composting and manure management, etc. Opportunities
Partner with local rainwater harvesting resources ‐ CCJ’s Home Repair Program offers affordable rain barrels; T. Barnabas Kane & Associates offers for‐profit rain water harvesting design and installation services; Yavapai County Cooperative Extension offers workshops to educate interested individuals about rainwater harvesting; City of Prescott WaterSmart program promotes rainwater harvesting practices and offers tax rebates and incentives
Offer small financial incentives to homeowners or businesses to implement water harvesting features – curb cuts and basins, rain gardens, etc. For example:
o Homeowners – 50% of material costs up to $1,000 ‐ $2,000 o Businesses – 50% of material costs up to $2,000 ‐ $5,000
Target neighborhoods adjacent to water quality improvement projects or where water quality improvements are needed (ex. Cliff Rose, Dexter, and neighborhoods along lower Butte, lower Aspen, North Fork of Granite Creek, and North Fork of Miller Creek)
o Leverage Community Development Block Grants which focus on street, water, and wastewater improvements in neighborhoods to reduce blight
o Coordinate with City of Prescott Master Drainage Studies
Conduct presentations to HOAs, neighborhood groups on NPS, water quality, and how these practices can help improve water quality
PrescottBusinessCoalition Description Expand stakeholder representation in the WIC by building relationships with the Prescott business community, particularly downtown businesses due to the proximity to Granite Creek and the Greenways Trail System. Establishing the connection between healthy and clean waterways, recreational users, and local economy will increase support for watershed/water quality projects and the long‐term downtown revitalization project. Opportunities
Present to local business groups: Chamber of Commerce, Prescott Downtown Partnership, etc.
Upper Granite Creek Improvement Plan 173

Build a “Watershed Coalition” or similar alliance that businesses and local organizations can join that stresses the importance of the natural environment to local economy
o Display identification in their storefront o Adopt a tree trench (or similar) program (part of downtown GI installations) o Expanded use of garbage bins and cigarette disposal systems with consistent messaging
that connects proper disposal to the health of Granite Creek
GI installation incentive program for businesses (described above)
DowntownRevitalization Description Downtown is the center of tourism and commerce in Prescott, attracting locals and visitors due to its historic character and numerous events throughout the year. Granite Creek is an integral piece of the downtown culture and was once at the very center of downtown before the fire that destroyed Whiskey Row in 1900. The Greenways Trail System runs along Granite Creek, providing walking and biking paths. The downtown trails have become the migratory route for transients and homeless, discouraging more legitimate uses. This has led to the creek being treated like an unsightly “back alley,” avoided by many legitimate users while neighboring businesses and homeowners have separated themselves from the creek by walls and fences. Downtown revitalization would encompass issues related to transportation, creek restoration, water quality and habitat, historical features, and recreation. The revitalization of downtown is of interest to many local groups because it would improve quality of life for residents and the experience of visitors while boosting local businesses and the economy. Revitalizing downtown would elevate the perception of Granite Creek from a back alley to a local treasure and ecological asset. Opportunities
Green infrastructure installations (tree trenches, street‐side or ROW water harvesting basins, downspout disconnections, etc.) around the courthouse square and downtown business district
Campaign for creekside businesses to celebrate and utilize their proximity to the creek. Creating a “creek walk” would provide a vehicle to attract the public to the area, ensuring the economic success of revitalization efforts
Work with businesses and residents along the creek to implement water quality BMPs on their properties
Install filter strips and other water quality BMPs along the trail to improve the water quality of runoff from the trail and nearby impervious surfaces as well as demonstrate techniques that can be implemented by homeowners and businesses along creeks
Festivals, walking tours, or other events that get community members to the creek, learning about its history, watershed, water quality, and the wildlife species that rely the creek and its riparian area
Maintain relatively “natural” riparian vegetation and stabilize banks along the downtown trail system. A manicured park‐like corridor might have more mass‐appeal to users and deter less legitimate trail users, thereby reducing the risk of crime and unwanted encounters which
Upper Granite Creek Improvement Plan 174

currently dissuade use of the trail system by broad user groups. We recommend a focus on maintaining a park‐like corridor for the main downtown blocks, complete with solar‐powered lights and improved trail surface to encourage greater use of the trails. The sections of trail outside of the downtown corridor can be restored and maintained as a more natural setting.
Partner with local social justice organizations to find ways to revitalize the downtown with an equitable and mutually beneficial solution for the transients and homeless that use the trail system.
CoP street sweeping – institute program that sweeps downtown blocks the Monday after weekend events on the courthouse square
Identify drainage areas for the downtown Granite Creek stormwater outfalls. o Use scoping camera technology to check for leaks or illegal connections o Retrofit intakes with storm scepters o Implement aggressive program that maintains intakes/outfalls (tied into street
sweeping)
Self‐guided walking tour of the creek (brochure or interpretive signs) o Points of interest along the trail – native vegetation, restoration, BMPs/improvement
projects, wildlife habitat, history, water quality monitoring stations (below) o Public art – upcycled art sculptures at various points along the downtown trail system to
educate about clean creeks, proper disposal of material, and recycling/reuse
ProjectswithFaith‐BasedGroups Description Because many faith‐based organizations and groups have a commitment to community service, these groups are natural partners for water quality improvement projects and installations on private properties. Opportunities
Green infrastructure retrofits around Church buildings and landscapes
Green infrastructure retrofits at Church camps, involving campers
Presentations to congregations, boards, or committees
WatershedMonitoring Description Continue efforts to monitor the watershed will be pursued for a variety of reasons: to gather data on the effectiveness of water quality improvement projects; to identify suspected water quality issues; to establish baseline data on the condition or quality of the watershed. Citizen water quality monitoring will contribute to the growing body of data that will be used to assess watershed condition, contribute to our understanding of the effectiveness of on‐the‐ground projects,
Upper Granite Creek Improvement Plan 175

and will keep the community engaged in hands‐on learning opportunities about water quality. The WIC recommends that a regular citizen water quality monitoring program be developed and supported. Opportunities
Identify opportunities for relevant monitoring equipment to installed: o Flow gages on the tributaries o Real‐time data loggers
Work with other organized volunteer groups. For example, the Sierra Club Water Sentinels currently conduct monitoring activities on the Verde River and may be interested in working on a headwater to the Verde River.
Install permanent water quality monitoring stations along downtown trail system to test effectiveness of BMPs/restoration along trail system. These stations can be marked by a sign that explains why water quality monitoring is conducted and what types of monitoring occur at the site. These sites could contain permanent (but locked/protected) real‐time monitoring equipment.
Other types of monitoring that may be relevant: o Physical/geomorphological surveys o Biological inventories o Wet/Dry mapping, a project of Arizona NEMO – This low‐cost, volunteer mapping
methodology provides comprehensive data on where streams have surface flow and where they are dry. When performed annually, this data can provide comparisons of year‐to‐year variability and long‐term trends in surface water patterns. Data can also be used to better understand groundwater/surface water interactions and identify reaches for further studies.
IdentifyRestorationSites Description The greater Prescott community is both defined by and dependent on the surrounding natural environment for its quality of life and tourism‐driven economy. As Prescott looks to the future, it is critical to protect our natural resources and make concerted efforts to restore degraded ecosystems, in undeveloped and urban areas. Enhancing or creating green infrastructure in the urban areas will provide multiple environmental, social, and economic benefits. In actuality, preventing pollution and ecological damage is less expensive than remedial/retroactive efforts, which is especially critical in the currently weak economy.
Opportunities
Engage private landowners about creek/flooding issues or concerns.
Identify site additions to the Granite Creek system and implement restoration and/or enhancement projects involving community volunteers
Identify floodplain properties that could be acquired as part of a larger floodplain restoration scheme.
Upper Granite Creek Improvement Plan 176

Livestock/ManureManagement Description Partner with the City of Prescott, Frontier Days Association, University of Arizona Cooperative Extension, and others to identify opportunities for water quality improvement projects at the Prescott Rodeo Grounds or on private properties with livestock. Opportunities
Build a permanent structure at the Prescott Rodeo Grounds for manure storage prior to transportation off‐site. The structure would include appropriate BMPs to prevent runoff to nearby Miller Creek (berms, swales, etc.)
Train 4‐H youth on NPS and manure management BMPs. Identify opportunities for their community service component to include water quality improvement projects.
Upper Granite Creek Improvement Plan 177