grambling state university i. institutional profile
TRANSCRIPT


GRAMBLING STATE UNIVERSITY
FACT BOOK
Table of Contents
Foreword and Acknowledgement……………………………...iii
I. INSTITUTIONAL PROFILE
University Mission and Goals Statement ……………………………………. 1
University Governance Organizations & Administration …………………… 2
ULS Board Members ………………………………………………………... 3
GSU Administration ………………………………………………………… 4
Organizational Structure …………………………………………………….. 5
Accrediting Agencies ………………………………………………………... 6
Historical Notes …………………………………………………………….... 7
GSU Alumni Hall of Fame, Gallery of Distinction …………………………. 8
Peer Institutions ……………………………………………………………... 9
Comparison of Grambling State University to Peers-Crime Statistics ……… 10
II. STUDENT PROFILE
A. First-Time Freshmen Applicants, Admits, and Enrollees ………………………………………. 12
Admission Test Scores …………………………………………………... 13
B. Enrollment Information
Headcount Enrollment Trend by Level ………………………………….. 16
Headcount Enrollment Trend by Ethnicity ……………………………… 18
Headcount Enrollment by Gender and Level ……………………………. 20
Headcount Enrollment by Classification and Gender …………………… 22
Headcount Enrollment by Status ………………………………………… 24
Headcount Enrollment by Age, Level, and Gender ……………………... 26
Enrollment by Country ………………………………………………….. 28
Enrollment by State ……………………………………………………... 29

Headcount Enrollment by Louisiana Parish …………………………….. 30
Full-Time Equivalent Enrollment (FTE) by Level ……………………… 33
C. Progression and Graduation
First-to-Second Year Retention Rates …………………………………... 34
Six-Year Graduation Rates ……………………………………………… 36
Degrees Awarded by Level and Gender ………………………………… 38
Degrees Awarded by Level of Degree and Race ……………………….. 40
Degrees Awarded by Level ……………………………………………… 43
Degrees Awarded by Discipline ………………………………………… 45
III. RESOURCES
A. Employees Full-Time Staff by Ethnicity and Gender ……………………………….. 49
Full-Time Instructional Faculty by Gender ……………………………... 50
Full-Time Instructional Faculty by Rank ………………………………... 52
Average Salary of Full-Time Faculty by Rank ………………………….. 54
Full-Time Instructional Faculty by Tenure Status ………………………. 56
B. Finances Student Fees-Cost of Attendance ……………………………………….. 58
Students Receiving TOPS by Type of Award …………………………... 59
Revenues and Other Additions by Source of Funds ……………………. 60
Education & General Expenditures by Function ………………………... 61
C. Facilities Assignable Area by Room Use ………………………………………….. 62

FOREWORD AND ACKNOWLEDGEMENT
This is the third edition of the Grambling State University eFact Book developed
by the Office of Planning and Institutional Research (PaIR). This document provides
five-year statistical trend information presented in tables and graphs as well as other
information provided for the most current year available. The Office of PaIR collects,
compiles, and disseminates information on all facets of the University on a continuous
basis. This publication provides a wealth of information about the University and is
designed to give University constituents and external reporting agencies easy access to
statistical data pertaining to the institution.
The concerted effort of the PaIR staff is to make this publication a useful
resource for retrieving University information by using an online medium. The staff
wishes to thank all of the offices and individual persons on campus who contributed
information and suggestions towards the first eFact Book at Grambling State University.
Special thanks and appreciation goes to Mr. Bruce Morgan, Grambling State
University’s Webmaster, for his contributions.
iii

GSU
Section I
INSTITUTIONAL PROFILE

1
UNIVERSITY MISSION STATEMENT AND GOALS
MISSION
Grambling State University is a comprehensive, historically-black, public institution that offers a broad spectrum of undergraduate and graduate programs of study. Through its undergraduate major courses of study, which are undergirded by a traditional liberal arts program, and through its graduate school, which has a decidedly professional focus, the university embraces its founding principle of educational opportunity. With a commitment to the education of minorities in American society, the university seeks to reflect in all of its programs the diversity present in the world. The university advances the study and preservation of African American history, art and culture. Grambling State University is a community of learners who strive for excellence in their pursuit of knowledge and who seek to contribute to their respective major academic disciplines. The university prepares its graduates to compete and succeed in careers related to its programs of study, to contribute to the advancement of knowledge, and to lead productive lives as informed citizens in a democratic society. The university provides its students a living and learning environment which nurtures their development for leadership in academics, athletics, campus governance, and in their future pursuits. The university affords each student the opportunity to pursue any program of study provided that the student makes reasonable progress and demonstrates that progress in standard ways. Grambling fosters in its students a commitment to service and to the improvement in the quality of life for all persons. The university expects that all persons who matriculate and who are employed at Grambling will reflect through their study and work that the University is indeed a place where all persons are valued, “where everybody is somebody.”
GOALS
The university aims to produce graduates from its undergraduate programs who (1) possess excellent oral and written communication, numeracy, and computer technology skills, (2) understand the basic laws that describe the physical universe, (3) understand the evolution of biological systems, (4) are able to think critically, (5) understand the development of economic, political, and social systems, (6) understand the history of civilization and the contributions of African Americans, (7) have knowledge of a language and culture other than their own, (8) practice high ethical standards of conduct, and (9) show through their work a commitment to service for humankind, and (10) have acquired skills and knowledge in a major academic discipline that afford them the option of graduate/professional study or career employment. The university also aims through its graduate programs (1) to produce graduates who are able to contribute to the advancement of their fields, and (2) to produce research that advances the academic disciplines in which programs are offered.

2
University of Louisiana System Board of Supervisors Officers
Elsie Burkhalter .......................................................................Chair Winfred Sibille ........................................................................Vice Chair Wayne Parker ........................................................................ Parliamentarian
Board Members Paul Aucoin Andre Coudrain Edward J. Crawford, III Mildred Gallot Gregory Hamer, Sr E. Gerald Herbert Jeff Jenkins Renee Lapeyrolerie Jimmy Long, Sr. Russell Mosely Carl Shetler Dr. Eunice Smith Morgan Verrette
Grambling State University Current Administration
President ................................................................................ Dr. Horace A. Judson Provost and Vice President for Academic Affairs ................... Dr. Robert Dixon Dean, College of Arts & Science .................................Dr. Connie Walton-Clement Interim Dean, College of Business .............................. Dr. Matthew Uwakonye Dean, College of Education......................................... Dr. Sean Warner Interim Dean, Professional Studies ............................. Dr. Rama Tunuguntla Associate Vice President for Research and Dean of the Graduate School ............................ Dr. Janet Guyden Vice President for Student Affairs .......................................... Dr. Stacey Duhon Vice President for Finance .....................................................Mr. Daarel E. Burnette

Elise Burkhalter Chair
Winfred Sibille Vice Chair
Wayne Parker Parliamentarian
Morgan Verrette Student Member McNeese State
Andre Courdrain
Paul Aucoin
Edward J. Crawford III
Mildred Gallot
Gregory Hamer, Sr
E. Gerald Herbert
Jeff Jenkins
Renee Lapeyrolerie
Jimmy Long, Sr
Russell Mosely
Carl Shetler
Dr. Eunice Smith

Horace Judson President
Daarel Burnette Vice President of Finance
Robert Dixon Provost and Vice President of Academic Affairs
Stacey Duhon Vice President of Student Affairs

ULS Board of Supervisors
President Horace A. Judson
Internal Auditor
Title III Programs
Athletics Director Athletics Compliance Officer
Center for International Programs
Executive Assistant to the President
EEO Officer*
Provost and V.P. for Academic Affairs Dr. Robert M. Dixon
V.P. for Student Affairs Dr. Stacey Duhon, Interim V.P.
V.P. for Institutional Advancement Vacant
V.P. for Finance & Administration Mr. Daarel Burnette
College of Professional Studies
College of Arts & Sciences
College of Business
College of Education
Favrot Student Union
Judicial Affairs
Intramural Sports and Recreation
United Campus Ministry
Student Counseling Services
Cheerleaders
Career Services
Development
Alumni and Public Relations
Government Relations
Corporate Relations
Budget and Planning
Controller
Human Resources/EEO*
Administrative Services
Grants & Contracts Administration
Information Technology
School of Graduate dies and Research
Planning and titutional Research
University Library
Enrollment Management
Admissions & Recruitment
Re
School of Social Work
School of Nursing
ancial Aid cademic Support Special Programs
Distance Learning
General Education
University Organizational Chart Revised on April 6, 2009
Purchasing
Living & Learning++
Academic Assessmen
Stu
Ins
Aand
Facilities
University Police
Residential Life
Foster-Johnson Health Center
Student Government Association
Air Force ROTC**
Army ROTC
High Ability And
Retention
Summer School *Dual responsibility
**Available through LA Tech
++An experimental program Trio Programs
t Marching Band Orchesis Dance
Troupe
Student Clubs and Organizations
Quality Enhancement Plan
Network Services
Re
Fin
Sch
cords and gistration
& olarships
Dr.

College/School/Department Accrediting Agencies
Art National Association of Schools of Art and Design (membership only) Applied Music-Performance National Association of Schools of Music (NASM) Chemistry American Chemical Society (ACS) Computer Science Accreditation Board for Engineering and Technology Drafting Design Technology Accreditation Board for Engineering and Technology Electronics Engineering Technology Accreditation Board for Engineering and Technology Theatre National Association of Schools of Theatre (NAST)
Accounting AACSB: The International Association for Management Education Computer Information Systems AACSB: The International Association for Management Education Economics AACSB: The International Association for Management Education Management AACSB: The International Association for Management Education Marketing AACSB: The International Association for Management Education
Curriculum and Instruction National Council for Accreditation of Teacher Education (NCATE) Developmental Education National Council for Accreditation of Teacher Education (NCATE) Early Childhood Education National Council for Accreditation of Teacher Education (NCATE) Elementary Education National Council for Accreditation of Teacher Education (NCATE) Educational Leadership National Council for Accreditation of Teacher Education (NCATE) Leisure Studies (Kinesiology) National Recreation and Park Association (NRPA) Middle School Education-English & Mathematics National Council for Accreditation of Teacher Education (NCATE) Special Education/Special Education (Mild/Moderate) National Council for Accreditation of Teacher Education (NCATE) Teacher Education Programs National Council for Accreditation of Teacher Education (NCATE)
Mass Communication Accrediting Council on Education in Journalism and Mass Communication (ACEJMC) Public Administration National Association of Schools of Public Affairs and Administration (NASPAA) School of Nursing National League for Nursing Accrediting Commission (NLN) School of Social Work Council on Social Work Educaton (SWE)University Southern Association of Colleges and Schools (SACS)
COLLEGE OF PROFESSIONAL STUDIES
COLLEGE OF EDUCATION
GRAMBLING STATE UNIVERSITYis accredited by, approved by, or holds membership in the following associations.
COLLEGE OF ARTS & SCIENCES
COLLEGE OF BUSINESS

5
HISTORICAL NOTES
Presidents
Charles P. Adams (1901-1936) Ralph W. E. Jones (1936-1977) Dr. Joseph B. Johnson (1977-1991) Dr. Harold W. Lundy (1991-1994) Dr. Raymond A. Hicks (1994-1997) Dr. Leonard L. Haynes, Interim (1997-1998) Dr. Steve Alexander Favors (1998-2001) Dr. Neari F. Warner, Acting (2001-2004)
Dr. Horace A. Judson (2004-Present)
Highlights
1901 Founded by Charles P. Adams who became the first President; the Institution was first known as The
Colored Industrial and Agricultural School and was supported by private donations 1912 Became a Quasi-Public School 1918 Name changed to Lincoln Parish Training School under the direction of Lincoln Parish School Board 1928 Became a state junior college; name changed to Louisiana Negro Normal and Industrial Institute 1939 A three-year professional certificate was awarded 1940 A four-year degree program was inaugurated 1944 First Bachelor of Science degree in Elementary Education was granted 1946 Name changed to Grambling College of Louisiana 1948 Secondary Education was inaugurated 1953 Received initial accreditation from the Southern Association of Colleges and Schools (SACS) 1958 Liberal Arts Program was inaugurated; obtained full membership in SACS 1962 Attained accreditation from National Council of Accreditation for Teacher Education (NCATE) 1974 Name changed to Grambling State University; Graduate School was inaugurated 1997 Eddie Robinson, Sr. earned the title of “Winningest Collegiate Football Coach” with 324 victories in
1985, ended his career with 408 wins. 2000 Ranked first among the nation’s colleges and universities in awarding four-year degrees in computer
science to African American students 2003 Achieved 100% accreditation of the State’s mandatory degree programs.

6
GSU Alumni Hall of Fame Honorees Grambling State University Alumni are recognized nationally and internationally as exceptional individuals performing or having performed, extraordinary feats within and beyond their areas of study and practice. These graduates are celebrated by bestowing them with the honor of induction in their “rightful place,” The Grambling State University Hall of Fame, Gallery of Distinction. The Grambling State University Hall of Fame was initially started in 1980, under the administration of Dr. Joseph B. Johnson and was dormant since 1996. Restoring the Hall of Fame is consistent with President Horace Judson’s mission of “Reclaiming Our Legacy and Claiming Our Place.” The Gallery of Distinction, authorized by the current administration, resides in a select location within the buildings of each of the academic colleges and schools. Photographs of these greats are represented by class graduation dates and induction years.
Alumni Hall of Fame Gallery of Distinction
Fall 2008 Hall of Fame Inductees

UNIVERSITY WEBSITEAlbany State University http://asuweb.asurams.edu/asu/Alcorn State University http://www.alcorn.eduDelaware State University http://www.desu.edu/Delta State University http://www.deltastate.edu/pages/1.aspElizabeth City State University http://www.ecsu.edu/Fayetteville State University http://www.uncfsu.edu/Fort Valley State University http://www.fvsu.edu/Jacksonville State University http://www.jsu.edu/Mississippi Valley State http://www.mvsu.eduNorfolk State University http://www.nsu.edu/North Carolina Central University http://www.nccu.eduNortheastern State University http://www.nsuok.edu/Northwestern State University http://www.nsula.eduSavannah State University http://www.savstate.edu/South Carolina State University http://www.scsu.eduVirginia State University http://www.vsu.edu
Grambling State University'sPeer Institutions

INSTITUTIONS Student Enrollment
Violent Crime
Murder & Non-Negligant
Manslaughter
Forcible Rape Robbery Aggravated
AssaultProperty
Crime Burglary Larceny-Theft
Motor Vehicle Theft
Arson Total
Nicholls State University 6,804 6 0 1 0 5 36 3 32 1 0 84
Southern A & M University 8,624 9 0 2 3 4 179 13 161 5 0 376
Grambling State University 5,065 8 0 1 1 6 173 99 69 5 0 362
McNeese State University 8,327 2 0 0 0 2 91 9 80 2 0 186
University of Louisiana at Monroe 8,576 7 0 0 2 5 153 17 132 4 0 320
Albany State University 3,927 3 0 0 0 3 110 3 107 0 0 226
Delaware State University 3,690 10 1 2 3 4 47 13 33 1 0 114
Elizabeth State University 3,061 11 0 0 4 7 0 37 2 0 61
Fayetteville State University 6,031 2 0 1 1 0 138 5 128 5 0 280
Jacksonville State University 8,957 5 0 0 1 4 120 36 83 1 1 251
Norfolk State University 6,238 11 1 2 3 5 169 56 107 6 3 363
North Carolina Central University 8,675 14 0 0 4 10 251 40 204 7 0 530
South Carolina State University 4,384 13 0 0 6 7 187 62 123 2 1 401
Source: http://www.fbi.gov - The official site of the U.S. Federal Bureau of Investigation.
2007 CRIME STATISTICS BY OFFENSEComparison of Grambling State University to Peers
Ranked in Order of Total Crimes

GSU
Section II
STUDENT PROFILE
A. First-Time Freshmen B. Enrollment Information C. Progression and Graduation

Semester Applied Admitted EnrolledYield of
Admitted to Enrolled
Semester Applied Admitted EnrolledYield of
Admitted to Enrolled
Fall 2008 689 252 195 77.4% Fall 2008 6,075 2,000 1,215 60.8%
Source: GSU Office of Admissions and Statewide Student Profile System
First-time TransfersApplied, Admitted, Enrolled
First-time FreshmenApplied, Admitted, Enrolled
Number of Students Applying, Admitted and EnrolledFirst-time Freshmen and First-time Transfers
0 200 400 600 800
AppliedAdmittedEnrolled
Fall 2008First ‐ Time Transfers
0 2,000 4,000 6,000 8,000
AppliedAdmittedEnrolled
Fall 2008First ‐ Time Freshmen

Semester Applied Admitted EnrolledYield of
Admitted to Enrolled
Fall 2004 3,931 2,300 1,186 51.6%
Fall 2005 4,460 2,065 1,157 56.0%
Fall 2006 4,630 1,975 1,142 57.8%
Fall 2007 5,957 1,793 1,210 67.5%
Fall 2008 6,075 2,000 1,215 60.8%
Source: GSU Office of Admissions and Statewide Student Profile System
Semester Applied Admitted EnrolledYield of
Admitted to Enrolled
Fall 2004 527 354 213 60.2%
Fall 2005 613 385 216 56.1%
Fall 2006 654 368 212 57.6%
Fall 2007 932 383 215 56.1%
Fall 2008 689 252 195 77.4%
Source: GSU Office of Admissions and Statewide Student Profile System
First-time FreshmenApplied, Admitted, Enrolled
First-time TransfersApplied, Admitted, Enrolled
Number of Students Applying, Admitted and EnrolledFirst-time Freshmen and First-time Transfers
0.0%
10.0%
20.0%
30.0%
40.0%
50.0%
60.0%
70.0%
80.0%
2004 2005 2006 2007 2008
Yield of Admitted to Enrolled
First-time Freshmen Transfers

Semester Full-time Part-timeFall 2008 17.2 16.4Sources: ACT Profiles and University data system
Average ACT Composite Scores
17.2
16.4
16 16.5 17 17.5
Full‐time
Part‐time
Fall 2008
14

Semester Full-time Part-timeFall 2004 16.3 14.2Fall 2005 16.2 14.6Fall 2006 16.2 16.2Fall 2007 16.6 16.2Fall 2008 17.2 16.3Sources: ACT Profiles and University data system
Average ACT Composite Scores
5‐Year Trend of ACT Composite Scores for Full‐time Students
16.316.2 16.2
16.6
17.2
Fall 2004 Fall 2005 Fall 2006 Fall 2007 Fall 200816
16.2
16.4
16.6
16.8
17
17.2
17.4

Semester Undergraduate Graduate Total Percent Undergraduate
Fall 2008 4,804 449 5,253 91.5%
Source: Statewide Student Profile System
Headcount Enrollment
Headcount Enrollment Trend by Level
Percentage for Headcount Enrollment of Undergraduate and Graduate Students Fall 2008
91%
9%
Undergraduate
Graduate

Undergraduate Graduate Total Percent Undergraduate
Fall 2004 4,440 599 5,039 88.1%
Fall 2005 4,573 591 5,164 88.6%
Fall 2006 4,584 481 5,065 90.5%
Fall 2007 4,754 407 5,161 92.1%
Fall 2008 4,804 449 5,253 91.5%Source: Statewide Student Profile System
Headcount Enrollment Trend by Level
Headcount Enrollment
5‐Year Trend for Headcount Enrollment by Student Level
4,440 4,573 4,584 4,754 4,804
599 591 481 407 449
0
1,000
2,000
3,000
4,000
5,000
6,000
Fall 2004 Fall 2005 Fall 2006 Fall 2007 Fall 2008
Undergraduate Graduate

Semester Non-Resident Alien
Black, Non-Hispanic
American Indian/Alaskan
Native
Asian or Pacific
IslanderHispanic White, Non-
Hispanic Unknown Total
Fall 2008 497 4,543 11 16 16 159 11 5,253Source: Statewide Student Profile System
Headcount Enrollment
Headcount Enrollment Trend by Ethnicity
Percentage of Headcount Enrollment Trend by Ethnicity for Fall 2008
10.6%
86.4%
3.0%Black
White
Other

Semester Non-Resident Alien
Black, Non-Hispanic
American Indian/Alaskan
Native
Asian or Pacific
IslanderHispanic White, Non-
Hispanic Unknown Total
Fall 2004 80 4,685 9 8 14 197 46 5,039Fall 2005 82 4,744 9 17 18 250 44 5,164Fall 2006 203 4,510 14 26 16 251 45 5,065Fall 2007 338 4,510 9 24 17 226 37 5,161Fall 2008 497 4,543 11 16 16 159 11 5,253
Source: Statewide Student Profile System
Headcount Enrollment Trend by Ethnicity
Headcount Enrollment
93% 4% 3%
92% 5% 3%
89% 5% 6%
87% 4% 8%
86% 3% 10%
75% 80% 85% 90% 95% 100%
Fall 2004
Fall 2005
Fall 2006
Fall 2007
Fall 2008
5‐Year Percentage for Headcount Enrollment Trend by Ethnicity per Fall Semester
Black White Other

Male Female Total % Male
2,118 3,135 5,253 40%
1,999 2,805 4,804 42%
119 330 449 27%
Source: Statewide Student Profile System
Graduate
Headcount Enrollment by Gender
Headcount Enrollment
Semester
Fall 2008
Undergraduate
Percentage of Undergraduate Headcount Enrollment by Gender Fall 2008
42%
58%
Male Female
Percentage of Graduate Headcount Enrollment by Gender Fall 2008
27%
73%
Male Female

Male Female Total % Male
Fall 2004 1,976 3,063 5,039 39%
Fall 2005 2,107 3,057 5,164 41%
Fall 2006 2,082 2,983 5,065 41%
Fall 2007 2,154 3,007 5,161 42%
Fall 2008 2,118 3,135 5,253 40%
Source: Statewide Student Profile System
Headcount Enrollment
Headcount Enrollment by Gender
1,976
3,063
2,107
3,057
2,082
2,983
2,154
3,007
2,118
3,135
0
2,000
4,000
6,000
Fall2004
Fall2005
Fall2006
Fall2007
Fall2008
5‐Year Trend for Headcount Enrollment by Gender
Male Female

Classification Male Female Total Percent Male
Preparatory 2 8 10 20.0%
Freshman 898 1,050 1,948 46.1%
Sophomore 363 495 858 42.3%
Junior 299 449 748 40.0%
Senior 437 803 1,240 35.2%
Graduate 119 330 449 26.5%
Total 2,118 3,135 5,253 40.3%Source: Statewide Student Profile System
Headcount Enrollment
Headcount Enrollment by Classification and Gender
Percentage of Headcount Enrollment by ClassificationPreparatory
0%
Freshman38%
Sophomore16%
Junior14%
Senior23%
Graduate9%

2004 2005 2006 2007 2008
Preparatory x x x 8 10
Freshman 2001 2,014 1,852 1,988 1,948
Sophomore 766 819 848 836 858
Junior 638 695 743 736 748
Senior 1035 1,045 1,141 1,186 1,240
Graduate 599 591 481 407 449
Total 5,039 5,164 5,065 5,161 5,253Source: Statewide Student Profile System
5-Year Trend for Headcount Enrollment by Classification
Headcount Enrollment
2001 766 638 1035 599
2,014 819 695 1,045 591
1,852 848 743 1,141 481
1,988 836 736 1,186 407
1,948 858 748 1,240 449
0 1000 2000 3000 4000 5000 6000
2004
2005
2006
2007
2008
5‐Year Trend for Headcount Enrollment by Student Classification
Freshman Sophomore Junior Senior Graduate

Full-time Part-time Total Percent Part-time
Fall 2008 4,750 503 5,253 9.6%
Source: Statewide Student Profile System
Headcount Enrollment
Headcount Enrollment by Status
Headcount Enrollment by Full‐ and Part‐time Student Status Fall 2008
90%
10%
Full‐time
Part‐time

Fall Semester Full-time Part-time Total Percent Part-time
Fall 2004 4,470 569 5,039 11.3%Fall 2005 4,564 600 5,164 11.6%Fall 2006 4,537 528 5,065 10.4%Fall 2007 4,597 564 5,161 10.9%Fall 2008 4,750 503 5,253 9.6%
Source: Statewide Student Profile System
Headcount Enrollment by Status
Headcount Enrollment
5‐Year Trend for Headcount Enrollment by Full‐ and Part‐time Student Status
4,470 4,564 4,537 4,597 4,750
569 600 528 564 503
0
500
1,000
1,500
2,000
2,500
3,000
3,500
4,000
4,500
5,000
2004 2005 2006 2007 2008
Full‐time
Part‐time

Male Female Subtotal Male Female Subtotal
Under 18 6 11 17 0 0 0 17
18-19 688 936 1,624 0 0 0 1,624
20-21 602 757 1,359 0 0 0 1,359
22-24 487 637 1,124 14 64 78 1,202
25-29 157 217 374 37 77 114 488
30-34 26 87 113 20 47 67 180
35-39 15 57 72 17 33 50 122
40-49 9 71 80 16 69 85 165
50 & Over 9 32 41 15 40 55 96
TOTALS 1,999 2,805 4,804 119 330 449 5,253
Source: Statewide Student Profile System
UNDERGRADUATE GRADUATE
Headcount Enrollment
TotalAge Range
Headcount Enrollment by Age, Level and GenderFall 2008
Headcount Enrollment by Age for Fall 2008
0
200
400
600
800
1,000
1,200
1,400
1,600
1,800
Unde
r 18
18‐1
9
20‐2
1
22‐2
4
25‐2
9
30‐3
4
35‐3
9
40‐4
9
50 &
Ove
r
Num
ber En
rolled

2004 2005 2006 2007 2008
Under 18 18 19 14 25 17
18-19 1,555 1,538 1,438 1,570 1,624
20-21 1,330 1,447 1,465 1,413 1,359
22-24 1,064 1,049 1,122 1,158 1,202
25-29 424 465 478 486 488
30-34 203 205 195 176 180
35-39 126 126 109 106 122
40-49 219 213 163 142 165
50 & Over 100 102 81 85 96
Mean Age 23.43 23.39 23.09 22.87 23.10
TOTALS 5,039 5,164 5,065 5,161 5,253
Source: Statewide Student Profile System
Headcount Enrollment
Headcount Enrollment by Age5-yr Trend
5‐Year Trend for Headcount Enrollment by Age
1072 1111 1026 995 1051
3967 4053 4039 4166 4202
500
2000
3500
5000
2004 2005 2006 2007 2008
Non‐Traditional (25+) Traditional (<24)

Male FemaleArmenia 0 2 2Belize 2 0 2Bulgaria 1 1 2Burma 0 2 2Burundi 3 0 3Belarus 0 1 1Cambodia 3 0 3Cameroon 18 22 40Canada 4 2 6China 1 1 2Dominica 19 48 67France 1 0 1Ghana 1 0 1Gabon 1 0 1India 1 0 1Jamaica 6 8 14Kenya 6 7 13Kyrgyzstan 0 2 2Kuwait 1 0 1Kazakhstan 0 1 1Lebanon 1 0 1Mexico 1 0 1Nepal 81 22 103Nigeria 8 4 12Poland 0 1 1Romania 0 1 1Russia 0 2 2Rwanda 0 3 3Saudi Arabia 1 1 2South Africa 0 2 2St. Kitts and Nevis 0 1 1St. Lucia 61 118 179Syria 0 1 1Sri Lanka 1 1 2Taiwan 1 0 1Tanzania 1 0 1Trinidad and Tobago 4 6 10Turkey 2 0 2Thailand 1 5 6Uganda 2 1 3United Arab Emirates 0 1 1Zambia 0 1 1Zimbabwe 0 1 1Unknown 1 2 3
Foreign Totals 234 271 505Out-of-state Totals 798 1,039 1,837Louisiana Totals 1,087 1,824 2,911Institution Totals 2,119 3,134 5,253Source: Statewide Student Profile System
Gender TotalsCountry
Enrollment by CountryFall 2008

Male FemaleAlabama 38 19 57Alaska 5 4 9Arizona 2 9 11Arkansas 34 44 78California 104 190 294Colorado 9 15 24Connecticut 0 3 3Delaware 1 3 4District of Columbia 1 4 5Florida 55 31 86Georgia 50 53 103Illinois 79 113 192Indiana 9 15 24Iowa 0 3 3Kansas 3 4 7Kentucky 2 1 3Maryland 20 21 41Massachusetts 2 2 4Michigan 37 52 89Minnesota 1 8 9Mississippi 29 36 65Missouri 18 18 36Nebraska 0 1 1Nevada 5 10 15New Jersey 8 6 14New Mexico 1 1 2New York 14 11 25North Carolina 8 5 13North Dakota 0 1 1Ohio 11 15 26Oklahoma 8 7 15Oregon 6 9 15Pennsylvania 2 7 9South Carolina 8 7 15Tennessee 9 13 22Texas 191 266 457Utah 0 2 2Virginia 11 10 21Washington 5 13 18Wisconsin 7 7 14Unknown 5 0 5
Out-of-state Totals 798 1,039 1,832Louisiana Totals 1,087 1,824 2,911Foreign Totals 234 271 505Institution Totals 2,119 3,134 5,253Source: Statewide Student Profile System
GenderTotalsState
Enrollment by StateFall 2008

Parish Fall '04 Fall '05 Fall '06 Fall '07 Fall '08Acadia 17 11 16 14 11Allen 21 11 10 9 6Ascension 5 7 9 11 7Assumption 7 6 8 8 10Avoyelles 15 23 16 13 13Beauregard 8 12 7 7 8Bienville 128 119 139 122 130Bossier 56 54 52 57 53Caddo 337 334 292 264 288Calcasieu 31 26 32 22 21Caldwell 5 9 4 3 7Catahoula 10 9 7 10 8Claiborne 82 85 89 75 59Concordia 41 34 32 37 34De Soto 40 36 30 46 36East Baton Rouge 76 58 78 61 58East Carroll 126 101 74 72 58East Feliciana 7 12 16 12 11Evangeline 11 11 15 10 12Franklin 37 35 42 37 32Grant 4 5 5 3 2Iberia 16 16 12 11 10Iberville 11 13 12 8 11Jackson 121 104 115 103 104Jefferson 41 53 46 62 51Jefferson Davis 12 7 11 11 10Lafayette 11 15 24 27 25Lafourche 6 2 2 2 4La Salle 7 4 4 5 3Lincoln 858 861 692 641 531Livingston 1 1 0 1Madison 53 66 64 68 79Morehouse 85 83 76 87 113Natchitoches 21 29 35 18 21Orleans 142 154 132 134 111Ouachita 416 433 474 474 444Plaquemines 4 6 3 3 6Ponte Coupee 0 1 1 2 1Rapides 78 68 68 62 80Red River 5 5 0 1 5Richland 48 47 53 49 38Sabine 6 7 4 5 7St. Bernard 2 5 1 2 3
Headcount Enrollment by Parish

Parish Fall '04 Fall '05 Fall '06 Fall '07 Fall '08St. Charles 9 8 8 7 6St. Helena 1 7 2 1 2St. James 7 8 4 3 2St. John 6 10 19 21 18St. Landry 25 34 43 40 32St. Martin 9 6 7 7 6St. Mary 5 2 8 10 12St. Tammany 5 12 8 12 15Tangipahoa 14 14 11 21 22Tensas 17 20 9 17 19Terrebonne 16 12 14 10 12Union 75 73 65 70 59Vermillion 4 5 9 8 5Vernon 8 8 13 7 8Washington 10 8 17 24 27Webster 94 97 108 98 105West Baton Rouge 4 3 7 9 6West Carroll 19 17 17 8 11West Feliciana 5 5 5 2 1Winn 29 30 36 28 22
LOUISIANA TOTAL 3,370 3,357 3,212 3,072 2,911OUT-OF-STATE TOTAL 1,595 1706 1650 1751 1837FOREIGN TOTAL 74 101 203 338 505TOTAL STUDENTS 5039 5164 5065 5161 5253
Source: Statewide Student Profile System
Headcount Enrollment by Parish

2004 2005 2006 2007 2008
In-State Students3,344 3,357 3,212 3,071 2,937
Out-of-State 1,590 1,706 1,650 1,752 1,813International
Students 105 101 203 338 503TOTALS 5,039 5,164 5,065 5,161 5,253
Source: Statewide Student Profile System
Headcount Enrollment
Headcount Enrollment by Residency5-Year Trend
5‐Year Trend for Headcount Enrollment by Student Residency
3,344 3,3573,212
3,0712,937
1,590 1,706 1,650 1,752 1,813
105 101 203338
503
‐200
400
1,000
1,600
2,200
2,800
3,400
4,000
2003 2004 2005 2006 2007 2008 2009
In‐State Students Out‐of‐State International Students

2004 2005 2006 2007 *2008
Undergraduate 4,509.60 4,550.43 4,585.83 4,732.10 4,660.00
Graduate 522.91 498.75 430.25 330.83 361.58
Total FTE 5,032.51 5,049.18 5,016.08 5,062.93 5,021.58
Source: Statewide Student Profile System
Full-time Equivalent Enrollment (FTE)by Level
Fall SemesterLEVEL
Enrollment Trends by Level
Trend Comparison of FTE and Headcount Enrollment
5,0335,049 5,016 5,063 5,022
5,039
5,1645,065 5,161
5,253
4,500
5,500
2004‐05 2005‐06 2006‐07 2007‐08 2007‐08
FTEHeadcount
33

First-time Full-time Freshmen Entering Number Returning Retention Rate
Fall 2007 to Fall 2008 1184 694 58.6%
Source: Board of Regents
First to Second Year Retention Rates
First to Second Year Retention RatesFall 2007 to Fall 2008
694
1184Number Returning
First‐time Full‐timeFreshmen Entering Fall2007
Retention Rate58.6%
34

Semester First-time Full-time Freshmen Entering Number Returning Retention Rate
Fall 2003 to Fall 2004 1027 643 62.6%
Fall 2004 to Fall 2005 1169 673 57.6%
Fall 2005 to Fall 2006 1131 621 54.9%
Fall 2006 to Fall 2007 1122 663 59.1%
Fall 2007 to Fall 2008 1184 694 58.6%
Source: Board of Regents
First to Second Year Retention Rates
First to Second Year Retention Rates
62.6%
57.6%
54.9%
59.1% 58.6%
54.0%55.0%56.0%57.0%58.0%59.0%60.0%61.0%62.0%63.0%64.0%
2003‐04 2004‐05 2005‐06 2006‐07 2007‐08
35

First-time Full-time Cohort
Number Graduating
2002 851 296 35%Source: Board of Regents
Six-Year Graduation Rate 2002 Cohort
Entering Term Graduation Rate
2002 First‐time Freshmen
851
2007‐08 Graduates
29635%
First‐time Full‐timeCohort
Number Graduating
36

Entering Term First-time Full-time Cohort
Number Graduating
GraduationRate
1998 760 273 36%1999 690 260 38%2000 908 361 40%2001 886 299 34%2002 851 296 35%
Source: Board of Regents
Six-Year Graduation Rates
GRADUATION RATES
36%38%
40%
34%35%
31%
32%
33%
34%
35%
36%
37%
38%
39%
40%
2004 2005 2006 2007 2008
Six‐Year Graduation Rates
2004
2005
2006
2007
2008
37

2007-08342232
Subtotal 5742007-08
6729
Subtotal 962007-08
409261
Total 670
Source: Statewide Student Profile System
TOTALS
FemaleMale
FemaleMale
FemaleMale
DEGREES AWARDED BY LEVEL AND GENDER ACADEMIC YEAR 2007-08
Degrees Awarded by Level and Gender Academic Year 2007-08
Undergraduate
Graduate
Undergraduate
342232
UndergraduateFemale
UndergraduateMale
Graduate
67
29 GraduateFemale
GraduateMale
38

Level Gender 2003-04 2004-05 2005-06 2006-07 2007-08
Female 408 374 324 351 342Male 194 191 196 202 232Subtotal 602 565 520 553 574
Female 92 98 124 130 67Male 41 38 45 43 29Subtotal 133 136 169 173 96
Female 500 472 448 481 409Male 235 229 241 245 261Total 735 701 689 726 670
Source: Statewide Student Profile System
DEGREES AWARDED BY LEVEL AND GENDER
Undergraduate
Graduate
TOTALS
Degrees Awarded by Level and Gender
Degrees Awarded by Gender
235 229 241 245 261
500 472 448 481409
735 701 689 726670
0
200
400
600
800
2003‐04 2004‐05 2005‐06 2006‐07 2007‐08
Male Female Total
39

2007-08
Black 1
White 0
Other 0
Black 35
White 1
Other 0
Black 475
White 39
Other 23
Black 76
White 12
Other 5
Black 3
White 0
Other 0
Source: Statewide Student Profile System
Degrees Awarded by Level of Degree and Race
Certificate-1 yr.
Associate
Bachelor
Masters
Doctoral 1
0
0
35
1
0 475
39
23
76
12
5
3
0
0
Black
White
Other
Black
White
Other
Black
White
Other
Black
White
Other
Black
White
Other
Certificate‐1
yr.
Associate
Bachelor
Masters
Doctoral
40

Degree Level Race 2003-04 2004-05 2005-06 2006-07 2007-08
Black 3 1 0 0 1
White 1 1 0 0 0
Other 0 0 0 0 0
Subtotal 4 2 0 0 1
Black 33 50 35 33 35
White 0 1 0 1 1
Other 2 0 0 2 0
Subtotal 35 51 35 36 36
Black 548 489 452 486 475
White 5 3 7 19 39
Other 10 20 26 12 23
Subtotal 563 512 485 517 537
Black 108 115 134 140 76
White 19 14 27 23 12
Other 4 1 4 7 5
Subtotal 131 130 165 170 93
Black 1 4 2 0 3
White 1 2 2 2 0
Other 0 0 0 1 0
Subtotal 2 6 4 3 3
735 701 689 726 670
Source: Statewide Student Profile System
Degrees Awarded by Level of Degree and Race
Certificate-1 yr.
Total
Associate
Baccalaureate
Masters
Doctoral
41

DEGREES DESCRIPTION 2003-2004 2004-2005 2005-2006 2006-2007 2007-2008
Certificate Paralegal Studies 4 2 0 0 1
4 2 0 0 1
Associate Child Development 20 22 17 18 10
Associate Criminal Justice 11 24 15 15 20
Associate Paralegal Studies 4 5 3 3 6
35 51 35 36 36
Bachelors Accounting 19 21 17 18 14
Bachelors Applied Music - Performance 3 3 2 2 1
Bachelors Art 1 2 1 1 5
Bachelors Art Education 0 0 0 1 1
Bachelors Automotive Engineering Technology 5 1 2 0 0
Bachelors Biology 43 32 24 29 33
Bachelors Business and Office Education 0 0 0 0 0
Bachelors Chemistry 4 4 7 6 9
Bachelors Communication and Theatre Education 0 1 0 0 0
Bachelors Computer Information Systems 69 64 45 52 44
Bachelors Computer Science 20 16 9 3 6
Bachelors Construction Engineering Technology 1 0 1 0 0
Bachelors Criminial Justice 70 50 58 56 57
Bachelors Drafting Design Technology 1 4 0 2 14
Bachelors Early Childhoiod Ed GR PK-3 1 0 1 1 3
Bachelors Economics 3 2 2 7 2
Bachelors Electronic Enginering Technology 8 5 9 10 12
Bachelors Elementary Education GR 1-6 13 8 8 8 9
Total Certificate Degrees Awarded
5-Year Trend in Degrees Awarded by Level & Program
Total Associate Degrees Awarded

DEGREES DESCRIPTION 2003-2004 2004-2005 2005-2006 2006-2007 2007-2008
5-Year Trend in Degrees Awarded by Level & Program
Bachelors English Education 0 2 2 2 0
Bachelors English, General 9 9 9 7 5
Bachelors History 6 1 1 2 8
Bachelors Home Economics Education 0 0 0 0 0
Bachelors Hotel/Restaurant Management 11 16 13 4 6
Bachelors Kinesiology 2 14 19 19 25
Bachelors Leisure Studies 30 18 14 13 24
Bachelors Management 24 38 35 45 42
Bachelors Manufacturing Engineering Tech. 3 2 0 1 1
Bachelors Marketing 34 28 33 44 24
Bachelors Mass Communication 37 26 38 34 37
Bachelors Mathematics 2 1 6 1 1
Bachelors Music Education 1 4 1 2 5
Bachelors Nursing 29 44 42 61 64
Bachelors Paralegal Studies 11 17 12 12 8
Bachelors Physics 0 2 0 5 2
Bachelors Political Science 15 5 8 6 10
Bachelors Political Science (Pre-Law) 5 2 1 1 2
Bachelors Psychology, General 38 28 25 25 20
Bachelors Public Administration 6 3 2 3 0
Bachelors Secondary Ed. - Science & Mathematics 3 1 1 0 2
Bachelors Social Science Education 1 4 0 5 2
Bachelors Social Work 19 24 19 14 22
Bachelors Sociology 5 4 12 7 10
Bachelors Special Education 1 1 1 3 3
Bachelors Spanish 1 0 0 0 0

DEGREES DESCRIPTION 2003-2004 2004-2005 2005-2006 2006-2007 2007-2008
5-Year Trend in Degrees Awarded by Level & Program
Bachelors Speech Pathology 5 0 4 2 2
Bachelors Theatre 4 5 1 3 2
563 512 485 517 537
Masters Criminal Justice 16 16 21 11 12
Masters Developmental Education 6 9 5 3 0
Masters Elementary Education, General 4 1 0 0 0
Masters Elementary/Early Childhood Education 2 1 7 3 1
Masters Liberal Arts 1 2 0 0 0
Masters Mass Communication 9 5 1 8 7
Masters Natural Sciences Education 2 1 0 0 0
Masters Nursing-Family Nurse Practioner 10 11 12 10 12
Masters Nursing-Nurse Educator 6 0 6 5 1
Masters Public Administration 29 27 48 37 22
Masters Social Science Education 4 9 10 24 5
Masters Social Work 26 26 35 48 17
Masters Sports Administration 16 22 20 21 16
131 130 165 170 93
Doctoral Curriculum & Instruction 1
Doctoral Educational Leadership 0 2 1 1 0
Doctoral Developmental Education 2 4 3 2 2
2 6 4 3 3
735 703 689 726 670University Total
Total Bachelor Degrees Awarded
Total Masters Degrees Awarded
Total Doctoral Degrees Awarded

GSU
Section III
RESOURCES
A. Employees B. Financial C. Facilities

2004 2005 2006 2007 2008
American Indian/Alaskan Native 2 2 1 0 0
Asian/Pacific Islander 6 7 7 9 9
Black 496 503 435 461 449
Hispanic 1 1 1 4 2
White 26 23 18 17 17
Non-Resident Alien 0 1 1 3 2
Unknown 0 1 1 1 1
TOTAL 531 538 464 495 480
Fall Semester Male Female Total
Fall 2004 176 355 531
Fall 2005 182 356 538
Fall 2006 157 307 464
Fall 2007 163 332 495
Fall 2008 167 313 480
Source: IPEDS
Fall Semester
Full-time Staff by Ethnicity
Full-time Staff by Gender
Ethnicity
5‐Year Trend for Full‐time Staff
531 538
464
495
480
420
440
460
480
500
520
540
560
2004 2005 2006 2007 2008
Fall Semesters
Staff
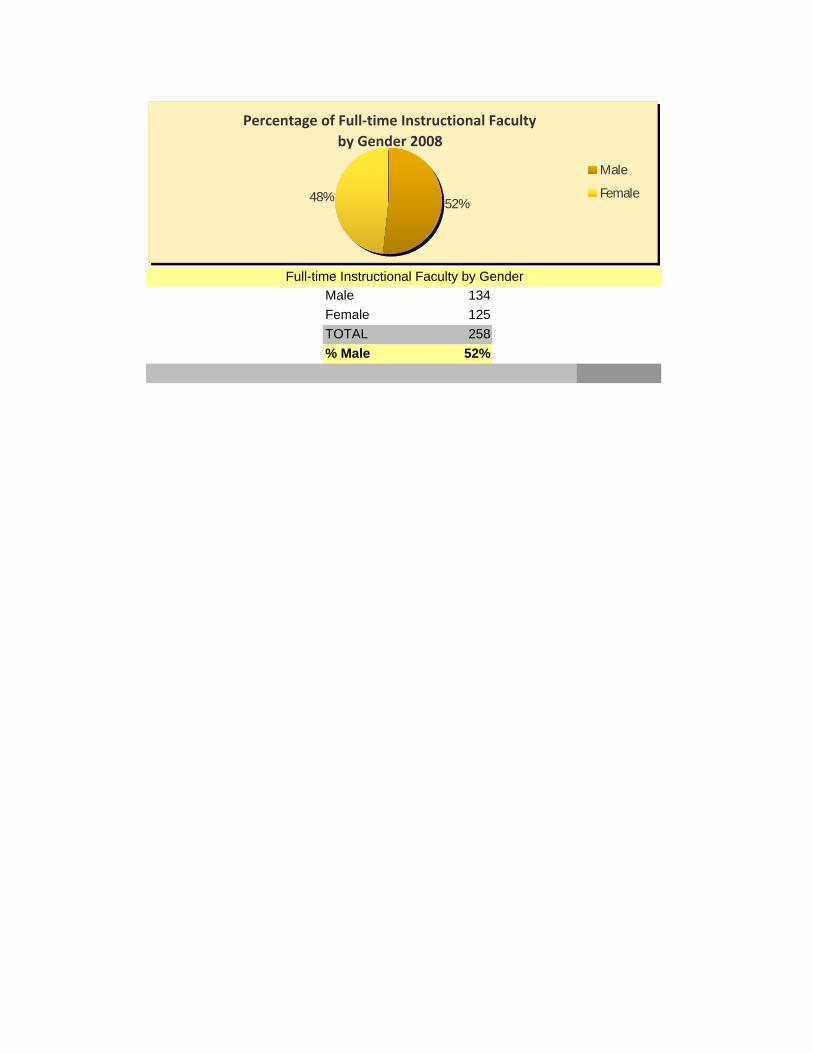
Male 134Female 125TOTAL 258% Male 52%
Full-time Instructional Faculty by Gender
Percentage of Full‐time Instructional Faculty by Gender 2008
52%48%
Male
Female

Gender 2004 2005 2006 2007 2008
Male 131 136 136 130 134Female 113 115 112 119 125TOTAL 244 251 248 249 259% Male 53% 54% 55% 52% 52%
5-Year Trend of Full-time Instructional Faculty by GenderFall Semesters
5‐Year Trend Percentage Male Full‐time Instructional Faculty
53%54%
55%
52% 52%50%51%52%53%54%55%56%
Series2
Series1

58
51
102
34
14
259
*New Category for Fall 2008 Source: IPEDS
Assistant Professor
Instructor
*Lecturer
Total
Full-time Instructional Faculty by Rank
2008
Professor
Associate Professor
Full‐time Instructional Faculty by Rank 2008
58
34
14
51
102
0
20
40
60
80
100
120
Professor AssociateProfessor
AssistantProfessor
Instructor *Lecturer

2004 2005 2006 2007 2008Professor 62 66 67 64 58
Associate Professor 47 51 49 56 51
Assistant Professor 100 101 100 94 102
Instructor 35 33 32 35 34
*Lecturer 14
Total 244 251 248 249 259
*New Category for Fall 2008 Source: IPEDS
Full-time Instructional Faculty by Rank
Fall Semesters
5‐Year Trend of Full‐time Instructional Faculty by Rank
62 66 67 64 58
47 51 49 56 51
100 101 100 94 102
35 33 32 35 34
0
50
100
150
200
250
300
2004 2005 2006 2007 2008
Instructor
Assistant Professor
Associate Professor
Professor

Fall Semesters
2008
Professor 72,700.00$ Associate Professor 63,013.00$ Assistant Professor 53,200.00$
Instructor 42,800.00$
*Lecturer 45,400.00$
All Ranks 57,700.00$
*New IPEDS Category for Fall 2008Source: IPEDS
Average Salary of Full-time Faculty by Rank
Average Salary of Full‐time Faculty by Rank for Fall 2008
$72,700.00
$63,013.00
$53,200.00
$42,800.00
$45,400.00
$57,700.00
Professor
Associate Professor
Assistant Professor
Instructor
*Lecturer
All Ranks

2005 2006 2007 2008
Professor 64,500.00$ 67,500.00$ 73,600.00$ 72,700.00$
Associate Professor 55,200.00$ 56,800.00$ 61,900.00$ 63,013.00$
Assistant Professor 48,600.00$ 51,000.00$ 53,500.00$ 53,200.00$
Instructor 36,600.00$ 38,400.00$ 41,400.00$ 42,800.00$
*Lecturer 45,400.00$
All Ranks 52,500.00$ 55,000.00$ 58,900.00$ 57,700.00$
*New IPEDS Category for Fall 2008Source: IPEDS
Fall SemestersRank
Average Salary of Full-time Faculty by Rank
$52,500.00
$55,000.00
$58,900.00 $57,700.00
$48,000.00
$50,000.00
$52,000.00
$54,000.00
$56,000.00
$58,000.00
$60,000.00
2005 2006 2007 2008
5‐Year Trend for Average Salary of Full‐Time Faculty for All Ranks

Tenured On Tenure Track Not Eligible Total Percent
Tenured
Fall 2008 128 70 61 259 49.4%
Source: IPEDS
Number and Percentage of Full-Time Instructional Facultyby Tenure Status
Percentage of Full‐time Instructional Faculty by Tenure Status Fall 2008
49.4%
27% 23.6%
0
20
40
60
80
100
120
140
Tenured On Tenure Track Not Eligible
Fall 2008

Semester Tenured On Tenure Track Not Eligible Total Percent
Tenured
Fall 2004 135 53 56 244 55.3%
Fall 2005 139 68 44 251 55.4%
Fall 2006 139 73 36 248 56.0%
Fall 2007 132 74 43 249 53.0%
Fall 2008 128 70 61 259 49.4%
Source: IPEDS
Number and Percentage of Full-Time Instructional Facultyby Tenure Status
5‐Year Trend Percentage Tenured Full‐Time Instructional Faculty
55.3% 55.4%56.0%
53.0%
49.4%
46.0%
48.0%
50.0%
52.0%
54.0%
56.0%
58.0%
Fall 2004 Fall 2005 Fall 2006 Fall 2007 Fall 2008

Student Fees 2004-05 2005-06 2006-07 2007-08 2008-09
In-Sate 3,410$ 3,505$ 3,606$ 3,622$ 3,804$ Out-of-State 8,760$ 8,856$ 8,956$ 8,972$ 9,154$
Room 1,938$ 2,138$ 2,476$ 2,600$ 5,202$ Board 1,674$ 1,866$ 2,242$ 2,442$ -$
Source: IPEDS Room and Board combined costs for 2008-09
Student Costs
Tuition and Mandatory Fees
Room and Board Charges
Annual 2008‐09 In‐State Enrollment Costs
$3,804Tuition & Fees
$5,202Room & Board

Academic Year Opportunity Performance Honors Total
2004-2005 129 23 2 154
2005-2006 152 16 2 170
2006-2007 180 17 1 198
2007-2008 150 17 3 170
2008-2009 161 21 0 182Source: LA Office of Student Financial Assistance
Students Receiving TOPS by Type of Award
Number of Students Receiving TOPS
0
50
100
150
200
250
Series1 154 170 198 170 182
2004‐2005 2005‐2006 2006‐2007 2007‐2008 2008‐2009

Source of Funds 2003-04 2004-05 2005-06 2006-07 2007-08Tuition and Fees 10,278,996$ 13,953,121$ 16,523,606$ 16,177,945$ 15,180,781$ Federal Appropriations -$ -$ -$ -$ -$ Operating Grants & Contracts 18,127,803$ 17,245,797$ 17,218,131$ 17,745,795$ 19,636,755$ State Appropriations 25,852,010$ 25,994,591$ 26,233,729$ 29,436,963$ 31,679,845$ Operating Grants & Contracts 2,499,414$ 2,298,131$ 2,425,389$ 2,727,894$ 3,316,017$ Local/Private Appropriations -$ -$ -$ -$ -$ Operating Grants & Contracts 243,778$ 261,825$ 792,467$ 388,736$ 254,904$ Auxiliary Enterprises (Sales & Services) 12,412,638$ 12,808,917$ 13,891,360$ 14,635,665$ 16,243,541$ Gifts 800,420$ 707,959$ 571,197$ 263,737$ 254,035$ Investment Income 130,249$ 547,009$ 33,473$ 2,639,781$ 251,475$ Other Operating & Non-Operating 1,351,634$ 1,271,215$ 1,855,859$ 1,633,475$ 1,678,459$ Other Revenues and Additions 3,854,735$ 10,430,857$ 10,358,335$ 3,716,592$ -$
Total Operating Revenues 75,551,677$ 85,519,422$ 89,903,546$ 89,366,583$ 88,495,812$
Revenues by Source of Funds
Revenues by Source of Funds
$75,551,677
$85,519,422
$89,903,546
$89,366,583
$88,495,812
$65,0
00,00
0
$70,0
00,00
0
$75,0
00,00
0
$80,0
00,00
0
$85,0
00,00
0
$90,0
00,00
0 0
2003-04
2004-05
2005-06
2006-07
2007-08

Function 2003-04 2004-05 2005-06 2006-07 2007-08Instruction 19,754,753$ 21,931,667$ 22,737,090$ 24,185,032$ 27,644,390$
Research 269,710$ 827,765$ 527,826$ 386,288$ 237,049$
Public Service 52,413$ 57,920$ 150,791$ 130,660$ 85,445$
Academic Support 7,572,938$ 8,001,182$ 8,270,152$ 9,066,345$ 9,559,847$
Student Services 3,636,073$ 4,462,094$ 4,540,911$ 5,292,581$ 7,358,884$
Institutional Support 13,563,502$ 11,504,198$ 10,531,259$ 11,919,692$ 15,382,708$
Operation and Maintenance 3,814,528$ 4,779,982$ 4,958,625$ 6,744,089$ 9,969,277$
Depreciation 3,825,063$ 3,070,564$ 3,478,897$ 3,766,583$ 4,704,962$
Scholarships and Fellowships 6,567,409$ 7,652,650$ 7,248,916$ 7,803,992$ 7,559,864$
Auxiliary Enterprises 12,652,931$ 13,236,164$ 14,751,855$ 15,304,541$ 18,591,334$
Other (Operating & Non-operating) 522,592$ 127,330$ 3,251$ 77,403$ 1,678,459$
Total E&G Expenses by Sources 72,231,912$ 75,651,516$ 77,199,573$ 84,677,206$ 102,772,219$
Educational & General Expenditures by Function
Expenditures by Function
$72,231,912
$75,651,516
$77,199,573
$84,677,206
$102,772,219
$-
$20,0
00,00
0
$40,0
00,00
0
$60,0
00,00
0
$80,0
00,00
0
$100
,000,0
00
$120
,000,0
00
2003-04
2004-05
2005-06
2006-07
2007-08

Facilities Use Code Facility ASF ASF/FTE
100 Classrooms 110,787 23.8
200 Laboratory 137,208 29.4
300 Office 189,476 40.7
400 Study 41,972 9.0
500 Special Use 166,252 35.7
600 General Use 130,079 27.9
700 Supporting 40,283 8.6
800 Medical Care 2,101 0.5
900 Residential 353,483 75.9
000 Unclassified 4,221 0.9
Other Residential 823,479 176.7
2524,660
1,175,862
*Source Board of Regents website
Total Assignable Area
Assignable Area by Room UseFall 2008
Fall 2007 Full-time Equivalent (FTE) EnrollmentTotal Facilities Assignable Square Feet (ASF)/FTE

