grain bin analysis - farmdoc: farm decision outreach ... · pdf filefast tools & resources...
TRANSCRIPT
Fast Tools & Resources
Grain Bin Analysis
With this program, the user can evaluate options related to the addition of on-farm storage for corn and soybeans. The need for and expenses of on-farm storage are considered along with the costs for hauling grain to the local elevator.
The information required to run this program and to generate analysis reports include owner information, grain bin capacities and building estimates, drying/storage assumptions for both the elevator and on-farm storage, and production assumptions. Reports generated by the program are: • Cash Flow Projection and Return on Investment • Operating Outflows and Inflows • Internal Rate of Return without Financing • Analysis Summary The information needed to run this program can come from:
• An individual’s farm records • Chicago Board of Trade (www.cbot.com) • Loan information from lender
• Grain bin installation estimate from builder • Grain elevator bid sheet • Terminal price sheets • Insurance claims
Required Inputs The following inputs are required in the OWNER INFORMATION worksheet.
Owner Information Name, crop share, discount rate, marginal tax rate, down payment, loan interest rate and loan term in years.

Fast Tools & Resources
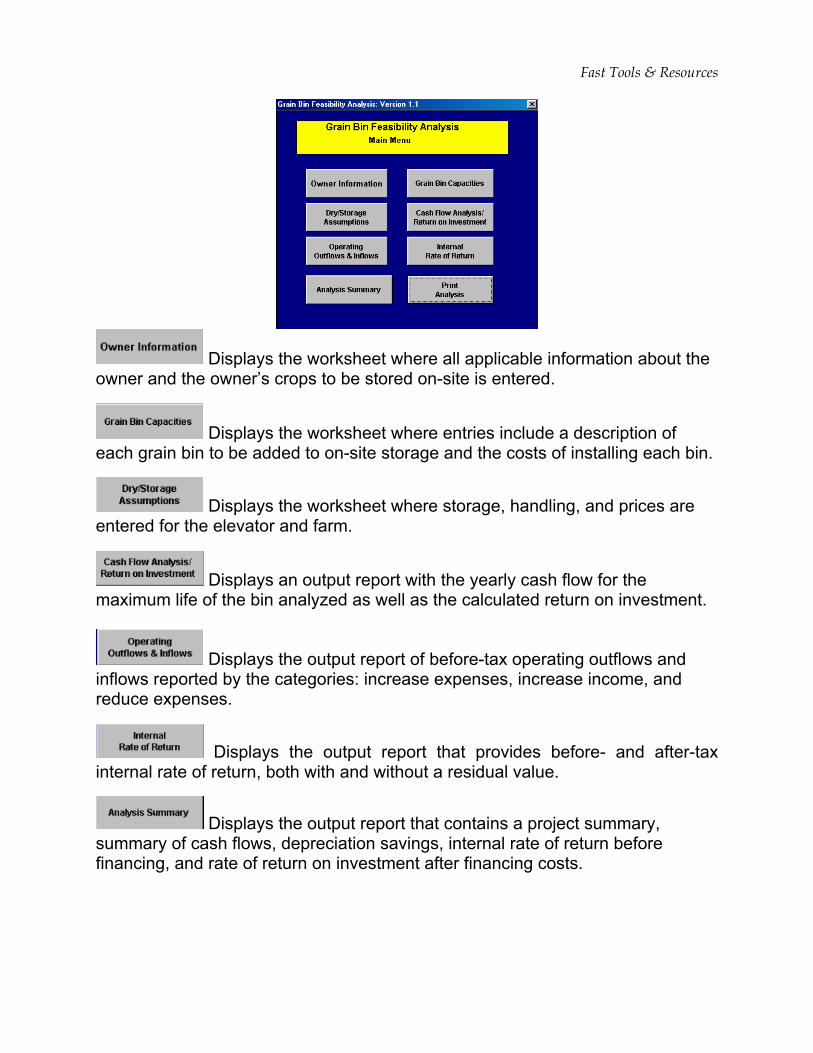
Farm Production to be Stored on Farm Number of acres and expected yield for corn and soybeans. Grain Bin Capacities and Costs Crop to be stored in new bin (corn or soybeans). Bin characteristics, such as diameter in feet, number of rings, dry-floor in inches, stirator space in inches, fill cone (yes or no), compaction factor, ring width, estimated bin costs and estimated costs for electrical wiring, site preparation and operator contributor. The following inputs are required in the DRY&STORE ASSUMPTIONS worksheet. Production Comparisons For soybeans, the percentage of additional harvest loss. For corn, the moisture percent to shrink corn to, the shrink factor, the moisture percent at harvest, and the percentage of additional harvest loss. Drying/Storage Assumptions Drying costs, storage fees and assumptions, such as minimum storage cost, date at which minimum storage ends, monthly storage cost and average sale date are needed to make the appropriate calculations. Trucking and handling costs, such as field–to-elevator and field-to-bin costs for wet bushels, bin–to-terminal costs for dry bushels, and corn and soybean premiums offered at terminal. Other revenues and costs, such as expected corn and soybean prices and ownership costs for repairs, taxes and insurance. Navigating the Program The Grain Bin Analysis program has a Main Menu with 8 buttons that help the user move among input screens and reports. Each button represents a different Excel spreadsheet found within the program. The program also provides navigation tabs located at the bottom of the Excel screen that correspond with the similar name on the buttons. The Main Menu is shown below.
Fast Tools & Resources
Displays the worksheet where all applicable information about the owner and the owner’s crops to be stored on-site is entered.
Displays the worksheet where entries include a description of each grain bin to be added to on-site storage and the costs of installing each bin.
Displays the worksheet where storage, handling, and prices are entered for the elevator and farm.
Displays an output report with the yearly cash flow for the maximum life of the bin analyzed as well as the calculated return on investment.
Displays the output report of before-tax operating outflows and inflows reported by the categories: increase expenses, increase income, and reduce expenses.
Displays the output report that provides before- and after-tax internal rate of return, both with and without a residual value.
Displays the output report that contains a project summary, summary of cash flows, depreciation savings, internal rate of return before financing, and rate of return on investment after financing costs.
Fast Tools & Resources
Automatically prints the Analysis Summary, Cash Flow Projection and Return on Investment report, Internal Rate of Return without Financing report, Operating Outflows and Inflows report, and all of the input reports. How to Use the Input Sections To explain the input required for this program, an example of John and Sally Smith’s farming operation has been developed and their information has been entered into the input sections. Owner Information Worksheet This worksheet contains four sections: OWNER INFORMATION, FARM PRODUCTION TO BE STORED ON FARM, GRAIN BIN CAPACITIES AND COSTS AND COMPUTATION OF DEPRECIATION.
OWNER INFORMATION The “Owner Information” section requires the following information: user’s name, crop share, discount rate, marginal tax rate, down payment, loan interest rate, and loan term in years. The after-tax discount rate is calculated automatically. Before-tax discount rate (dr) represents the opportunity cost of money. For operations with debt, the discount rate may be a blend of debt costs and equity capital. The blended rate also may need to be adjusted to reflect the risk inherent in the investment. For farms with no debt, the discount rate may be the return of off-farm investments, such as a CD rate.
In the John and Sally Smith example, the Smiths have an operating loan with an interest rate of d (12%) and a savings account earning interest of e (4%). The “blended” before-tax discount rate may be found using the following equation: d x (debt/asset) + e x (equity/asset) = dr or 12% x (0.5/1) + .04% x (0.5/1) = 8%.
After-tax discount rate (atdr) is calculated automatically using the discount rate (dr), the marginal tax rate (mtr), and the equation: atdr = dr x (1-mtr). For example, the Smiths have a before-tax discount rate of 8 and a marginal tax rate of 20%, then their after-tax discount rate is calculated as follows: 0.08 x (1-0.20) = 0.064 or 6.4%. FARM PRODUCTION TO BE STORED ON FARM The “Farm Production to Be Stored on Farm” section of this worksheet calculates production, proposed storage capacity, and overrun capacity. To do this, it requires entries for the number of acres and yields for the corn and soybeans to be stored in the new bins.

Fast Tools & Resources
Example John and Sally Smith just cash rented an additional 100 acres. They were told that the property has an average corn yield of 150 bushels per acre. They plan to store the entire crop on their farm; however, they need to build an additional grain bin. The Smiths’ bank approved a 10-year loan with 8.5% interest provided the Smiths make a down payment of 25% of the total cost of the bin. The Smiths’ marginal tax rate is 20%. They have a savings account that earns 4% interest and an operating loan that is charged 12% interest. The Smiths’ information is shown below.
In this example, the after-tax discount rate equals 6.4%. The estimated, normal production equals 15,000 bushels. The proposed storage capacity equals 15,254 bushels, leaving 254 bushels available as the “overrun capacity”.
GRAIN BIN CAPACITIES The GRAIN BIN CAPACITIES section of this worksheet collects information regarding the estimated dimensions and costs of each new grain bin as well as the preparation costs for installation. The worksheet contains seven rows for up to seven bin entries. The information required for each bin includes the crop to be stored - corn (C) or soybeans (S), the diameter, number of rings, dry-floor space, stirator space, whether or not the cone will be filled, compaction factor, ring width, bushel capacity and estimated cost.
Fast Tools & Resources
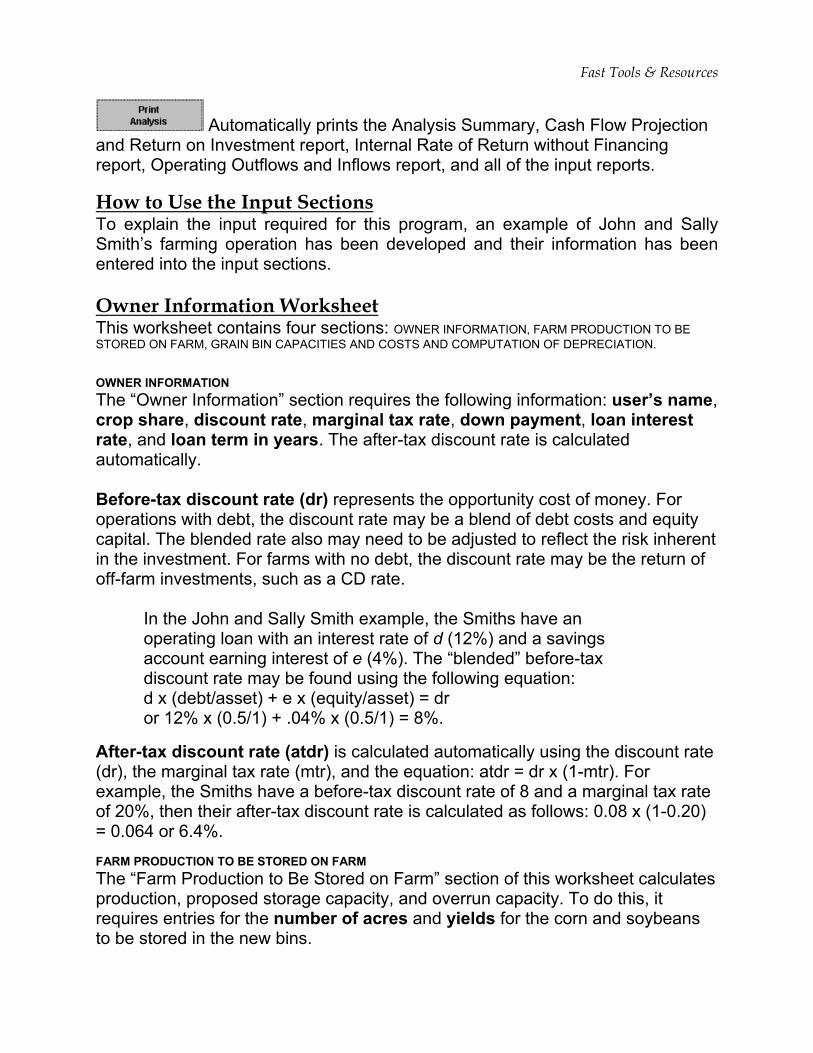
Below the bin entries are lines labeled XXXXXXXX. These are to be used for entering any additional installation costs. For example, electrical wiring, site preparation and operator contribution have been entered for the Smiths analysis. Below the entry section, a “Cost per bushel” is calculated for the total expense of the installation of new bins and for the bin expense only. A Salvage Value may be entered, which is an estimate of the value of the bin at the end of its useful life. Life (years) refers to the useful life of the bin for depreciation purposes. According to MACRS, a grain bin has a 15-year useful life. Example (continued) The Smiths would like to install a bin for corn storage. The bin has a diameter of 36 feet, 8 rings that are each 32 inches wide, 12 inches of dry floor space and 30 inches of stirator space. The Smiths do not plan to fill the cone and the compaction factor is 5%. The estimated total cost of the bin is $25,500. The installation expenses include $2,000 for electrical wiring and $1,500 for site preparation. The bin has no salvage value after 15 years.
In this example, the total cost for the bin is $29,000. The cost per bushel for the entire cost of the bin and installation equals $1.90. The cost per bushel for the bin only equals $1.67.

Fast Tools & Resources
COMPUTATION OF DEPRECIATION The COMPUTATION OF DEPRECIATION section, shown in table on the next page, provides the MACRS rates used each year in calculating depreciation. The table also provides the basis of the bin and amount of depreciation allowed for each year of the analysis.
Dry & Store Assumptions Worksheet
This worksheet contains two sections: PRODUCTION COMPARISONS and DRYING/STORAGE ASSUMPTIONS. The “PRODUCTION COMPARISONS” section gathers information about harvest assumptions and shrink assumptions. PRODUCTION COMPARISONS: HARVEST ASSUMPTIONS Additional Harvest Loss represents a percentage reduction in yield. This may be a result from a harvest slowed by hauling distances and/or long lines at the elevator. A slowed harvest may mean that more bean pods open and spill their grain in the field. However, it may take less time to store the crop in an elevator than to store it in on-farm facilities. If this is the case, enter a zero or a negative harvest loss in this cell. Dry Bushels Stored at the elevator is the percentage of grain not lost due to harvest loss conditions (i.e. amount of grain in the field x [1 - harvest loss %]). Harvest Moisture for corn refers to the percentage of moisture in the grain at harvest. Do not use an excessively high or low number. Average moisture at harvest is 22% to 23%. Producers who store grain at the elevator may put off harvest until the crop’s moisture content is lower to reduce drying costs. Producers who store grain on site are more apt to harvest grain earlier at a higher moisture content. If drying
Fast Tools & Resources
grain on site, producers can dry higher moisture grain to whatever moisture content they wish. In this way, they may avoid the “shrink expense” and have more net bushels to sell. PRODUCTION COMPARISONS: SHRINK ASSUMPTIONS Shrink refers to the reduced weight of grain as it is dried. Shrink is important to consider when purchasing a grain bin because on-site storage may end up a lower-cost alternative to storing at an elevator. By storing grain on site, the “shrink expense” may be avoided as well as the user controls the moisture content of the grain. Typically at an elevator, in order to store corn and soybeans, a predetermined percentage of moisture is allowed. Shrink Corn to refers to the desired moisture content allowed in the corn after drying. For example, an elevator may require that all corn be dried to a 14% moisture content, while a farmer may prefer to dry the corn on site to a 15% moisture content. Shrink Factor refers to the percentage grain will shrink while in storage over time. Note: typically, an elevator calculates 14% dry moisture on a 1.4 shrink factor. However, real shrink is probably closer to 1.2 and a producer may dry the grain to only 15%. Be sure to represent the producer’s actual practices in this case and not what is typical. If a producer dries to 13%, the grain system will not deliver the projected bushels. To estimate shrink factor, use the following equation.
(%) Storage for Moisture - (%) Sale for Moisture For example, iin storage; the
For productionnumber of bus For corn, the cmoisture conteadditional harv
100(%) Storage for Moisture -100
(%) Factor Shrink Volume ×=
f grain can be sold at 15.5% grain will be shrunk to 14% moisture volume shrink factor is 1.74%.
10014-10014 -15.5 1.74% ×=
comparisons, the amount of dry and/or wet bushels refers to the hels before and after drying takes place.
alculation of wet to dry bushels may include the following inputs: nt of corn after shrink, shrink factor, harvest moisture, and est loss. For example, the dry bushels for on-farm storage are

Fast Tools & Resources
calculated based on the number of acres and bushels produced in the “Farm Production to Be Stored on Farm” section of the OWNER INFORMATION worksheet, while the wet bushels assume the moisture content of corn after shrink, the shrink factor and harvest moisture using the following steps using on-farm inputs:
a. Harvest Moisture Content – Moisture % to Shrink Corn To b. 100 x Shrink Factor x “a” c. 1 – “b” d. Number of Dry Bushels / “c”
Example (continued) The Smiths harvest corn with a 25% moisture content. If the Smiths transport the grain to the elevator, they estimate that they will have an additional harvest loss of 1% due to delays caused by long lines. On the Smiths’ farm, corn is shrunk to 15% with a 1.2% shrink factor, while the elevator shrinks corn to 14% with a shrink factor of 1.4%. Note: Only the inputs related to corn are filled in because the Smiths’ bin will be used to store corn in this analysis.

Fast Tools & Resources
DRYING & STORAGE ASSUMPTIONS Drying Costs for the elevator can be found on the elevator’s rate sheet while on-farm drying costs must be estimated. A rule of thumb for estimating on-farm drying costs is to figure about $0.08 of liquid propane (LP) and $0.03 of electricity per wet bushel when LP costs $0.70. Newer dryers may be more efficient, so figures may need to be adjusted accordingly. Minimum Storage and Monthly Storage costs can be found on the elevator’s rate sheet. The Minimum to Date is the date that minimum storage will end. Average Sale Date is an estimate of the mid-point of sales on the calendar. The Average Storage Cost is the sum of the minimum storage cost plus the total monthly storage cost based off of the average sale date and when minimum storage ends. All Trucking & Handling Costs are recorded as a per-bushel cost. The From Field to Bin entry should include grain transfer costs and the From Bin to Elevator/Terminal should include the cost of loading the truck. Terminal Corn and Bean Premiums are the premium prices received per bushel for specialty crops. If this analysis is not for specialty crops, enter a zero in these boxes. Example (continued) The Smiths went to the local elevator to pick up the elevator’s rate sheet. It listed a $0.16 per bushel drying cost for corn, a minimum storage fee of $0.13 per bushel ending February 1, 2003, and after February 1, 2003, a monthly storage fee of $0.025 per bushel. The elevator estimates its average sale date to be March 1, 2003. The Smiths calculate their on-farm drying costs for corn to be $0.13 per bushel. As does the elevator, the Smiths consider their average sale date to be March 1, 2003. The Smiths estimate their trucking costs from the field to the elevator and bin to be $0.09 and $0.05 per wet bushel, respectively. However, their trucking cost from the bin to the terminal is $0.12 per dry bushel. The terminal pays the Smiths an additional $0.11 per dry bushel for their specialty corn.

Fast Tools & Resources
Fast Tools & Resources
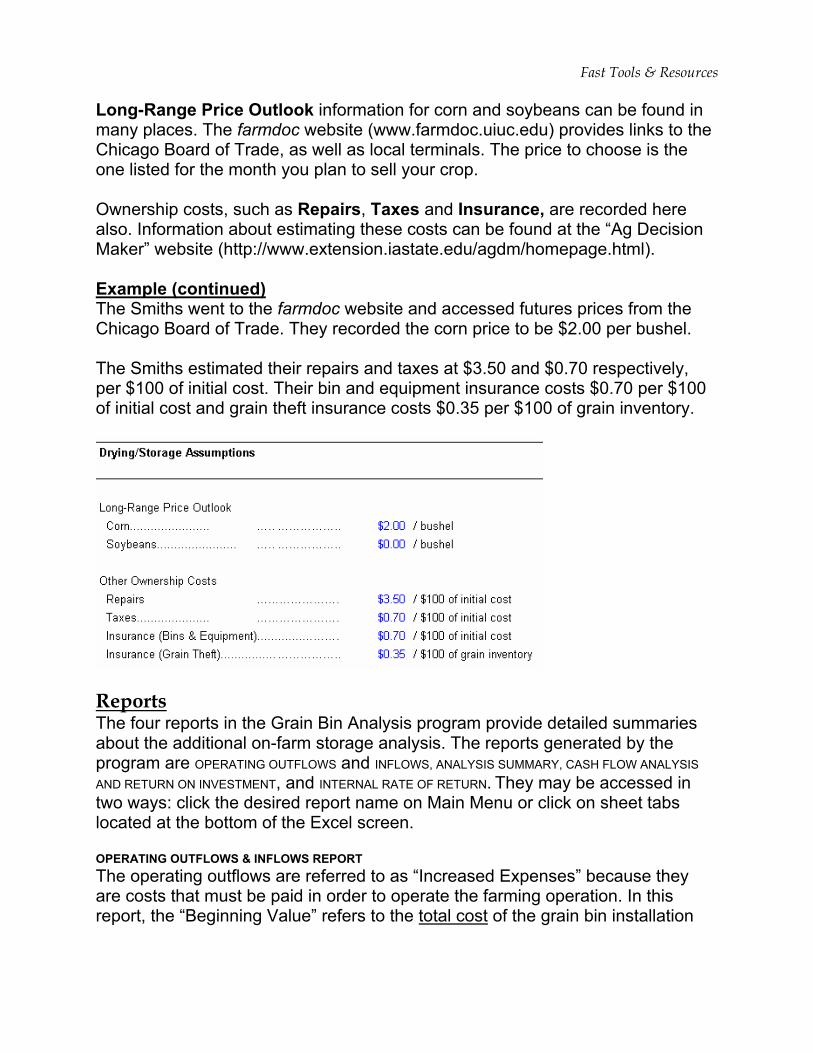
Long-Range Price Outlook information for corn and soybeans can be found in many places. The farmdoc website (www.farmdoc.uiuc.edu) provides links to the Chicago Board of Trade, as well as local terminals. The price to choose is the one listed for the month you plan to sell your crop. Ownership costs, such as Repairs, Taxes and Insurance, are recorded here also. Information about estimating these costs can be found at the “Ag Decision Maker” website (http://www.extension.iastate.edu/agdm/homepage.html). Example (continued) The Smiths went to the farmdoc website and accessed futures prices from the Chicago Board of Trade. They recorded the corn price to be $2.00 per bushel. The Smiths estimated their repairs and taxes at $3.50 and $0.70 respectively, per $100 of initial cost. Their bin and equipment insurance costs $0.70 per $100 of initial cost and grain theft insurance costs $0.35 per $100 of grain inventory.
Reports The four reports in the Grain Bin Analysis program provide detailed summaries about the additional on-farm storage analysis. The reports generated by the program are OPERATING OUTFLOWS and INFLOWS, ANALYSIS SUMMARY, CASH FLOW ANALYSIS AND RETURN ON INVESTMENT, and INTERNAL RATE OF RETURN. They may be accessed in two ways: click the desired report name on Main Menu or click on sheet tabs located at the bottom of the Excel screen. OPERATING OUTFLOWS & INFLOWS REPORT The operating outflows are referred to as “Increased Expenses” because they are costs that must be paid in order to operate the farming operation. In this report, the “Beginning Value” refers to the total cost of the grain bin installation

Fast Tools & Resources
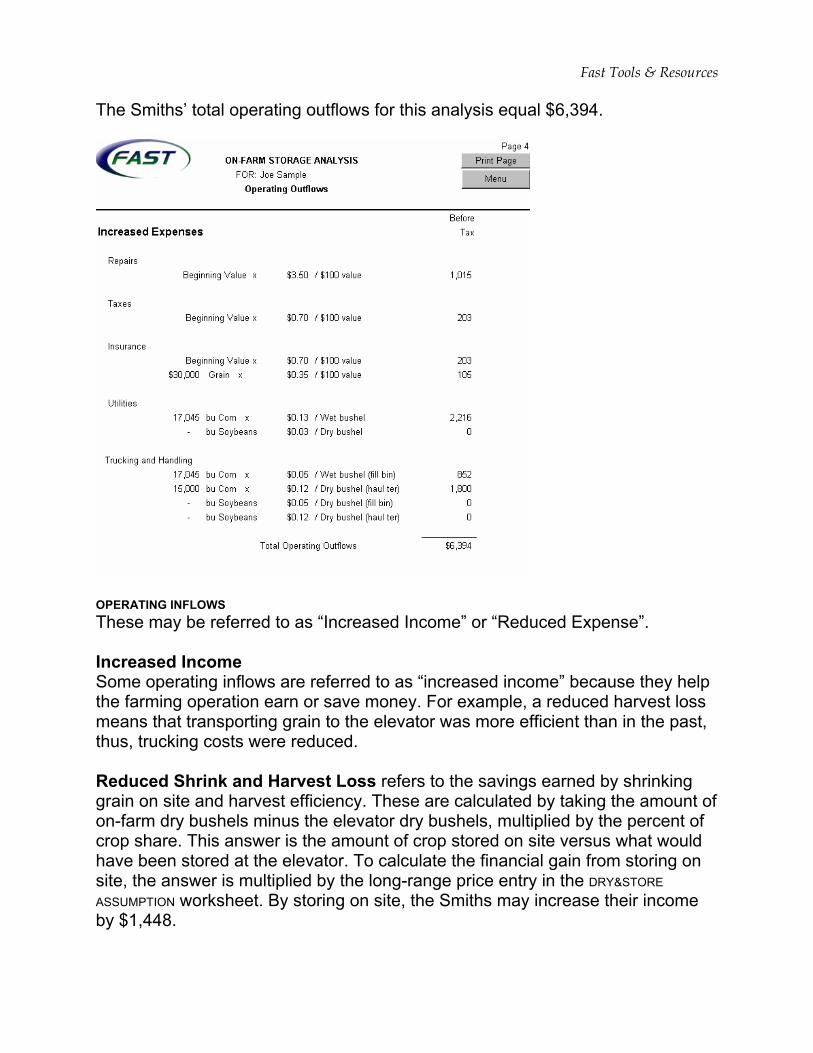
calculated in ”Grain Bin Capacities & Costs” section of the OWNER INFORMATION worksheet. The Repairs expense is calculated by dividing the Beginning Value by 100 and then multiplying it by the amount entered for repairs in the “Other Ownership Costs” section found in the DRY&STORE ASSUMPTION worksheet. The Smiths’ total repair expenses equal $1,015. The Tax expense is calculated by dividing the Beginning Value by 100 and then multiplying it by the amount entered for taxes in the Other Ownership Costs input section found in the DRY&STORE ASSUMPTION worksheet. The Smiths’ total tax expenses equal $203. The Insurance expense is calculated in two parts. •The equipment and bin insurance is calculated by dividing the Beginning Value
by 100 and then multiplying it by the amount entered for insurance (bins & equipment) in the “Other Ownership Costs” section found in the DRY&STORE ASSUMPTION worksheet. The Smiths’ equipment and bin insurance expense equals $203.
•The grain theft insurance is calculated by calculating the value of grain in storage first. To do so, multiply the price entered in the “Long Range Price Outlook” section for the crop by the amount of crop in storage. Then, divide the value of the crop by 100. The resulting number is multiplied by the amount entered for insurance (grain theft) in the “Other Ownership Costs” section found in the DRY&STORE ASSUMPTION worksheet. The Smiths’ grain theft insurance expense equals $105.
The Utilities expense is calculated in two parts. First, the amount of wet bushels is calculated by multiplying the number of wet bushels harvested by the crop share percentage. Then, the number of wet bushels is multiplied by the amount entered for the “on-farm drying costs” found in the DRY&STORE ASSUMPTION worksheet. In the Smiths’ example, 100% of the corn crop is on a cash-rent basis. Thus, the Smiths are responsible for 100% of the crop costs. The Smiths’ utilities expense equals $2,216. The Trucking and Handling expense is calculated in two parts: field to bin and bin to elevator/terminal. The field to bin expense is calculated by multiplying the number of wet bushels harvested by the field-to-bin-per-wet-bushel entry in the DRY&STORE ASSUMPTION worksheet. The Smiths’ field-to-bin expense equals $852. The bin-to-elevator/terminal expense is calculated by multiplying the amount of dry bushels by the bin-to-terminal-per-dry-bushel entry in the DRY&STORE ASSUMPTION worksheet. The Smiths’ bin-to-terminal expense equals $1,800.
Fast Tools & Resources
The Smiths’ total operating outflows for this analysis equal $6,394.
OPERATING INFLOWS These may be referred to as “Increased Income” or “Reduced Expense”. Increased Income Some operating inflows are referred to as “increased income” because they help the farming operation earn or save money. For example, a reduced harvest loss means that transporting grain to the elevator was more efficient than in the past, thus, trucking costs were reduced. Reduced Shrink and Harvest Loss refers to the savings earned by shrinking grain on site and harvest efficiency. These are calculated by taking the amount of on-farm dry bushels minus the elevator dry bushels, multiplied by the percent of crop share. This answer is the amount of crop stored on site versus what would have been stored at the elevator. To calculate the financial gain from storing on site, the answer is multiplied by the long-range price entry in the DRY&STORE ASSUMPTION worksheet. By storing on site, the Smiths may increase their income by $1,448.
Fast Tools & Resources
Direct Delivery Premium is the amount earned for delivering specialty/premium crops to the terminal. To figure the amount earned, multiply the number of dry bushels stored on site by the premium-per-dry-bushel entry in the DRY&STORE ASSUMPTION worksheet. By storing grain on site and hauling to the terminal, the Smiths’ specialty crops can earn them an additional $1,650. Reduced Expense Some operating inflows are referred to as “reduced expense” because they provide an understanding of the amount of money saved by storing grain on site rather than taking the grain to the elevator at harvest. For example, the elevator drying expense is not necessary when storing on site. Elevator Drying expense is the amount of money it would have cost to dry grain at the elevator. This is calculated by multiplying the number of wet bushels at the elevator by the user’s crop share. This answer is multiplied by the elevator’s drying cost entry found in the DRY&STORE ASSUMPTION worksheet. The Smiths will save $2,700 in elevator drying expenses by storing grain on site. Elevator Storage expense is the amount of money it would have cost to store grain at the elevator. This is calculated by multiplying the number of dry bushels at the elevator by the user’s crop share. The answer is multiplied by the elevator’s average storage cost entry found in the DRY&STORE ASSUMPTION worksheet. The Smiths will save $2,141 in elevator storage expenses by storing grain on site. Trucking to Elevator expense is the cost of hauling the grain to the elevator at harvest. This is calculated by multiplying the number of wet bushels harvested by the field-to-elevator-trucking & hauling cost entry found in the DRY&STORE ASSUMPTION worksheet. The Smiths will save $1,519 in hauling expenses by storing grain on site. The Smiths’ total operating inflows for this analysis equal $9,458. This amount refers to the additional expenses the Smiths would have if they stored grain at the elevator. Combining the total inflows (increased income/reduced expenses) and the total outflows (increased expenses), the Smiths would have a total savings of $3,064 if they purchased a grain bin rather than if they stored their grain at the elevator.

Fast Tools & Resources
CASH-FLOW PROJECTION AND RETURN ON INVESTMENT The CASH FLOW report provides an annual break down of the following: projected payments, projected cash flow, interest tax savings, cash flow for the year, and a cumulative cash flow. Note: In this report, a number in parentheses refers to a negative number. Projected Payments are outflows of cash and are represented as negative numbers because they pay for something. Outflows include down payments as well as loan payments. The program calculates the loan payments based off of the inputs: interest rate, length of loan, and amount financed. The Smiths paid a $7,250 down payment and their yearly loan payments are calculated to be $3,315 for year 1 through year 10. Projected Cash Flow is the sum of the total cash inflows and outflows for the initial project cost, after-tax annual inflows, and depreciation tax savings. This number can be either positive or negative. However, positive is preferred

Fast Tools & Resources
because it shows that more money has been acquired/saved than has been spent. Interest Tax Savings represents the tax savings due to loan payments. The projected loan payment is presented as a negative number in the “Projected Payments” column. A portion of the payment is interest. To arrive at the tax savings, the marginal tax rate is multiplied by the interest portion of the loan payment. The savings is presented as a positive number. Cash Flow for the Year can be both positive and negative. Obviously, a positive cash flow is preferred. Yet it is common to have a negative cash flow at the beginning of an analysis if a large down payment is made. Cumulative Cash Flow is the sum of the yearly cash flows. It will be negative until all payments have been made, or until the cash inflows become greater than the payments. In this example, a positive cumulative cash flow does not exist until year 14 of the 15-year analysis. This is important for a decision maker to analyze because it shows the length of time it takes before the investment will have a positive return. In addition to the items discussed above, the report also states when the cumulative cash flow peaks, or reaches the largest outflow throughout the analysis timeline. This is important to a decision maker because it provides a preview as to the yearly cash outflows, which may be important when planning to purchase additional assets in the future. Also, this report provides an Investment Yield Including Financing, or Return on Investment. This number represents the interest rate that equates the net present value of the cash flows to equal zero. A positive number means that more inflows have been received than outflows. A negative number means the opposite. The return on investment is calculated by discounting the cash flows back to the present and adding their values. For example, if a down payment of $1,000 is made along with a payment of $1,300 in 1 year, what is the rate of return (IRR)? The equation is IRR = - down payment + (payment/1+i) or 1+ i = payment/down payment). When the numbers are inserted into the equation, the IRR totals to 30%. (1+ i = (1,300/1,000) = 0.3) In the Smiths’ example, they would earn a 3.79% return on their original grain bin investment.

Fast Tools & Resources
INTERNAL RATE OF RETURN The INTERNAL RATE OF RETURN report provides a look at the yearly cash flows without accounting for debt payments. This type of report allows the user to evaluate the returns without taking into consideration how the investment is financed. Project Cost is the total cost of the project that is calculated in the “Grain Bin Capacities” section of the “Owner Information” worksheet. After-Tax Annual Inflow is calculated in the ANALYSIS SUMMARY report by adding the annual outflows and annual inflows and subtracting the tax obligation. Depreciation Tax Savings is the amount of tax savings for each year due to depreciation. These numbers are taken from the ANALYSIS SUMMARY report. Net Cash Flow is the sum of the cash flows for each year.
Discount Factor represents the rate at which the value of the property decreases. It is calculated with the equation: 1/(1+ after-tax discount rate) number of years in the analysis. The “number of years in the analysis” is a raised power of the one

Fast Tools & Resources
plus after-tax discount rate. For example, in year 3 of the report, the discount rate is: 1 / (1 + 0.064)3 =0.830. Present Value is calculated by multiplying the net cash flow by the discount factor. This value represents the cash flows in today’s terms. After-Tax Internal Rate of Return (IRR) is the rate of return on the investment after accounting for a tax obligation/savings that makes the net present value of the grain bin equal to 0. This value analyzes both the inflows/outflows of the bin, as well as tax implications. The return on investment is calculated by discounting the cash flows back to the present and adding their values. In this example, the after-tax IRR is 5.52%. This means that by storing grain on site, the Smiths are able to earn a return on their investment of 5.52%. The positive return is due to the reduced expenses in elevator drying and storage costs, as well as transportation costs. However, with tax implications, the return is reduced. This return can be compared to the after-tax return of other investments. Money should be allocated to investments with the higher after-tax returns. Before-Tax Internal Rate of Return (IRR) is the rate of return on the investment that makes the net present value of the grain bin equal to 0. This value analyzes only the inflows/outflows of the bin. This number represents the interest rate that equates the net present value of the cash flows to zero. The return on investment is calculated by discounting the cash flows back to the present and adding their values. In this example, the before-tax IRR is 6.9%. This means that by storing grain on site, the Smiths are able to improve their financial situation by earning a return on their investment of 6.9%. This positive return is due to the reduced expenses in elevator drying and storage costs as well as transportation costs. This return can be compared to other before-tax returns. Savings account interest rates or interest rates on CD’s are two examples. A before-tax return may be easier to communicate to landlords and partners. Residual Value is the “salvage value” entered in the “Grain Bin Capacities” section of the OWNER INFORMATION worksheet. In this example, the Smiths’ grain bin does not have a salvage value, so the IRR’s are unchanged. If a salvage value were entered, the IRR with the salvage value would be the rate of return on the investment that makes the net present value equal to the salvage value.

Fast Tools & Resources
Fast Tools & Resources
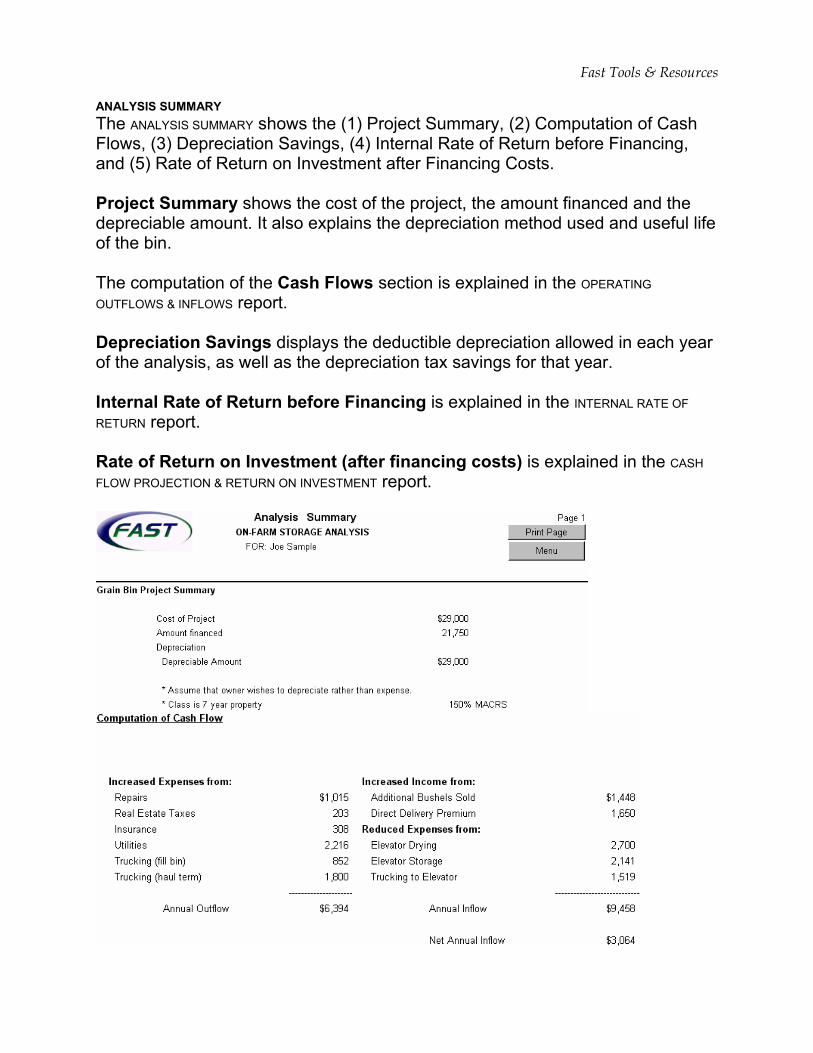
ANALYSIS SUMMARY The ANALYSIS SUMMARY shows the (1) Project Summary, (2) Computation of Cash Flows, (3) Depreciation Savings, (4) Internal Rate of Return before Financing, and (5) Rate of Return on Investment after Financing Costs. Project Summary shows the cost of the project, the amount financed and the depreciable amount. It also explains the depreciation method used and useful life of the bin. The computation of the Cash Flows section is explained in the OPERATING OUTFLOWS & INFLOWS report. Depreciation Savings displays the deductible depreciation allowed in each year of the analysis, as well as the depreciation tax savings for that year. Internal Rate of Return before Financing is explained in the INTERNAL RATE OF RETURN report. Rate of Return on Investment (after financing costs) is explained in the CASH FLOW PROJECTION & RETURN ON INVESTMENT report.

Fast Tools & Resources