graduate employment survey, 2012 bachelor’s … employment survey, 2012 ( bachelor’s degrees )...
TRANSCRIPT

THE UNIVERSITY OF HONG KONG
香 港 大 學
Graduate Employment Survey, 2012
Bachelor’s Degrees

This report is prepared by
Careers and Placement Centre of Development and Resources for Students
Enquiries may be directed to
Ms. Shan Ho (Survey Assistant) Ms. Josephine Chan (Senior Student Advising Officer (Careers))
Ms. Jaime Fung (Director of Careers and Placement)
Tel no.: 2859 2315 Fax no.: 2559 5238
E-mail: [email protected]
No part of this report may be reproduced, in any form or by whatever means, without written permission from the Centre of Development and Resources for Students (CEDARS),
The University of Hong Kong.

TABLE OF CONTENTS Page
I. Overall summary 1 II. Methodology 1 III. Key employment and salary trends 2 IV. Changes on employment rate, salary & markets 5 V. Key statistics for graduates from Mainland China and Overseas 8
Appendices
1. Employment Situation 11 2. Distribution by Employment Sector 12 3. Distribution by Occupation 16 4. Monthly Income by Employment Sector 27 5. Monthly Income by Occupation 28 6. Major Occupations by Faculty 32 7. Median Monthly Income by Faculty 33 8. Graduate Profile 34

- 1 -
The University of Hong Kong Graduate Employment Survey, 2012
( Bachelor’s Degrees )
I. Overall summary
The job market kept improving in 2012. The University of Hong Kong continued to achieve full employment in the class of 2012 graduates. This annual survey reported an income rise as the average gross monthly salary went up by 6.8% from $18,350 in 2011 to $19,598 in 2012. More graduates chose trading, marketing or retailing industries as their employment destination probably due to more job opportunities and better service conditions provided in these sectors. Over the years, Commerce and Industry sector has remained to be the largest employment sector. Civil Service sector has expanded while Education sector has shrunk since 2011.
II. Methodology
1. Every year, the Graduate Employment Survey is carried out to collect the employment details from our graduates about six months after their graduation, as an effort to gain understanding of their employment situation.
2. This annual survey was conducted from November 2012 to March 2013 via different
means. Email invitation to complete a web-based questionnaire was sent to graduates. During the academic gown collection period in November, the graduates were interviewed outside the gown collection counter. Those graduates who did not reply were interviewed on the telephone. Through the above means, information was obtained from 2782 graduates, representing 91.4% of the graduating population of 3044.
3. The situation reported by the respondents is as it was in December 2012 or six months after graduation and covers all full-time Bachelor's Degree graduates. Degree programmes are classified into ten Faculties, namely: Architecture, Arts, Business and Economics, Dentistry, Education, Engineering, Law, Medicine, Science and Social Sciences.
- 2 -
III. Key employment and salary trends
Employment
1. The unemployment rate remained to be 0.3% in 2012, and stayed the same for 3 consecutive years.
2. With the rise in graduates pursuing further studies, a corresponding decrease was
registered in employment, from 80.6% in 2011 to 78.9% in 2012. 3. Of the nine unemployed graduates among the respondents, three graduates had in fact
been successful in securing a job offer but declined to accept, or resigned from the post, to await better opportunities. Only six persons were unsuccessful in securing a job offer.
Further studies 4. The number of graduates pursuing further studies increased from 18.0% in 2011 to
19.7% in 2012. The percentage of graduates pursuing further studies remained to be around 20% over the years.
Salary trend 5. The median monthly gross income increased by 5.6% from $15,000 in 2011 to $15,833
in 2012. The average monthly gross income went up by 6.8% from $18,350 in 2011 to $19,598 in 2012.
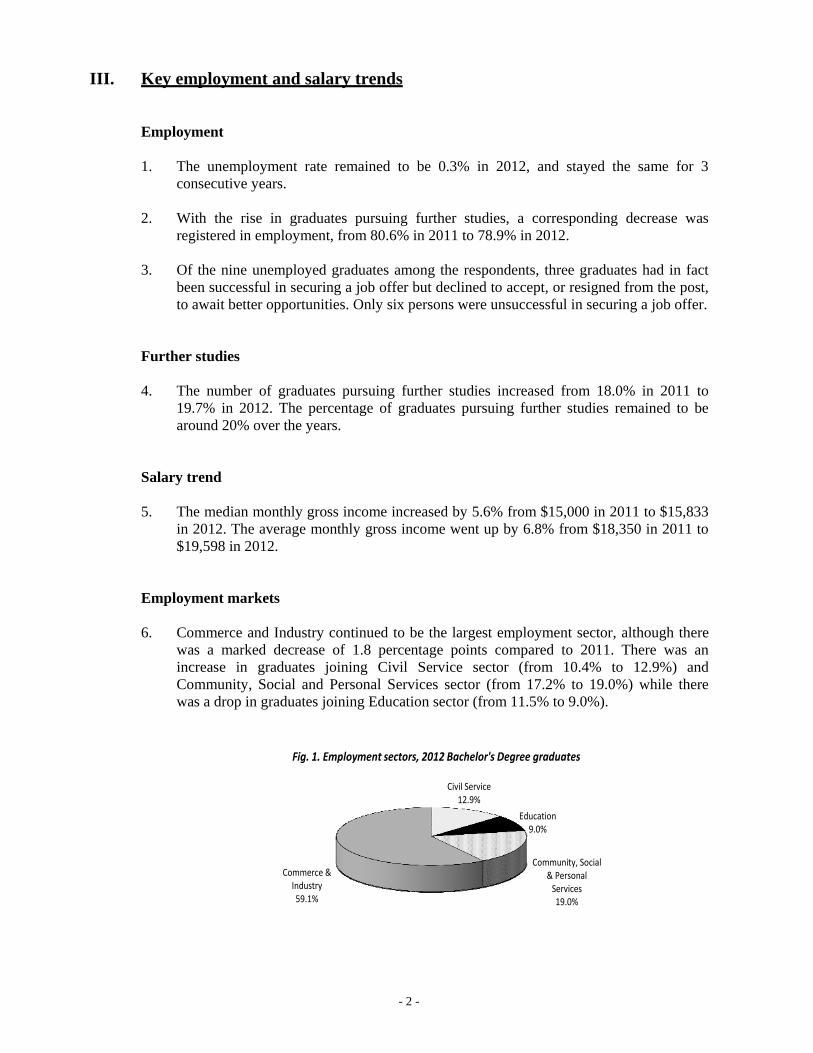
Employment markets 6. Commerce and Industry continued to be the largest employment sector, although there
was a marked decrease of 1.8 percentage points compared to 2011. There was an increase in graduates joining Civil Service sector (from 10.4% to 12.9%) and Community, Social and Personal Services sector (from 17.2% to 19.0%) while there was a drop in graduates joining Education sector (from 11.5% to 9.0%).
Civil Service12.9%
Education9.0%
Community, Social & Personal
Services19.0%
Commerce & Industry59.1%
Fig. 1. Employment sectors, 2012 Bachelor's Degree graduates

- 3 -
7. The largest occupational groups in 2012 were:
· Business Professionals 23.3% · Medical & Health Workers 18.4% · Teaching and Research Profession 11.2% · Engineers 9.6% · Accountants & Auditors 6.5%
Job offer and source 8. Of the employed graduates, 91.3% secured their job offers by the end of October, a
slight increase compared to previous year (90.7%).
16.0 15.1 11.7 5.8 3.7 2.0 4.2 1.3 1.2
38.9
54.9
70.1 81.8
87.6 91.3 93.3 97.5 98.8 100.0
0
20
40
60
80
100
≦May Jun Jul Aug Sep Oct Nov Dec Jan Feb
Perc
enta
ge
Month
Fig. 2. Month of receiving first job offer, 2012 Bachelor's Degree graduates
Percentage Cumulative Percentage
9. Of the employed graduates, 60.6% received more than one job offer. On average, each
graduate received 2.18 job offers, slightly decreased from previous year (2.22).

- 4 -
10. Most of the graduates searched for job vacancies through job notices from Careers and Placement Section, CEDARS (19.7%), closely followed by NETmatch / NETjobs / JIJIS (14.1%) and newspaper / internet job boards (15.7%). They accounted for nearly half (49.5%) of the job source.
Table 1. Source of job information of Bachelor's Degree graduates, 2011 - 2012
Source of Job Information 2012 2011
Graduates % Graduates %CEDARS Email / Website / Notices 325 19.7% 323 19.0%NETmatch / NETjobs / JIJIS 232 14.1% 321 18.9% Newspapers / Internet Job Boards 259 15.7% 318 18.7%Corporate Recruitment Sites on the Internet 175 10.6% 174 10.2%Faculty / Academic Staff 133 8.1% 146 8.6%Friends / Relatives 164 9.9% 145 8.5%Previous Employer 55 3.3% 51 3.0%Employment Agency 47 2.9% 42 2.5%Unsolicited Approach Direct to Employer 64 3.9% 18 1.1%Others 195 11.8% 163 9.6%
Job satisfaction and relevancy
11. The majority of graduates experienced good job satisfaction. However, the number of
graduates being either highly satisfied or satisfied with their jobs decreased from 82.3% in 2011 to 80.5% in 2012.
Table 2. Job satisfaction of Bachelor's Degree graduates, 2011- 2012
Job Satisfaction 2012 2011
Graduates % Graduates % Highly Satisfied 389 23.9% 423 24.0%Satisfied 922 56.6% 1025 58.3%Average 284 17.4% 275 15.6%Not Much Satisfied 34 2.1% 36 2.0%
12. About half of the graduates engaged in employment closely related to their studies in the University.
Table 3. Job relevancy to study of Bachelor's Degree graduates, 2011 - 2012
Job Relevancy to Study 2012 2011
Graduates % Graduates %Closely Related 879 49.8% 833 45.5%Partially Related 561 31.8% 684 37.4%Not Related at all 325 18.4% 314 17.1%

- 5 -
IV. Changes on employment rate, salary & markets
Changes over the last ten years are shown in the following graphs and tables.
72.4 75.7 78.6 79.3 80.7 80.176.0
79.2 80.6 78.9
26.422.5 20.1 20.0 18.4 18.0
22.7 19.2 18.0 19.7
0.3 0.6 0.5 0.2 0.2 0.6 0.2 0.3 0.3 0.30
10
20
30
40
50
60
70
80
90
'03 '04 '05 '06 '07 '08 '09 '10 '11 '12
Perc
enta
ge
Year
Fig. 3. Employment situations, 2003 - 2012
Employed Further Studies Unemployed
Over the years, around 80% of graduates opted for employment while around 20% of them went for further studies.
$10,000$10,292
$11,050
$12,123
$13,000
$14,583
$12,533
$13,500
$15,000$15,833
$9,500$10,000
$10,250
$11,500$12,200
$14,000
$12,000
$13,000
$15,000$15,000
$8,000
$9,000
$10,000
$11,000
$12,000
$13,000
$14,000
$15,000
$16,000
$17,000
'03 '04 '05 '06 '07 '08 '09 '10 '11 '12
HKDo
llars
Year
Fig. 4. Median gross/basic monthly income, 2003 - 2012
Gross Basic

- 6 -
Less Than$10,000
$10,000 to$14,999
$15,000 to$19,999
$20,000 to$24,999
$25,000 to$29,999
$30,000 orMore
2012 3.5 39.6 24.8 12.5 8.1 11.42011 3.1 43.3 22.6 17.1 4.2 9.82010 6.9 49.1 16.3 13.1 4.7 9.92009 14.6 46.8 11.9 13.7 3.6 9.4
0
10
20
30
40
50
Perc
enta
ge
Fig. 5. Distribution by income groups, 2009 - 2012
Income range continued to migrate upwards in 2012. Fewer graduates fell into the gross monthly income group of $10,000 to $14,999 (39.6%, as compared to 43.3% in 2011, 49.1% in 2010 and 46.8% in 2009). On the other hand, there were percentage increases in the two higher income groups ranging from $25,000 or above.
4.4 3.0 5.310.0
10.5 10.8 13.5
8.6 10.4
12.98.9 7.6 8.6 13.0
10.3 9.4 11.0
11.6 11.5
9.0
23.1 20.8 20.6 16.1 16.9 18.7 18.1 20.817.2 19.0
63.768.6
65.660.9 62.2 61.1
57.3 58.9 60.9 59.1
0
10
20
30
40
50
60
70
80
'03 '04 '05 '06 '07 '08 '09 '10 '11 '12
Perc
enta
ge
Year
Fig. 6. Employment sectors, 2003- 2012
Civil Service EducationCommunity, Social & Personal Services Commerce & Industry
Throughout the years the Commerce & Industry sector remained to be the destinations for most of the graduates.

- 7 -
Table 4. Major occupational groups, 2003 – 2012
Occupations 2003 2004 2005 2006 2007 2008 2009 2010 2011 2012Business Professionals 29.1% 27.7% 24.2% 24.3% 23.2% 24.1% 21.7% 26.5% 26.6% 23.3%
Medical & Health Workers 15.8% 15.9% 15.7% 16.4% 15.5% 19.5% 17.2% 16.2% 15.0% 18.4%
Teaching and Research Profession 8.8% 7.3% 7.8% 13.6% 11.2% 11.3% 14.3% 13.7% 13.1% 11.2%
Engineers 11.4% 10.2% 10.6% 8.2% 8.3% 7.8% 9.9% 8.5% 8.5% 9.6%
Accountants & Auditors 4.2% 5.5% 6.7% 7.5% 8.7% 9.5% 8.8% 6.8% 7.4% 6.5%
Total 69.3% 66.6% 65.0% 70.0% 66.9% 72.2% 71.9% 71.7% 70.6% 69.0%Others 30.7% 33.4% 35.0% 30.0% 33.1% 27.8% 28.1% 28.3% 29.4% 31.0%Grand Total 100% 100% 100% 100% 100% 100% 100% 100% 100% 100%
The five occupational groups listed above accounted for around 70% of the destinations of our graduates in 2012.

- 8 -
V. Key statistics for graduates from Mainland China and Overseas
1. The population of graduates from Mainland China remained at about the same level in
2012, 9.3% of the whole graduating bachelor’s degree population in 2011 and 9.5% in 2012. There were a total of 290 graduates from Mainland China for the year of 2012. Among them, 186 (or 64.1%) responded to the survey. Last year, there were 291 graduates from Mainland China and 213 responded to the survey.
2. The population of graduates from Overseas increased in 2012, 1.3% of the whole graduating bachelor’s degree population in 2011 and 2.5% in 2012. There were a total of 75 graduates from Overseas for the year of 2012. Among them, 38 (or 50.7%) responded to the survey. Last year, there were 41 graduates from Overseas and 27 responded to the survey.
3. The majority of the graduates from Mainland China and Overseas went for employment in 2012.
Table 5. Employment situation of graduates by nationality, 2011 - 2012
Employment Situation 2012
Mainland China Overseas Local No. % No. No. % No.
Employed 114 61.3% 29 76.3% 2052 80.2% Further Studies 70 37.6% 4 10.5% 475 18.6% Unemployed 1 0.5% 1 2.6% 7 0.3% Others * 1 0.5% 4 10.5% 24 0.9% Total 186 100.0% 38 100.0% 2558 100.0%
Employment Situation 2011
Mainland China Overseas Local No. % No. No. % No.
Employed 143 67.1% 20 74.1% 2158 81.8% Further Studies 67 31.5% 5 18.5% 445 16.9% Unemployed 1 0.5% - - 7 0.3% Others * 2 0.9% 2 7.4% 28 1.1% Total 213 100.0% 27 100.0% 2638 100.0%
* Includes those who emigrated, returned to home countries or not seeking employment.
Employment
4. Most of the graduates from Mainland China secured employment in Hong Kong (94.0%) in 2012. There was a corresponding decrease for graduates returning Mainland China to work (from 8.2% in 2011 to 5.0% in 2012).
5. Although the majority of graduates from Overseas found jobs in Hong Kong, the proportion went down from 88.2% in 2011 to 59.1% in 2012. There was an increase for Overseas graduates to seek job opportunities in other Asian Countries (from 11.8% in 2011 to 36.4% in 2012).

- 9 -
Table 6. Employment destination of graduates by nationality, 2011- 2012
Employment Destination 2012
Mainland China Overseas LocalNo. % No. % No. %
Hong Kong 94 94.0% 13 59.1% 1766 98.4% Mainland China 5 5.0% - - 12 0.7% Canada - - 1 4.5% - - Taiwan - - - - 3 0.2% USA - - - - 2 0.1% Other Asian Countries 1 1.0% 8 36.4% 11 0.6% Total 100 100% 22 100% 1794 100%Not reporting any destination 14 7 258
Employment Destination 2011
Mainland China Overseas Local No. % No. % No. %
Hong Kong 110 90.2% 15 88.2% 1736 98.4%Mainland China 10 8.2% - - 18 1.0% Australia - - - - 1 0.1%Macau - - - - 1 0.1%UK 1 0.8% - - - -Other Asian Countries 1 0.8% 2 11.8% 5 0.3%Other European Countries - - - - 1 0.1%Others - - - - 3 0.2%Total 122 100% 17 100% 1794 100%Not reporting any destination 21 3 393
6. The largest occupational groups among the graduates from Mainland China in 2012 were:
· Business Professionals 40.4% · Engineers 12.1% · Accountants and Auditors 11.1%
7. The largest occupational groups among the graduates from Overseas in 2012 were:
· Business Professionals 42.9% · Engineers 14.3% · Architects & Surveyors 11.1%

- 10 -
Further studies
8. More graduates from Mainland China pursued further studies in 2012 as compared to 2011 (up from 31.5% to 37.6%). The percentage increase in further studies for graduates from Mainland China (6.1 percentage points) was greater than that of the non-Mainland graduates (1.6 percentage points).
Table 7. Rate of Further Studies of the 2012 graduates
Nationality 2012 2011
Graduates % Graduates %Mainland China 70 37.6% 67 31.5%Overseas 4 10.5% 5 18.5%Local 475 18.6% 445 16.9% Overall 549 19.7% 517 18.0%
9. Most of the graduates from Mainland China pursued further studies in Hong Kong in 2012. The percentage of those pursuing further studies in Hong Kong increased by 1.6 percentage points (from 44.8% in 2011 to 46.4% in 2012).
Table 8. Destination of Further Studies of the 2012 graduates
Further Studies Destination
2012Mainland China Overseas LocalNo. % No. % No. %
Hong Kong 32 46.4% 3 75.0% 389 89.2%USA 25 36.2% - - 8 1.8%UK 5 7.2% - - 27 6.2%Mainland China 1 1.4% - - 2 0.5%Australia - - - - 5 1.1%Canada 2 2.9% - - - -Others 4 5.8% 1 25.0% 5 1.1%Total 69 100% 4 100% 436 100%Not reporting any destination 1 - 39
Further Studies Destination
2011Mainland China Overseas LocalNo. % No. % No. %
Hong Kong 30 44.8% 2 40.0% 375 88.7%USA 22 32.8% - - 9 2.1%UK 9 13.4% 1 20.0% 29 6.9%Mainland China 1 1.5% 1 20.0% 1 0.2%Australia - - - - 1 0.2%Canada - - - - 1 0.2% Others 5 7.5% 1 20.0% 7 1.7%Total 67 100% 5 100% 423 100%Not reporting any destination - - 22

Appendix 1
- 11 -
Faculty Population
Architecture 100 95 95.0% 90 94.7% 0 0.0% 3 3.2% 0 0.0% 2 2.1%
Arts 402 365 90.8% 313 85.8% 3 0.8% 46 12.6% 0 0.0% 3 0.8%
Business and Economics 580 499 86.0% 385 77.2% 3 0.6% 105 21.0% 0 0.0% 6 1.2%
Dentistry 52 50 96.2% 50 100.0% 0 0.0% 0 0.0% 0 0.0% 0 0.0%
Education 182 172 94.5% 154 89.5% 0 0.0% 17 9.9% 0 0.0% 1 0.6%
Engineering 439 397 90.4% 334 84.1% 0 0.0% 58 14.6% 2 0.5% 3 0.8%
Law ^ 204 196 96.1% 44 22.4% 0 0.0% 150 76.5% 0 0.0% 2 1.0%
Medicine 338 319 94.4% 313 98.1% 0 0.0% 6 1.9% 0 0.0% 0 0.0%
Science 446 418 93.7% 330 78.9% 0 0.0% 83 19.9% 0 0.0% 5 1.2%
Social Sciences 301 271 90.0% 182 67.2% 3 1.1% 81 29.9% 0 0.0% 5 1.8%
TOTAL 3044 2782 91.4% 2195 78.9% 9 0.3% # 549 19.7% 2 0.1% 27 1.0%
Please note that all percentages are rounded to one decimal place and the total may therefore not equal 100%.^ Most LLB graduates continue studies in PCLL programme for entry into the legal profession.# Only 0.2% out of 0.3% was truly unemployed. The remainder were either in-between jobs or declined job offers.
1. EMPLOYMENT SITUATION(2012 BACHELOR'S DEGREE)
Emigrated / Returned to
Home Country
Not Seeking
EmploymentRespondents Employed Unemployed Further Studies

Appendix 2
- 12 -
Total Architecture # Arts Business & Economics
Dentistry Education Engineering Law ^ Medicine Science Social Sciences
(%) (%) (%) (%) (%) (%) (%) (%) (%) (%) (%)
CIVIL SERVICE Government Departments 250 8 21 18 0 5 25 9 134 10 20(12.9) (9.9) (7.4) (5.3) (0.0) (3.6) (8.4) (25.0) (49.8) (3.5) (12.9)
EDUCATIONAL 173 0 41 12 1 68 3 0 4 21 23
INSTITUTIONS (9.0) (0.0) (14.5) (3.6) (2.2) (48.9) (1.0) (0.0) (1.5) (7.3) (14.8)
Aided Primary Schools 8 0 2 0 0 5 0 0 0 1 0(0.4) (0.0) (0.7) (0.0) (0.0) (3.6) (0.0) (0.0) (0.0) (0.3) (0.0)
Private Primary Schools 3 0 2 0 0 1 0 0 0 0 0(0.2) (0.0) (0.7) (0.0) (0.0) (0.7) (0.0) (0.0) (0.0) (0.0) (0.0)
Direct Subsidy Primary Schools 1 0 0 0 0 1 0 0 0 0 0(0.1) (0.0) (0.0) (0.0) (0.0) (0.7) (0.0) (0.0) (0.0) (0.0) (0.0)
Government Secondary Schools 4 0 3 0 0 1 0 0 0 0 0(0.2) (0.0) (1.1) (0.0) (0.0) (0.7) (0.0) (0.0) (0.0) (0.0) (0.0)
Aided Secondary Schools 48 0 13 1 0 28 0 0 0 2 4(2.5) (0.0) (4.6) (0.3) (0.0) (20.1) (0.0) (0.0) (0.0) (0.7) (2.6)
Private Secondary Schools 1 0 0 0 0 1 0 0 0 0 0(0.1) (0.0) (0.0) (0.0) (0.0) (0.7) (0.0) (0.0) (0.0) (0.0) (0.0)
Direct Subsidy Secondary Schools 16 0 4 0 0 12 0 0 0 0 0(0.8) (0.0) (1.4) (0.0) (0.0) (8.6) (0.0) (0.0) (0.0) (0.0) (0.0)
Aided Special Schools 11 0 0 0 0 11 0 0 0 0 0(0.6) (0.0) (0.0) (0.0) (0.0) (7.9) (0.0) (0.0) (0.0) (0.0) (0.0)
2. DISTRIBUTION BY EMPLOYMENT SECTOR(2012 BACHELOR'S DEGREE)
Employment Sector Nature of Business
Cont’d

Appendix 2
- 13 -
Total Architecture # Arts Business &
Economics Dentistry Education Engineering Law ^ Medicine Science Social Sciences
(%) (%) (%) (%) (%) (%) (%) (%) (%) (%) (%)
Pre-Vocational Schools / 4 0 1 1 0 2 0 0 0 0 0
Technical Institutes (0.2) (0.0) (0.4) (0.3) (0.0) (1.4) (0.0) (0.0) (0.0) (0.0) (0.0)
Post-Secondary Colleges 6 0 2 0 0 1 0 0 0 2 1(0.3) (0.0) (0.7) (0.0) (0.0) (0.7) (0.0) (0.0) (0.0) (0.7) (0.6)
Universities 66 0 11 9 1 4 3 0 4 16 18(3.4) (0.0) (3.9) (2.7) (2.2) (2.9) (1.0) (0.0) (1.5) (5.5) (11.6)
Others (e.g. Kindergartens) 5 0 3 1 0 1 0 0 0 0 0 (0.3) (0.0) (1.1) (0.3) (0.0) (0.7) (0.0) (0.0) (0.0) (0.0) (0.0)
COMMUNITY, 367 0 46 14 43 37 9 3 127 39 49
SOCIAL & PERSONAL (19.0) (0.0) (16.3) (4.1) (95.6) (26.6) (3.0) (8.3) (47.2) (13.5) (31.6)
SERVICES Education Services 60 0 16 3 0 12 4 0 0 14 11
(3.1) (0.0) (5.7) (0.9) (0.0) (8.6) (1.3) (0.0) (0.0) (4.8) (7.1)
Research & Scientific Institutions 3 0 1 0 0 0 1 0 0 1 0(0.2) (0.0) (0.4) (0.0) (0.0) (0.0) (0.3) (0.0) (0.0) (0.3) (0.0)
Welfare Institutions / Social / 59 0 7 1 0 13 0 1 1 8 28 Community Services (3.1) (0.0) (2.5) (0.3) (0.0) (9.4) (0.0) (2.8) (0.4) (2.8) (18.1)
Business / Professional / Labour / 15 0 5 6 0 0 1 1 0 1 1 Trade Associations (0.8) (0.0) (1.8) (1.8) (0.0) (0.0) (0.3) (2.8) (0.0) (0.3) (0.6)
Cultural / Recreational / 29 0 17 1 0 2 1 0 0 5 3 Entertainment Services (1.5) (0.0) (6.0) (0.3) (0.0) (1.4) (0.3) (0.0) (0.0) (1.7) (1.9)
Hospital / Medical / 197 0 0 2 43 10 2 1 126 7 6 Dental Services (10.2) (0.0) (0.0) (0.6) (95.6) (7.2) (0.7) (2.8) (46.8) (2.4) (3.9)
Employment Sector Nature of Business
Cont’d

Appendix 2
- 14 -
Total Architecture # Arts Business &
Economics Dentistry Education Engineering Law ^ Medicine Science Social Sciences
(%) (%) (%) (%) (%) (%) (%) (%) (%) (%) (%)
Political Groups 1 0 0 0 0 0 0 0 0 1 0(0.1) (0.0) (0.0) (0.0) (0.0) (0.0) (0.0) (0.0) (0.0) (0.3) (0.0)
Others 3 0 0 1 0 0 0 0 0 2 0(0.2) (0.0) (0.0) (0.3) (0.0) (0.0) (0.0) (0.0) (0.0) (0.7) (0.0)
COMMERCE & 1142 73 174 294 1 29 261 24 4 219 63
INDUSTRY (59.1) (90.1) (61.7) (87.0) (2.2) (20.9) (87.6) (66.7) (1.5) (75.8) (40.6)
Mining & Quarrying 2 0 0 0 0 0 0 0 0 2 0(0.1) (0.0) (0.0) (0.0) (0.0) (0.0) (0.0) (0.0) (0.0) (0.7) (0.0)
Manufacturing 90 0 27 9 0 5 20 2 0 19 8(4.7) (0.0) (9.6) (2.7) (0.0) (3.6) (6.7) (5.6) (0.0) (6.6) (5.2)
Electricity, Gas & Steam 5 0 0 0 0 0 5 0 0 0 0(0.3) (0.0) (0.0) (0.0) (0.0) (0.0) (1.7) (0.0) (0.0) (0.0) (0.0)
Construction 52 5 0 2 0 0 38 0 0 5 2(2.7) (6.2) (0.0) (0.6) (0.0) (0.0) (12.8) (0.0) (0.0) (1.7) (1.3)
Trading / Marketing / Retailing 129 0 40 17 0 5 24 1 2 29 11(6.7) (0.0) (14.2) (5.0) (0.0) (3.6) (8.1) (2.8) (0.7) (10.0) (7.1)
Hospitality & Tourism Services 12 0 3 1 0 1 0 0 0 4 3(0.6) (0.0) (1.1) (0.3) (0.0) (0.7) (0.0) (0.0) (0.0) (1.4) (1.9)
Transport, Storage & 73 0 11 13 0 2 30 1 0 12 4 Communication (3.8) (0.0) (3.9) (3.8) (0.0) (1.4) (10.1) (2.8) (0.0) (4.2) (2.6)
Financial Institutions 195 0 12 107 0 6 13 7 0 43 7(10.1) (0.0) (4.3) (31.7) (0.0) (4.3) (4.4) (19.4) (0.0) (14.9) (4.5)
Employment Sector Nature of Business
Cont’d

Appendix 2
- 15 -
Total Architecture # Arts Business &
Economics Dentistry Education Engineering Law ^ Medicine Science Social Sciences
(%) (%) (%) (%) (%) (%) (%) (%) (%) (%) (%)
Insurance 54 0 6 7 0 1 2 0 1 37 0(2.8) (0.0) (2.1) (2.1) (0.0) (0.7) (0.7) (0.0) (0.4) (12.8) (0.0)
Real Estate 28 8 7 4 0 0 2 0 0 5 2(1.4) (9.9) (2.5) (1.2) (0.0) (0.0) (0.7) (0.0) (0.0) (1.7) (1.3)
Business Services 278 0 59 119 0 7 31 12 0 28 22(14.4) (0.0) (20.9) (35.2) (0.0) (5.0) (10.4) (33.3) (0.0) (9.7) (14.2)
Engineering, Architectural 183 58 1 4 0 1 93 0 0 25 1 & Technical Services (9.5) (71.6) (0.4) (1.2) (0.0) (0.7) (31.2) (0.0) (0.0) (8.7) (0.6)
Multifarious Companies 9 0 2 4 1 0 0 0 0 0 2(0.5) (0.0) (0.7) (1.2) (2.2) (0.0) (0.0) (0.0) (0.0) (0.0) (1.3)
Foreign Diplomat / 1 0 1 0 0 0 0 0 0 0 0 Foreign Trade Commission (0.1) (0.0) (0.4) (0.0) (0.0) (0.0) (0.0) (0.0) (0.0) (0.0) (0.0)
Others not specified 31 2 5 7 0 1 3 1 1 10 1 in questionnaire (1.6) (2.5) (1.8) (2.1) (0.0) (0.7) (1.0) (2.8) (0.4) (3.5) (0.6)
BASE 1932 81 282 338 45 139 298 36 269 289 155(100) (100) (100) (100) (100) (100) (100) (100) (100) (100) (100)
No Response 263 9 31 47 5 15 36 8 44 41 27
TOTAL 2195 90 313 385 50 154 334 44 313 330 182
Please note that all percentages are rounded to one decimal place and the total may therefore not equal 100%.^ Most LLB graduates continue studies in PCLL programme for entry into the legal profession.# This figure refers to BA(ArchStud) graduates employed as Year-out Architectural Trainees as well as BSc(Surv) students for whom no such arrangement exists.
Employment Sector Nature of Business

Appendix 3
- 16 -
Occupation Total Architecture # Arts Business & Economics Dentistry Education Engineering Law ^ Medicine Science Social Sciences
(%) (%) (%) (%) (%) (%) (%) (%) (%) (%) (%) Physical & Life Scientists 18 0 0 1 0 0 0 0 0 16 1
(1.0) (0.0) (0.0) (0.3) (0.0) (0.0) (0.0) (0.0) (0.0) (5.6) (0.6)
Chemists 1 0 0 0 0 0 0 0 0 1 0(0.1) (0.0) (0.0) (0.0) (0.0) (0.0) (0.0) (0.0) (0.0) (0.4) (0.0)
Environmental Protection Officers 5 0 0 1 0 0 0 0 0 4 0 or equivalent (0.3) (0.0) (0.0) (0.3) (0.0) (0.0) (0.0) (0.0) (0.0) (1.4) (0.0)
Physicists, Biologists, Geologists, 12 0 0 0 0 0 0 0 0 11 1 Meteorologists, Biochemists & Scientific Officers (0.6) (0.0) (0.0) (0.0) (0.0) (0.0) (0.0) (0.0) (0.0) (3.9) (0.6)
Physical & Life Science Technicians 16 0 1 0 0 1 0 0 0 13 1(0.9) (0.0) (0.4) (0.0) (0.0) (0.7) (0.0) (0.0) (0.0) (4.6) (0.6)
Technicians In Chemistry, Physics, Biology, 8 0 0 0 0 0 0 0 0 8 0 and other Physical & Life Sciences (0.4) (0.0) (0.0) (0.0) (0.0) (0.0) (0.0) (0.0) (0.0) (2.8) (0.0)
Research Assistants 8 0 1 0 0 1 0 0 0 5 1 in Physical & Life Sciences (0.4) (0.0) (0.4) (0.0) (0.0) (0.7) (0.0) (0.0) (0.0) (1.8) (0.6)
Medical & Health Workers 345 0 0 0 42 31 2 1 257 9 3(18.4) (0.0) (0.0) (0.0) (100.0) (23.1) (0.7) (2.8) (98.1) (3.2) (1.9)
Medical Doctors, Pathologists & 98 0 0 0 0 0 0 0 98 0 0 Forensic Pathologists (5.2) (0.0) (0.0) (0.0) (0.0) (0.0) (0.0) (0.0) (37.4) (0.0) (0.0)
Dentists 43 0 0 0 42 0 0 1 0 0 0(2.3) (0.0) (0.0) (0.0) (100.0) (0.0) (0.0) (2.8) (0.0) (0.0) (0.0)
Registered Nurses, Enrolled Nurses, 133 0 0 0 0 0 0 0 133 0 0 Student Nurses & Pupil Nurses (7.1) (0.0) (0.0) (0.0) (0.0) (0.0) (0.0) (0.0) (50.8) (0.0) (0.0)
Chinese Medicine Practitioners 6 0 0 0 0 0 0 0 6 0 0(0.3) (0.0) (0.0) (0.0) (0.0) (0.0) (0.0) (0.0) (2.3) (0.0) (0.0)
Pharmacists 18 0 0 0 0 0 0 0 18 0 0(1.0) (0.0) (0.0) (0.0) (0.0) (0.0) (0.0) (0.0) (6.9) (0.0) (0.0)
3. DISTRIBUTION BY OCCUPATION(2012 BACHELOR'S DEGREE)
Cont’d

Appendix 3
- 17 -
Occupation Total Architecture # Arts Business & Economics Dentistry Education Engineering Law ^ Medicine Science Social Sciences
(%) (%) (%) (%) (%) (%) (%) (%) (%) (%) (%) Occupational Therapists 2 0 0 0 0 0 0 0 1 1 0
(0.1) (0.0) (0.0) (0.0) (0.0) (0.0) (0.0) (0.0) (0.4) (0.4) (0.0)
Medical Laboratory Technicians / Technologists 2 0 0 0 0 0 1 0 0 1 0(0.1) (0.0) (0.0) (0.0) (0.0) (0.0) (0.3) (0.0) (0.0) (0.4) (0.0)
Speech Therapists 32 0 0 0 0 31 0 0 0 0 1(1.7) (0.0) (0.0) (0.0) (0.0) (23.1) (0.0) (0.0) (0.0) (0.0) (0.6)
Other Medical & Health Workers n.e.c.* 11 0 0 0 0 0 1 0 1 7 2(0.6) (0.0) (0.0) (0.0) (0.0) (0.0) (0.3) (0.0) (0.4) (2.5) (1.3)
Engineers 181 0 0 6 0 0 168 1 0 6 0(9.6) (0.0) (0.0) (1.8) (0.0) (0.0) (57.9) (2.8) (0.0) (2.1) (0.0)
Civil / Structural Engineers 107 0 0 2 0 0 104 1 0 0 0(5.7) (0.0) (0.0) (0.6) (0.0) (0.0) (35.9) (2.8) (0.0) (0.0) (0.0)
Building Services Engineers 17 0 0 2 0 0 14 0 0 1 0(0.9) (0.0) (0.0) (0.6) (0.0) (0.0) (4.8) (0.0) (0.0) (0.4) (0.0)
Electrical Engineers 8 0 0 0 0 0 8 0 0 0 0(0.4) (0.0) (0.0) (0.0) (0.0) (0.0) (2.8) (0.0) (0.0) (0.0) (0.0)
Electronic Engineers 2 0 0 1 0 0 1 0 0 0 0(0.1) (0.0) (0.0) (0.3) (0.0) (0.0) (0.3) (0.0) (0.0) (0.0) (0.0)
Mechanical Engineers 21 0 0 0 0 0 21 0 0 0 0(1.1) (0.0) (0.0) (0.0) (0.0) (0.0) (7.2) (0.0) (0.0) (0.0) (0.0)
Industrial / Manufacturing Engineers 2 0 0 0 0 0 2 0 0 0 0(0.1) (0.0) (0.0) (0.0) (0.0) (0.0) (0.7) (0.0) (0.0) (0.0) (0.0)
Computer Engineers 2 0 0 0 0 0 2 0 0 0 0(0.1) (0.0) (0.0) (0.0) (0.0) (0.0) (0.7) (0.0) (0.0) (0.0) (0.0)
Telecommunication Engineers 2 0 0 0 0 0 2 0 0 0 0(0.1) (0.0) (0.0) (0.0) (0.0) (0.0) (0.7) (0.0) (0.0) (0.0) (0.0)
Other Engineers n.e.c.* 20 0 0 1 0 0 14 0 0 5 0 (e.g. Safety or Assurance Engineers) (1.1) (0.0) (0.0) (0.3) (0.0) (0.0) (4.8) (0.0) (0.0) (1.8) (0.0)
Cont’d

Appendix 3
- 18 -
Occupation Total Architecture # Arts Business & Economics Dentistry Education Engineering Law ^ Medicine Science Social Sciences
(%) (%) (%) (%) (%) (%) (%) (%) (%) (%) (%) Architects & Surveyors 76 74 0 0 0 0 0 0 0 1 1
(4.0) (96.1) (0.0) (0.0) (0.0) (0.0) (0.0) (0.0) (0.0) (0.4) (0.6)
Architects, Landscape Architects 47 46 0 0 0 0 0 0 0 0 1(2.5) (59.7) (0.0) (0.0) (0.0) (0.0) (0.0) (0.0) (0.0) (0.0) (0.6)
Quantity Surveyors 16 16 0 0 0 0 0 0 0 0 0(0.9) (20.8) (0.0) (0.0) (0.0) (0.0) (0.0) (0.0) (0.0) (0.0) (0.0)
Building / Land Surveyors 5 5 0 0 0 0 0 0 0 0 0(0.3) (6.5) (0.0) (0.0) (0.0) (0.0) (0.0) (0.0) (0.0) (0.0) (0.0)
Appraisers, Rating & Valuating Surveyors 3 3 0 0 0 0 0 0 0 0 0(0.2) (3.9) (0.0) (0.0) (0.0) (0.0) (0.0) (0.0) (0.0) (0.0) (0.0)
Estate / Maintenance Surveyors 4 4 0 0 0 0 0 0 0 0 0(0.2) (5.2) (0.0) (0.0) (0.0) (0.0) (0.0) (0.0) (0.0) (0.0) (0.0)
Other Architects / Surveyors n.e.c.* 1 0 0 0 0 0 0 0 0 1 0(0.1) (0.0) (0.0) (0.0) (0.0) (0.0) (0.0) (0.0) (0.0) (0.4) (0.0)
Aircraft & Ship Officers 2 0 0 1 0 0 1 0 0 0 0(0.1) (0.0) (0.0) (0.3) (0.0) (0.0) (0.3) (0.0) (0.0) (0.0) (0.0)
Flight Navigators, Aircraft Pilots, Flight Engineers, 2 0 0 1 0 0 1 0 0 0 0 Ship Masters / Pilots / Engineers / Surveyors (0.1) (0.0) (0.0) (0.3) (0.0) (0.0) (0.3) (0.0) (0.0) (0.0) (0.0)
Engineering Technicians 19 0 0 1 0 0 14 0 0 4 0(1.0) (0.0) (0.0) (0.3) (0.0) (0.0) (4.8) (0.0) (0.0) (1.4) (0.0)
Technicians: Civil / Structural, Building Services 7 0 0 0 0 0 6 0 0 1 0 Engineering (0.4) (0.0) (0.0) (0.0) (0.0) (0.0) (2.1) (0.0) (0.0) (0.4) (0.0)
Technicians: Mechanical Engineering 1 0 0 0 0 0 1 0 0 0 0(0.1) (0.0) (0.0) (0.0) (0.0) (0.0) (0.3) (0.0) (0.0) (0.0) (0.0)
Technicians: Industrial / Manufacturing Engineering 3 0 0 0 0 0 2 0 0 1 0(0.2) (0.0) (0.0) (0.0) (0.0) (0.0) (0.7) (0.0) (0.0) (0.4) (0.0)
Cont’d

Appendix 3
- 19 -
Occupation Total Architecture # Arts Business & Economics Dentistry Education Engineering Law ^ Medicine Science Social Sciences
(%) (%) (%) (%) (%) (%) (%) (%) (%) (%) (%) Technicians: Aeronautical Engineering 2 0 0 1 0 0 1 0 0 0 0
(0.1) (0.0) (0.0) (0.3) (0.0) (0.0) (0.3) (0.0) (0.0) (0.0) (0.0)
Other Technicians n.e.c.* 6 0 0 0 0 0 4 0 0 2 0 (e.g. Technical Officers, Clerk of Works, (0.3) (0.0) (0.0) (0.0) (0.0) (0.0) (1.4) (0.0) (0.0) (0.7) (0.0) Software Technicians)
Teaching and Research Profession 210 0 60 13 0 64 7 0 3 33 30(11.2) (0.0) (22.3) (4.0) (0.0) (47.8) (2.4) (0.0) (1.1) (11.6) (19.1)
Faculty Member (e.g. Professor, Lecturer) 3 0 1 0 0 1 0 0 1 0 0 in University / Degree Granting Institution (0.2) (0.0) (0.4) (0.0) (0.0) (0.7) (0.0) (0.0) (0.4) (0.0) (0.0)
Other Teaching Staff In Tertiary Education 2 0 1 0 0 1 0 0 0 0 0 Institutes / Post-Secondary / Technical Colleges (0.1) (0.0) (0.4) (0.0) (0.0) (0.7) (0.0) (0.0) (0.0) (0.0) (0.0) Kindergarten Teachers, 1 0 1 0 0 0 0 0 0 0 0 including Child Care Workers (0.1) (0.0) (0.4) (0.0) (0.0) (0.0) (0.0) (0.0) (0.0) (0.0) (0.0)
Secondary School Teachers 46 0 9 0 0 36 0 0 0 0 1(2.4) (0.0) (3.3) (0.0) (0.0) (26.9) (0.0) (0.0) (0.0) (0.0) (0.6)
Primary School Teachers 10 0 3 0 0 7 0 0 0 0 0(0.5) (0.0) (1.1) (0.0) (0.0) (5.2) (0.0) (0.0) (0.0) (0.0) (0.0)
Special Education Teachers 1 0 0 0 0 1 0 0 0 0 0(0.1) (0.0) (0.0) (0.0) (0.0) (0.7) (0.0) (0.0) (0.0) (0.0) (0.0)
Education Officers (Administration), 8 0 3 1 0 2 0 0 0 1 1 School Principals & Inspectors (0.4) (0.0) (1.1) (0.3) (0.0) (1.5) (0.0) (0.0) (0.0) (0.4) (0.6)
Secondary School Teaching Assistants 15 0 7 1 0 3 0 0 0 2 2(0.8) (0.0) (2.6) (0.3) (0.0) (2.2) (0.0) (0.0) (0.0) (0.7) (1.3)
Primary School Teaching Assistants 1 0 0 0 0 0 0 0 0 1 0(0.1) (0.0) (0.0) (0.0) (0.0) (0.0) (0.0) (0.0) (0.0) (0.4) (0.0)
Teaching Assistants In Educational Institutions 13 0 2 6 0 1 0 0 1 1 2(0.7) (0.0) (0.7) (1.8) (0.0) (0.7) (0.0) (0.0) (0.4) (0.4) (1.3)
Cont’d

Appendix 3
- 20 -
Occupation Total Architecture # Arts Business & Economics Dentistry Education Engineering Law ^ Medicine Science Social Sciences
(%) (%) (%) (%) (%) (%) (%) (%) (%) (%) (%) Research Related Staff 36 0 9 1 0 1 1 0 1 9 14
(1.9) (0.0) (3.3) (0.3) (0.0) (0.7) (0.3) (0.0) (0.4) (3.2) (8.9)
Other Education Personnels n.e.c.* 74 0 24 4 0 11 6 0 0 19 10 (e.g. Education Method Advisors, Training Officers) (3.9) (0.0) (8.9) (1.2) (0.0) (8.2) (2.1) (0.0) (0.0) (6.7) (6.4)
Economists, Statisticians, Mathematicians 51 0 4 5 0 0 0 2 1 38 1(2.7) (0.0) (1.5) (1.5) (0.0) (0.0) (0.0) (5.6) (0.4) (13.4) (0.6)
Statisticians 1 0 0 0 0 0 0 0 0 1 0(0.1) (0.0) (0.0) (0.0) (0.0) (0.0) (0.0) (0.0) (0.0) (0.4) (0.0)
Actuaries 27 0 0 0 0 0 0 0 1 26 0(1.4) (0.0) (0.0) (0.0) (0.0) (0.0) (0.0) (0.0) (0.4) (9.2) (0.0)
Operational Research Analysts 4 0 1 1 0 0 0 1 0 1 0(0.2) (0.0) (0.4) (0.3) (0.0) (0.0) (0.0) (2.8) (0.0) (0.4) (0.0)
Other Economics / Statistics / Mathematics Related 19 0 3 4 0 0 0 1 0 10 1 Researchers n.e.c.* (e.g. Financial Researchers, (1.0) (0.0) (1.1) (1.2) (0.0) (0.0) (0.0) (2.8) (0.0) (3.5) (0.6) Market Researchers, etc.)
System Analysts & Computer Programmers 71 0 2 18 0 2 41 0 0 7 1(3.8) (0.0) (0.7) (5.5) (0.0) (1.5) (14.1) (0.0) (0.0) (2.5) (0.6)
Computer Programmers, 38 0 0 7 0 2 25 0 0 4 0 System Analysts / Designers (2.0) (0.0) (0.0) (2.1) (0.0) (1.5) (8.6) (0.0) (0.0) (1.4) (0.0)
Information Technologists 18 0 1 8 0 0 8 0 0 1 0(1.0) (0.0) (0.4) (2.4) (0.0) (0.0) (2.8) (0.0) (0.0) (0.4) (0.0)
Software Engineers 8 0 0 1 0 0 6 0 0 1 0(0.4) (0.0) (0.0) (0.3) (0.0) (0.0) (2.1) (0.0) (0.0) (0.4) (0.0)
Other Computing Personnels n.e.c.* (e.g. Software / 7 0 1 2 0 0 2 0 0 1 1 Hardware Consultants, EDP Managers, Computer (0.4) (0.0) (0.4) (0.6) (0.0) (0.0) (0.7) (0.0) (0.0) (0.4) (0.6) Project Officers / Managers)
Accountants & Auditors 122 0 7 101 0 1 4 2 0 5 2(6.5) (0.0) (2.6) (30.7) (0.0) (0.7) (1.4) (5.6) (0.0) (1.8) (1.3)
Government Accountants / 2 0 0 2 0 0 0 0 0 0 0 Auditors / Accounting Officers (0.1) (0.0) (0.0) (0.6) (0.0) (0.0) (0.0) (0.0) (0.0) (0.0) (0.0)
Cont’d

Appendix 3
- 21 -
Occupation Total Architecture # Arts Business & Economics Dentistry Education Engineering Law ^ Medicine Science Social Sciences
(%) (%) (%) (%) (%) (%) (%) (%) (%) (%) (%) Non-Government Accountants / 105 0 5 90 0 1 4 1 0 3 1 Auditors / Accounting Officers (Including Trainees) (5.6) (0.0) (1.9) (27.4) (0.0) (0.7) (1.4) (2.8) (0.0) (1.1) (0.6)
Tax Professionals 10 0 0 8 0 0 0 1 0 0 1(0.5) (0.0) (0.0) (2.4) (0.0) (0.0) (0.0) (2.8) (0.0) (0.0) (0.6)
Other Accountants / Auditors n.e.c.* 5 0 2 1 0 0 0 0 0 2 0(0.3) (0.0) (0.7) (0.3) (0.0) (0.0) (0.0) (0.0) (0.0) (0.7) (0.0)
Religious Workers 1 0 0 0 0 0 0 0 0 1 0(0.1) (0.0) (0.0) (0.0) (0.0) (0.0) (0.0) (0.0) (0.0) (0.4) (0.0)
Ministers In Religion & Related Members of 1 0 0 0 0 0 0 0 0 1 0 Religious Order (0.1) (0.0) (0.0) (0.0) (0.0) (0.0) (0.0) (0.0) (0.0) (0.4) (0.0)
Authors, Journalists & Related Writers 55 0 31 1 0 4 1 1 0 3 14(2.9) (0.0) (11.5) (0.3) (0.0) (3.0) (0.3) (2.8) (0.0) (1.1) (8.9)
Radio & TV Producers / Script-Writers, 3 0 2 0 0 1 0 0 0 0 0 Programme Officers (e.g. in RTHK) (0.2) (0.0) (0.7) (0.0) (0.0) (0.7) (0.0) (0.0) (0.0) (0.0) (0.0)
Advertising Copywriters 1 0 1 0 0 0 0 0 0 0 0(0.1) (0.0) (0.4) (0.0) (0.0) (0.0) (0.0) (0.0) (0.0) (0.0) (0.0)
Editors, Journalists, Reporters 27 0 13 1 0 3 0 1 0 2 7(1.4) (0.0) (4.8) (0.3) (0.0) (2.2) (0.0) (2.8) (0.0) (0.7) (4.5)
Public Relation Officers 16 0 12 0 0 0 1 0 0 0 3(0.9) (0.0) (4.5) (0.0) (0.0) (0.0) (0.3) (0.0) (0.0) (0.0) (1.9)
Other Journalists & Writers 8 0 3 0 0 0 0 0 0 1 4 (e.g. Programme Assistants) (0.4) (0.0) (1.1) (0.0) (0.0) (0.0) (0.0) (0.0) (0.0) (0.4) (2.5)
Artists 3 0 0 0 0 0 1 1 0 0 1(0.2) (0.0) (0.0) (0.0) (0.0) (0.0) (0.3) (2.8) (0.0) (0.0) (0.6)
Commercial Artists & Designers 2 0 0 0 0 0 1 1 0 0 0(0.1) (0.0) (0.0) (0.0) (0.0) (0.0) (0.3) (2.8) (0.0) (0.0) (0.0)
Composers & Musicians 1 0 0 0 0 0 0 0 0 0 1(0.1) (0.0) (0.0) (0.0) (0.0) (0.0) (0.0) (0.0) (0.0) (0.0) (0.6)
Cont’d

Appendix 3
- 22 -
Occupation Total Architecture # Arts Business & Economics Dentistry Education Engineering Law ^ Medicine Science Social Sciences
(%) (%) (%) (%) (%) (%) (%) (%) (%) (%) (%) Legal Workers 12 0 2 0 0 1 0 8 0 1 0
(0.6) (0.0) (0.7) (0.0) (0.0) (0.7) (0.0) (22.2) (0.0) (0.4) (0.0)
Barristers / Pupil Barristers In Private Practice 1 0 0 0 0 0 0 1 0 0 0(0.1) (0.0) (0.0) (0.0) (0.0) (0.0) (0.0) (2.8) (0.0) (0.0) (0.0)
Solicitors / Trainee Solicitors In Private Practice 1 0 0 0 0 0 0 1 0 0 0(0.1) (0.0) (0.0) (0.0) (0.0) (0.0) (0.0) (2.8) (0.0) (0.0) (0.0)
Other Legal Workers 10 0 2 0 0 1 0 6 0 1 0(0.5) (0.0) (0.7) (0.0) (0.0) (0.7) (0.0) (16.7) (0.0) (0.4) (0.0)
Other Professionals & Technical Workers 61 0 13 1 0 4 2 1 0 10 30(3.2) (0.0) (4.8) (0.3) (0.0) (3.0) (0.7) (2.8) (0.0) (3.5) (19.1)
Social Workers 28 0 0 1 0 0 0 0 0 1 26(1.5) (0.0) (0.0) (0.3) (0.0) (0.0) (0.0) (0.0) (0.0) (0.4) (16.6)
Librarians, Curators, Archivists 3 0 0 0 0 3 0 0 0 0 0(0.2) (0.0) (0.0) (0.0) (0.0) (2.2) (0.0) (0.0) (0.0) (0.0) (0.0)
Interpreters / Translators 10 0 8 0 0 1 0 0 0 0 1(0.5) (0.0) (3.0) (0.0) (0.0) (0.7) (0.0) (0.0) (0.0) (0.0) (0.6)
Company Secretaries 8 0 5 0 0 0 1 1 0 1 0(0.4) (0.0) (1.9) (0.0) (0.0) (0.0) (0.3) (2.8) (0.0) (0.4) (0.0)
Other Professional & Technical Workers n.e.c.* 6 0 0 0 0 0 1 0 0 2 3 (e.g. Psychologists, Sociologists, Sportsmen) (0.1) (0.0) (0.0) (0.0) (0.0) (0.0) (0.3) (0.0) (0.0) (0.7) (1.9)
Safety Officers 6 0 0 0 0 0 0 0 0 6 0(0.3) (0.0) (0.0) (0.0) (0.0) (0.0) (0.0) (0.0) (0.0) (2.1) (0.0)
Managers 43 0 5 10 0 3 11 1 0 5 8(2.3) (0.0) (1.9) (3.0) (0.0) (2.2) (3.8) (2.8) (0.0) (1.8) (5.1)
General Managers & Administration Managers 15 0 2 3 0 2 1 0 0 2 5(0.8) (0.0) (0.7) (0.9) (0.0) (1.5) (0.3) (0.0) (0.0) (0.7) (3.2)
Research & Development Managers 1 0 0 1 0 0 0 0 0 0 0(0.1) (0.0) (0.0) (0.3) (0.0) (0.0) (0.0) (0.0) (0.0) (0.0) (0.0)
Cont’d

Appendix 3
- 23 -
Occupation Total Architecture # Arts Business & Economics Dentistry Education Engineering Law ^ Medicine Science Social Sciences
(%) (%) (%) (%) (%) (%) (%) (%) (%) (%) (%) Budgeting & Accounting Managers 1 0 0 1 0 0 0 0 0 0 0
(0.1) (0.0) (0.0) (0.3) (0.0) (0.0) (0.0) (0.0) (0.0) (0.0) (0.0)
Industrial Relations & Personnel / 1 0 0 1 0 0 0 0 0 0 0 Human Resource (HR) Managers (0.1) (0.0) (0.0) (0.3) (0.0) (0.0) (0.0) (0.0) (0.0) (0.0) (0.0)
Transport Operations / Logistics Managers 4 0 0 0 0 0 4 0 0 0 0 & Operation Managers (0.2) (0.0) (0.0) (0.0) (0.0) (0.0) (1.4) (0.0) (0.0) (0.0) (0.0)
Production Managers 3 0 0 1 0 0 0 0 0 1 1(0.2) (0.0) (0.0) (0.3) (0.0) (0.0) (0.0) (0.0) (0.0) (0.4) (0.6)
Wholesale & Retail Trade Managers 10 0 2 2 0 1 4 0 0 1 0(0.5) (0.0) (0.7) (0.6) (0.0) (0.7) (1.4) (0.0) (0.0) (0.4) (0.0)
Managers In Catering & Lodging Services 4 0 1 0 0 0 2 0 0 1 0(0.2) (0.0) (0.4) (0.0) (0.0) (0.0) (0.7) (0.0) (0.0) (0.4) (0.0)
Other Managerial Personnels n.e.c.* 4 0 0 1 0 0 0 1 0 0 2(0.2) (0.0) (0.0) (0.3) (0.0) (0.0) (0.0) (2.8) (0.0) (0.0) (1.3)
Business Professionals 438 0 97 148 0 13 31 9 0 100 40(23.3) (0.0) (36.1) (45.0) (0.0) (9.7) (10.7) (25.0) (0.0) (35.2) (25.5)
Marketing / Sales Executives / Sales Supervisors 85 0 24 16 0 3 10 0 0 21 11(4.5) (0.0) (8.9) (4.9) (0.0) (2.2) (3.4) (0.0) (0.0) (7.4) (7.0)
Shipping / Airline / Transport / Logistics Executives 13 0 0 4 0 0 3 1 0 4 1(0.7) (0.0) (0.0) (1.2) (0.0) (0.0) (1.0) (2.8) (0.0) (1.4) (0.6)
Commercial & Technical Salesmen 2 0 0 1 0 0 0 0 0 0 1(0.1) (0.0) (0.0) (0.3) (0.0) (0.0) (0.0) (0.0) (0.0) (0.0) (0.6)
Trading Executives / Merchandisers / Buyers 17 0 5 2 0 0 3 0 0 5 2 & Purchasing Agents (0.9) (0.0) (1.9) (0.6) (0.0) (0.0) (1.0) (0.0) (0.0) (1.8) (1.3)
Administrative / Management Executives 62 0 27 9 0 4 6 1 0 9 6(3.3) (0.0) (10.0) (2.7) (0.0) (3.0) (2.1) (2.8) (0.0) (3.2) (3.8)
Personnel / HR Officers / Supervisors 13 0 5 2 0 0 1 0 0 1 4(0.7) (0.0) (1.9) (0.6) (0.0) (0.0) (0.3) (0.0) (0.0) (0.4) (2.5)
Cont’d
Appendix 3
- 24 -
Occupation Total Architecture # Arts Business & Economics Dentistry Education Engineering Law ^ Medicine Science Social Sciences
(%) (%) (%) (%) (%) (%) (%) (%) (%) (%) (%) Management Consultants 14 0 3 9 0 0 0 1 0 0 1
(0.7) (0.0) (1.1) (2.7) (0.0) (0.0) (0.0) (2.8) (0.0) (0.0) (0.6)
Bank Executives 47 0 0 30 0 0 2 3 0 12 0(2.5) (0.0) (0.0) (9.1) (0.0) (0.0) (0.7) (8.3) (0.0) (4.2) (0.0)
Finance Executives / Investment Consultants / 47 0 5 31 0 0 1 1 0 9 0 Financial Planners (2.5) (0.0) (1.9) (9.4) (0.0) (0.0) (0.3) (2.8) (0.0) (3.2) (0.0)
Security Analysts, Portfolio Managers, Investment 38 0 0 27 0 0 0 0 0 11 0 Bankers, Corporate Finance Executives (2.0) (0.0) (0.0) (8.2) (0.0) (0.0) (0.0) (0.0) (0.0) (3.9) (0.0)
Customer Service Officers 50 0 15 5 0 2 1 1 0 19 7(2.7) (0.0) (5.6) (1.5) (0.0) (1.5) (0.3) (2.8) (0.0) (6.7) (4.5)
Organisation & Methods Officers 3 0 1 0 0 1 0 0 0 0 1(0.2) (0.0) (0.4) (0.0) (0.0) (0.7) (0.0) (0.0) (0.0) (0.0) (0.6)
Estate Development / Management Officers 2 0 1 0 0 0 0 0 0 1 0(0.1) (0.0) (0.4) (0.0) (0.0) (0.0) (0.0) (0.0) (0.0) (0.4) (0.0)
Other Executives n.e.c.* (e.g. Consumer Council 45 0 11 12 0 3 4 1 0 8 6 Officers, Project Executives, Logistic Executives, (2.4) (0.0) (4.1) (3.6) (0.0) (2.2) (1.4) (2.8) (0.0) (2.8) (3.8) Instructors & Other Executive Trainees)
Insurance, Real Estate & Business 24 2 4 4 0 1 0 0 0 10 3 Services Salesmen (1.3) (2.6) (1.5) (1.2) (0.0) (0.7) (0.0) (0.0) (0.0) (3.5) (1.9)
Insurance Salesmen & Underwriters 4 0 0 1 0 0 0 0 0 3 0(0.2) (0.0) (0.0) (0.3) (0.0) (0.0) (0.0) (0.0) (0.0) (1.1) (0.0)
Insurance Executives 5 0 1 1 0 0 0 0 0 3 0(0.3) (0.0) (0.4) (0.3) (0.0) (0.0) (0.0) (0.0) (0.0) (1.1) (0.0)
Securities Salesmen, Brokers 7 0 1 1 0 1 0 0 0 4 0(0.4) (0.0) (0.4) (0.3) (0.0) (0.7) (0.0) (0.0) (0.0) (1.4) (0.0)
Real Estate Salesmen 2 0 1 1 0 0 0 0 0 0 0(0.1) (0.0) (0.4) (0.3) (0.0) (0.0) (0.0) (0.0) (0.0) (0.0) (0.0)
Other Financial, Real Estate & Business Service 6 2 1 0 0 0 0 0 0 0 3 Workers (e.g. Auctioneers & Loss Adjusters) (0.3) (2.6) (0.4) (0.0) (0.0) (0.0) (0.0) (0.0) (0.0) (0.0) (1.9)
Cont’d
Appendix 3
- 25 -
Occupation Total Architecture # Arts Business & Economics Dentistry Education Engineering Law ^ Medicine Science Social Sciences
(%) (%) (%) (%) (%) (%) (%) (%) (%) (%) (%) Government Officials 49 0 15 12 0 1 1 6 1 3 10
(2.6) (0.0) (5.6) (3.6) (0.0) (0.7) (0.3) (16.7) (0.4) (1.1) (6.4)
Administrative Officers 13 0 1 6 0 0 0 2 0 1 3(0.7) (0.0) (0.4) (1.8) (0.0) (0.0) (0.0) (5.6) (0.0) (0.4) (1.9)
Trade Officers 6 0 3 1 0 0 0 1 0 0 1(0.3) (0.0) (1.1) (0.3) (0.0) (0.0) (0.0) (2.8) (0.0) (0.0) (0.6)
Executive Officers 21 0 8 4 0 1 0 2 0 0 6(1.1) (0.0) (3.0) (1.2) (0.0) (0.7) (0.0) (5.6) (0.0) (0.0) (3.8)
Hospital Administrators 5 0 2 0 0 0 1 0 0 2 0(0.3) (0.0) (0.7) (0.0) (0.0) (0.0) (0.3) (0.0) (0.0) (0.7) (0.0)
Intellectual Property Examiners 1 0 0 0 0 0 0 1 0 0 0(0.1) (0.0) (0.0) (0.0) (0.0) (0.0) (0.0) (2.8) (0.0) (0.0) (0.0)
Labour Officers 1 0 0 1 0 0 0 0 0 0 0(0.1) (0.0) (0.0) (0.3) (0.0) (0.0) (0.0) (0.0) (0.0) (0.0) (0.0)
Clerical & Related Workers 35 0 11 4 0 3 5 1 0 7 4(1.9) (0.0) (4.1) (1.2) (0.0) (2.2) (1.7) (2.8) (0.0) (2.5) (2.5)
Stenographic Secretaries & Personal Secretaries, 9 0 3 1 0 0 3 0 0 1 1 Clerical Secretaries, Typists (0.5) (0.0) (1.1) (0.3) (0.0) (0.0) (1.0) (0.0) (0.0) (0.4) (0.6)
Bank Tellers, Finance Clerks, Cashiers, Bookkeepers 2 0 0 0 0 0 0 0 0 1 1(0.1) (0.0) (0.0) (0.0) (0.0) (0.0) (0.0) (0.0) (0.0) (0.4) (0.6)
Air Transport Officers, Flight Operation 2 0 0 0 0 1 0 0 0 1 0 Officers, Air Traffic Controllers, MTR Regulatory (0.1) (0.0) (0.0) (0.0) (0.0) (0.7) (0.0) (0.0) (0.0) (0.4) (0.0) Officers
Postmasters, Postal Service Supervisors, Mail Sorting 1 0 1 0 0 0 0 0 0 0 0 Clerks, Postmen, Telecommunication Service (0.1) (0.0) (0.4) (0.0) (0.0) (0.0) (0.0) (0.0) (0.0) (0.0) (0.0) Supervisors
Proof-Readers, Personnel Clerks, Receptionists in 21 0 7 3 0 2 2 1 0 4 2 Hotels, Receiving and Despatching Clerks, Library & (1.1) (0.0) (2.6) (0.9) (0.0) (1.5) (0.7) (2.8) (0.0) (1.4) (1.3) Filing Clerks
Cont’d

Appendix 3
- 26 -
Occupation Total Architecture # Arts Business & Economics Dentistry Education Engineering Law ^ Medicine Science Social Sciences
(%) (%) (%) (%) (%) (%) (%) (%) (%) (%) (%) Sales / Service Workers 28 0 15 1 0 3 1 0 0 6 2
(1.5) (0.0) (5.6) (0.3) (0.0) (2.2) (0.3) (0.0) (0.0) (2.1) (1.3)
Shop Salespersons (e.g. Shop Assistants) 19 0 13 1 0 1 0 0 0 2 2(1.0) (0.0) (4.8) (0.3) (0.0) (0.7) (0.0) (0.0) (0.0) (0.7) (1.3)
Housekeepers & House Stewards In Hotels 1 0 0 0 0 0 0 0 0 1 0 & Institutions (0.1) (0.0) (0.0) (0.0) (0.0) (0.0) (0.0) (0.0) (0.0) (0.4) (0.0)
Flight Attendants 8 0 2 0 0 2 1 0 0 3 0(0.4) (0.0) (0.7) (0.0) (0.0) (1.5) (0.3) (0.0) (0.0) (1.1) (0.0)
Protective Service Workers 11 1 1 1 0 1 0 2 0 2 3(0.6) (1.3) (0.4) (0.3) (0.0) (0.7) (0.0) (5.6) (0.0) (0.7) (1.9)
Policemen, Detectives, Police Inspectors, 11 1 1 1 0 1 0 2 0 2 3 Police Constables (0.6) (1.3) (0.4) (0.3) (0.0) (0.7) (0.0) (5.6) (0.0) (0.7) (1.9)
Other Service Workers 8 0 1 1 0 1 0 0 0 3 2(0.4) (0.0) (0.4) (0.3) (0.0) (0.7) (0.0) (0.0) (0.0) (1.1) (1.3)
Tourist Guides / Tourism Hosts 4 0 0 1 0 1 0 0 0 1 1(0.2) (0.0) (0.0) (0.3) (0.0) (0.7) (0.0) (0.0) (0.0) (0.4) (0.6)
Theme Park Workers / Helpers / Hosts and 2 0 1 0 0 0 0 0 0 1 0 Welcoming Ambassadors (0.1) (0.0) (0.4) (0.0) (0.0) (0.0) (0.0) (0.0) (0.0) (0.4) (0.0)
All Other Sorts Of Service Workers 2 0 0 0 0 0 0 0 0 1 1 (e.g. Security Guards, Beauticians) (0.1) (0.0) (0.0) (0.0) (0.0) (0.0) (0.0) (0.0) (0.0) (0.4) (0.6)
Agriculture & Fishery Workers 1 0 0 0 0 0 0 0 0 1 0(0.1) (0.0) (0.0) (0.0) (0.0) (0.0) (0.0) (0.0) (0.0) (0.4) (0.0)
Master Farmers, Farm / Fishery Managers & 1 0 0 0 0 0 0 0 0 1 0 Supervisors & All Other Farmers (0.1) (0.0) (0.0) (0.0) (0.0) (0.0) (0.0) (0.0) (0.0) (0.4) (0.0)
Base 1880 77 269 329 42 134 290 36 262 284 157(100) (100) (100) (100) (100) (100) (100) (100) (100) (100) (100)
No Response 315 13 44 56 8 20 44 8 51 46 25 Total 2195 90 313 385 50 154 334 44 313 330 182* Not Elsewhere ClassifiedPlease note that all percentages are rounded to one decimal place and the total may therefore not equal 100%.Occupation - This classification is based on UGC CDCF Table 3 of 2012/13^ Most LLB graduates continue studies in PCLL programme for entry into the legal profession.# This figure refers to BA(ArchStud) graduates employed as Year-out Architectural Trainees as well as BSc(Surv) students for whom no such arrangement exists.

Appendix 4
- 27 -
Basic Gross Basic Gross Basic Gross Basic Gross OVERALL 18,679 19,617 15,000 15,900 60,000 150,000 2,000 6,000
(17,686) (18,389) (15,000) (15,000) (70,000) (70,000) (3,000) (4,000)
(including those not specifying 18,662 19,598 15,000 15,833 60,000 150,000 2,000 6,000
employment sectors) (17,650) (18,350) (15,000) (15,000) (70,000) (70,000) (3,000) (4,000)
CIVIL SERVICE 30,079 31,225 23,540 25,000 60,000 65,000 9,000 9,000
(26,334) (26,956) (22,240) (22,325) (60,000) (60,000) (9,600) (9,905)
EDUCATIONAL INSTITUTIONS 17,666 17,778 16,000 16,000 50,000 54,167 8,135 8,135
(17,128) (17,171) (17,000) (17,703) (50,000) (50,000) (6,000) (6,000)
Aided Primary Schools 19,401 19,401 21,500 21,500 22,405 22,405 9,000 9,000
Private Primary Schools 21,000 21,000 21,000 21,000 22,000 22,000 20,000 20,000
Direct Subsidy Primary Schools 22,000 22,000 22,000 22,000 22,000 22,000 22,000 22,000
Government Secondary Schools 17,333 17,333 15,000 15,000 25,000 25,000 12,000 12,000
Aided Secondary Schools 18,923 18,987 21,500 21,500 26,000 26,000 9,000 9,000
Direct Subsidy Secondary Schools 21,626 21,656 24,500 24,500 26,000 26,000 10,000 10,000
Aided Special Schools 24,128 24,128 24,000 24,000 25,000 25,000 23,000 23,000
Pre-Vocational Schools / Technical Institutes 13,750 14,063 12,500 13,125 20,000 20,000 10,000 10,000
Post-Secondary Colleges 11,423 11,769 12,000 12,500 13,000 13,500 9,115 9,115
Universities 14,989 15,106 13,000 13,000 50,000 54,167 8,135 8,135
Others (e.g. Kindergartens) 13,167 16,500 11,000 11,000 18,000 28,000 10,500 10,500
22,546 23,711 20,000 20,000 60,000 65,000 2,000 6,000
(23,703) (24,404) (20,000) (21,000) (60,000) (70,000) (4,000) (4,000)
Education Services 12,202 13,113 12,000 12,000 22,000 31,500 6,500 6,500
Research & Scientific Institutions 12,333 12,333 12,000 12,000 15,000 15,000 10,000 10,000
Welfare Institutions / Social / Community Services 16,960 17,006 16,000 16,000 28,000 28,000 6,000 6,000
Business / Professional / Labour / Trade Associations 14,808 15,217 12,250 12,459 30,000 30,000 9,500 9,500
Cultural / Recreational / Entertainment Services 11,242 11,915 11,000 12,000 18,000 18,000 2,000 8,000
Hospital / Medical / Dental Services 29,464 31,175 25,000 26,040 60,000 65,000 9,000 9,000
Political Groups 10,500 11,375 10,500 11,375 10,500 11,375 10,500 11,375
Others 9,000 9,000 9,000 9,000 9,000 9,000 9,000 9,000
14,877 15,832 13,000 14,000 60,000 150,000 6,000 6,000
(14,623) (15,487) (12,500) (13,500) (70,000) (70,000) (3,000) (6,333)
Mining & Quarrying 18,000 18,000 18,000 18,000 18,000 18,000 18,000 18,000
Manufacturing 12,572 13,330 12,000 12,659 20,000 30,000 8,500 8,500
Electricity, Gas & Steam 18,175 18,733 18,000 18,350 18,700 20,233 18,000 18,000
Construction 17,061 18,822 17,000 18,500 22,000 38,500 10,000 10,000
Trading / Marketing / Retailing 13,288 13,989 13,000 13,000 25,000 25,000 7,500 7,500
Hospitality & Tourism Services 11,080 11,278 10,750 11,388 13,000 13,000 9,000 9,000
Transport, Storage & Communication 14,194 15,151 13,000 14,000 37,000 37,000 7,800 8,400
Financial Institutions 18,865 20,708 14,850 16,000 50,000 150,000 6,000 6,000
Insurance 16,368 17,971 15,000 16,325 60,000 65,000 6,000 7,667
Real Estate 14,924 15,324 14,500 14,750 20,000 20,000 10,000 12,000
Business Services 12,508 13,041 12,000 12,000 32,000 42,833 7,000 7,000
Engineering, Architectural & Technical Services 15,518 16,095 16,000 16,500 22,000 22,000 9,000 9,375
Multifarious Companies 17,500 19,583 20,000 20,000 25,000 32,292 11,000 11,000
Foreign Diplomat / Foreign Trade Commission 15,000 16,250 15,000 16,250 15,000 16,250 15,000 16,250
Others not specified in questionnaire 15,659 16,265 13,000 13,250 50,000 54,167 9,000 9,000
Notes:1. Salary received by graduates working outside Hong Kong is not included.2. Figures in brackets are for 2011.
COMMERCE & INDUSTRY
COMMUNITY, SOCIAL & PERSONAL SERVICES
4. MONTHLY INCOME BY EMPLOYMENT SECTOR(2012 BACHELOR'S DEGREE)
Employment SectorAverage
HK$Median
HK$Maximum
HK$Minimum
HK$

Appendix 5
- 28 -
Basic Gross Basic Gross Basic Gross Basic Gross OVERALL 18,653 19,587 15,000 15,867 60,000 150,000 2,000 6,000
(17,656) (18,357) (15,000) (15,000) (70,000) (70,000) (3,000) (4,000)
(including those not specifying occupations) 18,662 19,598 15,000 15,833 60,000 150,000 2,000 6,000(17,650) (18,350) (15,000) (15,000) (70,000) (70,000) (3,000) (4,000)
Physical & Life Scientists 14,920 16,562 16,000 16,000 18,500 28,500 9,000 9,000
Chemists 11,000 19,417 11,000 19,417 11,000 19,417 11,000 19,417
Environmental Protection Officers or equivalent 10,467 10,778 11,000 11,458 11,400 11,875 9,000 9,000
Physicists, Biologists, Geologists, Meteorologists, Zoologists etc. 16,491 17,880 16,000 17,167 18,500 28,500 14,400 15,000
Physical & Life Science Technicians 11,459 11,970 10,000 12,760 16,000 16,000 9,000 9,000
Technicians In Chemistry, Physics, Biology etc. 9,446 10,399 9,500 9,625 10,000 14,000 9,000 9,000
Research Assistants in Physical & Life Sciences 13,220 13,345 13,000 13,250 16,000 16,000 10,000 10,000
Medical & Health Workers 31,774 33,555 25,000 26,040 60,000 65,000 9,000 9,000
Medical Doctors, Pathologists & Forensic Pathologists 51,764 54,922 50,000 55,000 60,000 65,000 30,000 40,000
Dentists 31,464 33,300 33,000 33,000 45,000 54,667 18,000 18,000
Registered Nurses, Enrolled Nurses, Student Nurses & Pupil Nurses 23,488 25,010 23,530 25,000 30,025 35,730 15,000 15,000
Chinese Medicine Practitioners 16,783 16,783 16,600 16,600 15,500 15,500 18,000 18,000
Pharmacists 14,494 14,494 15,000 15,000 17,500 17,500 9,000 9,000
Occupational Therapists 19,139 19,139 19,139 19,139 28,000 28,000 10,277 10,277
Medical Laboratory Technicians / Technologists 13,500 14,125 13,500 14,125 15,000 16,250 12,000 12,000
Speech Therapists 25,063 25,591 25,000 25,930 29,000 34,000 12,000 12,000
Other Medical & Health Workers n.e.c.* 12,778 13,130 11,000 11,500 22,000 22,000 10,000 10,000
Engineers 16,228 17,039 17,000 17,000 22,000 38,500 8,500 8,500
Civil / Structural Engineers 16,941 17,933 17,000 17,333 22,000 38,500 13,000 13,000
Building Services Engineers 15,581 16,089 15,500 16,517 20,000 20,000 10,000 10,000
Electrical Engineers 17,938 18,720 18,000 19,263 20,000 20,500 14,500 14,500
Electronic Engineers 14,000 14,642 14,000 14,642 15,000 15,000 13,000 14,283
Mechanical Engineers 15,139 15,528 15,000 15,500 18,300 18,500 13,000 13,000
Industrial / Manufacturing Engineers 12,750 13,292 12,750 13,292 13,000 14,083 12,500 12,500
Computer Engineers 15,000 15,000 15,000 15,000 15,000 15,000 15,000 15,000
Telecommunication Engineers 12,550 12,550 12,550 12,550 13,000 13,000 12,100 12,100
Other Engineers n.e.c.* 14,041 14,695 14,500 14,500 18,300 19,825 8,500 8,500
Architects & Surveyors 16,671 17,049 18,000 18,000 20,000 21,429 10,000 10,000
Architects, Landscape Architects # 17,149 17,374 18,000 18,000 20,000 20,667 12,000 12,000
Quantity Surveyors 14,953 15,804 14,000 15,065 18,500 21,429 13,500 13,500
Building / Land Surveyors 17,360 17,360 17,500 17,500 20,000 20,000 13,000 13,000
Appraisers, Rating & Valuating Surveyors 17,367 19,033 17,100 20,000 20,000 20,000 15,000 17,100
Estate / Maintenance Surveyors 17,775 17,775 17,650 17,650 18,500 18,500 17,300 17,300
Other Architects / Surveyors n.e.c.* 10,000 10,000 10,000 10,000 10,000 10,000 10,000 10,000
5. MONTHLY INCOME BY OCCUPATION(2012 BACHELOR'S DEGREE)
Average HK$
MedianHK$
MaximumHK$
MinimumHK$ Occupation
Cont’d

Appendix 5
- 29 -
Basic Gross Basic Gross Basic Gross Basic Gross
Aircraft & Ship Officers 26,000 26,000 26,000 26,000 37,000 37,000 15,000 15,000
Flight Navigators, Aircraft Pilots, Flight Engineers etc. 26,000 26,000 26,000 26,000 37,000 37,000 15,000 15,000
Engineering Technicians 13,061 13,739 13,000 13,542 17,300 17,300 10,000 10,000
Technicians: Civil / Structural, Building Services Engineering 15,267 15,600 16,000 16,000 17,300 17,300 12,000 12,417
Technicians: Mechanical Engineering 13,000 14,083 13,000 14,083 13,000 14,083 13,000 14,083
Technicians: Industrial / Manufacturing Engineering 12,000 12,722 12,000 13,000 14,000 15,167 10,000 10,000
Technicians: Aeronautical Engineering 13,000 14,084 13,000 14,084 13,000 15,167 13,000 13,000
Other Technicians n.e.c.* 11,417 12,215 11,000 11,417 13,500 16,625 10,000 10,000
Teaching and Research Profession 15,864 16,256 13,500 14,000 50,000 54,167 2,000 6,000
Faculty Members in University / Degree Granting Institution 26,333 27,722 18,000 18,000 50,000 54,167 11,000 11,000
Other Teaching Staff in Tertiary Education Institutes / Post-Secondary Colleges etc. 15,000 15,000 15,000 15,000 20,000 20,000 10,000 10,000
Kindergarten Teachers, Including Child Care Workers 18,000 28,000 18,000 28,000 18,000 28,000 18,000 28,000
Secondary School Teachers 22,631 22,631 23,500 23,500 26,000 26,000 12,000 12,000
Primary School Teachers 21,426 21,426 22,000 22,000 22,405 22,405 20,000 20,000
Special Education Teachers 23,000 23,000 23,000 23,000 23,000 23,000 23,000 23,000
Education Officers (Administration), School Principals & Inspectors 12,200 12,300 12,000 12,000 13,000 13,500 11,000 11,000
Secondary School Teaching Assistants 11,139 11,369 11,000 11,000 15,000 15,800 9,000 9,000
Primary School Teaching Assistants 9,000 9,000 9,000 9,000 9,000 9,000 9,000 9,000
Teaching Assistants in Educational Institutions 14,755 14,872 16,000 16,000 17,000 17,000 11,000 11,000
Research Related Staff 12,721 12,721 12,890 12,890 13,500 13,500 9,000 9,000
Other Education Personnels n.e.c.* (e.g. Training Officers) 11,970 12,911 12,000 12,000 22,000 31,500 2,000 6,000
Economists, Statisticians, Mathematicians 16,279 16,920 15,000 16,250 45,000 60,000 7,000 7,000
Statisticians 15,000 15,000 15,000 15,000 15,000 15,000 15,000 15,000
Actuaries 16,410 16,897 17,000 17,800 23,000 23,000 8,000 8,000
Operational Research Analysts 29,667 34,667 30,000 30,000 45,000 60,000 14,000 14,000
Other Economics / Statistics / Mathematics Related Researchers n.e.c.* 13,636 13,937 11,500 12,000 40,000 40,000 7,000 7,000
System Analysts & Computer Programmers 15,787 16,139 13,000 13,500 39,000 40,667 10,000 10,000
Computer Programmers, System Analysts / Designers 15,351 15,653 13,000 13,000 39,000 40,667 10,000 10,000
Information Technologists 16,853 17,412 15,000 16,250 33,000 33,000 12,000 12,000
Software Engineers 17,964 18,243 15,000 15,450 38,750 38,750 12,000 12,000
Other Computing Personnels n.e.c.* 13,143 13,300 12,000 13,000 17,000 17,000 11,000 11,000
Accountants & Auditors 12,108 12,584 12,000 12,000 24,000 24,000 9,000 9,750
Government Accountants / Auditors / Accounting Officers 12,000 13,000 12,000 13,000 12,000 13,000 12,000 13,000
Non-Government Accountants / Auditors / Accounting Officers 12,005 12,485 12,000 12,000 15,000 17,000 9,000 9,750
Tax Professionals 13,333 13,778 12,000 13,000 24,000 24,000 12,000 12,000
Other Accountants / Auditors n.e.c.* 11,875 12,208 12,000 12,417 12,500 13,000 11,000 11,000
Religious Workers 10,000 10,833 10,000 10,833 10,000 10,833 10,000 10,833
Ministers In Religion & Related Members of Religious Order 10,000 10,833 10,000 10,833 10,000 10,833 10,000 10,833
MinimumHK$ Occupation
Average HK$
MedianHK$
MaximumHK$
Cont’d

Appendix 5
- 30 -
Basic Gross Basic Gross Basic Gross Basic Gross
Authors, Journalists & Related Writers 11,854 12,228 12,000 12,000 18,000 18,400 8,000 8,000
Radio & TV Producers / Script-Writers, Programme Officers 9,667 10,333 10,000 10,000 10,000 12,000 9,000 9,000
Advertising Copywriters 18,000 18,400 18,000 18,400 18,000 18,400 18,000 18,400
Editors, Journalists, Reporters 12,013 12,394 12,000 12,000 15,000 15,438 10,000 10,000
Public Relation Officers 11,679 12,033 12,000 12,250 15,000 15,167 8,000 8,000
Other Journalists & Writers 11,600 11,817 12,000 12,000 15,000 15,000 8,000 8,000
Artists 10,250 13,500 10,250 12,000 12,000 20,000 8,500 8,500
Commercial Artists & Designers 8,500 14,250 8,500 14,250 8,500 20,000 8,500 8,500
Composers & Musicians 12,000 12,000 12,000 12,000 12,000 12,000 12,000 12,000
Legal Workers 17,203 17,038 16,900 15,950 25,965 25,965 10,000 10,000
Solicitors / Trainee Solicitors In Private Practice 20,000 20,000 20,000 20,000 20,000 20,000 20,000 20,000
Other Legal Workers 16,854 16,709 15,450 15,000 25,965 25,965 10,000 10,000
Other Professionals & Technical Workers 14,814 15,113 15,000 15,000 24,715 24,715 8,000 8,000
Social Workers 17,351 17,377 16,500 16,500 24,715 24,715 11,175 11,475
Librarians, Curators, Archivists 11,000 11,542 11,000 11,542 12,000 13,083 10,000 10,000
Interpreters / Translators 14,601 14,721 14,000 14,083 22,405 22,405 10,000 10,000
Company Secretaries 11,929 12,869 10,000 10,000 16,000 21,333 10,000 10,000
Other Professional & Technical Workers n.e.c.* 13,100 13,378 12,800 12,800 20,000 21,667 8,000 8,000
Safety Officers 10,917 11,810 10,250 10,888 13,000 16,083 10,000 10,000
Managers 16,408 20,387 14,000 15,000 60,000 150,000 8,000 8,000
General Managers & Administration Managers 20,286 29,756 15,000 16,458 60,000 150,000 10,000 11,000
Research & Development Managers 12,000 12,000 12,000 12,000 12,000 12,000 12,000 12,000
Budgeting & Accounting Managers 20,000 20,000 20,000 20,000 20,000 20,000 20,000 20,000
Industrial Relations & Personnel / Human Resource (HR) Managers 15,000 16,250 15,000 16,250 15,000 16,250 15,000 16,250
Transport Operations / Logistics Managers & Operation Managers 12,685 14,846 12,470 14,259 15,000 19,167 10,800 11,700
Production Managers 17,300 17,784 17,300 17,784 23,000 23,000 11,600 12,567
Wholesale & Retail Trade Managers 14,800 15,017 15,000 15,084 20,000 20,000 8,000 8,000
Managers In Catering & Lodging Services 11,250 12,292 11,500 12,333 12,000 14,500 10,000 10,000
Other Managerial Personnels n.e.c.* 15,667 15,667 12,000 12,000 23,000 23,000 12,000 12,000
Business Professionals 15,289 16,327 13,000 13,000 50,000 65,000 6,000 6,000
Marketing / Sales Executives / Sales Supervisors 12,774 13,594 12,000 13,000 25,000 30,000 7,500 7,500
Shipping / Airline / Transport / Logistics Executives 12,700 13,869 12,500 14,355 20,000 20,000 8,500 8,500
Commercial & Technical Salesmen 19,000 19,209 19,000 19,209 30,000 30,000 8,000 8,417
Trading Executives / Merchandisers / Buyers & Purchasing Agents 12,179 12,804 12,000 12,250 15,000 15,833 10,000 10,833
Administrative / Management Executives 14,225 14,855 12,250 13,000 50,000 54,167 7,500 7,500
Personnel / HR Officers / Supervisors 15,254 16,389 12,500 13,000 25,000 25,000 10,000 10,800
Management Consultants 19,545 22,583 16,000 17,250 32,000 42,833 13,000 13,000
Bank Executives 18,673 19,475 17,000 18,500 45,000 48,750 9,000 9,000
Finance Executives / Investment Consultants / Financial Planners 15,903 18,695 12,000 12,950 45,000 65,000 6,000 7,667
Security Analysts, Portfolio Managers, Investment Bankers, Corporate Finance Executives 24,015 25,770 20,000 20,000 50,000 63,000 7,000 7,000
Customer Service Officers 11,587 11,958 12,000 12,000 14,000 16,500 6,000 6,000
Organisation & Methods Officers 11,333 11,333 10,000 10,000 14,000 14,000 10,000 10,000
Estate Development / Management Officers 13,500 14,125 13,500 14,125 15,000 16,250 12,000 12,000
Other Executives n.e.c.* 14,815 15,344 13,000 13,250 35,000 35,000 10,000 10,000
OccupationAverage
HK$Median
HK$Maximum
HK$Minimum
HK$
Cont’d

Appendix 5
- 31 -
Basic Gross Basic Gross Basic Gross Basic Gross
Insurance, Real Estate & Business Services Salesmen 13,413 14,518 13,000 13,000 30,000 38,333 9,000 9,000
Insurance Salesmen & Underwriters 12,000 13,354 11,500 13,125 15,000 17,167 10,000 10,000
Insurance Executives 13,200 13,533 12,000 12,000 20,000 20,000 10,000 10,000
Securities Salesmen, Brokers 14,786 17,405 13,000 13,000 30,000 38,333 9,000 9,000
Real Estate Salesmen 12,000 12,000 12,000 12,000 12,000 12,000 12,000 12,000
Other Financial, Real Estate & Business Service Workers 13,167 13,167 14,250 14,250 15,000 15,000 9,000 9,000
Government Officials 25,471 25,471 23,000 23,000 41,950 41,950 10,000 10,000
Administrative Officers 40,120 40,120 40,000 40,000 41,950 41,950 34,000 34,000
Trade Officers 20,667 20,667 21,500 21,500 22,000 22,000 17,000 17,000
Executive Officers 22,482 22,482 23,000 23,000 24,000 24,000 16,000 16,000
Hospital Administrators 12,659 12,659 13,000 13,000 15,024 15,024 10,000 10,000
Intellectual Property Examiners 22,405 22,405 22,405 22,405 22,405 22,405 22,405 22,405
Labour Officers 22,405 22,405 22,405 22,405 22,405 22,405 22,405 22,405
Management Services Officers 18,468 18,468 18,468 18,468 18,935 18,935 18,000 18,000
Clerical & Related Workers 11,077 11,435 11,000 11,500 15,000 16,250 8,135 8,135
Stenographic Secretaries & Personal Secretaries, Typists etc. 11,050 11,250 12,000 12,000 14,000 14,000 8,135 8,135
Bank Tellers, Finance Clerks, Cashiers, Bookkeepers etc. 9,500 9,500 9,500 9,500 10,000 10,000 9,000 9,000
Air Transport Officers, MTR Regulatory Officers etc. 10,882 11,182 10,882 11,182 11,763 12,363 10,000 10,000
Postmasters, Telecommunication Service Supervisors etc. 11,500 11,500 11,500 11,500 11,500 11,500 11,500 11,500
Proof-Readers, Personnel Clerks, Receptionists in Hotels etc. 11,281 11,743 11,000 11,500 15,000 16,250 9,000 9,750
Sales / Service Workers 12,484 13,158 11,500 12,000 20,000 20,000 7,800 8,400
Shop Salespersons 11,688 11,948 11,000 11,000 16,000 16,333 9,000 9,000
Housekeepers & House Stewards In Hotels & Institutions 10,000 10,000 10,000 10,000 10,000 10,000 10,000 10,000
Flight Attendants 14,659 16,375 15,000 17,811 20,000 20,000 7,800 8,400
Protective Service Workers 35,078 35,078 35,000 35,000 35,500 35,500 35,000 35,000
Policemen, Detectives, Police Inspectors, Police Constables 35,078 35,078 35,000 35,000 35,500 35,500 35,000 35,000
Other Service Workers 11,150 11,410 10,050 10,800 16,000 16,000 8,000 8,000
Theme Park Workers / Helpers / Hosts and Welcoming Ambassadors 11,333 11,500 12,000 12,000 13,000 13,000 9,000 9,500
Tourist Guides / Tourism Hosts 10,025 10,685 10,025 10,685 10,050 10,800 10,000 10,570
All Other Sorts Of Service Workers 12,000 12,000 12,000 12,000 16,000 16,000 8,000 8,000
Agriculture & Fishery Workers 11,000 11,000 11,000 11,000 11,000 11,000 11,000 11,000
Master Farmers, Farm / Fishery Managers & Supervisors etc. 11,000 11,000 11,000 11,000 11,000 11,000 11,000 11,000
* Not Elsewhere Classified
# This figure refers to BA(ArchStud) graduates as Year-out Architectural Trainees as well as BSc(Surv) students for whom no such arrangement exists.
Note:
1. Salary received by graduates working outside Hong Kong is not included.
2. Figures in brackets are for 2011.
3. Occupation - This classification is based on UGC CDCF Table 3 of 2012/13.
OccupationAverage
HK$Median
HK$Maximum
HK$Minimum
HK$

Appendix 6
- 32 -
1. Architects & Surveyors # 96% 1. Teaching and Research Profession 22%2. 2. Authors, Journalists & Related Writers 10%3. 3. Administrative / Management Executives 10%4. 4. Marketing / Sales Executives / Sales 8.9%
Supervisors5. 5. Customer Service Officers 5.6%6. 6. Government Officials 5.6%7. 7. Sales / Service Workers 5.6%
1. Accountants & Auditors 31% 1. Dentists 100%2. Finance Executives / Investment Consultants 9.4% 2.
Financial Planners3. Bank Executives 9.1% 3.4. Security Analysts, Portfolio Managers, 8.2% 4.
Investment Bankers, Corporate Finance Executives
5. System Analysts & Computer Programmers 5.5% 5.
1. Teaching and Research Profession 48% 1. Engineers 58%2. Speech Therapists 25% 2. System Analysts & Computer Programmers 14%
1. Legal Workers 22% 1. Nurses 51%2. Government Officials 17% 2. Medical Doctors 37%3. Bank Executives 8.3% 3. Pharmacists 6.9%4. Economists, Statisticians, Mathematicians 5.6% 4.5. Accountants & Auditors 5.6% 5.6. Protective Service Workers 5.6% 6.
1. Economists, Statisticians, Mathematicians 13% 1. Teaching and Research Profession 19%2. Teaching and Research Profession 12% 2. Social Workers 17%3. Marketing / Sales Executives / Sales 7.4% 3. Authors, Journalists & Related Writers 8.9%
Supervisors 4. Marketing / Sales Executives / Sales 7.0%4. Customer Service Officers 6.7% Supervisors5. Physical & Life Scientists 5.6% 5. Government Officials 6.4%
6. Managers 5.1%
^ Most LLB graduates continue studies in PCLL programme for entry into the legal profession.# This figures refers to BA(ArchStud) graduates employed as Year-out Architectural Trainees as well as BSc(Surv)students for whom no such arrangement exists.
Faculty of Social SciencesFaculty of Science
Faculty of Education Faculty of Engineering
Faculty of MedicineFaculty of Law ^
Faculty of Architecture Faculty of Arts
6. MAJOR OCCUPATIONS BY FACULTY
Faculty of Business and Economics Faculty of Dentistry
Appendix 7
- 33 -
13,000
12,273
26,000
18,625
16,250
22,433
33,000
14,283
12,500
18,000
13,000
12,000
25,000
18,000
16,000
22,400
33,000
13,500
12,000
17,750
0 10,000 20,000 30,000 40,000 50,000
Social Sciences
Science
Medicine
Law ^
Engineering
Education
Dentistry
Business and Economics
Arts
Architecture
HK Dollars
Facu
lty
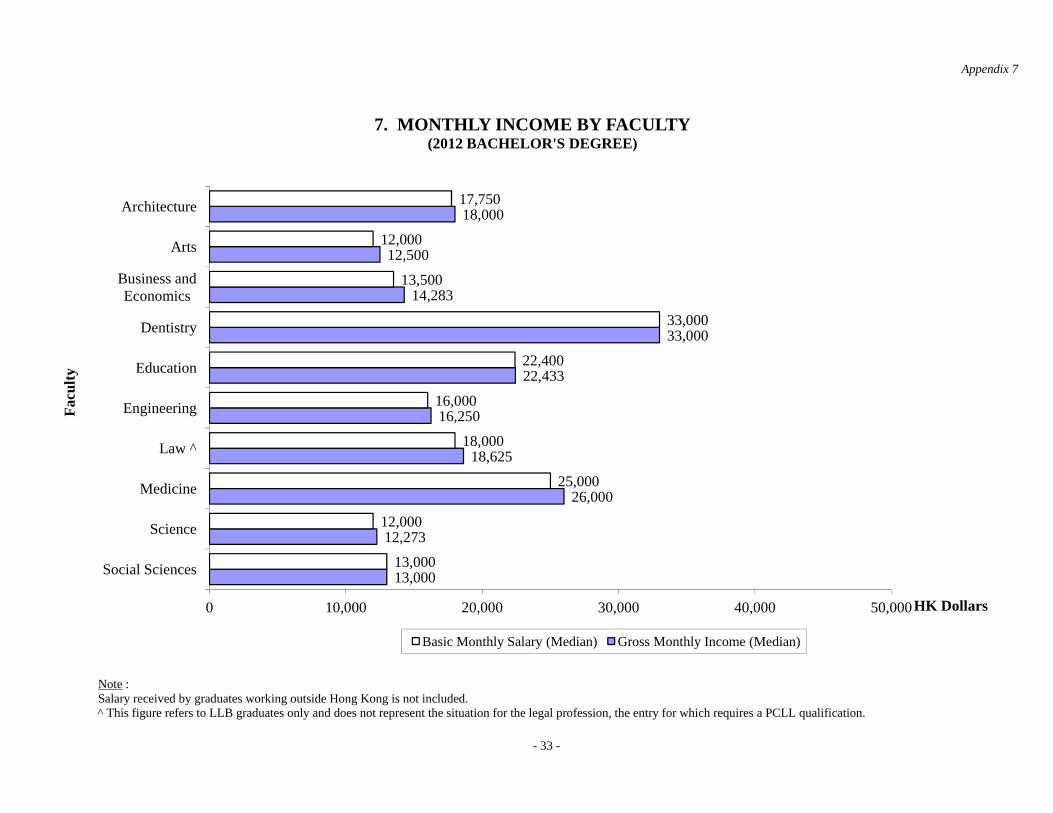
7. MONTHLY INCOME BY FACULTY(2012 BACHELOR'S DEGREE)
Basic Monthly Salary (Median) Gross Monthly Income (Median)
Note : Salary received by graduates working outside Hong Kong is not included. ^ This figure refers to LLB graduates only and does not represent the situation for the legal profession, the entry for which requires a PCLL qualification.

Appendix 8
- 34 -
Faculty Study Programme
Architecture 100 3.3%Bachelor of Arts in Architectural Studies 55 1.8%Bachelor of Arts in Landscape Studies 7 0.2%
Bachelor of Science in Surveying 38 1.2%
Arts 402 13%Bachelor of Arts 402 13%
Business & Economics 580 19%Bachelor of Business Administration 38 1.2%
Bachelor of Business Administration (Information Systems) 38 1.2%Bachelor of Business Administration (Law) 75 2.5%
Bachelor of Business Administration in Accounting and Finance 194 6.4%Bachelor of Business Administration in International Business and Global Management 26 0.9%Bachelor of Economics 5 0.2%
Bachelor of Economics & Finance 187 6.1%Bachelor of Finance 4 0.1%
Bachelor of Science in Quantitative Finance 13 0.4%
Dentistry 52 1.7%Bachelor of Dental Surgery 52 1.7%
Education 182 6.0%Bachelor of Arts and Bachelor of Education in Language Education 68 2.2%
Bachelor of Education in Language Education 38 1.2%Bachelor of Science in Exercise and Health 15 0.5%Bachelor of Science in Information Management 22 0.7%
Bachelor of Science in Speech and Hearing Sciences 37 1.2%Bachelor of Science in Sports Science and Leisure Management 2 0.1%
Engineering 439 14%Bachelor of Engineering—Civil Engineering 160 5.3%Bachelor of Engineering—Civil Engineering (Environmental Engineering) 7 0.2%
Bachelor of Engineering—Civil Engineering (Law) 7 0.2%Bachelor of Engineering—Computer Engineering 7 0.2%
Bachelor of Engineering—Computer Science 55 1.8%Bachelor of Engineering—Electrical Engineering 20 0.7%Bachelor of Engineering—Electronic and Communications Engineering 17 0.6%
Bachelor of Engineering—Industrial Engineering and Technology Management 22 0.7%Bachelor of Engineering—Information Engineering 3 0.1%
Bachelor of Engineering—Logistics Engineering and Supply Chain Management 46 1.5%Bachelor of Engineering—Mechanical Engineering 53 1.7%Bachelor of Engineering—Mechanical Engineering (Building Services Engineering) 12 0.4%
Bachelor of Engineering—Medical Engineering 30 1.0%
Law 204 6.7%Bachelor of Laws 204 6.7%
Medicine 338 11%Bachelor of Chinese Medicine 17 0.6%Bachelor of Medicine and Bachelor of Surgery 125 4.1%Bachelor of Nursing 171 5.6%
Bachelor of Pharmacy 25 0.8%
Science 446 15%Bachelor of Science 388 13%Bachelor of Science in Actuarial Science 58 1.9%
Social Sciences 301 9.9%Bachelor of Cognitive Science 1 0.0%Bachelor of Journalism 30 1.0%
Bachelor of Social Sciences 184 6.0%Bachelor of Social Sciences (Government and Laws) 48 1.6%Bachelor of Social Work 38 1.2%
TOTAL 3044 100%Please note that all percentages are rounded to one decimal place and the total may therefore not equal 100%.This profile covers all full-time UGC-funded Bachelor's Degree graduates.
8. GRADUATE PROFILE(2012 BACHELOR'S DEGREE)
Population

A Publication of the Centre of Development and Resources for Students The University of Hong Kong
Telephone: 2859 2314 Facsimile: 2559 5238
Website: http://cedars.hku.hk/