gradual pressure-induced enhancement of magnon …gradual pressure-induced enhancement of magnon...
TRANSCRIPT
Gradual pressure-induced enhancement of magnon excitations in CeCoSi
S. E. Nikitin,1, 2, ∗ D. G. Franco,1, 3 J. Kwon,1 R. Bewley,4 A. Podlesnyak,5 A. Hoser,6 M. M. Koza,7 C. Geibel,1 and O. Stockert1
1Max Planck Institute for Chemical Physics of Solids, D-01187 Dresden, Germany2Institut für Festkörper- und Materialphysik, Technische Universität Dresden, D-01069 Dresden, Germany
3Centro Atómico Bariloche and Instituto Balseiro, Comisión Nacional de Energía Atómica (CNEA),Universidad Nacional de Cuyo, Consejo Nacional de Investigaciones Científicas y Técnicas (CONICET),
Av. E. Bustillo 9500, R8402AGP San Carlos de Bariloche, Río Negro, Argentina4ISIS Facility, STFC Rutherford Appleton Laboratory, Harwell Campus, Didcot OX11 0QX, United Kingdom
5Neutron Scattering Division, Oak Ridge National Laboratory, Oak Ridge, Tennessee 37831, USA6Helmholtz-Zentrum Berlin für Materialien und Energie, D-14109 Berlin, Germany
7Institut Laue-Langevin, F-38042 Grenoble Cedex 9, France
CeCoSi is an intermetallic antiferromagnet with a very unusual temperature-pressure phase diagram:at ambient pressure it orders below TN = 8.8 K, while application of hydrostatic pressure induces a newmagnetically ordered phase with exceptionally high transition temperature of ∼ 40 K at 1.5 GPa. Westudied the magnetic properties and the pressure-induced magnetic phase of CeCoSi by means of elastic andinelastic neutron scattering (INS) and heat capacity measurements. At ambient pressure CeCoSi orders intoa simple commensurate AFM structure with a reduced ordered moment of only mCe = 0.37(6) µB. Specificheat and low-energy INS indicate a significant gap in the low-energy magnon excitation spectrum in theantiferromagnetic phase, with the CEF excitations located above 10 meV. Hydrostatic pressure graduallyshifts the energy of the magnon band towards higher energies, and the temperature dependence of themagnons measured at 1.5 GPa is consistent with the phase diagram. Moreover, the CEF excitations are alsodrastically modified under pressure.
I. INTRODUCTION
Ce-based intermetallic compounds represent a rich play-ground for exploration of quantum critical phenomena [1–4].The ground state of these materials originates quite oftenfrom a competition between RKKY interaction and Kondoscreening, which tend to create long-range magnetically or-dered and nonmagnetic heavy-fermion states, respectively.The delicate balance between RKKY and Kondo effects canbe quite easily tuned by an external tuning parameters, e.g.composition, uniaxial or hydrostatic pressure, magnetic fieldetc. Usually, application of hydrostatic pressure enhancesthe coupling between the conduction electrons and the local-ized Ce moments Jcf, and therefore, drastically increases thestrength of the Kondo effect (TK ∝ exp(− 1
2Jcf)) leading to
a reduced magnetic ordering temperature and shifting theground state of the material closer towards a nonmagneticheavy-fermion state [5–8].
However, in several recent works it was shown thatCeCoSi represents an intriguing counterexample to thisparadigm [9, 10]. This material crystallizes in the tetrag-onal CeFeSi structure (space group P4/nmm) and thecerium moments order antiferromagnetically below theTN = 8.8 K [11, 12]. Results of powder neutron diffractionmeasurements revealed a commensurate antiferromagneticstructure in isostructural CeCoGe with a simple antiferro-magnetic stacking of FM Ce planes along the c-axis [13], butthe information about the magnetic structure of CeCoSi is ab-sent to the best of our knowledge. Resistivity measurementsunder hydrostatic pressure [9] have shown that the applica-tion of rather moderate pressure of only ∼ 0.6 GPa inducesa new magnetically ordered phase with exceptionally hightransition temperature Tc ≈ 40 K (see the phase diagram inFig. 9). The pressure-induced phase has a dome shape andthe Tc changes only slightly up to ∼ 1.7 GPa, whereas uponfurther pressure increase Tc gets rapidly suppressed and a
quantum critical point, characterized by a divergence of re-sistivity parameters A and ρ0, was found at ∼ 2.2 GPa [9].A nonmagnetic Fermi-liquid state was observed at higherpressures.
In a recent study on single crystals, a very weak anomalywas observed in the specific heat and in the susceptibility atabout 12 K and was proposed to be quadrupolar order [14].Subsequent NMR and NQR results at high pressure indicatethat the high-T transition under pressure is a weak struc-tural transition [15]. Its primary order parameter was alsoproposed to be an antiferroquadrupolar one. However Ce3+
is a Kramers ion, and in solids its J = 5/2 multiplet is splitinto 3 Kramers doublets, which do not bear a quadrupolardegree of freedom. A quadrupolar order is then only pos-sible by mixing excited CEF doublets, which requires theexcited CEF states to be at low energy, of the order of thequadrupolar ordering temperature. However preliminaryresults indicated the CEF splitting to be much larger, largerthan 100 K [9, 14], at least at ambient pressure. That wouldmake a standard quadrupolar ordering not only at 12 K, butalso at 35 K very unlikely. In order to clarify this question,reliable information on the CEF excitation energies is crucial.
It is worth noting that such a jump-like drastic increase of
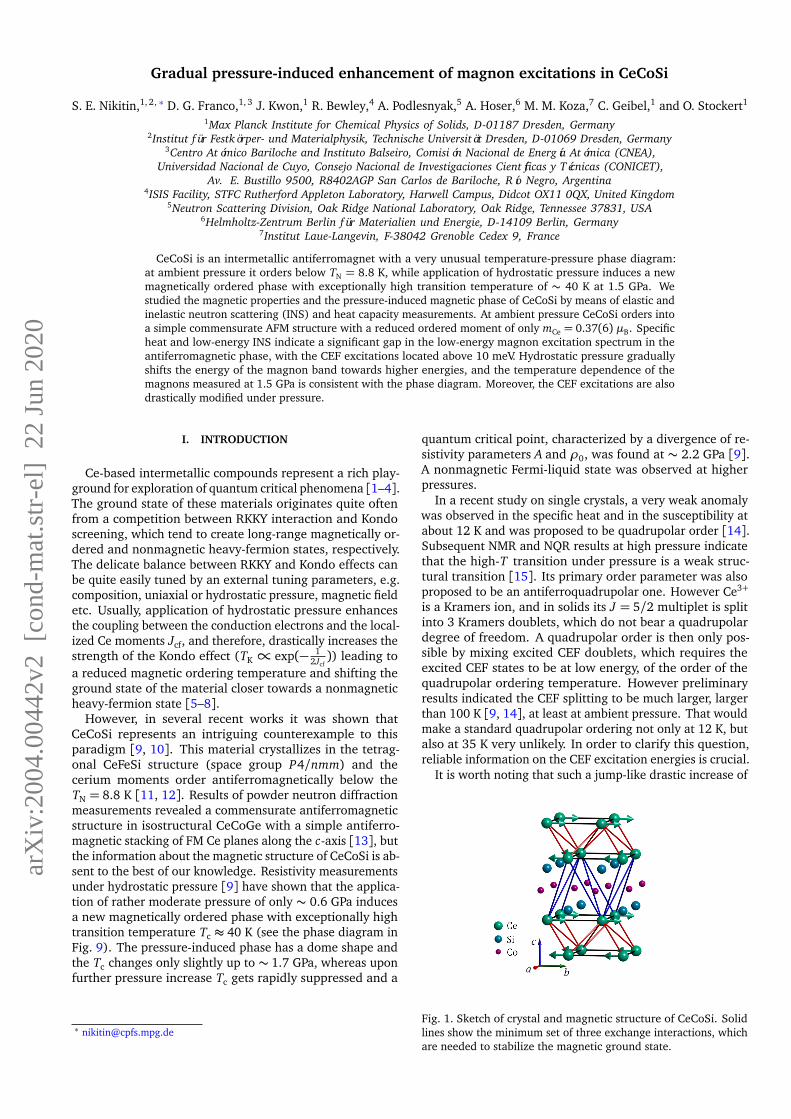
Fig. 1. Sketch of crystal and magnetic structure of CeCoSi. Solidlines show the minimum set of three exchange interactions, whichare needed to stabilize the magnetic ground state.
arX
iv:2
004.
0044
2v2
[co
nd-m
at.s
tr-e
l] 2
2 Ju
n 20
20
the transition temperature under the application of very mod-erate pressure is highly unusual for Ce-based metals and hasno simple explanation in terms of RKKY/Kondo competition,and some authors [9] proposed a meta-orbital transitionscenario to describe the appearance of a pressure-inducedordered phase. The concept of the meta-orbital transitionwas proposed by Kazumasa Hattori [16]. He investigated atwo-orbital Anderson lattice model (orbital energy splittingis induced by the CEF effect) with Ising orbital intersite ex-change interactions using a dynamical mean-field theory. Itwas shown, that if the hybridization between the ground-state f -electron orbital and conduction electrons is smallerthan the one between the excited f -electron orbital andconduction electrons at low pressures, the occupancy of thetwo orbitals changes steeply upon application of pressure.In other words, the excited CEF excitations, which typicallyhad been ignored, because in most cases the lowest excitedCEF state is well separated to the ground state, may start tocontribute to the ground state properties and induce the tran-sition. Such a meta-orbital transition has been theoreticallypredicted to happen in CeCu2Si2 [17], but no experimentalverification exists so far in any compound. Therefore, knowl-edge of the CEF splitting scheme, the magnon excitationsand their pressure evolution can provide crucial informa-tion about the unusual physics of CeCoSi, which might bethe first realization of a material exhibiting a meta-orbitaltransition.
To address these questions we synthesized polycrystallinesamples of CeCoSi and its nonmagnetic counterpart LaCoSi.Then, we characterized the samples using neutron diffractionand specific heat measurements. The magnetic excitationspectra were investigated by means of elastic and inelasticneutron scattering under hydrostatic pressures up to 1.5 GPa.
II. EXPERIMENTAL DETAILS
The polycrystalline samples of CeCoSi and its nonmag-netic counterpart LaCoSi were synthesized from elementalCe (La), Co and Si materials mixed in stoichiometric ratios us-ing arc-melting technique, and then annealed for ∼2 weeksat a temperature close to 1200 ◦C (the details are givenin [9]). The resulting materials were examined using x-raypowder diffraction and energy dispersive x-ray spectroscopyanalysis (EDX). The EDX measurements have shown thatafter the annealing, the majority of the sample consists ofCeCoSi phase, with a small inclusion of an elemental Ce andCeCo2Si2 phase, but according to powder diffraction, theconcentration of impurity phases is below 2 %.
Neutron powder diffraction measurements were per-formed at the diffractometer E6 (HZB facility). The powderdiffraction patterns were collected at T = 1.7 and 20 Kwith λ = 2.41 Å. Inelastic neutron scattering (INS) mea-surements at ambient pressure were carried out at the time-of-flight (TOF) spectrometers IN4 and IN6 of the InstitutLaue-Langevin in the temperature range 1.7–150 K. Theincident neutron energies were fixed to Ei = 31.95 meV andEi = 3.86 meV at IN4 and IN6 experiments, respectively. Inthese experiments we measured ∼ 10 g of powder samples.
To study the effect of hydrostatic pressure on the spinexcitations in CeCoSi we performed two INS experimentsusing the cold TOF spectrometers LET [18] at ISIS neutronsource and CNCS [19, 20] at SNS, ORNL. In order to apply
1 0 2 0 3 0 4 0 5 0 6 0 7 0 8 0
3 2 3 4 3 6
( b )
Inten
sity (a
rb. u.
)Int
ensity
(arb.
u.) T = 1 . 7 K
T = 2 0 K( a )
2 � ( d e g )
M a g n e t i c ( 1 0 0 ) p e a k
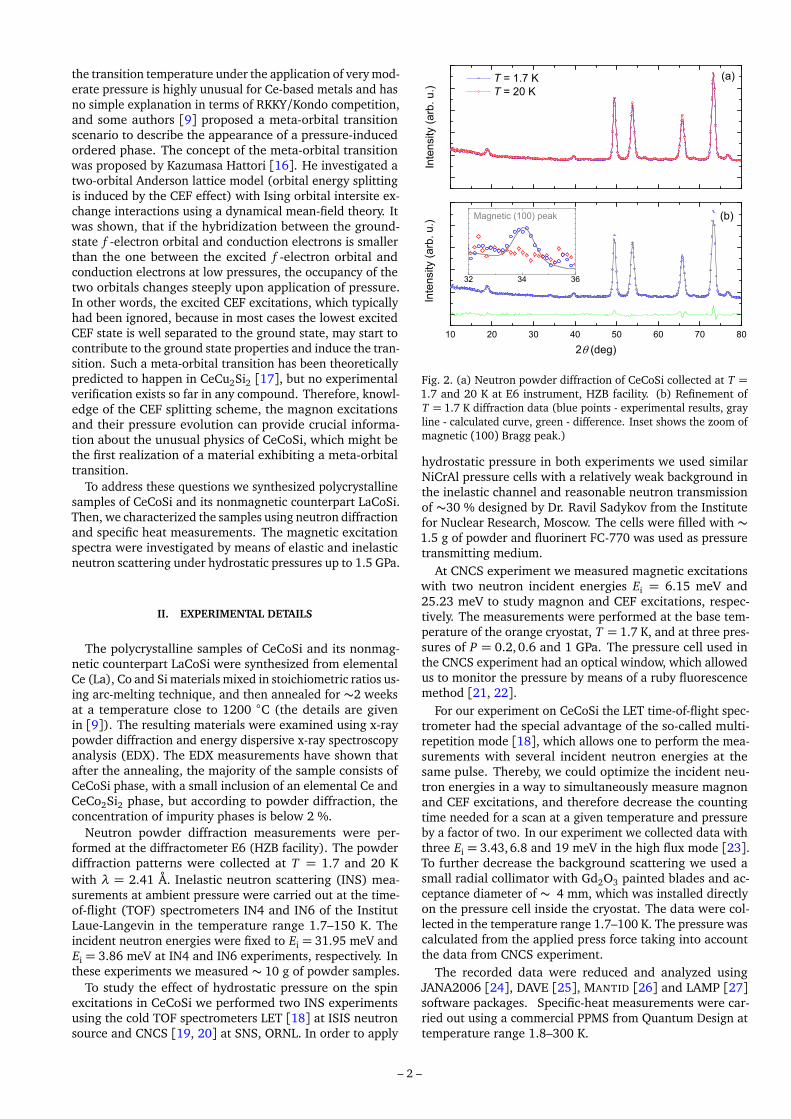
Fig. 2. (a) Neutron powder diffraction of CeCoSi collected at T =1.7 and 20 K at E6 instrument, HZB facility. (b) Refinement ofT = 1.7 K diffraction data (blue points - experimental results, grayline - calculated curve, green - difference. Inset shows the zoom ofmagnetic (100) Bragg peak.)
hydrostatic pressure in both experiments we used similarNiCrAl pressure cells with a relatively weak background inthe inelastic channel and reasonable neutron transmissionof ∼30 % designed by Dr. Ravil Sadykov from the Institutefor Nuclear Research, Moscow. The cells were filled with ∼1.5 g of powder and fluorinert FC-770 was used as pressuretransmitting medium.
At CNCS experiment we measured magnetic excitationswith two neutron incident energies Ei = 6.15 meV and25.23 meV to study magnon and CEF excitations, respec-tively. The measurements were performed at the base tem-perature of the orange cryostat, T = 1.7 K, and at three pres-sures of P = 0.2,0.6 and 1 GPa. The pressure cell used inthe CNCS experiment had an optical window, which allowedus to monitor the pressure by means of a ruby fluorescencemethod [21, 22].
For our experiment on CeCoSi the LET time-of-flight spec-trometer had the special advantage of the so-called multi-repetition mode [18], which allows one to perform the mea-surements with several incident neutron energies at thesame pulse. Thereby, we could optimize the incident neu-tron energies in a way to simultaneously measure magnonand CEF excitations, and therefore decrease the countingtime needed for a scan at a given temperature and pressureby a factor of two. In our experiment we collected data withthree Ei = 3.43, 6.8 and 19 meV in the high flux mode [23].To further decrease the background scattering we used asmall radial collimator with Gd2O3 painted blades and ac-ceptance diameter of ∼ 4 mm, which was installed directlyon the pressure cell inside the cryostat. The data were col-lected in the temperature range 1.7–100 K. The pressure wascalculated from the applied press force taking into accountthe data from CNCS experiment.
The recorded data were reduced and analyzed usingJANA2006 [24], DAVE [25], MANTID [26] and LAMP [27]software packages. Specific-heat measurements were car-ried out using a commercial PPMS from Quantum Design attemperature range 1.8–300 K.
– 2 –
III. EXPERIMENTAL RESULTS
A. Magnetic structure at ambient pressure
To characterize the magnetic structure of CeCoSi we mea-sured neutron powder diffraction using the E6 diffractometerat HZB. The powder diffraction patterns were collected atT = 1.7 and 20 K, i.e. below and above the TN and the ex-perimental results are shown in Fig. 2(a). One can see thatwith decreasing temperature a new weak magnetic satelliteappears at 2θ ≈ 34 ◦ (see inset in Fig. 2(b)). The peakcan be indexed as k = (100) (note that the (100) nuclearreflection is forbidden for the P4/nmm space group).
We performed magnetic group representation analysisusing JANA2006 software and found that the magnetic sym-metry group Pmm′n provide the best fit of our dataset. Thelow-temperature diffraction pattern along with the calcu-lated curve are shown in Fig. 2 (b), and one can see a goodagreement (Rnuc = 2.45 % and Rmag = 4.84 %). The latticeparameters of the CeCoSi at T = 1.7 K were determinedto be a = 3.9967(8) Å and c = 6.937(1) Å with the spacegroup P4/nmm (values in brackets denote the 1σ error ofthe least-squares fitting throughout the paper).
The magnetic structure (schematically shown in Fig. 1)turned out to be a collinear antiferromagnetic stacking offerromagnetic Ce layers along the c-axis, with the momentspointing along the [100] direction. The ordered Ce mo-ment is as small as mCe = 0.37(6) µB. It is worth notingthat even though our results are consistent with data ob-tained for the isostructural CeCoGe [13], both analysis arebased on a single (100) magnetic reflection, and thereforeshould be considered with care. Further single-crystal neu-tron diffraction experiments are highly desirable to confirmthe proposed magnetic structure.
B. Spin excitations at ambient pressure
1. Magnon excitations
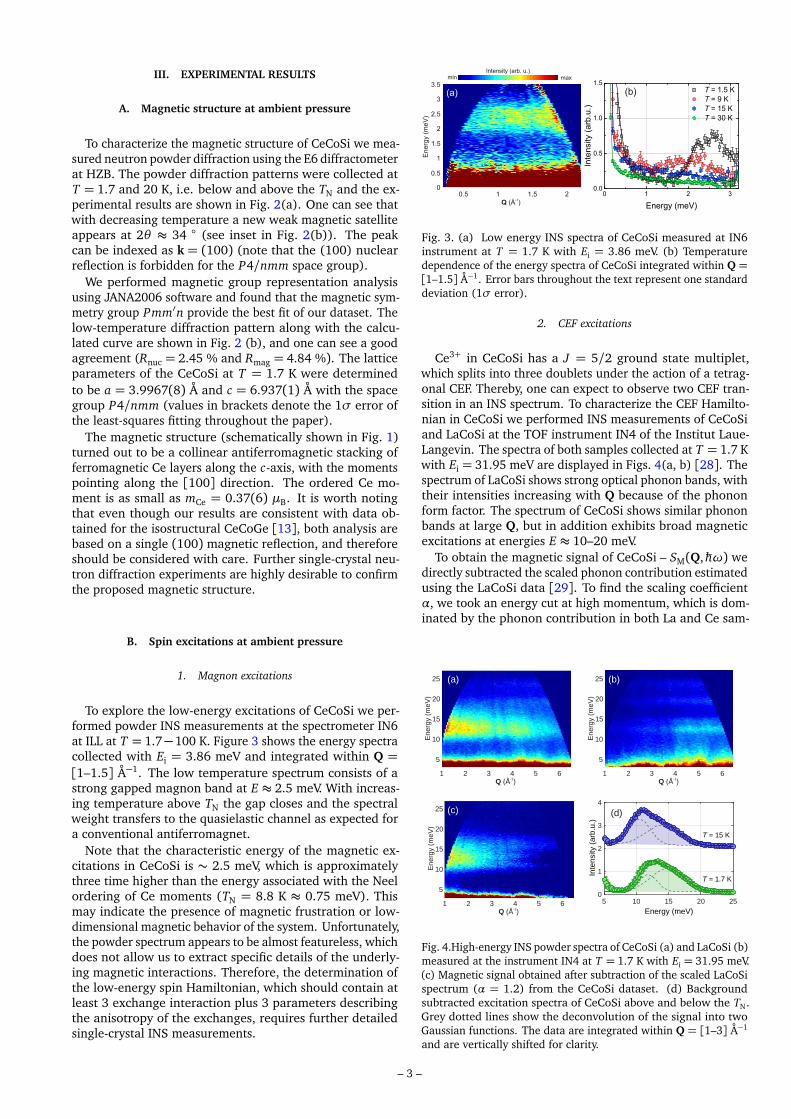
To explore the low-energy excitations of CeCoSi we per-formed powder INS measurements at the spectrometer IN6at ILL at T = 1.7−100 K. Figure 3 shows the energy spectracollected with Ei = 3.86 meV and integrated within Q =[1–1.5] Å−1. The low temperature spectrum consists of astrong gapped magnon band at E ≈ 2.5 meV. With increas-ing temperature above TN the gap closes and the spectralweight transfers to the quasielastic channel as expected fora conventional antiferromagnet.
Note that the characteristic energy of the magnetic ex-citations in CeCoSi is ∼ 2.5 meV, which is approximatelythree time higher than the energy associated with the Neelordering of Ce moments (TN = 8.8 K ≈ 0.75 meV). Thismay indicate the presence of magnetic frustration or low-dimensional magnetic behavior of the system. Unfortunately,the powder spectrum appears to be almost featureless, whichdoes not allow us to extract specific details of the underly-ing magnetic interactions. Therefore, the determination ofthe low-energy spin Hamiltonian, which should contain atleast 3 exchange interaction plus 3 parameters describingthe anisotropy of the exchanges, requires further detailedsingle-crystal INS measurements.
(a) (b)
Intensity (arb. u.)min max
Fig. 3. (a) Low energy INS spectra of CeCoSi measured at IN6instrument at T = 1.7 K with Ei = 3.86 meV. (b) Temperaturedependence of the energy spectra of CeCoSi integrated within Q =[1–1.5] Å−1. Error bars throughout the text represent one standarddeviation (1σ error).
2. CEF excitations
Ce3+ in CeCoSi has a J = 5/2 ground state multiplet,which splits into three doublets under the action of a tetrag-onal CEF. Thereby, one can expect to observe two CEF tran-sition in an INS spectrum. To characterize the CEF Hamilto-nian in CeCoSi we performed INS measurements of CeCoSiand LaCoSi at the TOF instrument IN4 of the Institut Laue-Langevin. The spectra of both samples collected at T = 1.7 Kwith Ei = 31.95 meV are displayed in Figs. 4(a, b) [28]. Thespectrum of LaCoSi shows strong optical phonon bands, withtheir intensities increasing with Q because of the phononform factor. The spectrum of CeCoSi shows similar phononbands at large Q, but in addition exhibits broad magneticexcitations at energies E ≈ 10–20 meV.
To obtain the magnetic signal of CeCoSi – SM(Q,ħhω) wedirectly subtracted the scaled phonon contribution estimatedusing the LaCoSi data [29]. To find the scaling coefficientα, we took an energy cut at high momentum, which is dom-inated by the phonon contribution in both La and Ce sam-
5 10 15 20 25
Energy (meV)
0
1
2
3
4
Inte
nsi
ty (
arb
.u.)
T = 15 K
T = 1.7 K
25
20
15
10
5
1 32 4 5 6
Energ
y (m
eV
)
-1Q (Å )
25
20
15
10
5
1 32 4 5 6
Energ
y (m
eV
)
-1Q (Å )
25
20
15
10
5
1 32 4 5 6
Energ
y (
meV
)
-1Q (Å )
(a) (b)
(c) (d)
Fig. 4.High-energy INS powder spectra of CeCoSi (a) and LaCoSi (b)measured at the instrument IN4 at T = 1.7 K with Ei = 31.95 meV.(c) Magnetic signal obtained after subtraction of the scaled LaCoSispectrum (α = 1.2) from the CeCoSi dataset. (d) Backgroundsubtracted excitation spectra of CeCoSi above and below the TN.Grey dotted lines show the deconvolution of the signal into twoGaussian functions. The data are integrated within Q = [1–3] Å−1
and are vertically shifted for clarity.
– 3 –

ples, because of the phonon and magnetic form-factors. Tocompensate the difference of the sample masses and scat-tering lengths we scaled the LaCoSi dataset to get the bestagreement between the spectra. Then, we used the ob-tained coefficient α to scale the LaCoSi spectrum in thewhole Q-range and subtract it from the CeCoSi spectrumSM(Q,ħhω) = SCe(Q,ħhω)−αSLa(Q,ħhω). The magnetic spec-trum after subtraction is displayed in Fig. 4 (c).
To qualitatively extract the positions of CEF peaks weintegrated the magnetic spectrum at Q = [1–3] Å−1. Tworepresentative curves taken at T = 1.7 and 15 K are shownin Fig. 4(d). Note that the error introduced in the energycuts when not considering the magnetic form factor and themissing data at small Q for higher energies, is well belowthe symbol size of the data points and similar in size to thestatistical error. One can see that the peak shape is ratherasymmetric and can not be fitted with a single peak functionand therefore, to qualitatively extract the peak positionswe fitted the curves with two Gaussian peaks. We foundthat the peaks are located at E1 = 10.49(6) meV and E2 =14.1(2) meV at T = 15 K, i.e. above TN, and their positionsslightly shift in the antiferromagnetic phase at T = 1.7 K(E1 = 11.78(6) meV and E2 = 14.8(3) meV) due to thesplitting of the ground state doublet by an exchange field. Itis worth noting that the CEF excitations are broader then theinstrumental resolution, which may be due to the interactionwith phonons [30], hybridization with the conduction bandelectrons or magnetic dispersion.
C. Specific heat
To check whether the broad asymmetric peak observedin the INS spectra indeed consists of two CEF excitationswe carefully measured the heat capacity of the CeCoSi andLaCoSi samples over a wide temperature range T = 1.8–300 K using a PPMS. Specific heat of LaCoSi sample wasused as a blank to estimate the phonon contribution andcalculate the magnetic contribution in CeCoSi.
The raw data and the magnetic heat capacity Cmag aftersubtraction of the phonon contribution are shown in Fig. 5.Cmag(T) exhibits two anomalies: a sharp peak at TN anda broad Schottky-like anomaly with a maximum at T ∗ =51.5 K.
First of all, we focus on the high-temperature part of thespecific heat curve. One can see that the absolute value ofthe specific heat C(T ∗) = 5.7 J/mol·K significantly exceedsthe 3.65 J/mol·K expected for a simple Schottky anomaly fora doublet-doublet transition. In contrast, the C(T ∗) is onlyslightly lower than 6.31 J/mol·K – the peak specific heatexpected for a doublet-quartet transition. This indicates thatthe anomaly is caused by two close standing CEF transitions.Also, from the T ∗ we can estimate the energy gap betweenthe doublet and excited quasi-quartet states ∆≈ 11.8 meV.Note that this result is in a very good agreement with themean energy of two doublets observed in our INS measure-ments (E1 + E2)/2 = 12.3 meV. To qualitatively calculatethe high-temperature magnetic specific heat of CeCoSi weused the standard equation for the specific heat of a discreten-level system:
C(T ) = NAvkBδ
δT
� 1Z
n∑
i=1
Eie− Ei
kB T
�
(1)
2 1 0 1 0 0 2 0 00
5
1 0
1 5
0 1 0 0 2 0 00
2 0
4 0
6 0
8 0
C Mag(J
/mol.
K)T e m p e r a t u r e ( K )
( b )
C e C o S i L a C o S i
C(J/m
ol.K)
T e m p e r a t u r e ( K )
( a )
Fig. 5. (a) Temperature dependences of CeCoSi and LaCoSi specificheat C(T). (b) Magnetic part Cmag of the specific heat of CeCoSiversus temperature T in a semilogarithmic plot. The solid red andorange lines shows the fits of CEF and magnon contributions tothe specific heat using Eq. (1) and Eq. (2) respectively.
where Ei are energies of states and Z is a partition function.Using Eq. (1) and transition energies E1 = 10.49(6) meVand E2 = 14.09(21) meV determined by INS above TN wecalculated the magnetic specific heat of CeCoSi, and theresults are plotted in Fig. 5(b) by the red line. The goodagreement between calculated and measured specific heatcurves provides another evidence that the CEF transitionenergies determined by INS are valid. The deviation betweenthe measured and the calculated specific heat curves at hightemperature above∼ 130 K are caused by the inaccuracy dueto subtraction of a massive phononic contribution, whichdominates at high temperature.
The low-temperature part of the specific heat containsinformation about the magnon density-of-state due to themagnetic ordering. For instance, the specific heat of the 3DHeisenberg AFM follows a simple power law C ∝ T 3 dueto the 3D gapless dispersion with ħhω∝ k. On the otherhand, if the system has a magnon gap one would expect anactivation behavior C ∝ e−∆/kB T . For the gapped magnonsin a three-dimensional magnetic metal the low-temperaturepart of the specific heat can be expressed as [31]:
C(T ) = γT + b∆72 T
12 e−∆/kB T
�
1+3920
� T∆
�
+5132
� T∆
�2�
.
(2)
The first term γT describes the electronic contribution tothe specific heat; b is the constant inversely proportional to
the spin-wave velocity b∝�
1D
�3.
We fitted the low-T part of our specific heat curve (2 <
– 4 –

0 5 10 15 20 25 30Temperature (K)
3.6
3.8
4.0
4.2
Peak p
ositi
on (
meV
)
0 5 10 15 20 25 30 35Temperature (K)
0.0
0.2
0.4
0.6
0.8
1.0
Peak A
rea (
arb
.u.)
1 2 3 4 5
Energy transfer (meV)
0
0.1
0.2
0.3
0.4
0.5
Dyn
am
ica
l su
sce
ptib
ility
χ''
(arb
.u.) T = 1.7 K
T = 7.5 KT = 15 KT = 20 KT = 30 K
(a)
(b) (c)
35
P = 1.5 GPa
Fig. 6. Temperature dependence of INS signal at P = 1.5 GPa.(a) INS spectra taken at P = 1.5 GPa with Ei = 6.8 meV andintegrated within Q= [0.5–2.5] Å−1. (b,c) Magnon peak positionand integrated intensity as a functions of temperature.
T < 23 TN≈ 6 K) using Eq. (2). The fitted curve is shown in
Fig. 5(b) by orange line, and one can see the perfect agree-ment between the experimental and calculated curves. It isinteresting to note that the extrapolation of our fit functionto higher temperature up to 8 K provides surprisingly gooddescription of the observed specific heat data.
The fitted parameters were found to be γ =23.9(6) mJ/mol·K2 and ∆/kB = 12.75(7) K. It is worthnoting that the gap determined from the specific heatmeasurements is of the order of the ordering temperatureof CeCoSi.
D. Magnetic excitations under hydrostatic pressure
We start our presentation of the pressure-induced evo-lution of the spin dynamics in CeCoSi with the spectracollected at the LET spectrometer. Note that the pressurecell produces a massive background signal. In order to de-termine the nonmagnetic scattering we used the LaCoSispectrum measured under similar conditions and the pro-cedure described in Sec. III B 2 assuming that SM(Q,ħhω) =SCe(Q,ħhω)−α ·SLa(Q,ħhω). However, even without the sub-traction a strong broad excitation band at E ≈ 4 meV isclearly seen in the spectrum (the raw spectra obtained onthe LET spectrometer are presented in Appendix A, Fig. 11(a-d)).
As was discussed above, in this experiment we did nothave a pressure sensor in the cell, and the pressure of 1.5 GPawas calculated from the applied press force taking into ac-count ∼ 10 % loss, while cooling down to 1.7 K, whichresults in the relatively large estimated uncertainty of thepressure determination of ∼ 0.25 GPa. For this reason wedecided to study the T dependence of the observed mode atfixed P. We subtracted the background and Bose-correctedall obtained spectra measured with Ei = 6.8 meV. The re-
sulting χ ′′(ħhω) curves integrated within Q= [0.5–2.5] Å−1
are shown in Fig. 6 (a). Increasing temperature inducesa decrease of the mode intensity, and slightly shifts downthe peak position. Fits of these parameters are presented inFig. 6(b, c) and one can see that the magnon mode inten-sity disappears below the detection limit at T = 30 K. Thisresult is in a reasonable agreement with the phase diagramof CeCoSi, which shows transition temperature of ∼ 35 K atP ≈ 1.5 GPa.
In order to check the consistency of our results with thezero pressure data we also measured the spectra at almostambient condition (P ≤ 0.1 GPa) at 1.7 K. The resultingspectrum along with the 1.5 GPa data and results of theIN4 experiment are shown in Fig. 7. The position of theCEF excitations obtained in the LET experiment perfectlycoincides with the IN4 results indicating that we can reliablyextract information about both CEF and magnon excitationsfrom the LET data. It is interesting to note that the pressureof P = 1.5 GPa significantly shifts or suppresses the intensityof the CEF excitations as clearly seen in Fig. 7.
We now focus on the pressure dependence in more de-tail and present data obtained on the CNCS spectrometer.Figure 8 shows the summary of the background subtractedsignal at 0.2, 0.6 and 1.0 GPa collected with two incidentneutron energies [32]. The Ei = 6.15 meV spectra presentedin the left panel display a rather strong magnon peak, whichposition gradually shifts upon increasing pressure. It is worthnoting that already at the lowest pressure of 0.2 GPa theposition of the peak is slightly higher than the one obtainedin our IN6 experiment at ambient pressure.
The high-energy data have much stronger background dueto the phonon scattering from the pressure cell. The dataafter subtracting the background contribution are shownin panel (b) of Fig. 8. At P = 0.2 GPa we found a weakpeak at an energy of ∼ 13 meV. Its position is close toE1 = 11.78(6) meV and E2 = 14.81(26) meV observed inthe IN4 experiment at ambient pressure. The position of thepeak also shits to higher energies with pressure. However,the signal-to-noise ratio is much worse in the 25.23 meVdataset compared to the 6.15 meV one, as can be seen fromthe ratio between the neutron count rate and errorbars inthe two panels of Fig. 8, and the 13 meV peak has an inten-sity, which exceeds the background level by 2-4 standarddeviations only. Taking into account that the positions andintensities of the peaks would depend on the details of thesubtraction procedure, we would like to point out that the
5 10 15
Energy transfer (meV)
0.1
0.2
0.3
0.4
0.5
0.6
0.7
0.8
INS
inte
nsity
(ar
b.u.
)
LET, P = 1:5 GPaLET, P 5 0:1 GPaIN4, P = 0 GPa
Fig. 7. Background subtracted INS spectra of CeCoSi taken at T =1.7 K on LET and IN4 instruments. The data are integrated withinQ = [0.5–2.5] Å−1
– 5 –
1 2 3 4 5Energy transfer (meV)
1
2
3
4
5IN
S s
ign
al (
arb
.u.)
6 8 10 12 14 16 18
2
3
4
5
6
7
8
INS
sig
na
l (a
rb.u
.)
Energy transfer (meV)
E = 25.23 meViE = 6.15 meVi
(a)
(b)P = 0.2 GPaP = 0.6 GPaP = 1.0 GPa
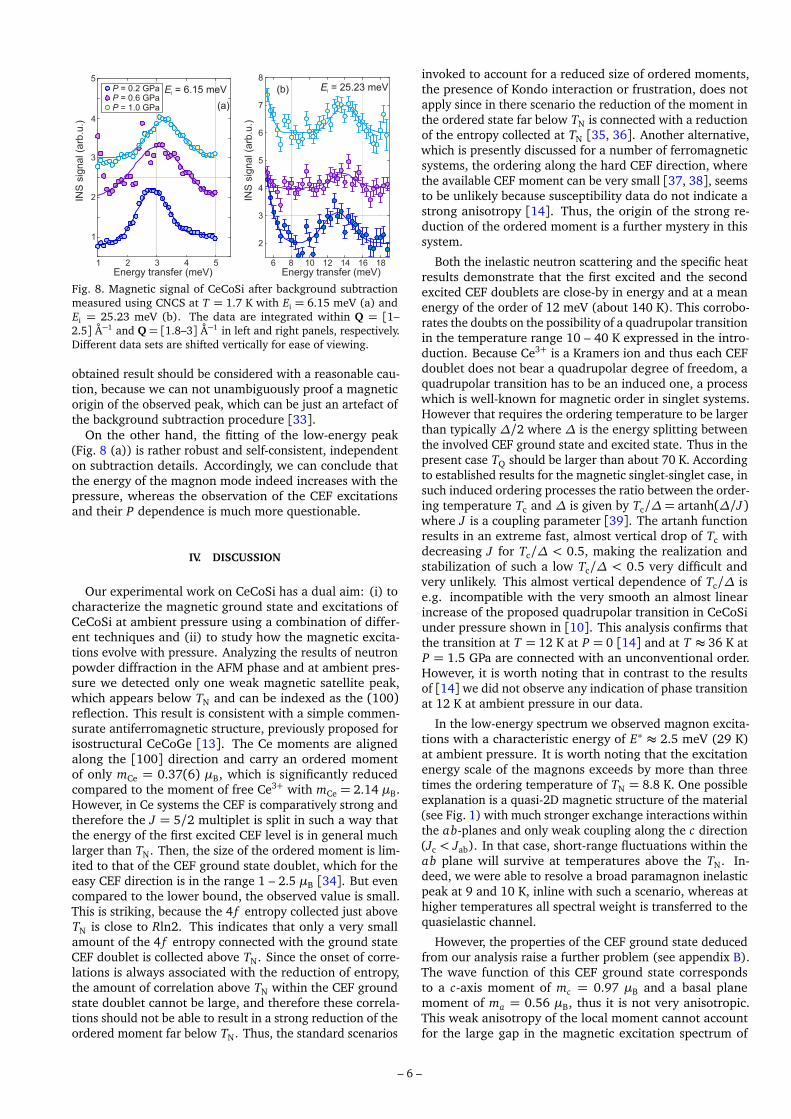
Fig. 8. Magnetic signal of CeCoSi after background subtractionmeasured using CNCS at T = 1.7 K with Ei = 6.15 meV (a) andEi = 25.23 meV (b). The data are integrated within Q = [1–2.5] Å−1 and Q = [1.8–3] Å−1 in left and right panels, respectively.Different data sets are shifted vertically for ease of viewing.
obtained result should be considered with a reasonable cau-tion, because we can not unambiguously proof a magneticorigin of the observed peak, which can be just an artefact ofthe background subtraction procedure [33].
On the other hand, the fitting of the low-energy peak(Fig. 8 (a)) is rather robust and self-consistent, independenton subtraction details. Accordingly, we can conclude thatthe energy of the magnon mode indeed increases with thepressure, whereas the observation of the CEF excitationsand their P dependence is much more questionable.
IV. DISCUSSION
Our experimental work on CeCoSi has a dual aim: (i) tocharacterize the magnetic ground state and excitations ofCeCoSi at ambient pressure using a combination of differ-ent techniques and (ii) to study how the magnetic excita-tions evolve with pressure. Analyzing the results of neutronpowder diffraction in the AFM phase and at ambient pres-sure we detected only one weak magnetic satellite peak,which appears below TN and can be indexed as the (100)reflection. This result is consistent with a simple commen-surate antiferromagnetic structure, previously proposed forisostructural CeCoGe [13]. The Ce moments are alignedalong the [100] direction and carry an ordered momentof only mCe = 0.37(6) µB, which is significantly reducedcompared to the moment of free Ce3+ with mCe = 2.14 µB.However, in Ce systems the CEF is comparatively strong andtherefore the J = 5/2 multiplet is split in such a way thatthe energy of the first excited CEF level is in general muchlarger than TN. Then, the size of the ordered moment is lim-ited to that of the CEF ground state doublet, which for theeasy CEF direction is in the range 1 – 2.5 µB [34]. But evencompared to the lower bound, the observed value is small.This is striking, because the 4 f entropy collected just aboveTN is close to Rln2. This indicates that only a very smallamount of the 4 f entropy connected with the ground stateCEF doublet is collected above TN. Since the onset of corre-lations is always associated with the reduction of entropy,the amount of correlation above TN within the CEF groundstate doublet cannot be large, and therefore these correla-tions should not be able to result in a strong reduction of theordered moment far below TN. Thus, the standard scenarios
invoked to account for a reduced size of ordered moments,the presence of Kondo interaction or frustration, does notapply since in there scenario the reduction of the moment inthe ordered state far below TN is connected with a reductionof the entropy collected at TN [35, 36]. Another alternative,which is presently discussed for a number of ferromagneticsystems, the ordering along the hard CEF direction, wherethe available CEF moment can be very small [37, 38], seemsto be unlikely because susceptibility data do not indicate astrong anisotropy [14]. Thus, the origin of the strong re-duction of the ordered moment is a further mystery in thissystem.
Both the inelastic neutron scattering and the specific heatresults demonstrate that the first excited and the secondexcited CEF doublets are close-by in energy and at a meanenergy of the order of 12 meV (about 140 K). This corrobo-rates the doubts on the possibility of a quadrupolar transitionin the temperature range 10 – 40 K expressed in the intro-duction. Because Ce3+ is a Kramers ion and thus each CEFdoublet does not bear a quadrupolar degree of freedom, aquadrupolar transition has to be an induced one, a processwhich is well-known for magnetic order in singlet systems.However that requires the ordering temperature to be largerthan typically ∆/2 where ∆ is the energy splitting betweenthe involved CEF ground state and excited state. Thus in thepresent case TQ should be larger than about 70 K. Accordingto established results for the magnetic singlet-singlet case, insuch induced ordering processes the ratio between the order-ing temperature Tc and ∆ is given by Tc/∆= artanh(∆/J)where J is a coupling parameter [39]. The artanh functionresults in an extreme fast, almost vertical drop of Tc withdecreasing J for Tc/∆ < 0.5, making the realization andstabilization of such a low Tc/∆ < 0.5 very difficult andvery unlikely. This almost vertical dependence of Tc/∆ ise.g. incompatible with the very smooth an almost linearincrease of the proposed quadrupolar transition in CeCoSiunder pressure shown in [10]. This analysis confirms thatthe transition at T = 12 K at P = 0 [14] and at T ≈ 36 K atP = 1.5 GPa are connected with an unconventional order.However, it is worth noting that in contrast to the resultsof [14] we did not observe any indication of phase transitionat 12 K at ambient pressure in our data.
In the low-energy spectrum we observed magnon excita-tions with a characteristic energy of E∗ ≈ 2.5 meV (29 K)at ambient pressure. It is worth noting that the excitationenergy scale of the magnons exceeds by more than threetimes the ordering temperature of TN = 8.8 K. One possibleexplanation is a quasi-2D magnetic structure of the material(see Fig. 1) with much stronger exchange interactions withinthe ab-planes and only weak coupling along the c direction(Jc < Jab). In that case, short-range fluctuations within theab plane will survive at temperatures above the TN. In-deed, we were able to resolve a broad paramagnon inelasticpeak at 9 and 10 K, inline with such a scenario, whereas athigher temperatures all spectral weight is transferred to thequasielastic channel.
However, the properties of the CEF ground state deducedfrom our analysis raise a further problem (see appendix B).The wave function of this CEF ground state correspondsto a c-axis moment of mc = 0.97 µB and a basal planemoment of ma = 0.56 µB, thus it is not very anisotropic.This weak anisotropy of the local moment cannot accountfor the large gap in the magnetic excitation spectrum of
– 6 –

0 . 0 0 . 5 1 . 0 1 . 5 2 . 0 2 . 50
1
2
3
4
P I O P I I
P I O P I
I N 6 , E i = 3 . 8 6 m e V C N C S , E i = 6 . 1 5 m e V L E T , E i = 6 . 8 m e V
P r e s s u r e ( G P a )
Excita
tion E
nergy
(meV
)
A F M I0
1 0
2 0
3 0
4 0
5 0
Temp
eratur
e (K)
Q C P
Fig. 9. Temperature-Pressure phase diagram of CeCoSi from Ref. [9]and the P-dependence of the magnon mode (solid circles) at T =1.7 K. Shaded areas represent different phases – AFM and twopressure-induced ordered phases (PIOP). Note that the right andleft axis are shown on the same scale E = kBT .
the ordered state deduced from the INS and specific heatresults. Furthermore the very weak anisotropy observed inthe magnetic susceptibility indicates that the anisotropy ofthe magnetic interactions is also weak. Thus this large gapin the magnetic excitations is a further open problem in thisunusual system.
Summarizing the results of the low-energy INS exper-iments under pressure, we found that the energy of themagnon mode gradually evolves from 2.5 meV at ambientpressure to ∼ 4 meV at 1.5 GPa (see Fig. 9). At this pressurethe energy scale of the magnetic excitations is comparableto the transition temperature of the pressure-induced phase(4 meV ≈ 46 K). Note that these results are not in favorof the metaorbital transition scenario, because the last im-plies a sharp, abrupt change of the ordered moment andthe magnon excitation energy as a consequence, which is incontrast to the gradual pressure-induced evolution observedin our measurements.
The pressure dependence of the CEF excitations is lessclear: in the low-pressure (0.2 GPa) CNCS experiment wefound a weak peak, close to the positions of the CEF exci-tations observed at zero-pressure measurements. The peakposition changes only slightly with pressures up to 1 GPa.On the other hand the results of the LET experiment un-ambiguously showed that at 1.5 GPa the CEF levels moveout of their original location. One possible explanation inmuch worse signal-to-noise ratio in the high-energy CNCSmeasurements, which cast some doubts on the CNCS re-sults. However, if one looks at the signature in the resistiv-ity, the high-T ordering is something new which appearsquite abruptly at P ≥ 1.4 GPa, while the observed effectsat lower pressure were different and order of magnitudeweaker. Therefore, P1 = 1.4 GPa was explicitly introduced tohighlight this strong change in [9]. Thus the appearance ofthe strong anomaly in ρ(T ) at P ≥ P1 may be related to thedramatic change of CEF excitations between 1 and 1.5 GPa,indicating that there is a real strong difference between theorderings above and below the P1, as was suggested in [9].A single crystal neutron diffraction under pressure is shouldbe performed to resolve this question and clarify the orderparameter of the PIOP.
V. CONCLUSION
To summarize, we performed a comprehensive experimen-tal investigation of CeCoSi by means of neutron scatteringand specific heat measurements. At ambient pressure Ce-CoSi orders into a simple AFM structure with a surprisinglysmall ordered moment of only mCe = 0.37(6) µB and exhibitsspin excitations on two different energy scales: low-energycollective magnons at ∼ 2.5 meV and two CEF transitionsat ∼ 12 meV. The application of hydrostatic pressure upto 1.5 GPa causes a gradual shift of the magnon band to-wards higher energies and significantly modifies the CEFsplitting scheme at 1.5 GPa. The obtained results are notin favor of the metaorbital scanario [16], which was pro-posed to describe the origin of the pressure-induced phasesin CeCoSi [9].
ACKNOWLEDGMENTS
We acknowledge A. S. Sukhanov for stimulating discus-sions, C. Goodway for help with the high-pressure experi-ments at ISIS Neutron and Muon source and K. A. Nikitinafor assistance with the CEF analysis. This research usedresources at the Spallation Neutron Source, a DOE Office ofScience User Facility operated by Oak Ridge National Labo-ratory. S.E.N. acknowledges support from the InternationalMax Planck Research School for Chemistry and Physics ofQuantum Materials (IMPRS-CPQM). D.G.F and C.G. aknowl-ege support form the German Research Fundation (DFG)through grants GE 602/4-1 and Fermi-NEst.
– 7 –
Appendix A: Raw INS data
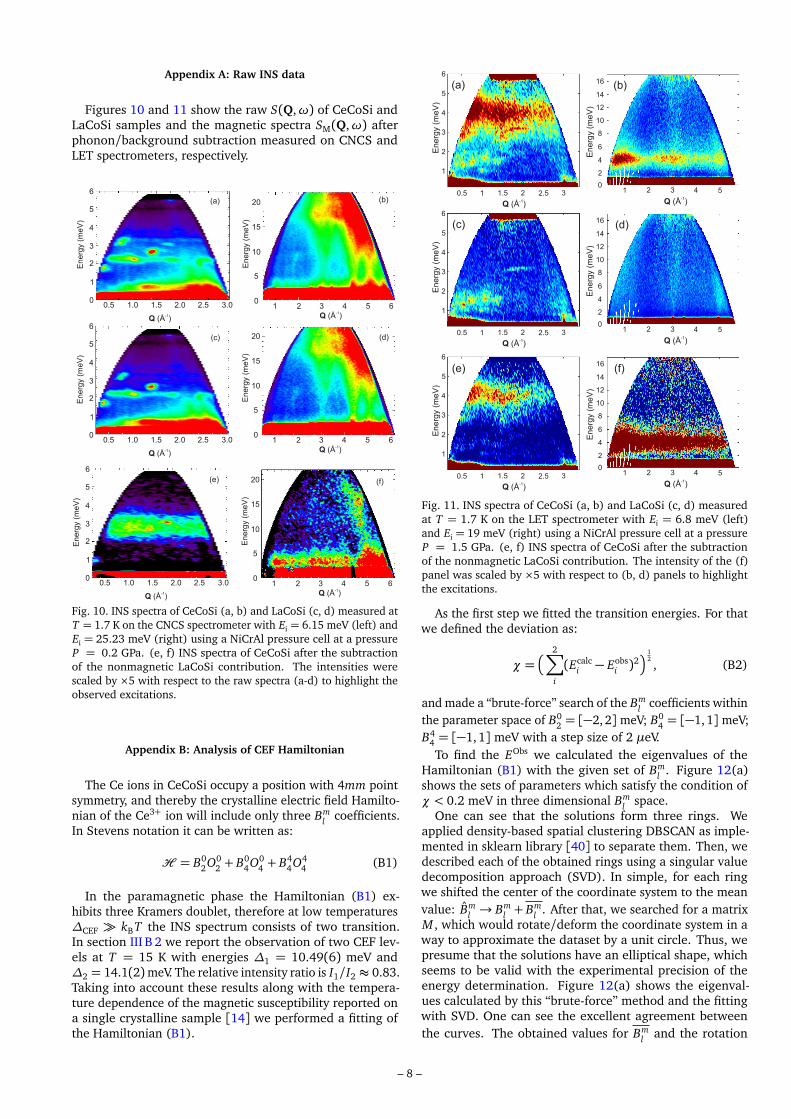
Figures 10 and 11 show the raw S(Q,ω) of CeCoSi andLaCoSi samples and the magnetic spectra SM(Q,ω) afterphonon/background subtraction measured on CNCS andLET spectrometers, respectively.
6
5
4
3
2
1
00.5 1.0 1.5 2.0 2.5 3.0
En
erg
y (
me
V)
-1Q (Å )
6
5
4
3
2
1
00.5 1.0 1.5 2.0 2.5 3.0
En
erg
y (m
eV
)
-1Q (Å )
20
15
10
5
01 2 3 4 5 6
En
erg
y (m
eV
)
-1Q (Å )
20
15
10
5
01 2 3 4 5 6
En
erg
y (m
eV
)
-1Q (Å )
(a) (b)
(c) (d)
6
5
4
3
2
1
00.5 1.0 1.5 2.0 2.5 3.0
En
erg
y (m
eV
)
-1Q (Å )
20
15
10
5
01 2 3 4 5 6
En
erg
y (m
eV
)
-1Q (Å )
(e) (f)
Fig. 10. INS spectra of CeCoSi (a, b) and LaCoSi (c, d) measured atT = 1.7 K on the CNCS spectrometer with Ei = 6.15 meV (left) andEi = 25.23 meV (right) using a NiCrAl pressure cell at a pressureP = 0.2 GPa. (e, f) INS spectra of CeCoSi after the subtractionof the nonmagnetic LaCoSi contribution. The intensities werescaled by ×5 with respect to the raw spectra (a-d) to highlight theobserved excitations.
Appendix B: Analysis of CEF Hamiltonian
The Ce ions in CeCoSi occupy a position with 4mm pointsymmetry, and thereby the crystalline electric field Hamilto-nian of the Ce3+ ion will include only three Bm
l coefficients.In Stevens notation it can be written as:
H = B02O0
2 + B04O0
4 + B44O4
4 (B1)
In the paramagnetic phase the Hamiltonian (B1) ex-hibits three Kramers doublet, therefore at low temperatures∆CEF � kBT the INS spectrum consists of two transition.In section III B 2 we report the observation of two CEF lev-els at T = 15 K with energies ∆1 = 10.49(6) meV and∆2 = 14.1(2)meV. The relative intensity ratio is I1/I2 ≈ 0.83.Taking into account these results along with the tempera-ture dependence of the magnetic susceptibility reported ona single crystalline sample [14] we performed a fitting ofthe Hamiltonian (B1).
6
5
4
3
2
1
0.5 1.5 2.51 32
En
erg
y (
me
V)
-1Q (Å )
(a)
6
5
4
3
2
1
0.5 1.5 2.51 32
En
erg
y (
me
V)
-1Q (Å )
6
5
4
3
2
1
0.5 1.5 2.51 32
En
erg
y (m
eV
)
-1Q (Å )
(c)
16
14
12
10
8
6
4
2
01 2 3 4 5
-1Q (Å )
En
erg
y (
me
V)
16
14
12
10
8
6
4
2
01 2 3 4 5
-1Q (Å )
En
erg
y (
me
V)
16
14
12
10
8
6
4
2
01 2 3 4 5
-1Q (Å )
En
erg
y (
me
V)
(b)
(d)
(e) (f)
Fig. 11. INS spectra of CeCoSi (a, b) and LaCoSi (c, d) measuredat T = 1.7 K on the LET spectrometer with Ei = 6.8 meV (left)and Ei = 19 meV (right) using a NiCrAl pressure cell at a pressureP = 1.5 GPa. (e, f) INS spectra of CeCoSi after the subtractionof the nonmagnetic LaCoSi contribution. The intensity of the (f)panel was scaled by ×5 with respect to (b, d) panels to highlightthe excitations.
As the first step we fitted the transition energies. For thatwe defined the deviation as:
χ =�
2∑
i
(Ecalci − Eobs
i )2�
12, (B2)
and made a “brute-force” search of the Bml coefficients within
the parameter space of B02 = [−2, 2] meV; B0
4 = [−1, 1] meV;B4
4 = [−1,1] meV with a step size of 2 µeV.To find the EObs we calculated the eigenvalues of the
Hamiltonian (B1) with the given set of Bml . Figure 12(a)
shows the sets of parameters which satisfy the condition ofχ < 0.2 meV in three dimensional Bm
l space.One can see that the solutions form three rings. We
applied density-based spatial clustering DBSCAN as imple-mented in sklearn library [40] to separate them. Then, wedescribed each of the obtained rings using a singular valuedecomposition approach (SVD). In simple, for each ringwe shifted the center of the coordinate system to the meanvalue: Bm
l → Bml + Bm
l . After that, we searched for a matrixM , which would rotate/deform the coordinate system in away to approximate the dataset by a unit circle. Thus, wepresume that the solutions have an elliptical shape, whichseems to be valid with the experimental precision of theenergy determination. Figure 12(a) shows the eigenval-ues calculated by this “brute-force” method and the fittingwith SVD. One can see the excellent agreement betweenthe curves. The obtained values for Bm
l and the rotation
– 8 –
0 90 180 270 360Angle from B44, ö (degree)
0
0.5
1
1.5
2
Inte
nsi
ties
ratio
I1/I2
B44
B40
B20
0.2
0.1
0
-0.1
-0.2
-0.04-0.02
00.02
0.040.6
0.40.2
0-0.2
-0.4-0.6
-0.8
(a)
-0.3
-0.2
-0.1
0
0.1
0.2
0.3
B44
Orthogonal direction in B20 - B40 plane
(b)
ö
(c)
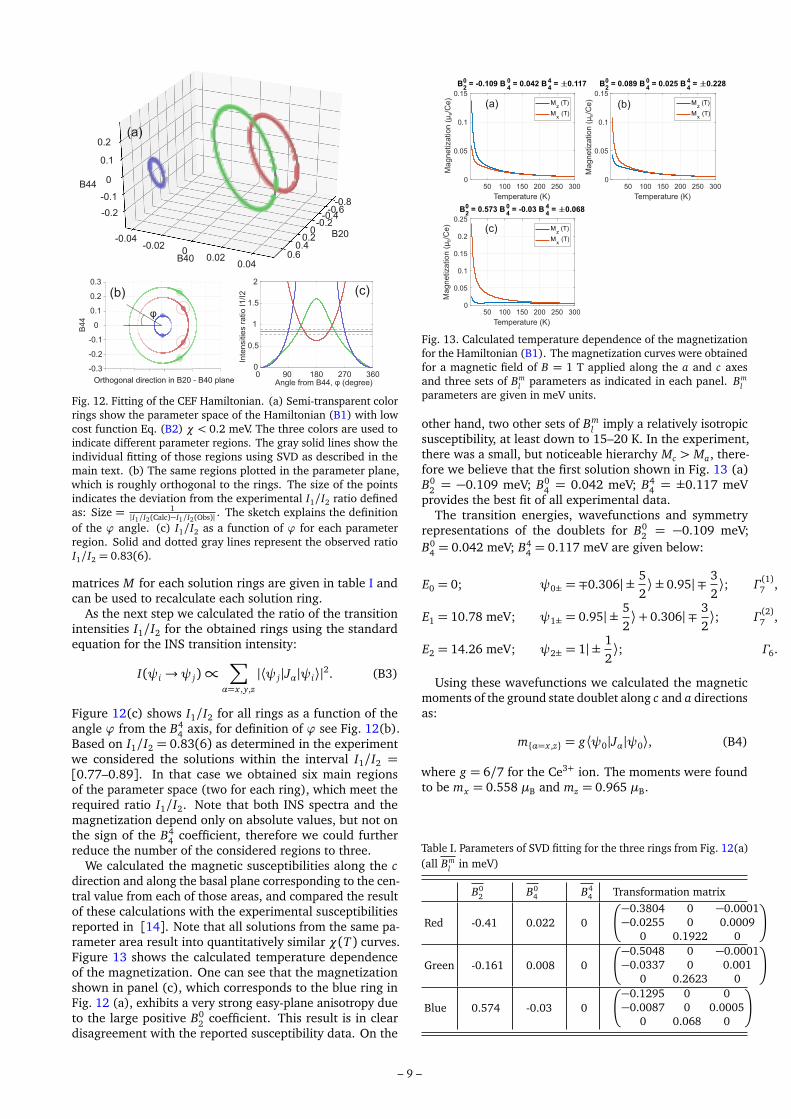
Fig. 12. Fitting of the CEF Hamiltonian. (a) Semi-transparent colorrings show the parameter space of the Hamiltonian (B1) with lowcost function Eq. (B2) χ < 0.2 meV. The three colors are used toindicate different parameter regions. The gray solid lines show theindividual fitting of those regions using SVD as described in themain text. (b) The same regions plotted in the parameter plane,which is roughly orthogonal to the rings. The size of the pointsindicates the deviation from the experimental I1/I2 ratio definedas: Size = 1
|I1/I2(Calc)−I1/I2(Obs)| . The sketch explains the definitionof the ϕ angle. (c) I1/I2 as a function of ϕ for each parameterregion. Solid and dotted gray lines represent the observed ratioI1/I2 = 0.83(6).
matrices M for each solution rings are given in table I andcan be used to recalculate each solution ring.
As the next step we calculated the ratio of the transitionintensities I1/I2 for the obtained rings using the standardequation for the INS transition intensity:
I(ψi →ψ j)∝∑
α=x ,y,z
|⟨ψ j |Jα|ψi⟩|2. (B3)
Figure 12(c) shows I1/I2 for all rings as a function of theangle ϕ from the B4
4 axis, for definition of ϕ see Fig. 12(b).Based on I1/I2 = 0.83(6) as determined in the experimentwe considered the solutions within the interval I1/I2 =[0.77–0.89]. In that case we obtained six main regionsof the parameter space (two for each ring), which meet therequired ratio I1/I2. Note that both INS spectra and themagnetization depend only on absolute values, but not onthe sign of the B4
4 coefficient, therefore we could furtherreduce the number of the considered regions to three.
We calculated the magnetic susceptibilities along the cdirection and along the basal plane corresponding to the cen-tral value from each of those areas, and compared the resultof these calculations with the experimental susceptibilitiesreported in [14]. Note that all solutions from the same pa-rameter area result into quantitatively similar χ(T ) curves.Figure 13 shows the calculated temperature dependenceof the magnetization. One can see that the magnetizationshown in panel (c), which corresponds to the blue ring inFig. 12 (a), exhibits a very strong easy-plane anisotropy dueto the large positive B0
2 coefficient. This result is in cleardisagreement with the reported susceptibility data. On the
50 100 150 200 250 300
Temperature (K)
0
0.05
0.1
0.15
B20 = -0.109 B
40 = 0.042 B
44 = 0.117
Mz (T)
Mx (T)
50 100 150 200 250 300
Temperature (K)
0
0.05
0.1
0.15
Magnetiza
tion (
ì/C
e)
B
B20 = 0.089 B
40 = 0.025 B
44 = 0.228
Mz (T)
Mx (T)
50 100 150 200 250 300
Temperature (K)
0
0.05
0.1
0.15
0.2
0.25
B20 = 0.573 B
40 = -0.03 B
44 = 0.068
Mz (T)
Mx (T)
Magnetization (
ì/C
e)
BM
agnetiz
atio
n (
ì/C
e)
B
(a)
(c)
(b)
Fig. 13. Calculated temperature dependence of the magnetizationfor the Hamiltonian (B1). The magnetization curves were obtainedfor a magnetic field of B = 1 T applied along the a and c axesand three sets of Bm
l parameters as indicated in each panel. Bml
parameters are given in meV units.
other hand, two other sets of Bml imply a relatively isotropic
susceptibility, at least down to 15–20 K. In the experiment,there was a small, but noticeable hierarchy Mc > Ma, there-fore we believe that the first solution shown in Fig. 13 (a)B0
2 = −0.109 meV; B04 = 0.042 meV; B4
4 = ±0.117 meVprovides the best fit of all experimental data.
The transition energies, wavefunctions and symmetryrepresentations of the doublets for B0
2 = −0.109 meV;B0
4 = 0.042 meV; B44 = 0.117 meV are given below:
E0 = 0; ψ0± = ∓0.306| ±52⟩ ± 0.95| ∓
32⟩; Γ
(1)7 ,
E1 = 10.78 meV; ψ1± = 0.95| ±52⟩+ 0.306| ∓
32⟩; Γ
(2)7 ,
E2 = 14.26 meV; ψ2± = 1| ±12⟩; Γ6.
Using these wavefunctions we calculated the magneticmoments of the ground state doublet along c and a directionsas:
m{α=x ,z} = g⟨ψ0|Jα|ψ0⟩, (B4)
where g = 6/7 for the Ce3+ ion. The moments were foundto be mx = 0.558 µB and mz = 0.965 µB.
Table I. Parameters of SVD fitting for the three rings from Fig. 12(a)(all Bm
l in meV)
B02 B0
4 B44 Transformation matrix
Red -0.41 0.022 0
−0.3804 0 −0.0001−0.0255 0 0.0009
0 0.1922 0
!
Green -0.161 0.008 0
−0.5048 0 −0.0001−0.0337 0 0.001
0 0.2623 0
!
Blue 0.574 -0.03 0
−0.1295 0 0−0.0087 0 0.0005
0 0.068 0
!
– 9 –
[1] O. Stockert and F. Steglich, “Unconventional quantum crit-icality in heavy-fermion compounds,” Annu. Rev. Condens.Matter Phys. 2, 79–99 (2011).
[2] P. Gegenwart, Q. Si, and F. Steglich, “Quantum criticality inheavy-fermion metals,” Nature Phys. 4, 186–197 (2008).
[3] Q. Si and F. Steglich, “Heavy fermions and quantum phasetransitions,” Science 329, 1161–1166 (2010).
[4] O. Stockert, J. Arndt, E. Faulhaber, C. Geibel, H. S. Jeevan,S. Kirchner, M. Loewenhaupt, K. Schmalzl, W. Schmidt, Q. Si,and F. Steglich, “Magnetically driven superconductivity inCeCu2Si2,” Nature Phys. 7, 119–124 (2011).
[5] Y. Kitaoka, H. Tou, G. q. Zheng, K. Ishida, K. Asayama, T. C.Kobayashi, A. Kohda, N. Takeshita, K. Amaya, Y. Onuki,C. Geibel, C Schank, and F. Steglich, “NMR study of stronglycorrelated electron systems,” Physica B 206, 55–61 (1995).
[6] E. Lengyel, M. Nicklas, H. S. Jeevan, C. Geibel, andF F. Steglich, “Pressure tuning of the interplay of magnetismand superconductivity in CeCu2Si2,” Phys. Rev. Lett. 107,057001 (2011).
[7] P. Coleman, “Heavy fermions and the Kondo lattice: a 21stcentury perspective,” arXiv:1509.05769 (2015).
[8] Bin Shen, Yongjun Zhang, Yashar Komijani, Michael Nicklas,Robert Borth, An Wang, Ye Chen, Zhiyong Nie, Rui Li, XinLu, Hanoh Lee, Michael Smidman, Frank Steglich, Piers Cole-man, and Huiqiu Yuan, “Strange-metal behaviour in a pureferromagnetic Kondo lattice,” Nature 579, 51–55 (2020).
[9] E. Lengyel, M. Nicklas, N. Caroca-Canales, and C. Geibel,“Temperature-pressure phase diagram of CeCoSi: Pressure-induced high-temperature phase,” Phys. Rev. B 88, 155137(2013).
[10] H. Tanida, Y. Muro, and T. Matsumura, “La Substitution andPressure Studies on CeCoSi: A Possible AntiferroquadrupolarOrdering Induced by Pressure,” J. Phys. Soc. Jpn. 87, 023705(2018).
[11] B. Chevalier and S. F. Matar, “Effect of H insertion on themagnetic, electronic, and structural properties of CeCoSi,”Phys. Rev. B 70, 174408 (2004).
[12] B. Chevalier, S. F. Matar, J. S. Marcos, and J. R. Fernandez,“From antiferromagnetic ordering to spin fluctuation behaviorinduced by hydrogenation of ternary compounds CeCoSi andCeCoGe,” Physica B 378, 795–796 (2006).
[13] B. Chevalier and B. Malaman, “Reinvestigation of the elec-trical and magnetic properties of the ternary germanideCeCoGe,” Solid State Commun. 130, 711–715 (2004).
[14] H. Tanida, K. Mitsumoto, Y. Muro, T. Fukuhara, Y. Kawamura,A. Kondo, K. Kindo, Y. Matsumoto, T. Namiki, T. Kuwai, andT. Matsumura, “Successive Phase Transition at Ambient Pres-sure in CeCoSi: Single Crystal Studies,” J. Phys. Soc. Jpn. 88,054716 (2019).
[15] H. Tou M. Manago, H. Kotegawa and H. Tanida, “NMR ev-idence of a non-magnetic phase transition in CeCoSi,” J-Physics Annual Meeting FY2019 , P05 (2019).
[16] K. Hattori, “Meta-orbital transition in heavy-fermion systems:Analysis by dynamical mean field theory and self-consistentrenormalization theory of orbital fluctuations,” J. Phys. Soc.Jpn. 79, 114717 (2010).
[17] L. V. Pourovskii, P. Hansmann, M. Ferrero, and A. Georges,“Theoretical prediction and spectroscopic fingerprints of anorbital transition in CeCu2Si2,” Phys. Rev. Lett. 112, 106407(2014).
[18] R. I. Bewley, J. W. Taylor, and S. M. Bennington, “LET, acold neutron multi-disk chopper spectrometer at ISIS,” Nucl.Instrum. Methods Phys. Res. 637, 128–134 (2011).
[19] G. Ehlers, A. Podlesnyak, J. L. Niedziela, E. B. Iverson, andP. E. Sokol, “The new cold neutron chopper spectrometer atthe Spallation Neutron Source: design and performance,” Rev.Sci. Instrum. 82, 085108 (2011).
[20] G. Ehlers, A. Podlesnyak, and A. I. Kolesnikov, “The cold neu-tron chopper spectrometer at the Spallation Neutron Source -A review of the first 8 years of operation,” Rev. Sci. Instrum.87, 093902 (2016).
[21] R. A. Forman and G. J. Piermarini and J. D. Barnett and S.Block, “Pressure measurement made by the utilization of rubysharp-line luminescence,” Science 176, 284–285 (1972).
[22] A. Podlesnyak, M. Loguillo, G. M. Rucker, B. Haberl,R. Boehler, G. Ehlers, L. L. Daemen, D. Armitage, M. D.Frontzek, and M. Lumsden, “Clamp cell with in situ pressuremonitoring for low-temperature neutron scattering measure-ments,” High Pressure Res. 38, 482–492 (2018).
[23] Using of Ei > 19 meV could provide better energy range forstudying the CEF excitations, but would strongly decreasethe neutron flux on the sample.
[24] V. Petrícek, M. Dušek, and L. Palatinus, “Crystallographic com-puting system JANA2006: general features,” Z. Kristallogr.Cryst. Mater. 229, 345–352 (2014).
[25] R. T. Azuah, L. R. Kneller, Y. Qiu, P. L. W. Tregenna-Piggott,C. M. Brown, J. R. D. Copley, and R. M. Dimeo, “DAVE: acomprehensive software suite for the reduction, visualization,and analysis of low energy neutron spectroscopic data,” J.Res. Natl. Inst. Stan. Technol. 114, 341 (2009).
[26] O. Arnold, J. C. Bilheux, J. M. Borreguero, A. Buts, S. I. Camp-bell, L. Chapon, M. Doucet, N. Draper, R. Ferraz Leal, M. A.Gigg, V. E. Lynch, A. Markvardsen, D. J. Mikkelson, R. L.Mikkelson, R. Miller, K. Palmen, P. Parker, G. Passos, T. G.Perring, P. F. Peterson, S. Ren, M. A. Reuter, A. T. Savici, J. W.Taylor, R. J. Taylor, R. Tolchenov, W. Zhou, and J. Zikovsky,“Mantid – Data analysis and visualization package for neutronscattering and µSR experiments,” Nucl. Instrum. MethodsPhys. Res. Sect. A 764, 156 (2014).
[27] D. Richard, M. Ferrand, and G. J. Kearley, “Analysis andvisualisation of neutron-scattering data,” J. Neutron Res. 4,33–39 (1996).
[28] We also measured spectra with higher Ei = 67.6 meV, but noadditional magnetic excitations were observed in the spectra.
[29] We also tried a classical approach proposed by A. P. Muranifor CeSn3 [41], and the results are essentially identical.
[30] Petr Cermák, Astrid Schneidewind, Benqiong Liu,Michael Marek Koza, Christian Franz, Rudolf Schönmann,Oleg Sobolev, and Christian Pfleiderer, “Magnetoelastichybrid excitations in CeAuAl3,” Proc. Natl. Acad. Sci. 116,6695–6700 (2019).
[31] M. A. Continentino, S. N. de Medeiros, M. T. D. Orlando, M. B.Fontes, and E. M. Baggio-Saitovitch, “Anisotropic quantumcritical behavior in CeCoGe3−x Six ,” Phys. Rev. B 64, 012404(2001).
[32] Note that the signal at 0.6 GPa was measured during a sep-arate beamtime with slightly different setup, which did notallowed us to subtract the background precisely. This problemcauses sharp features in Fig. 8(a) and is responsible for thelower intensity of 0.6 GPa signal shown in the Fig. 8(b).
[33] Investigation of the form-factor of the excitation is not possi-ble due to the cell phonon scattering at high Q above ∼3 Å−1.
[34] G. Fischer and A. Herr, “Mean magnetic moments of polycrys-talline Ce compounds in a tetragonal crystal field,” Phys. Stat.Sol. (B) 159, K23–K26 (1990).
[35] M. J. Besnus, A. Braghta, N. Hamdaoui, and A. Meyer, “Acorrelation between specific heat and the ratio TK/TN in mag-netic Kondo lattices,” J. Mag. Mag. Mat. 104, 1385–1386(1992).
[36] C. D. Bredl, F. Steglich, and K. D. Schotte, “Specific heatof concentrated kondo systems: (La,Ce)Al2 and CeAl2,” Z.Physik B 29, 327–340 (1978).
[37] F. Krüger, C. J. Pedder, and A. G. Green, “Fluctuation-drivenmagnetic hard-axis ordering in metallic ferromagnets,” Phys.
– 10 –

Rev. Lett. 113, 147001 (2014).[38] D. Hafner, B. K. Rai, J. Banda, K. Kliemt, C. Krellner,
J. Sichelschmidt, E. Morosan, C. Geibel, and M. Brando,“Kondo-lattice ferromagnets and their peculiar order alongthe magnetically hard axis determined by the crystalline elec-tric field,” Phys. Rev. B 99, 201109 (2019).
[39] B. R. Cooper, “Magnetic properties of rare earth metals,”(Springer, Boston, 1972) pp. 17–80.
[40] F. Pedregosa, G. Varoquaux, A. Gramfort, V. Michel, B. Thirion,O. Grisel, M. Blondel, P. Prettenhofer, R. Weiss, V. Dubourg,J. Vanderplas, A. Passos, D. Cournapeau, M. Brucher, M. Per-rot, and E. Duchesnay, “Scikit-learn: Machine learning inPython,” J. Mach. Learn. Res. 12, 2825–2830 (2011).
[41] A. P. Murani, “Magnetic spectral response in the intermetalliccompound CeSn3,” Phys. Rev. B 28, 2308 (1983).
– 11 –