gradients of household and parental contextual …
TRANSCRIPT
GRADIENTS OF HOUSEHOLD AND PARENTAL CONTEXTUAL FACTORS ON
EDUCATION AND HEALTH OF CHILDREN IN NORTHEAST INDIA
Introduction
Education is the formative process of acquiring knowledge, skills and set of values in the
life course. Education is the key to a person’s success in all walks of life, not only good
education raise standard of living of an individual but also contributes in social and
economic development. Education empowers people and improves their ability to
communicate, argue, and choose in informed ways (Sen, 1999). Economist valued
education for its role in human resource development which increases labour productivity
leading to a higher equilibrium level of output (Lucas 1988, Self and Grabowski 2008,
Mallick et al. 2016). On the other hand social scientist considered education is important
for the catalytic role it plays in diffusion of knowledge, transformation of society and
enhancement in awareness of rights of individuals (Agarwal and Sashi 2014, Bhat 2015,
Vaid 2016). It is therefore imperative on both counts to assess the significance of
household and parental factors moulding educational attainment of children more
particularly in the context of northeast (NE) India one of the most underdeveloped regions
of the country and also characterized by poor infrastructure and inadequate educational
institutions.
Review of Literature
Considerable literature (Evangelista de CarvalhoFilho, 2008; Mingat, 2007; Shavit and
Blossfeld, 1993; Jencks, 1972; Coleman et al., 1966) highlighted the importance of
household characteristics, in particular parental income, wealth, education and occupation,
in determining educational enrolment and achievement in both developing and developed
countries. Berhman (1997) and Korupp et al. (2002) supports transmission of parental
traits to children. Evidence of children of parents from high socio-economic status having
better academic performance than those from poor socio-economic status is found in
Suleman et al. (2012). On the other hand Saifi and Mehmood (2011) highlighted the
conductive influence of parental education and occupation on academic performance of
children. Becker et al. (1990) hypothesized that maternal education can improve efficiency
of human capital production leading to increasing returns, across generations, in parental
human capital. Coleman (1988) detailed the ways that the economic, cultural, and social
capital of the family plays a crucial role in shaping the arc of children’s educational
attainment in the United States.
Duraisamy (2002) concluded analysing the National Council of Applied Economic
Research (NCAER) data, that parental education, family 6 income, and availability of
middle schools within the village have a significant positive effect on child school
enrolment decisions in India. From a study of 70000 children in India from National Family
Health Survey-2 (IIPS,1998-99) Huisman et al. (2010) found that 70 percent of variation
in school enrolment is explain by factors at the household level. Using data from NSSO,
55th and 61st round (1999–2000 and 2004–05) for urban children, Mukherjee and Das
(2008) have found that parents’ higher level of education retard school drop out of children
during 1999-2005. Kumar and Vellymalay (2011) based on a study of Indians in Malaysia
reported that educated parents have higher educational aspiration for their children.
Borkotoky et al. (2015) investigated intergenerational transmission of education using
District Level Household & Facility Survey-3 (IIPS, 2007-08) unearth that maternal
educational attainment is indirectly instrumental in promotion of child schooling
particularly of girl child by way of having fewer children and avoiding discrimination in
allocation of household resources by sex of children. Ngangbam and Ladusingh (2013)
also corroborated the finding in the case of NE India. Azam and Bhatt (2012) matched
father and son’s education using India Human Development Survey I (NCEAR, 2004-05)
and have found significant improvements in educational mobility across generations in
India, at the aggregate level, across social groups. Large family size also a barrier
educational attainment of children as study by Kugler and Kumar (2015) have found from
the empirical analysis of DLHS-3 (IIPS, 2007-08). Lawrence and Vimala (2012) based on
a primary study in South India found significant relationship between better school
environment and academic achievement of children. Singh (2013) reported based on a
study in Andhra Pradesh that students from privately manage schools perform better in test
score than those in government schools. In 1995-96, the average expenditure per student
pursuing primary education in rural India in a government school was Rs. 219, for students
going to local body schools, private aided schools and private unaided schools were
respectively Rs. 223, Rs. 622 and Rs. 911 respectively (National Sample Survey
Organization, 1998). Tilak (2002) complemented that households across socio-economic
class spend considerably for primary education which is expected to be provided by the
State free to all. Singha (2013) brings out status of education in conflict setting and found
that the conflict does not affect educational growth.
Rationale of the study
The foregoing review emphasises the significance of household wealth, number of children
in the household, parental education, sex of the child and school environment on children’s
educational attainment. However it is noted that studies are sporadic, the aforesaid
highlights of factors determining school attainment of children emerges from different

studies and not a single study mentioned above has collectively considered them in a
pragmatic manner. The available literate lacks regional coverage and has not completely
answer many questions, such as, whether school attainment of children in all regions of
India is uniform? Whether household, parental and school factors have uniform
significance across regions? In the absence of authentic answers to these questions it is
unrealistic to draw regional specific intervention strategies for enhancement of school
attainment of children it is important to undertake regional studies. In this context the
present paper makes an attempt to assess determinants of educational attainment of
children in northeast (NE) India and provide key policy inputs pertinent for this region.
The papers is organize as follows: begins with a brief display and description of socio-
demographic and institutional indicators of northeast India, followed by a section on data
and methods, then the results section and ends with a section on summary and conclusion.
Profile of Northeast India
The northeast India is the abode of many indigenous people and is best known for its
heartwarming topography and rich cultural heritage. The region however has poor
infrastructure, limited health and educational facilities and has no industrial and corporate
establishments. The region is also deprived of the share of pie of economic growth of the
country and still remains economically underdeveloped. However under the ‘Look East’
policy endorsed by the mass and politicians alike can provide a takeoff from the present
status as far as education is concerned.
The socio-economic, demographic and institutional indicators of states in northeast (NE)
India are shown in table 1. Among the eight states as on 2011, Arunachal Pradesh has the
largest area but is sparsely populated with population density of just 17 per square

kilometer and Assam is the most populous and most densely populated state with a
population of 31.21 million and density of 398 persons per square kilometer. The eight
states in NE India accounts for 3.8 percent of the population of the country as per Census
of India 2011. Literacy rate in NE is among the highest in the country ranging from 91.3
percent in Mizoram and 65.4 percent in Arunachal Pradesh the state where the gross
enrolment ratio is 95.2 percent almost at par with that of Mizoram. When it comes to gross
enrolment ratio at primary level (for 6-13 years) it is reasonably high in the states of
Sikkim, Arunachal Pradesh, Manipur, Meghalaya, Mizoram, and Tripura all above 94
percent and the lowest is 75.7 percent in Assam.
Table 1: Socio-demographic and institutional indicators of states in northeast India
Arunachal
Pradesh Assam Manipur Meghalaya Mizoram Nagaland Sikkim Tripura
Land Area (sq.km.)1 83743 78438 22327 22429 21081 16579 7096 10486
Total population in
million 1 1.38 31.21 2.57 2.97 1.1 1.98 0.61 3.67
Population size - % of
national population 1 0.1 2.6 0.2 0.2 0.1 0.2 0.1 0.3
Population density
(per sq. km.)1 17 398 115 132 52 119 86 350
Literacy rate(%)1 65.4 72.2 79.2 74.4 91.3 79.6 81.4 87.2
Gross enrolment ratio
(%) (GER)2 115.3 75.7 114.9 114.0 110.9 79.7 118.6 110.5
Dropout rate(%)2 50.0 50.2 53.7 68.0 39.6 47.7 48.8 42.4
Pupil teacher ratio
(PTR) (primary
school)2 25 28 25 32 14 20 7 15
Accessibility to
school(%)3 41.0 20.0 36.4 40.4 77.4 60.2 53.3 33.1
Unemployment rate
per1000(15+Populatio
n)4 102 43 22 35 22 62 122 84
Sources: 1 - Census of India, 2011, 2- Statistics of School Education 2011‐12, Ministry of Human
Resource Development, 3- Indian Stat (2009), 4- Third annual employment & unemployment
survey 2012-13, Labour Bureau, Chandigarh, Ministry of Labour& Employment
The concerned is that dropout rate at primary level in NE region is among with the highest
rate of 68 percent in Meghalaya and the lowest being 39.6 percent in Mizoram. There is

also considerable variation in adequacy of teachers as can be noted that in Meghalaya pupil-
teacherratio is as high as 32 pupils per teacher and the lowest is 7 pupils per teacher in
Sikkim.Accessibility to educational institution and when assessing availability of
government primary school within habitations it is found that 20 percent of habitations in
Assam have primary school the most pathetic condition among all states in NE region while
in Mizoram primary schools are available within 77.4 percent of habitations. In NE India,
Meghalaya, Tripura and Manipur are the states which have less number of schools within
a habitation. One of the factors of underdevelopment of the region is high unemployment
rate and it is 122 per 1000 in Sikkim the highestof all the eight states in NE Indiafollowed
by 102 in Arunachal Pradesh, 84 in Tripura and the lowest being 22 per 1000 both in
Manipur and Mizoram. In summary there is considerable in socio-demographic and
institutional indicators between states in NE India which have direct or indirect
implications on educational attainment of children in the region.
Data and Methods
Data
The unit level data from two rounds of India Human Development Survey-I (2004-05) and
India Human Development Survey-II (2011-12) are being used for this study. The
University of Maryland and the National Council of Applied Economic Research
(NCAER, India) carried out both rounds of the surveys and data collected are
representative at states, union territories and national. Similar survey design and
instruments were used in the two rounds of IHDS were similar and comparable in most
cases. The unit of analysis for this study ischildren in5-17 years and is based on tracing
1340 children in 2004-04 (IHDS-I)yielding 1035 children in 2011-12(IHDS-II). The
information collected includes basic amenities, assets, income with source, and
demographic particulars of members at household level and age, sex, educational and
marital status and relationship with the head of household at individual.
There are three distinct advantages of using the IHDS data, first it contains additional
questions which are not asked in the NSS or NFHS, second, the IHDS contain data on
actual years of schooling rather than levelsof schooling completed which is generally
reported in NSS data and third, it provides provision to follow the educational progress of
children.
Methods
The objective of this study is to measure the association between household’s economic
wellbeing, parental education, caste (social groups) and child education outcome, how this
association has evolved over time, and whether it improves over time with parental
education, whether it is stronger amongst certain groups identified by castes or geographic
location.As the emphasis is on assessment of the effect of time varying factors on child
schooling outcome which is years of schooling of children in 5-17 years fixed effect panel
regression is used for statistical analysis. The model specification is
𝑌𝑖𝑡 = 𝛽𝑋𝑖𝑡 + 𝛾𝑧𝑖 + 𝛼𝑖 + 𝜇𝑖𝑡
where,
- 𝑌𝑖𝑡 is the years of schooling of children, i = entity and t = time.
- 𝑋𝑖𝑡is vector of time varying independent variables and β is vector of coefficients
- 𝑧𝑖 is vector of time invariant independent variables and γ is vector of coefficients
- 𝛼𝑖 𝑎𝑛𝑑 𝜇𝑖𝑡 are the error terms
Description of independent and dependent variables
In order to assess potential determinants of schooling outcome of children 5-17 years in
northeast Indi, years of schooling is consider as schooling outcome of children and on the
basis of foregoing literature review childrenbackground consider as independent variables
are place of residence,age,sex,household monthly per capita expenditure (MPCE)
quintiles, caste of head of household, father’seducation, mother’seducation, schooltype,
school fees and number of children in the household.Age of child categorized as 5-10, 11-
15, 14-15 and 16-17 years. Father’s education is classified as none, primary school, lower
secondary and higher secondary. Mother education is classified as illiterate and literate.
Sex classified as male and female. Place of residence classified as urban and rural. Caste
is a sort of social status and those who are from lower castes socio-economically weaker
and they have limited access to institutional facilities despite provisions. Scheduled castes
(SC) and scheduled tribes (SC) are considered to belong to lower social groups. Other
backward castes (OBC) similarly are another group of lower castes. Individuals inherit
social status from father and for generations it is not change unlike economic conditions.
Caste of household head is categorized as OBC, SC/ST and Others. Monthly per capital
expenditure (MPCE) of household is classified as first quintile, second quintile, third
quintile, fourth quintile and fifth quintile. Traditionally family system in India is joint
family where children live with their parents and other relatives including grandparents
and even uncles and aunts. Family type is categorized as joint family and nuclear family.
On the basis of functional body schools are recognized as public schools run by the
government and private manage by individuals and private organizations. School type is
classified as public school and private schools.
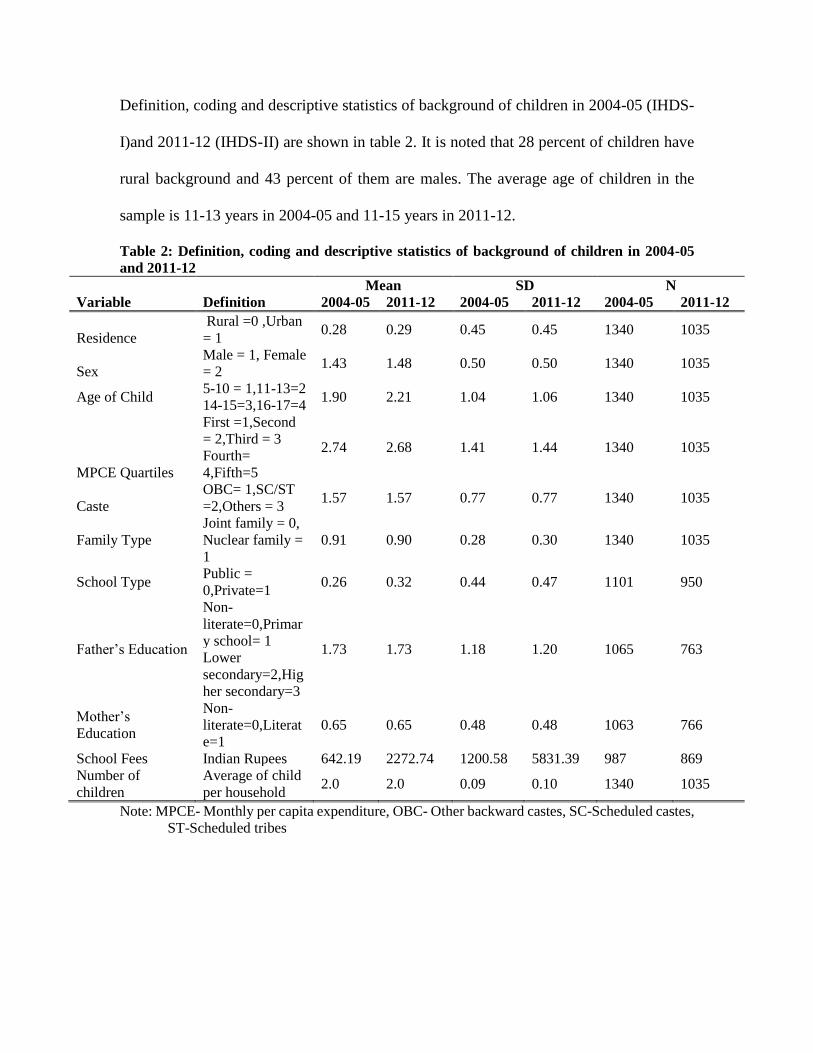
Definition, coding and descriptive statistics of background of children in 2004-05 (IHDS-
I)and 2011-12 (IHDS-II) are shown in table 2. It is noted that 28 percent of children have
rural background and 43 percent of them are males. The average age of children in the
sample is 11-13 years in 2004-05 and 11-15 years in 2011-12.
Table 2: Definition, coding and descriptive statistics of background of children in 2004-05
and 2011-12
Mean SD N
Variable Definition 2004-05 2011-12 2004-05 2011-12 2004-05 2011-12
Residence
Rural =0 ,Urban
= 1 0.28 0.29 0.45 0.45 1340 1035
Sex
Male = 1, Female
= 2 1.43 1.48 0.50 0.50 1340 1035
Age of Child 5-10 = 1,11-13=2
1.90 2.21 1.04 1.06 1340 1035 14-15=3,16-17=4
MPCE Quartiles
First =1,Second
= 2,Third = 3 2.74 2.68 1.41 1.44 1340 1035
Fourth=
4,Fifth=5
Caste
OBC= 1,SC/ST
=2,Others = 3 1.57 1.57 0.77 0.77 1340 1035
Family Type
Joint family = 0,
Nuclear family =
1
0.91 0.90 0.28 0.30 1340 1035
School Type Public =
0,Private=1 0.26 0.32 0.44 0.47 1101 950
Father’s Education
Non-
literate=0,Primar
y school= 1 1.73 1.73 1.18 1.20 1065 763
Lower
secondary=2,Hig
her secondary=3
Mother’s
Education
Non-
literate=0,Literat
e=1
0.65 0.65 0.48 0.48 1063 766
School Fees Indian Rupees 642.19 2272.74 1200.58 5831.39 987 869
Number of
children
Average of child
per household 2.0 2.0 0.09 0.10 1340 1035
Note: MPCE- Monthly per capita expenditure, OBC- Other backward castes, SC-Scheduled castes,
ST-Scheduled tribes
Household monthly per capita expenditure (MPCE) has been taken as proxy measure of
economic wellbeing and children belongs to households moderately economically well off
households and has not change significantly during 2004-2012. Children in 5-17 years in
the present study largely belong to ST/SC and OBC. About91 percent of children live in
the joint family. It can be noted that only 26 percent of children attend private schools in
2004-05 which increases to 32 percent in 2011-12. Considering husband and wife
education gap in India, educational level of father has been classified no education,
primary, lower secondary and upper secondary levels. On the other hand educational status
of mother is categorized as non-literate and literate. Educational level of father are mostly
completed primary school and 65 percent are of mother are literate. Annual educational fee
spent by the household for schooling increases more than threefold during 2004-2012 from
Rs. 624 to Rs. 2272. The number of schooling going children in 5-17 years per household
is found to be 2 during 2004-2012.
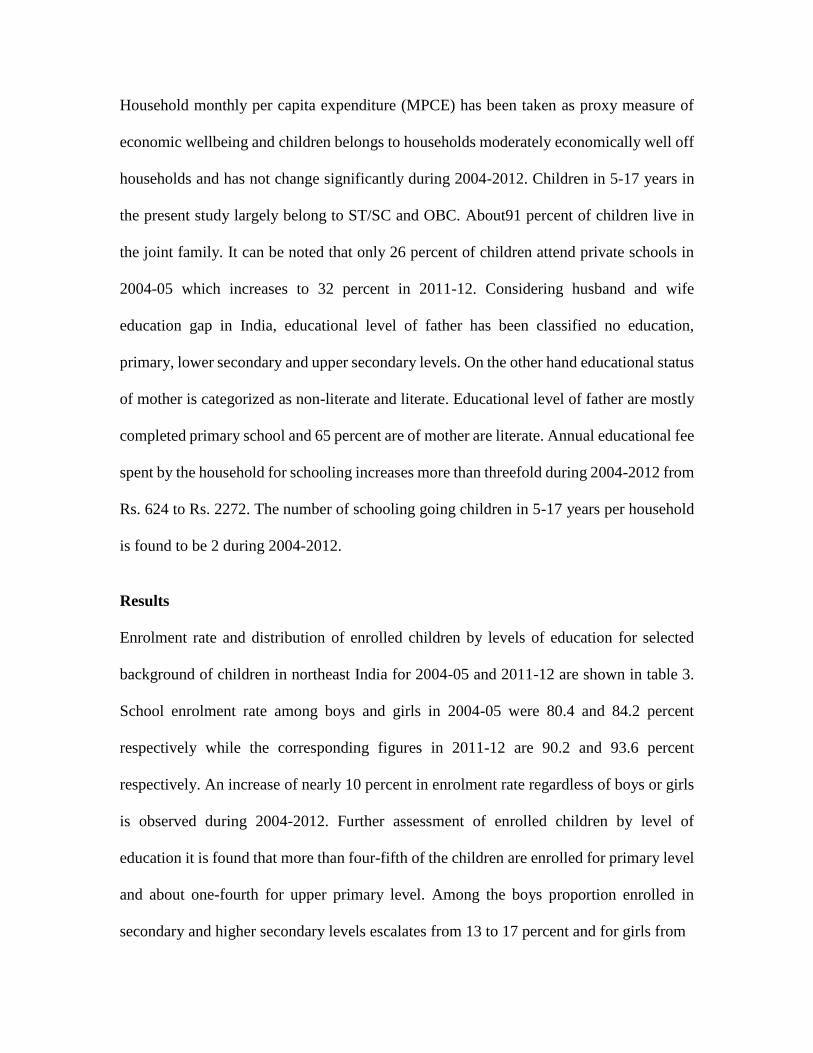
Results
Enrolment rate and distribution of enrolled children by levels of education for selected
background of children in northeast India for 2004-05 and 2011-12 are shown in table 3.
School enrolment rate among boys and girls in 2004-05 were 80.4 and 84.2 percent
respectively while the corresponding figures in 2011-12 are 90.2 and 93.6 percent
respectively. An increase of nearly 10 percent in enrolment rate regardless of boys or girls
is observed during 2004-2012. Further assessment of enrolled children by level of
education it is found that more than four-fifth of the children are enrolled for primary level
and about one-fourth for upper primary level. Among the boys proportion enrolled in
secondary and higher secondary levels escalates from 13 to 17 percent and for girls from
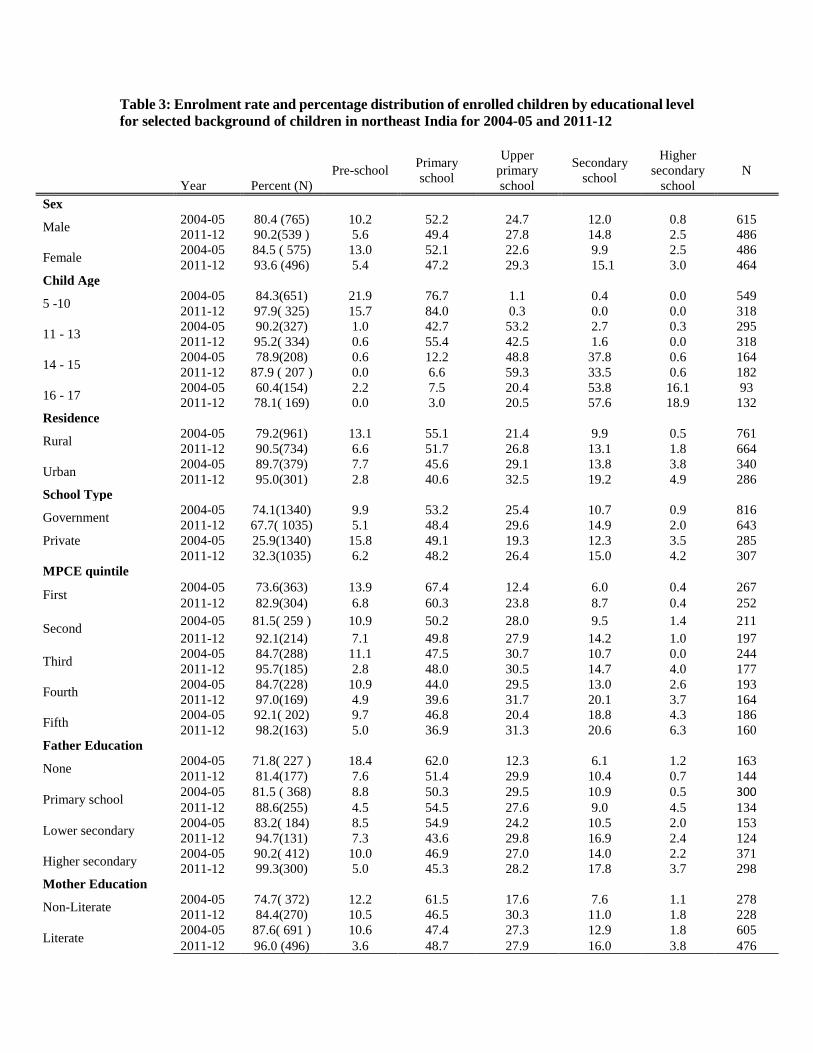
Table 3: Enrolment rate and percentage distribution of enrolled children by educational level
for selected background of children in northeast India for 2004-05 and 2011-12
Year Percent (N)
Pre-school Primary
school
Upper
primary
school
Secondary
school
Higher
secondary
school
N
Sex
Male 2004-05 80.4 (765) 10.2 52.2 24.7 12.0 0.8 615
2011-12 90.2(539 ) 5.6 49.4 27.8 14.8 2.5 486
Female 2004-05 84.5 ( 575) 13.0 52.1 22.6 9.9 2.5 486
2011-12 93.6 (496) 5.4 47.2 29.3 15.1 3.0 464
Child Age
5 -10 2004-05 84.3(651) 21.9 76.7 1.1 0.4 0.0 549
2011-12 97.9( 325) 15.7 84.0 0.3 0.0 0.0 318
11 - 13 2004-05 90.2(327) 1.0 42.7 53.2 2.7 0.3 295
2011-12 95.2( 334) 0.6 55.4 42.5 1.6 0.0 318
14 - 15 2004-05 78.9(208) 0.6 12.2 48.8 37.8 0.6 164
2011-12 87.9 ( 207 ) 0.0 6.6 59.3 33.5 0.6 182
16 - 17 2004-05 60.4(154) 2.2 7.5 20.4 53.8 16.1 93
2011-12 78.1( 169) 0.0 3.0 20.5 57.6 18.9 132
Residence
Rural 2004-05 79.2(961) 13.1 55.1 21.4 9.9 0.5 761
2011-12 90.5(734) 6.6 51.7 26.8 13.1 1.8 664
Urban 2004-05 89.7(379) 7.7 45.6 29.1 13.8 3.8 340
2011-12 95.0(301) 2.8 40.6 32.5 19.2 4.9 286
School Type
Government 2004-05 74.1(1340) 9.9 53.2 25.4 10.7 0.9 816
2011-12 67.7( 1035) 5.1 48.4 29.6 14.9 2.0 643
Private 2004-05 25.9(1340) 15.8 49.1 19.3 12.3 3.5 285
2011-12 32.3(1035) 6.2 48.2 26.4 15.0 4.2 307
MPCE quintile
First 2004-05 73.6(363) 13.9 67.4 12.4 6.0 0.4 267
2011-12 82.9(304) 6.8 60.3 23.8 8.7 0.4 252
Second 2004-05 81.5( 259 ) 10.9 50.2 28.0 9.5 1.4 211
2011-12 92.1(214) 7.1 49.8 27.9 14.2 1.0 197
Third 2004-05 84.7(288) 11.1 47.5 30.7 10.7 0.0 244
2011-12 95.7(185) 2.8 48.0 30.5 14.7 4.0 177
Fourth 2004-05 84.7(228) 10.9 44.0 29.5 13.0 2.6 193
2011-12 97.0(169) 4.9 39.6 31.7 20.1 3.7 164
Fifth 2004-05 92.1( 202) 9.7 46.8 20.4 18.8 4.3 186
2011-12 98.2(163) 5.0 36.9 31.3 20.6 6.3 160
Father Education
None 2004-05 71.8( 227 ) 18.4 62.0 12.3 6.1 1.2 163
2011-12 81.4(177) 7.6 51.4 29.9 10.4 0.7 144
Primary school 2004-05 81.5 ( 368) 8.8 50.3 29.5 10.9 0.5 300 2011-12 88.6(255) 4.5 54.5 27.6 9.0 4.5 134
Lower secondary 2004-05 83.2( 184) 8.5 54.9 24.2 10.5 2.0 153
2011-12 94.7(131) 7.3 43.6 29.8 16.9 2.4 124
Higher secondary 2004-05 90.2( 412) 10.0 46.9 27.0 14.0 2.2 371
2011-12 99.3(300) 5.0 45.3 28.2 17.8 3.7 298
Mother Education
Non-Literate 2004-05 74.7( 372) 12.2 61.5 17.6 7.6 1.1 278
2011-12 84.4(270) 10.5 46.5 30.3 11.0 1.8 228
Literate 2004-05 87.6( 691 ) 10.6 47.4 27.3 12.9 1.8 605
2011-12 96.0 (496) 3.6 48.7 27.9 16.0 3.8 476

School Fees 2004-05 642(1340) 814 562 562 910 1767 986
2011-12 2275(1035) 2878 1736 1738 2968 11931 868
Family Type
Joint 2004-05 88.6 ( 114 ) 16.8 62.4 14.9 5.9 0.0 101
2011-12 87.4( 103) 11.1 48.9 25.6 13.3 1.1 90
Nuclear 2004-05 81.6(1226 ) 10.9 51.1 24.7 11.6 1.7 1000
2011-12 92.3(932 ) 4.9 48.3 28.8 15.1 2.9 860
Caste
OBC 2004-05 84.5 (71) 11.7 63.3 11.7 11.7 1.7 60
2011-12 96.0 (50) 0.0 54.2 35.4 4.2 6.3 48
SC 2004-05 83.2(190) 8.9 53.8 27.2 10.1 0.0 158
2011-12 94.4(143) 3.0 45.9 31.1 19.3 0.7 135
ST 2004-05 79.7 (177) 9.9 51.1 20.6 16.3 2.1 141
2011-12 94.0 (169) 9.4 44.7 27.7 15.1 3.1 159
Others 2004-05 82.3 (902) 12.3 51.1 24.7 10.2 1.8 742
2011-12 90.3 ( 673) 5.4 49.3 27.6 14.8 2.8 608
Number of Children
One 2004-05 80.0 (315) 11.1 56.0 19.8 12.3 0.8 252
2011-12 90.5 ( 263) 7.1 52.5 24.4 12.6 3.4 238
Two 2004-05 84.8( 683 ) 11.7 51.8 26.1 9.2 1.2 579
2011-12 92.3(531) 5.5 44.5 31.8 15.7 2.5 490
More than two 2004-05 79.0( 342) 11.1 49.3 22.6 14.1 3.0 270
2011-12 92.1(241) 3.6 52.3 25.7 15.8 2.7 222
Total 2004-05 82.2(1340) 11.4 52.1 23.8 11.1 1.5 1101
2011-12 91.8(1035) 5.5 48.3 28.5 15.0 2.7 950
12 to 18 percent during 2004-2012. Enrolment rate has increase during 2004-2012
invariably of age of children, 84.3 to 97.9 percent among 5-10 years, 90.2 to 92.2 percent
among 11-13 years, 78.9 to 87.9 percent among 14-15 years and 60.4 to 78.1 among 16-17
years children. Children are enrolled largely in age equivalent levels of education; nearly
all of the children in 5-10 years are enrolled for pre-school and primary education, 96
percent of 11-13 years for primary and upper primary levels, more than 85 percent of 14-
15 years for upper primary and secondary levels and more than 70 percent of 16-17 years
for secondary and higher secondary levels.
As the analysis is based on panel data of children there is evidence emerging the
advancement in educational attainment of children during 2004-2012. Enrolment of
children among rural children during 2004-2012 has improve from 79.2 to 90.5 percent

while among urban children not only is the level of enrolment is higher than in rural from
89.7 to 95 percent. Another major rural-urban differential is that higher proportion of
children in urban are enrolled for secondary and higher secondary levels. Enrolment in
public schools has drops down from 74.1 percent in 2004-05 to 67.7 percent in 2011-12
while that in private schools has increase from 25.9 to 32.3 percents during the aforesaid
period. Higher proportion of children enrolled in private schools are for secondary and
higher secondary education. It is also further noted from the analysis that enrolment rate of
children in 5-17 years in northeast India varies directly with household economic condition
as measured by monthly per capita expenditure (MPCE) and among children from the
lowest and highest MPCE quintile households varies from 73.6 to 92.1 percent in 2004-05
and from 82.9 to 98.2 percent in 2011-12. This clearly indicates that enrolment rate is
higher among children from economically better off households than among children from
economically poorer households. Further it is noted that more children from economically
sound households are enrolled in secondary and higher secondary levels than children from
economically weaker households. Parental education do matters in school enrolment of
children in northeast India, as enrolment rate among children of father with no education
is 71.8 and 81.4 percent in 2004-05 and 2011-12 respectively while the corresponding
figures for children of father educated up to higher secondary level are 90.2 and 99.3
percent respectively. Intergenerational transmission of education from parents to offspring
is also evident from the fact that higher proportion of children of father with higher
education are enrolled in secondary and higher secondary levels than among children with
less educated father. Similar conclusion holds well by literacy status of mother. Enrolment
rate of children from nuclear family has increase from 81.6 to 92.3 percent during 2004-

2012 but not improvement for children from joint family. More children from nuclear
family are enrolled in secondary and higher secondary level than children from joint
family. For all the social groups enrolment rate has improved considerably over the period
2004-05 to 2011-12 but is more significant among the ST with an increase from 79.7 to 94
percent. Most of the school enrolment is in the primary level for all social groups and in
2004-05 it is 63.3 percent the highest among the OBC and 51.1 percent the least among the
ST and other castes. As the 2004-05 cohort of children have either move to the next level
of education or have drop out school enrolment in the same level of education in 2011-12
is lower than that in 2004-05. No enrolment can also be noted in the case of all children
moving to the next level of education in 2011-12. Enrolment in secondary level are lower
among children from OBC, SC and other castes children as compared to that of ST children
in 2004-05. However enrolment in higher secondary level in 2011-12 is higher among
OBC, SC and other castes children suggesting higher continuation rate. When assessing
the enrolment rate by number of school going children in the household it is found that
enrolment rate is marginally higher when there are two school going children in the
household 84.8 and 92.3 percent in 2004-05 and 2011-12 respectively. It is further noted
that enrolment in secondary and higher secondary education is lower among only child of
school going age indicating educational disadvantage of single as against the common
notion that more children in household can exert financial hindrance to children education.
To comprehend the financial burden of child education on household annual school fee for
different levels of school education are analyze and found that for all levels of education
school fee has increase many folds during 2004-2012.
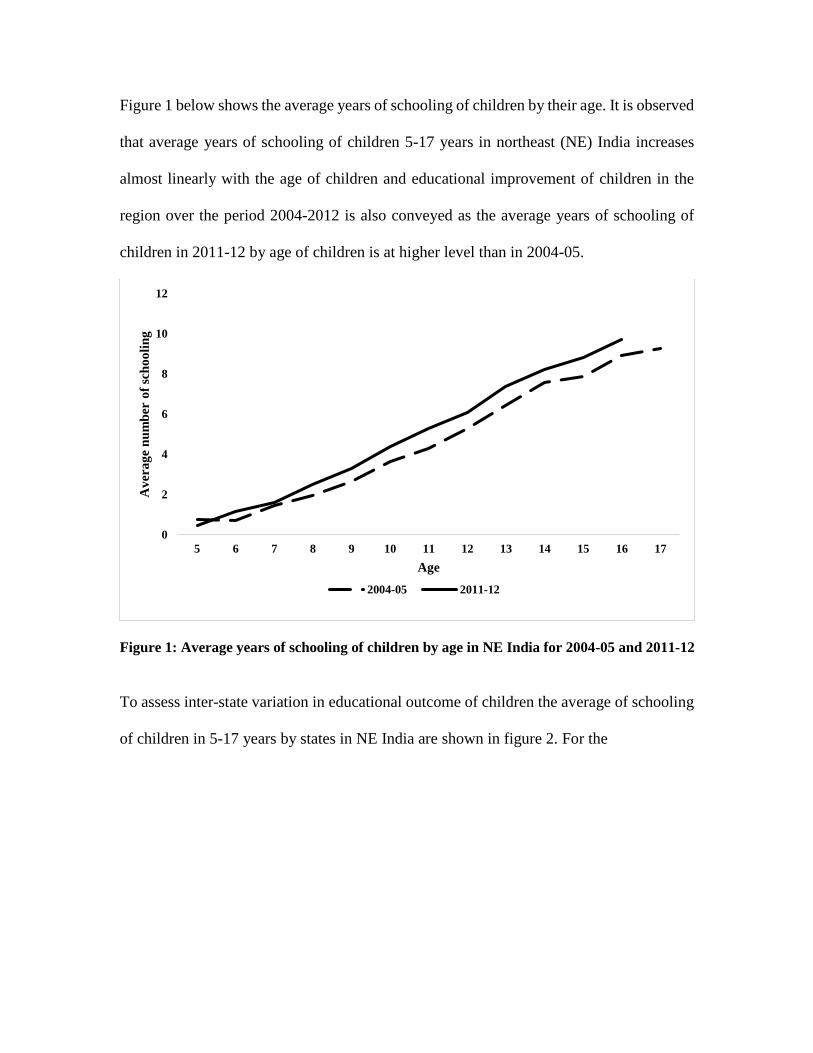
Figure 1 below shows the average years of schooling of children by their age. It is observed
that average years of schooling of children 5-17 years in northeast (NE) India increases
almost linearly with the age of children and educational improvement of children in the
region over the period 2004-2012 is also conveyed as the average years of schooling of
children in 2011-12 by age of children is at higher level than in 2004-05.
Figure 1: Average years of schooling of children by age in NE India for 2004-05 and 2011-12
To assess inter-state variation in educational outcome of children the average of schooling
of children in 5-17 years by states in NE India are shown in figure 2. For the
0
2
4
6
8
10
12
5 6 7 8 9 10 11 12 13 14 15 16 17
Av
era
ge
nu
mb
er o
f sc
ho
oli
ng
Age
2004-05 2011-12

Figure 2: Average year of schooling of children in 5-17 years by states in Northeast India for
2004-05 and 2011-12
NE region the average years of children in 5-17 years improves from 4.3 to 5.3 years during
2004-2012, however there is considerable inter-state variation in the pace of increase.
Educational level of children in terms of years of schooling has not improved during 2004-
2012 for Arunachal Pradesh and Nagaland and remains at about 5 and 5.5 years
respectively. The increase in average years of schooling is highest from 3.4 to 5.7 in
Mizoram; moderately increase from 3 to 4.7 years and no improvement in Nagaland.The
main point emerging from this simple assessment of average years of schooling of children
in 5-17 years is that educational attainment of children in NE India is low when compared
with the educational standard in India, that is, primary for 6-10 years, upper primary for
11-13 years, secondary for 14-15 years and higher secondary for 16-17 years. This suggests
need for further improvement in educational level of children to commensurate with their
age. Parental education is of particular interest in view of intergenerational transmission of
education from parents to offspring. From figure 3 it is evident that the average years of
schooling of children of literate mother is about a year more than children of non-literate
4.44.9
5.4
3.4 3.4
4.7
3.0
4.3 4.3
6.3
5.15.5
5.05.7 5.5
4.7
5.4 5.3
0
1
2
3
4
5
6
7
Sikkim Arunachal
Pradesh
Nagaland Manipur Mizoram Tripura Meghalaya Assam North East
Av
era
ge
nu
mb
er o
f sc
ho
oli
ng
State
2004-05 2011-12
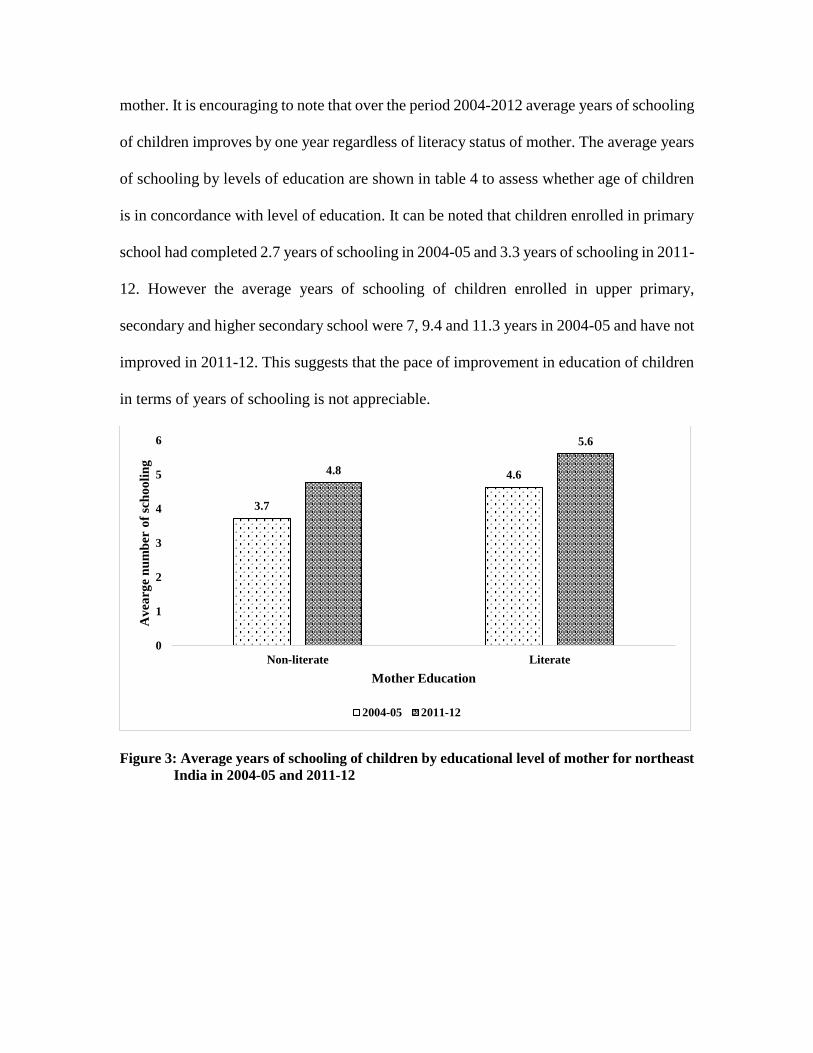
mother. It is encouraging to note that over the period 2004-2012 average years of schooling
of children improves by one year regardless of literacy status of mother. The average years
of schooling by levels of education are shown in table 4 to assess whether age of children
is in concordance with level of education. It can be noted that children enrolled in primary
school had completed 2.7 years of schooling in 2004-05 and 3.3 years of schooling in 2011-
12. However the average years of schooling of children enrolled in upper primary,
secondary and higher secondary school were 7, 9.4 and 11.3 years in 2004-05 and have not
improved in 2011-12. This suggests that the pace of improvement in education of children
in terms of years of schooling is not appreciable.
Figure 3: Average years of schooling of children by educational level of mother for northeast
India in 2004-05 and 2011-12
3.7
4.64.8
5.6
0
1
2
3
4
5
6
Non-literate Literate
Av
earg
e n
um
ber
of
sch
oo
lin
g
Mother Education
2004-05 2011-12

Table 4: Average years of schooling by levels of education in 2004-05 and 2011 - 12
Average year of schooling
2004-05 2011-12
Preschool (below 5 years) 0.3 0.0
Primary school ( 5- 10 years) 2.7 3.3
Upper primary school ( 11-13 years ) 6.9 7.0
Secondary school ( 14-15 years) 9.4 9.3
Higher secondary school ( 16 - 17 years) 11.3 11.2
Overall 4.3 5.3
In order to comprehend the scenario more closely, the proportion of enrolled children
whose age are lower and higher than the prescribed age by levels of education for 2004-05
and 2011-12 are shown in table 5. It is noted that out of 574 and 459 children in 2004-05
and 2011-12 for primary schooling 26.7 and 41.8 percent respectively were older than the
prescribed eligible age 5-10 years. Likewise out of 262 and 271 children enrolled for upper
primary schooling in 2004-05 and 2011-12 the proportions of children who were above the
prescribed eligible age 11-13 years are 37.8 and 49.8 percent respectively. Only 2.3 and
0.4 percent of enrolled children in 2004-05 and 2011-12 were below the age of 11 years.
Further out of 122 and 142 children enrolled for secondary schooling in 2004-05 and 2011-
12 large proportions of children 50.8 and 43 percent are in the prescribed eligible age 14-
15 years while only 8.2 and 3.5 percent respectively are below the age of 14 years and 41
and 53.5 percent respectively are older than 15 years. As regards 17 and 26 children
enrolled for higher secondary in 2004-05 and 2011-12 majority of the children, 88.2 and
96.2 percent are in the prescribed eligible age 16-17 years while the fractions are below 16
years. It is evident that the low average years of schooling of children in northeast India
the consequence of large proportion of enrolled children for each level of schooling are
older than the prescribed eligible age for the corresponding level of education.
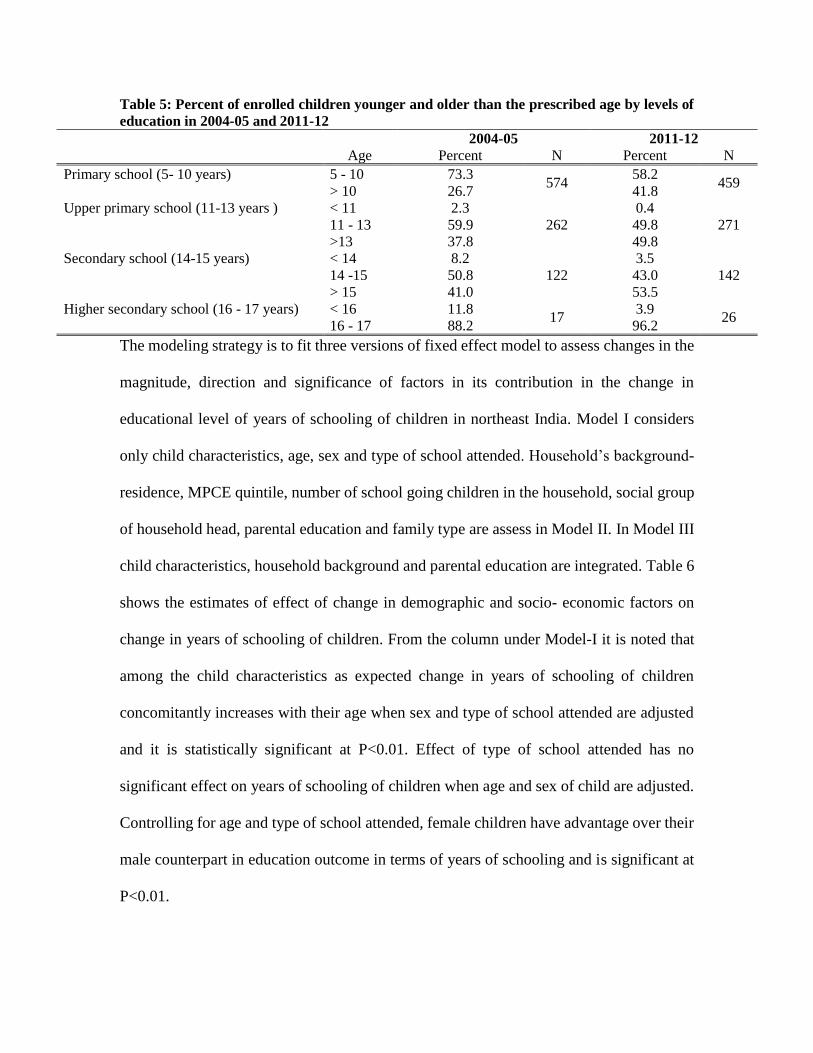
Table 5: Percent of enrolled children younger and older than the prescribed age by levels of
education in 2004-05 and 2011-12
2004-05 2011-12
Age Percent N Percent N
Primary school (5- 10 years) 5 - 10 73.3 574
58.2 459
> 10 26.7 41.8
Upper primary school (11-13 years ) < 11 2.3
262
0.4
271 11 - 13 59.9 49.8
>13 37.8 49.8
Secondary school (14-15 years) < 14 8.2
122
3.5
142 14 -15 50.8 43.0
> 15 41.0 53.5
Higher secondary school (16 - 17 years) < 16 11.8 17
3.9 26
16 - 17 88.2 96.2
The modeling strategy is to fit three versions of fixed effect model to assess changes in the
magnitude, direction and significance of factors in its contribution in the change in
educational level of years of schooling of children in northeast India. Model I considers
only child characteristics, age, sex and type of school attended. Household’s background-
residence, MPCE quintile, number of school going children in the household, social group
of household head, parental education and family type are assess in Model II. In Model III
child characteristics, household background and parental education are integrated. Table 6
shows the estimates of effect of change in demographic and socio- economic factors on
change in years of schooling of children. From the column under Model-I it is noted that
among the child characteristics as expected change in years of schooling of children
concomitantly increases with their age when sex and type of school attended are adjusted
and it is statistically significant at P<0.01. Effect of type of school attended has no
significant effect on years of schooling of children when age and sex of child are adjusted.
Controlling for age and type of school attended, female children have advantage over their
male counterpart in education outcome in terms of years of schooling and is significant at
P<0.01.
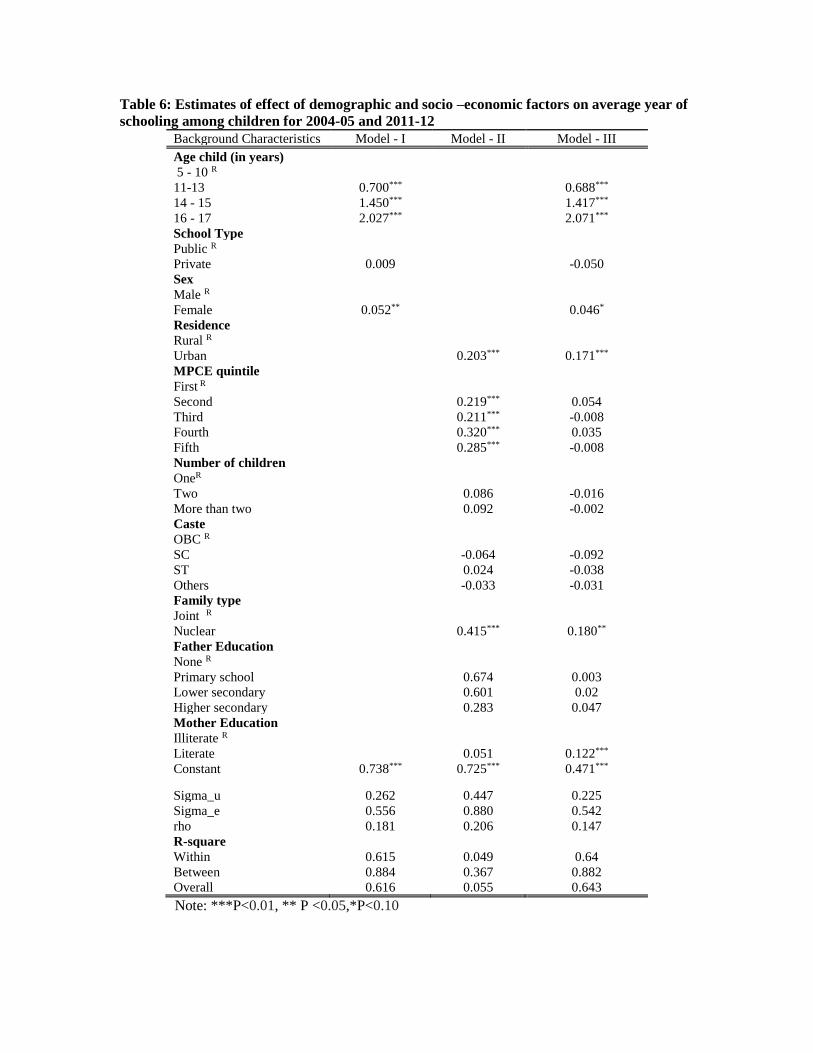
Table 6: Estimates of effect of demographic and socio –economic factors on average year of
schooling among children for 2004-05 and 2011-12
Background Characteristics Model - I Model - II Model - III
Age child (in years) 5 - 10 R 11-13 0.700*** 0.688***
14 - 15 1.450*** 1.417***
16 - 17 2.027*** 2.071***
School Type Public R Private 0.009 -0.050
Sex Male R Female 0.052** 0.046*
Residence Rural R Urban 0.203*** 0.171***
MPCE quintile First R Second 0.219*** 0.054
Third 0.211*** -0.008
Fourth 0.320*** 0.035
Fifth 0.285*** -0.008
Number of children
OneR
Two 0.086 -0.016
More than two 0.092 -0.002
Caste OBC R SC -0.064 -0.092
ST 0.024 -0.038
Others -0.033 -0.031
Family type Joint R
Nuclear 0.415*** 0.180**
Father Education None R Primary school 0.674 0.003
Lower secondary 0.601 0.02
Higher secondary 0.283 0.047
Mother Education Illiterate R Literate 0.051 0.122***
Constant 0.738*** 0.725*** 0.471***
Sigma_u 0.262 0.447 0.225
Sigma_e 0.556 0.880 0.542
rho 0.181 0.206 0.147
R-square
Within 0.615 0.049 0.64
Between 0.884 0.367 0.882
Overall 0.616 0.055 0.643
Note: ***P<0.01, ** P <0.05,*P<0.10

The estimated effects of household background and parental educational status are shown
in the column under Model II. Change in years of schooling of urban children are higher
than that of rural children when other household background are controlled and the
differential in years of schooling by sex of children is significant at P<0.01. Change in
average years of schooling of children increases with increase in economic well-being of
household from first to fifth MPCE quintile when other factors are adjusted and is
significant at P<0.01. Number of children of school going age children in the household
has no significant effect on years of schooling of children. When it comes to assessment of
social group differential in educational outcome of children when other factors are
controlled it is found that average years of schooling of children is invariant of social group
background of children as the effect of social group on average years of schooling do not
suggest existence of significant effects. Children from nuclear family comprising of parents
and other siblings out perform in terms of years of schooling over children from extended
joint family when other factors are adjusted and the difference is significant at P<0.01.
After adjustment of other household background parental educational status do not show
any significant effect on child educational attainment.
Child characteristics, household background and parental educational status are integrated
and their effects on years of education of children are shown in the column of Model III.
The effects of age and sex of children in child characteristics, urban residence, social
groups and family type on years of schooling of children remains largely unchanged from
Model in terms of magnitude, direction and level of significance when other factors are
adjusted. However the significance of economic status of household as measured by MPCE
dwindles out and the significance of mother literacy status emerges when other child

characteristics and household background are controlled. It is found that children of literate
mothers have higher years of schooling than that of non-literate mothers and the differential
is significant at P<0.01. The estimated intra-class correlation coefficient of years of
schooling of children 5-17 years in northeast India is 14.7 percent which is modestly high.
Child characteristics, household background and parental background considered in this
study explained 88.2 and 64 percent of between and within years of schooling variation.
Table 7: Malnutrition among children under five years by selected background in
2004-05 and 2011-12
Underweight(2004-05) Underweight(2011-12)
Severe Moderate Normal Severe Moderate Normal
Residence
Rural 14.0 23.3 62.8 4.1 15.1 80.8
Urban 0.0 16.2 83.8 5.0 15.0 80.0
Sex
Male 10.5 22.8 66.7 6.7 16.7 76.7
Female 9.1 19.7 71.2 1.9 13.2 84.9
Age of child (in month)
0 0.0 0.0 100.0 0.0 0.0 100.0
12 0.0 20.0 80.0 0.0 11.8 88.2
24 21.4 7.1 71.4 8.3 8.3 83.3
36 13.9 19.4 66.7 8.3 20.8 70.8
48 5.3 34.2 60.5 4.6 18.2 77.3
60 8.7 13.0 78.3 0.0 17.4 82.6
MPCE
First 12.5 15.6 71.9 11.8 29.4 58.8
Second 15.4 20.5 64.1 7.1 3.6 89.3
Third 5.6 38.9 55.6 0.0 13.6 86.4
Fourth 5.6 27.8 66.7 4.4 17.4 78.3
Fifth 0.0 6.3 93.8 0.0 17.4 82.6
Family Type
Joint 8.7 26.1 65.2 3.4 13.6 83.1
Nuclear 10.0 20.0 70.0 5.6 16.7 77.8
Number of child
Two 11.8 19.1 69.1 8.6 11.4 80.0
More than three 7.3 23.6 69.1 2.6 16.7 80.8
Caste OBC 9.1 9.1 81.8 0.0 10.0 90.0
SC 15.4 15.4 69.2 17.7 5.9 76.5
ST 5.7 28.6 65.7 0.0 7.1 92.9
Other 11.9 26.2 61.9 3.5 22.4 74.1
Father Education
Non 14.3 14.3 71.4 0.0 14.3 85.7
Primary 11.1 33.3 55.6 14.3 0.0 85.7
Upper 0.0 40.0 60.0 0.0 50.0 50.0
Secondary 12.5 12.5 75.0 0.0 0.0 100.0
Higher 9.6 20.2 70.2 4.8 15.7 79.5
Mother Education
Non-Literate 12.5 20.8 66.7 16.7 0.0 83.3
Literate 9.1 21.2 69.7 2.1 17.9 80.0
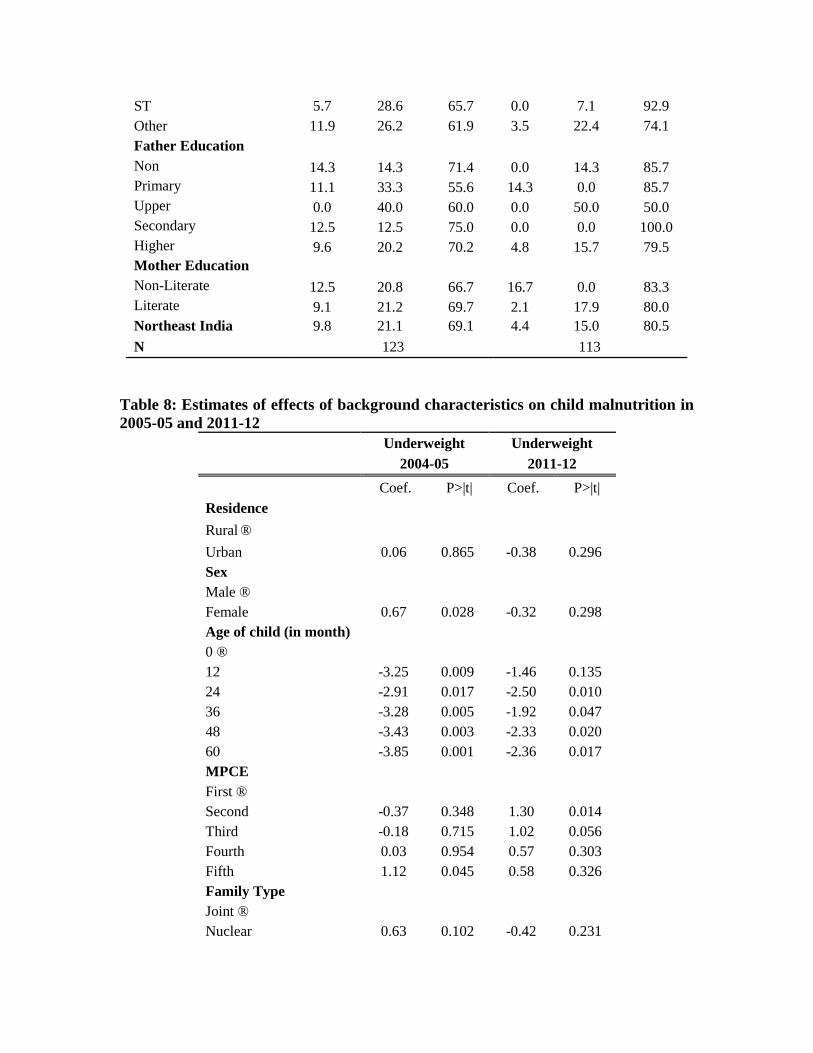
Northeast India 9.8 21.1 69.1 4.4 15.0 80.5
N 123 113
Table 8: Estimates of effects of background characteristics on child malnutrition in
2005-05 and 2011-12
Underweight Underweight
2004-05 2011-12
Coef. P>|t| Coef. P>|t|
Residence
Rural ®
Urban 0.06 0.865 -0.38 0.296
Sex
Male ®
Female 0.67 0.028 -0.32 0.298
Age of child (in month)
0 ®
12 -3.25 0.009 -1.46 0.135
24 -2.91 0.017 -2.50 0.010
36 -3.28 0.005 -1.92 0.047
48 -3.43 0.003 -2.33 0.020
60 -3.85 0.001 -2.36 0.017
MPCE
First ®
Second -0.37 0.348 1.30 0.014
Third -0.18 0.715 1.02 0.056
Fourth 0.03 0.954 0.57 0.303
Fifth 1.12 0.045 0.58 0.326
Family Type
Joint ®
Nuclear 0.63 0.102 -0.42 0.231

Number of child
Two ®
More than three -0.18 0.565 0.14 0.678
Caste
OBC ®
SC 0.52 0.370 -1.26 0.059
ST -0.01 0.986 -0.28 0.650
Other -0.22 0.605 -0.65 0.268
Father Education
Non ®
Primary 0.06 0.945 -0.51 0.566
Upper 0.40 0.679 -0.66 0.459
Secondary 1.80 0.040 0.32 0.706
Higher 0.41 0.530 -0.27 0.684
Mother Education
Non-Literate ®
Literate -0.01 0.968 0.39 0.368
Constant 1.17 0.433 1.53 0.205
Summary and Conclusion
One of the major concerned of states in Northeast India is the human resource development
of next generation of the region characterized by underdevelopment, lack of infrastructure
including educational facility and hilly terrain. Comprehensive assessment of factors
supporting educational enhancement of children of the region shall be vital for regional
level interventions to moderate and ensure proper education of next generation. Keeping
this in view using panel data from two recent rounds 2004-05 and 2011-12 of India Human
Development Survey for children in 5-17 years from northeast India in this study an
attempt is made to assess child characteristics, household background and parental
education on years of schooling of children.
On the whole school enrolment rate in northeast India is impressive and comparable to
other developed states in the country. Three-fourth of children is enrolled in public schools
but over time patronization of private schools is increasing. There is also considerable
improvement in enrolment rate during 2004-2012. What is more socially appealing of the
region is that enrolment rate among the girls is higher than that among the boys and
enrolment of children is invariant of number of school going children in the household.
However there exit differential in enrolment by place of residence, household economic
status, parental education, family type, and social groups. Rural children, children from
economically weaker households, none-literate parents, joint family and other backward
castes have lower enrolment rate as compared to their other counterparts. The other
significant differential is that more children from socio-economically and residence
advantageous groups are enrolled for secondary and higher secondary education than
among the disadvantage groups.
Assessment of years of schooling of children unearths that children from northeast India
have low average years of schooling which is contrary to high enrolment rate in the region
suggesting the need for assessment beyond enrolment rate for mitigation of educational
enhancement of children. One of areas of concerned in enhancement of years of schooling
of children despite high enrollment rate for each level of education is the fact that large
number of children are over age in comparison to the prescribed eligible age for each level
of education. This study reaffirms the significance of literacy of mother, accessibility to
educational facilities proxy by urban residence and nuclear family structure in
enhancement of educational attainment of children in the case of northeast India.
Notwithstanding the findings elsewhere the economic well-being of household is found not
to be significant factor of educational outcome of children in the region once the mother
literacy is adjusted. One of the most encouraging findings of the study is that unlike in
other parts of the country girls have significantly higher years of schooling than the boys.

Despite the fact that northeast India is the abode of many indigenous tribes and castes in
terms of educational attainment of their children is behind those of other backward castes.
The study suggests that northeast India has still a long way to go to ensured ‘Right of
Children to Free and Compulsory Education (RTE) Act, 2009’ which entitles every child
of the age of six to fourteen years with the right to free and compulsory education in a
neighbourhood school till completion of elementary education. A lot more also need to be
done in the context of northeast India to translate into reality the provisions to promote,
with special care, the education and economic interests of the weaker sections of the people,
and, in particular of the Scheduled Castes (ST) and Scheduled Tribes (SC), and shall
protect them from social injustice and all forms of social exploitation by the states under
Article 46 of the Indian Constitution. An important conclusion which can be drawn from
this study is that for enhancement of educational attainment of children in region such as
the northeast India supply side needs to be further supported by sensitization of community
and household the need for education of children. Adult education program at community
level can also be promoted to educate women as it pays dividend in enhancing children
education.
References Agrawal, A., &Shashi, A. (2014). Education in India: Challenges and Its Role in Bringing Social
Change.

Azam, M., & Bhatt, V. (2015). Like father, like son? Intergenerational educational mobility in
India. Demography, 52(6), 1929-1959.
Becker, G. S., Murphy, K. M., & Tamura, R. (1990). Human capital, fertility, and economic
growth. Journal of political economy, 98(5, Part 2), S12-S37.
Behrman, J. R. (1997). Mother's schooling and child education: A survey. Philadelphia: University
of Pennsylvania.
Bhat, R. A. (2015). Role of Education in the Empowement of Women in India. Journal of
Education and Practice, 6(10), 188-191.
Borkotoky, K., Unisa, S., & Gupta, A. K. (2015). Intergenerational transmission of education in
India: evidence from a nationwide survey. International Journal of Population
Research, 2015.
Coleman, J. S. (1988). Social capital in the creation of human capital. American journal of
sociology, 94, S95-S120.
Coleman, James S., Campbell, E.Q., Hobson, C.J., McPartland, J., Mood, A.M., Weinfeld, F.D.
and York, R.L. (1966). Equality of educational opportunity. Washington, D.C.: U.S.
Government Printing Office.
Duraisamy, M. (2002). Child Schooling and Child Work in India. NCAER, Working Paper 84.
Evangelista de CarvalhoFilho, Irineu (2008). ‘Household income as a determinant of child labor
and school enrollment in Brazil.’ IMF Working Paper, WP/08/241
Huisman, A. H. M., Rani, U., & Smits, J. P. J. M. (2010). School characteristics, socio-economic
status and culture as determinants of primary school enrolment in India.
Jencks, Christopher (1972). Inequality: A Reassessment of the Effect of Family and Schooling in
America. New York: Basic Books.
Korupp, S. E., Ganzeboom, H. B., & Van Der Lippe, T. (2002). Do mothers matter? A comparison
of models of the influence of mothers' and fathers' educational and occupational status on
children's educational attainment. Quality & Quantity, 36(1), 17-42.
Kugler, A. D., & Kumar, S. (2017). Preference for Boys, Family Size, and Educational Attainment
in India. Demography, 54(3), 835-859.
Lawrence, A. S., &Vimala, A. (2012). School Environment and Academic Achievement of
Standard IX Students. Online Submission, 2(3), 210-215.
Lucas, R. E. (1998). On the mechanics of economic development. Econometric Society
Monographs, 29, 61-70.
Mallick, L., Das, P. K., & Pradhan, K. C. (2016). Impact of educational expenditure on economic
growth in major Asian countries: Evidence from econometric analysis. Theoretical &
Applied Economics, 23(2).
Mingat, A. (2007). Social disparities in education in sub-Saharan African countries. International
studies in educational inequality, theory and policy, 223-255.
Mukherjee, D., & Das, S. (2008). Role of parental education in schooling and child labour decision:
Urban India in the last decade. Social Indicators Research, 89(2), 305-322.
National Sample Survey Organisation (1998). Attending An Educational Institution in India: Its
Level, Nature and Cost, NSS 52nd Round Edition, July 1995-June 1996, (Report No 439),
Department of Statistics, Government of India, New Delhi.
Ngangbam, S., &Ladusingh, L. (2013). Education, Fertility and Earning of Women in North-east
India. ArthaVijnana, 55(3), 272-288.
Saifi, S., & Mehmood, T. (2011). Effects of socioeconomic status on students
achievement. International Journal of Social Sciences and Education, 1(2), 119-128.
Self, S., & Grabowski, R. (2004). Does education at all levels cause growth? India, a case
study. Economics of Education Review, 23(1), 47-55.
Sen, A. (1999). Development as Freedom. Oxford: Oxford University Press.
Shavit, Y., &Blossfeld, H. P. (1993). Persistent Inequality: Changing Educational Attainment in
Thirteen Countries. Social Inequality Series. Westview Press, 5500 Central Avenue,
Boulder, CO 80301-2847.

Singh, A. (2013). Size and Sources of the Private School Premium in Test Scores in India. Working
Paper 98, Young Lives, Oxford Department of International Development (ODID),
University of Oxford. Accessed from
https://assets.publishing.service.gov.uk/media/57a08a49ed915d3cfd0006b0/wp98-
private-school-premium-india.pdf on August 14, 2017.
Singha, K. (2013). Conflict, State and Education in India: A Study of Manipur. American journal
of educational research, 1(6), 181-193.
Suleman, Q., Hussain, I., & Akhtar, Z. (2012). Effects of family structure on the academic
performance of students at elementary level in District Karak, Khyber Pukhtunkhwa
(Pakistan). Journal of Sociological Research, 3(2), 234-248.
Tilak, J. B. (2002). Determinants of household expenditure on education in rural India (No. 88).
New Delhi: National Council of Applied Economic Research.
Vaid, D. (2016). Patterns of Social Mobility and the Role of education In India. Journal of
Contemporary South Asia, Vol. 24, No.3, doi.org/10.1080/09584935.2016.1208637.
Vellymalay, S. K .N. (2011). A Study of the Relationship between Indian Parents’ Education Level
and their Involvement in their Children’s Education. Kajian Malaysia: Journal of
Malaysian studies, 29(2).