grade separation (h-2287) koontz lane at us-395/i-580
TRANSCRIPT

GEOTECHNICAL INVESTIGATION REPORT
GRADE SEPARATION (H-2287) KOONTZ LANE AT US-395/I-580
CARSON CITY
STATE OF NEVADA
DEPARTMENT OF TRANSPORTATION
MATERIALS DIVISION
GEOTECHNICAL SECTION
GEOTECHNICAL REPORT
KOONTZ LANE GRADE SEPARATION H-2287
US-395/I-580 CARSON FREEWAY PHASE II NOVEMBER 2004
EA 72781-1
CARSON CITY, NEVADA
Prepared by: _________________________
Carol Callaghan, F.E. Associate Engineer - Geotechnical
Reviewed by: _________________________
Jeff Palmer, Ph.D., P.E. Principal Geotechnical Engineer
Approved by: _________________________
Dean Weitzel, P.E. Chief Materials Engineer
TABLE OF CONTENTS
INTRODUCTION General 1 Purpose and Scope 2 PROJECT DESCRIPTION 2 GEOLOGIC CONDITIONS and SEISMICITY 3 FIELD INVESTIGATION 4 LABORATORY ANALYSIS 5 DISCUSSION 5 RECOMMENDATIONS
Foundations 6 Abutment Retaining Walls 6 Slope Stability 7 Excavation 7
REFERENCES 8 APPENDICES APPENDIX A Project Location Maps
Site Plan with Soil Boring Locations (Soil Boring Location Map) APPENDIX B Boring Log Key Boring Logs APPENDIX C Test Result Summary Sheets
Particle Size Distribution Report Sheets (Gradation Curves) Direct Shear Test Report Sheets Chemical Analysis Results
INTRODUCTION
General
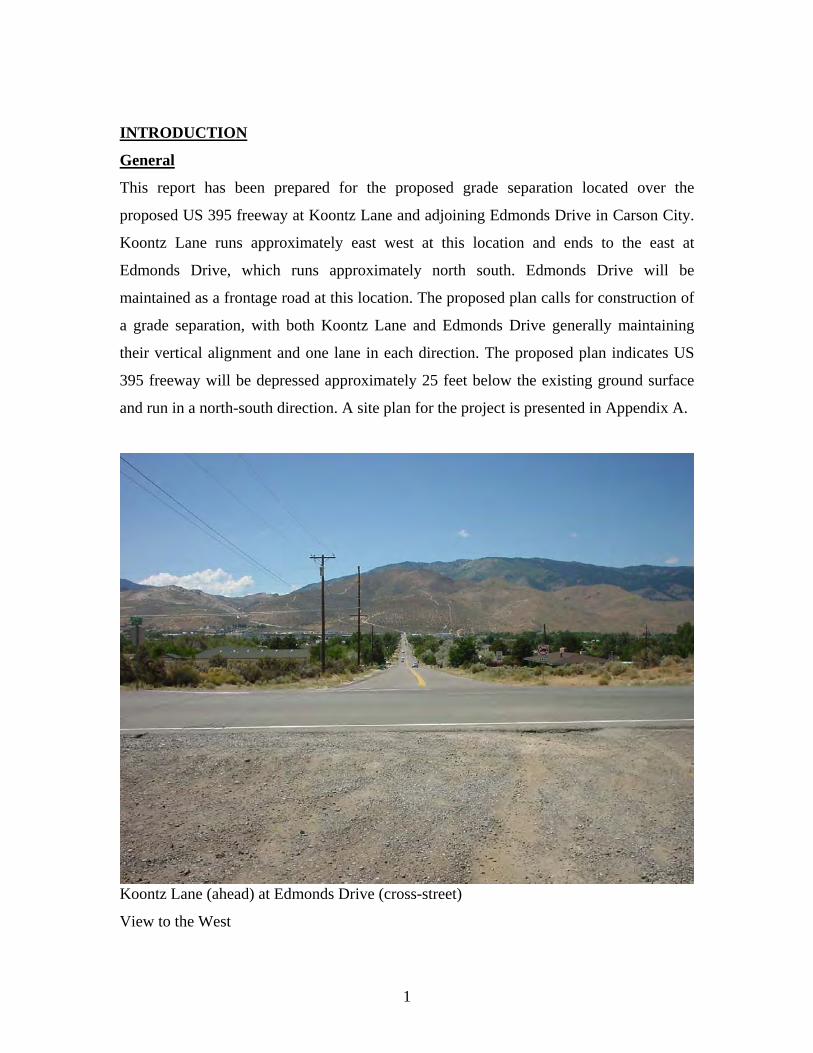
This report has been prepared for the proposed grade separation located over the
proposed US 395 freeway at Koontz Lane and adjoining Edmonds Drive in Carson City.
Koontz Lane runs approximately east west at this location and ends to the east at
Edmonds Drive, which runs approximately north south. Edmonds Drive will be
maintained as a frontage road at this location. The proposed plan calls for construction of
a grade separation, with both Koontz Lane and Edmonds Drive generally maintaining
their vertical alignment and one lane in each direction. The proposed plan indicates US
395 freeway will be depressed approximately 25 feet below the existing ground surface
and run in a north-south direction. A site plan for the project is presented in Appendix A.
Koontz Lane (ahead) at Edmonds Drive (cross-street)
View to the West
1

Purpose and Scope
The purpose of this report is to provide information regarding the subsurface soil
conditions at the proposed project site. This report also provides geotechnical design
recommendations for the grade separation bridge structure involved in this project. The
scope of this report consists primarily of geotechnical investigation and analysis, and
recommendations for design and construction. The investigation included gathering data
from past field explorations and reports, in addition to information obtained from recent
field reconnaissance, subsurface explorations, soil sampling, and analysis of field and
laboratory testing data. This report includes boring logs and summaries of test results
from the field investigations and the laboratory-testing regimen. These may be found in
appendices B and C, respectively.
PROJECT DESCRIPTION
The project site is located in southwestern Carson City, in Section 28 of Township 15
North, Range 20 East, M.D.M., about 1.5 miles northeast of the junction of U.S.
Highways 50 and 395. The Koontz Grade Separation is one of six bridge structures in
Phase II of the Carson City Freeway Project. The freeway will run approximately 25 feet
below the existing grade as shown in the current plans, and will pass under Koontz Lane.
Preliminary plans indicate the proposed bridge will be designed as a two-span concrete
structure over the freeway alignment, conveying two lanes of traffic in each direction.
The structure will be supported on spread footings founded in native soils. The new
structure will be approximately 60 feet in width and 220 feet in length.1
2

Koontz Lane at Proposed Grade Separation Location
View to the East, Vehicle is on Edmonds Drive
GEOLOGIC CONDITIONS and SEISMICITY
The site is founded in pediment and alluvial fan deposits (Qpa) grading to
undifferentiated alluvial deposits (Qa) originating from the Prison Hill. Prison Hill
consists of metavolcanic breccia, a gray to greenish-gray and greenish-black, very poorly
sorted coarse andesitic mudflow breccia. The pediment and deposits are grayish-orange,
tan and gray-brown granular muddy coarse sand and sandy gravel in small fans, bajadas,
and minor pediment veneers.2 According to the Earthquake Hazards Map, the depth to
ground water ranges from 10 to 33 feet.3 Water was not encountered to the 98.5 foot
depth explored during the NDOT investigation.
This area lies at an elevation of approximately 4735 feet and slopes gently downward
(≈3%) to the west. Boreholes were inspected for groundwater up to three months after
drilling but remained dry, and unobstructed to within 4 inches of initial bottom of hole.
The site is founded within an area labeled with a moderate severity for potential of
ground shaking during earthquakes. The site includes unconsolidated deposits with a low
3
rigidity at the 10-foot ground water depth and moderate rigidity at the 33-foot ground
water depth.3
There are numerous faults in the general area with an age of fault displacement less than
a few hundred years. Nearby faults include numerous small offshoots of the Genoa Fault
that lie 1.5 miles to the west and 2.5 miles to the south-southwest. The Genoa Fault lies
approximately 6.5 miles southwest of the site and has an age of last displacement of
between 200 to 1000 years.4 The Carson City Fault lies about 1.6 miles northwest5 and
the Eastern Prison Hill Fault Zone lies about 7.5 miles north-northeast.6 These Holocene
faults (<11,000 years old) are capable of producing large (magnitude 6.6 to 7.4)
earthquakes.6 The recommended peak acceleration coefficient is 0.4 g based on a 10%
probability of exceedance in 50 years (AASHTO).7
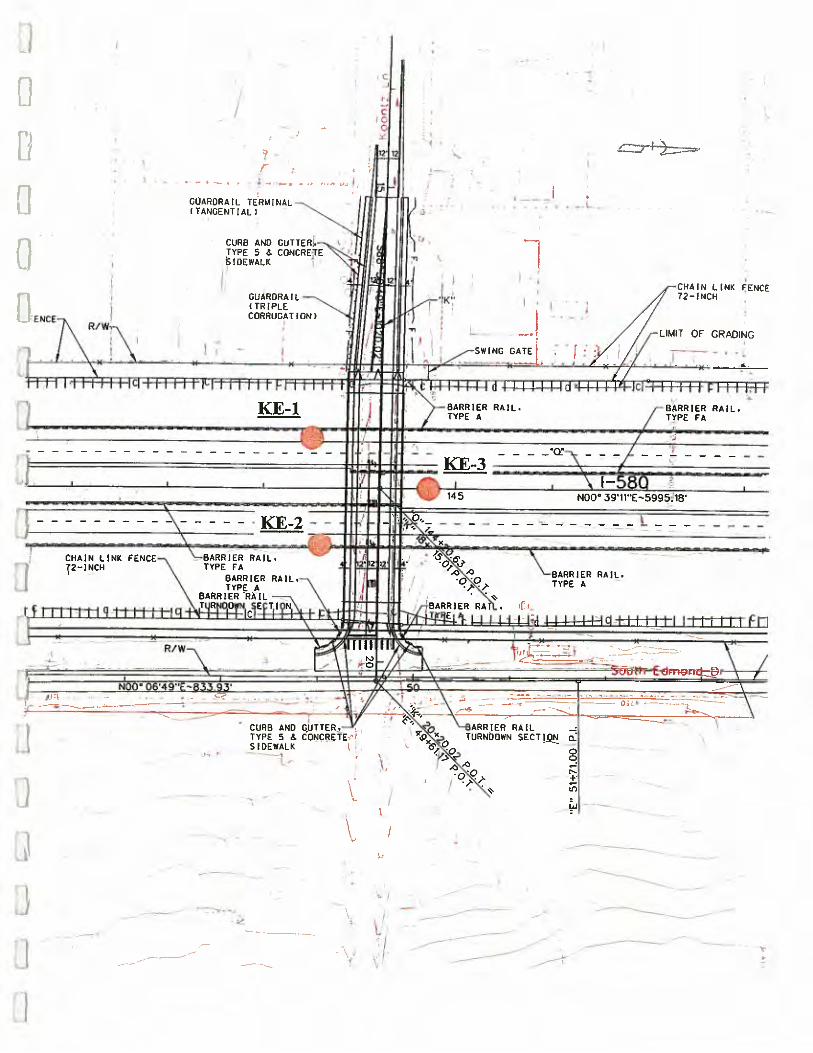
FIELD INVESTIGATION
The Nevada Department of Transportation (NDOT) Geotechnical Section conducted a
subsurface investigation at the proposed project site in June of 2002. Subsurface soil
conditions were explored by drilling three boreholes (KE-1 through KE-3) to a maximum
depth of 98.5 feet below ground surface, and to a minimum elevation of 4636.7 feet. The
approximate locations of the boreholes are shown on the Borehole Locations sheet in
Appendix A. Surface elevations were obtained for the borehole locations by surveying
from known elevation points. Drilling was accomplished utilizing a Mobile B-80 drill rig
equipped for soil sampling, using a bentonite drilling slurry for wet drilling. All
boreholes were left open for approximately 11 to 13 weeks to monitor ground water
conditions. All boreholes remained dry once initial drilling fluid dissipated. The on-site
soil conditions were not suitable for using samplers other than a Standard Penetration
Test (SPT) sampler, or a driven California Modified Sampler (CMS); therefore, all
recovered samples were disturbed. Soil samples and standard penetration resistance
values (N-Values) were obtained utilizing the SPT procedure as set forth in ASTM test
number T 206. In addition, N-Values were obtained for the CMS samples through the
use of an empirical correlation. All soil samples were classified using the Unified Soil
Classification System (USCS) based on laboratory test results.
4
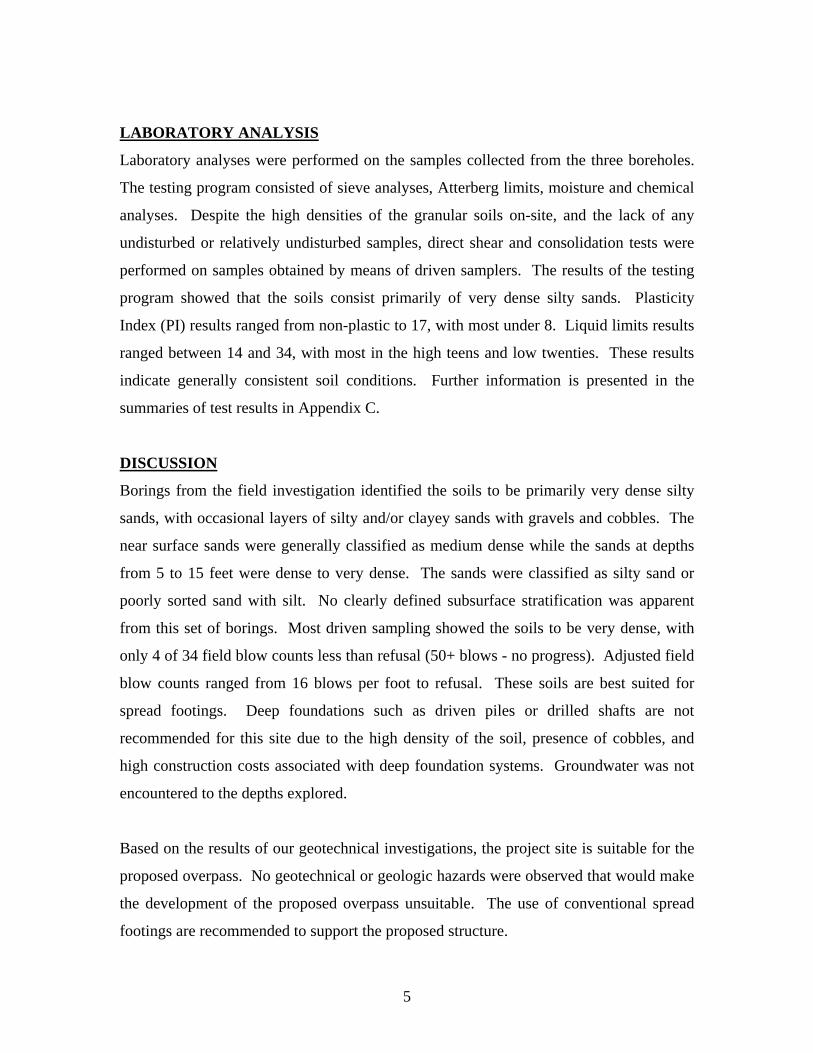
LABORATORY ANALYSIS
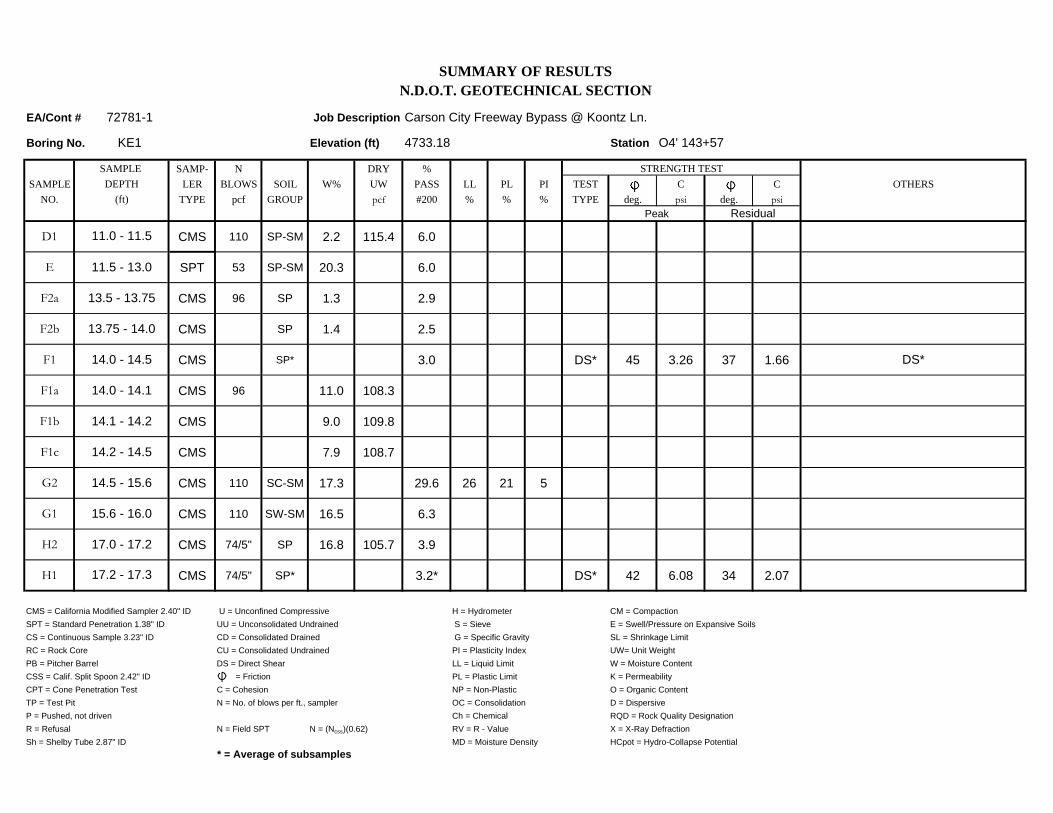
Laboratory analyses were performed on the samples collected from the three boreholes.
The testing program consisted of sieve analyses, Atterberg limits, moisture and chemical
analyses. Despite the high densities of the granular soils on-site, and the lack of any
undisturbed or relatively undisturbed samples, direct shear and consolidation tests were
performed on samples obtained by means of driven samplers. The results of the testing
program showed that the soils consist primarily of very dense silty sands. Plasticity
Index (PI) results ranged from non-plastic to 17, with most under 8. Liquid limits results
ranged between 14 and 34, with most in the high teens and low twenties. These results
indicate generally consistent soil conditions. Further information is presented in the
summaries of test results in Appendix C.
DISCUSSION
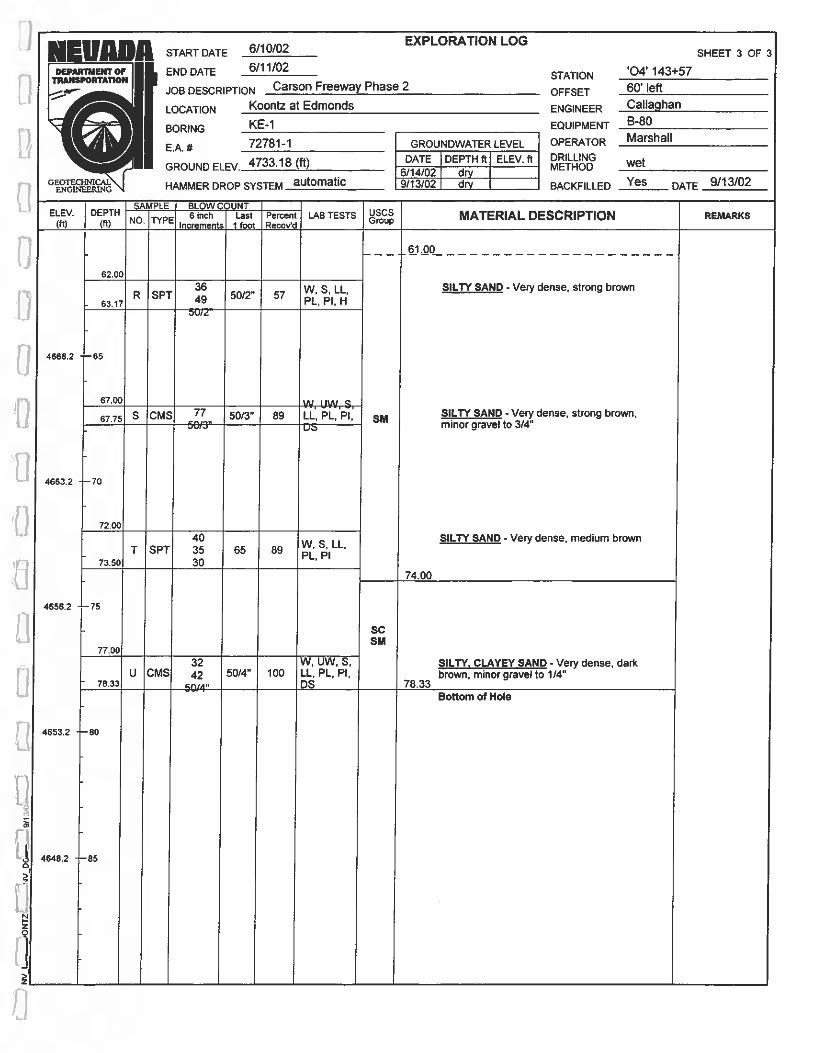
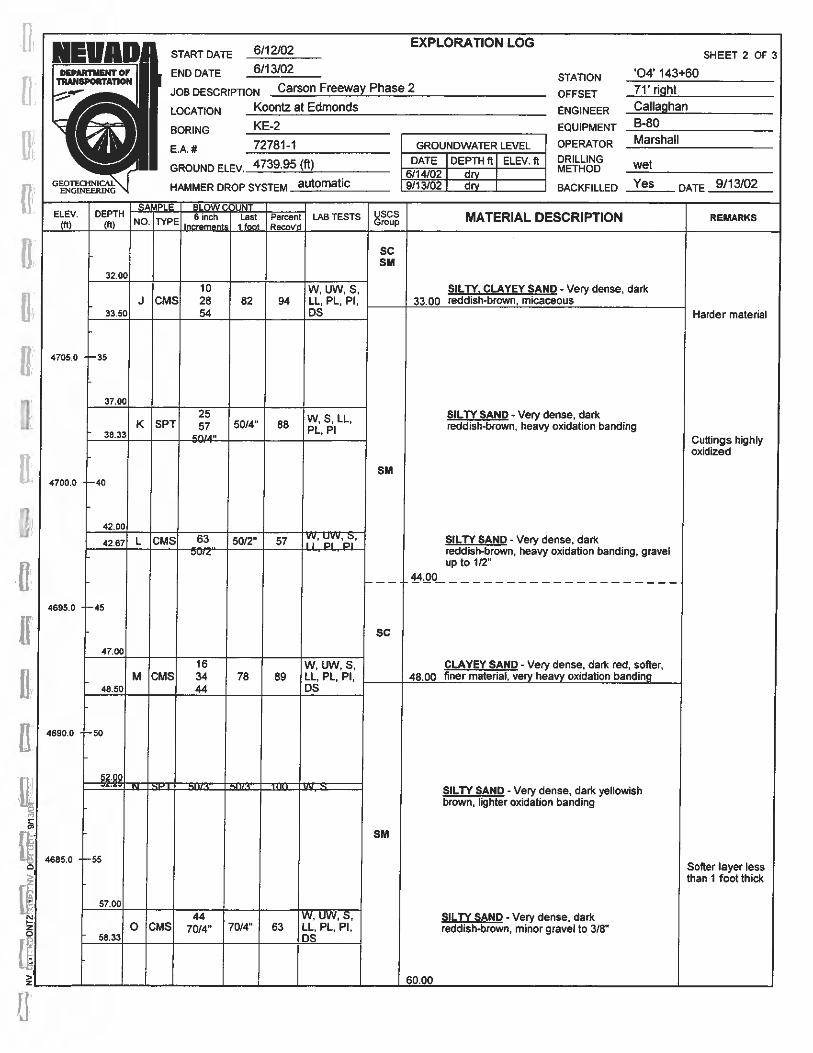
Borings from the field investigation identified the soils to be primarily very dense silty
sands, with occasional layers of silty and/or clayey sands with gravels and cobbles. The
near surface sands were generally classified as medium dense while the sands at depths
from 5 to 15 feet were dense to very dense. The sands were classified as silty sand or
poorly sorted sand with silt. No clearly defined subsurface stratification was apparent
from this set of borings. Most driven sampling showed the soils to be very dense, with
only 4 of 34 field blow counts less than refusal (50+ blows - no progress). Adjusted field
blow counts ranged from 16 blows per foot to refusal. These soils are best suited for
spread footings. Deep foundations such as driven piles or drilled shafts are not
recommended for this site due to the high density of the soil, presence of cobbles, and
high construction costs associated with deep foundation systems. Groundwater was not
encountered to the depths explored.
Based on the results of our geotechnical investigations, the project site is suitable for the
proposed overpass. No geotechnical or geologic hazards were observed that would make
the development of the proposed overpass unsuitable. The use of conventional spread
footings are recommended to support the proposed structure.
5
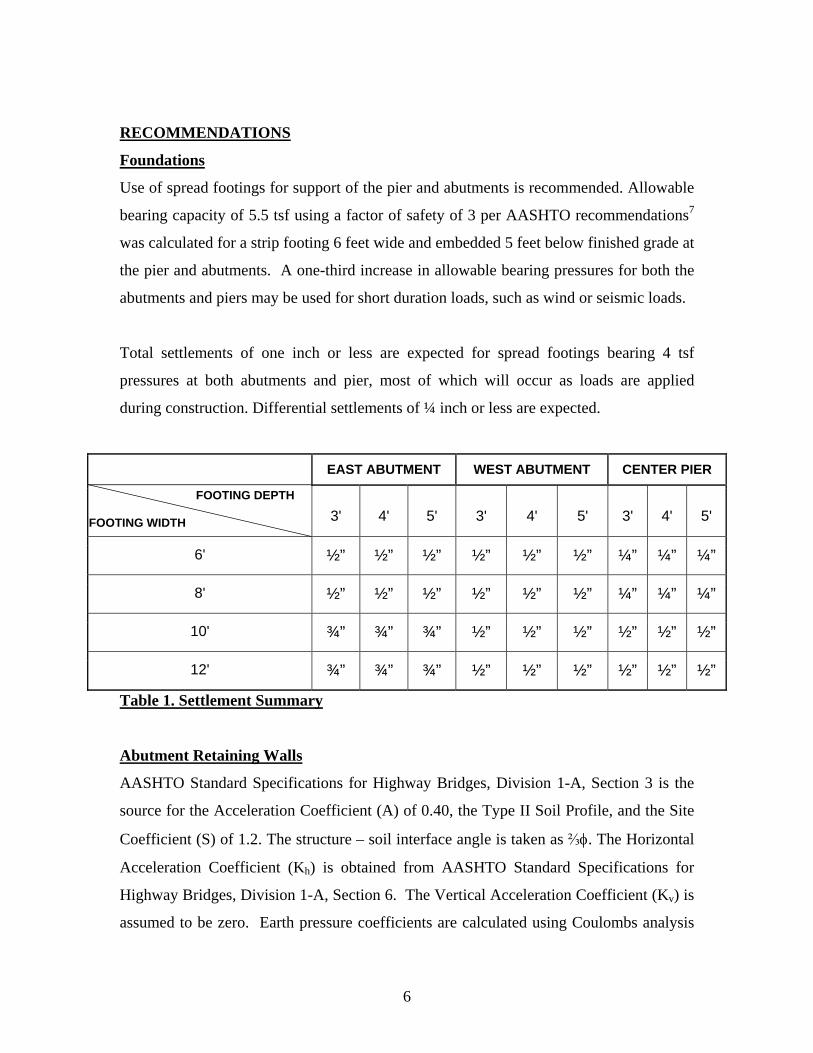
RECOMMENDATIONS
Foundations
Use of spread footings for support of the pier and abutments is recommended. Allowable
bearing capacity of 5.5 tsf using a factor of safety of 3 per AASHTO recommendations7
was calculated for a strip footing 6 feet wide and embedded 5 feet below finished grade at
the pier and abutments. A one-third increase in allowable bearing pressures for both the
abutments and piers may be used for short duration loads, such as wind or seismic loads.
Total settlements of one inch or less are expected for spread footings bearing 4 tsf
pressures at both abutments and pier, most of which will occur as loads are applied
during construction. Differential settlements of ¼ inch or less are expected.
EAST ABUTMENT WEST ABUTMENT CENTER PIER
FOOTING DEPTH FOOTING WIDTH 3' 4' 5' 3' 4' 5' 3' 4' 5'
6' ½” ½” ½” ½” ½” ½” ¼” ¼” ¼”
8' ½” ½” ½” ½” ½” ½” ¼” ¼” ¼”
10' ¾” ¾” ¾” ½” ½” ½” ½” ½” ½”
12' ¾” ¾” ¾” ½” ½” ½” ½” ½” ½”
Table 1. Settlement Summary
Abutment Retaining Walls
AASHTO Standard Specifications for Highway Bridges, Division 1-A, Section 3 is the
source for the Acceleration Coefficient (A) of 0.40, the Type II Soil Profile, and the Site
Coefficient (S) of 1.2. The structure – soil interface angle is taken as ⅔φ. The Horizontal
Acceleration Coefficient (Kh) is obtained from AASHTO Standard Specifications for
Highway Bridges, Division 1-A, Section 6. The Vertical Acceleration Coefficient (Kv) is
assumed to be zero. Earth pressure coefficients are calculated using Coulombs analysis
6

method utilizing the Mononobe-Okabe equation for Ka, Kp, Kae, and Kpe. Design
parameters are found in Table 2:
Design Parameters Abutment/Wall Allowed to Displace
Abutment/Wall Restrained
φ = soil friction angle (native) 34o 34o
ϒ = effective soil unit weight 125 pcf 125 pcf
δ = structure/soil interface angle 22.7o 22.7o
Kh = Horizontal Acceleration Coefficient 0.40 0.40
Kv = Vertical Acceleration Coefficient 0.0 0.0
Ko = At-Rest Earth Pressure Coefficient N/A 0.441
Ka = Active Earth Pressure Coefficient (Coulomb) 0.254 N/A
Kp = Passive Earth Pressure Coefficient (AASHTO after Caquot and Kerisel) 7.44 N/A
Kae = Dynamic Active Earth Pressure Coefficient (Mononobe–Okabe) 0.397 N/A
Kpe = Dynamic Passive Earth Pressure Coefficient (Mononobe–Okabe) 7.30 N/A
Table 2. Recommended Design Parameters for Abutment Retaining Walls
Slope Stability
Slope Stability in this area of the alignment has been analyzed by Black Eagle Consulting
Inc. in their “Draft Geotechnical Investigation for the Thirty Percent Design I-580/
Carson City Bypass Phase 2, Carson City Nevada, June 2003” report prepared for Louis
Berger Group. All permanent slopes should be constructed to lie at a maximum of 2:1
(H:V) slope. A 2:1 slope or flatter is recommended in front of the abutments.
Excavation
All excavation shall be performed in accordance with the NDOT 2001 Standard
Specifications for Road and Bridge Construction. The contractor shall be responsible for
all necessary shoring for any excavation and/or construction. Variable site conditions
include the possibility of encountering large cobbles, boulders, or other adverse soil
conditions.
7
8
REFERENCES
1. Louis Berger Group, 30% Submittal, Construction Plans, E.A. 72781-1, March
22, 2004
2. Bingler, E.C., New Empire Geologic Map; Nevada Bureau of Mines and Geology,
1977, Map No. 59.
3. Bell, J.W., and D.T. Trexler, New Empire Quadrangle Earthquake Hazards Map;
Nevada Bureau of Mines and Geology, 1979, Map No. 1Bi.
4. Pease, R.C., Genoa Quadrangle Earthquake Map; Nevada Bureau of Mines and
Geology, 1979, Map No. 1Ci.
5. Trexler, D.T. and J.W. Bell, Carson City Quadrangle Earthquake Hazards Map;
Nevada Bureau of Mines and Geology, 1979, Map No. 1Ai.
6. dePolo, C., J.G. Anderson, D. M. dePolo, and J.G. Price, “Earthquake Occurrence
in the Reno-Carson City Urban Corridor;” Seismological Research Letters,
Volume 68, May/June, 1997, pages 401-412.
7. AASHTO, Standard Specifications For Highway Bridges; 17th Edition, 2002.
8. State of Nevada Department of Transportation, Standard Specifications for Road
and Bridge Construction; 2001.
9. FHWA, Geotechnical Earthquake Engineering; FHWA HI-99-012, 1998.
10. NAVFAC (Naval Facilities Engineering Command), 1986a, Soil Mechanics,
Design Manual 7.1.
11. NAVFAC (Naval Facilities Engineering Command), 1986b, Foundations and
Earth Structures, Design Manual 7.2.


EA/Cont # 72781-1 Carson City Freeway Bypass @ Koontz Ln.
Boring No. KE1 Elevation (ft) 4733.18 Station O4' 143+57
SAMP- N DRY % SAMPLE LER BLOWS SOIL W% UW PASS LL PL PI TEST C C OTHERS
NO. TYPE per ft. GROUP pcf #200 % % % TYPE deg. psi deg. psi
A2 CMS 25 SM* 17.3* DS* 34 2.11 33 1.31
A2a CMS 6.0 112.3
A2c CMS 4.4 105.8
A2d CMS 4.8 107.5
A1 CMS 25 SM 3.7 108.0 20.3 15 NP NP
B SPT 22/3" SM 12.5 25.0 18 17 1
C CMS 50/4.5" SM 4.3 112.3 21.3 17 NP NP
D2a CMS 110 SM 12.1 47.9 25 NP NP DS* 24 10.41
D2b,c,d CMS 110 SM* 13.7* 21 NP NP DS* 24 10.41
D2b CMS 7.3 107.5
D2c CMS 5.8 102.2
D2d CMS 6.4 100.8
CMS = California Modified Sampler 2.40" ID U = Unconfined Compressive H = Hydrometer CM = CompactionSPT = Standard Penetration 1.38" ID UU = Unconsolidated Undrained S = Sieve E = Swell/Pressure on Expansive SoilsCS = Continuous Sample 3.23" ID CD = Consolidated Drained G = Specific Gravity SL = Shrinkage LimitRC = Rock Core CU = Consolidated Undrained PI = Plasticity Index UW= Unit WeightPB = Pitcher Barrel DS = Direct Shear LL = Liquid Limit W = Moisture ContentCSS = Calif. Split Spoon 2.42" ID = Friction PL = Plastic Limit K = PermeabilityCPT = Cone Penetration Test C = Cohesion NP = Non-Plastic O = Organic ContentTP = Test Pit N = No. of blows per ft., sampler OC = Consolidation D = DispersiveP = Pushed, not driven Ch = Chemical RQD = Rock Quality DesignationR = Refusal N = Field SPT N = (Ncss)(0.62) RV = R - Value X = X-Ray DefractionSh = Shelby Tube 2.87" ID MD = Moisture Density HCpot = Hydro-Collapse Potential
10.9 -11.0
10.8 - 10.9
* = Average of subsamples
6.5 - 7.0
10.7 - 10.8
DS*10.7 - 11.0
10.5 - 10.7
5.0 - 6.0
2.8 - 2.9
3.0 - 3.5
2.7 - 2.8
Residual
2.5 - 2.6
DS*, H2.5 - 2.9
DEPTH(ft)
Peak
SUMMARY OF RESULTSN.D.O.T. GEOTECHNICAL SECTION
SAMPLE STRENGTH TEST
Job Description
EA/Cont # 72781-1 Carson City Freeway Bypass @ Koontz Ln.
Boring No. KE1 Elevation (ft) 4733.18 Station O4' 143+57
SAMP- N DRY % SAMPLE LER BLOWS SOIL W% UW PASS LL PL PI TEST C C OTHERS
NO. TYPE pcf GROUP pcf #200 % % % TYPE deg. psi deg. psi
D1 CMS 110 SP-SM 2.2 115.4 6.0
E SPT 53 SP-SM 20.3 6.0
F2a CMS 96 SP 1.3 2.9
F2b CMS SP 1.4 2.5
F1 CMS SP* 3.0 DS* 45 3.26 37 1.66
F1a CMS 96 11.0 108.3
F1b CMS 9.0 109.8
F1c CMS 7.9 108.7
G2 CMS 110 SC-SM 17.3 29.6 26 21 5
G1 CMS 110 SW-SM 16.5 6.3
H2 CMS 74/5" SP 16.8 105.7 3.9
H1 CMS 74/5" SP* 3.2* DS* 42 6.08 34 2.07
CMS = California Modified Sampler 2.40" ID U = Unconfined Compressive H = Hydrometer CM = CompactionSPT = Standard Penetration 1.38" ID UU = Unconsolidated Undrained S = Sieve E = Swell/Pressure on Expansive SoilsCS = Continuous Sample 3.23" ID CD = Consolidated Drained G = Specific Gravity SL = Shrinkage LimitRC = Rock Core CU = Consolidated Undrained PI = Plasticity Index UW= Unit WeightPB = Pitcher Barrel DS = Direct Shear LL = Liquid Limit W = Moisture ContentCSS = Calif. Split Spoon 2.42" ID = Friction PL = Plastic Limit K = PermeabilityCPT = Cone Penetration Test C = Cohesion NP = Non-Plastic O = Organic ContentTP = Test Pit N = No. of blows per ft., sampler OC = Consolidation D = DispersiveP = Pushed, not driven Ch = Chemical RQD = Rock Quality DesignationR = Refusal N = Field SPT N = (Ncss)(0.62) RV = R - Value X = X-Ray DefractionSh = Shelby Tube 2.87" ID MD = Moisture Density HCpot = Hydro-Collapse Potential
17.2 - 17.3
* = Average of subsamples
14.5 - 15.6
15.6 - 16.0
17.0 - 17.2
14.1 - 14.2
14.2 - 14.5
DEPTH(ft)
11.5 - 13.0
13.5 - 13.75
N.D.O.T. GEOTECHNICAL SECTION
SAMPLE STRENGTH TEST
Job Description
11.0 - 11.5
Peak Residual
SUMMARY OF RESULTS
13.75 - 14.0
14.0 - 14.1
DS*14.0 - 14.5

EA/Cont # 72781-1 Carson City Freeway Bypass @ Koontz Ln.
Boring No. KE1 Elevation (ft) 4733.18 Station O4' 143+57
SAMP- N DRY % SAMPLE LER BLOWS SOIL W% UW PASS LL PL PI TEST C C OTHERS
NO. TYPE ft GROUP pcf #200 % % % TYPE deg. psi deg. psi
H1a CMS 74/5" SP* 11.9 105.1
H1b CMS 11.1 106.8
H1c CMS 9.6 105.6
I SPT 71 SM 16.6 26.5 26 22 4
J CMS 71/0" SM 9.7 20.3 24 23 1
K SPT 87 SM 12.8 37.7 19 NP NP
L1 CMS 43/2" SM* 26.8* 20 NP NP DS* 41 4.92 38 0.61
L1b CMS SM* 11.9 118.1
L1c CMS 11.8 120.0
L1d CMS 11.9 121.0
LA2 CMS 50/3" SM* 28.3* 19 NP NP DS* 40 5.53 33 1.97
LA2a CMS SM* 10.7 120.2
CMS = California Modified Sampler 2.40" ID U = Unconfined Compressive H = Hydrometer CM = CompactionSPT = Standard Penetration 1.38" ID UU = Unconsolidated Undrained S = Sieve E = Swell/Pressure on Expansive SoilsCS = Continuous Sample 3.23" ID CD = Consolidated Drained G = Specific Gravity SL = Shrinkage LimitRC = Rock Core CU = Consolidated Undrained PI = Plasticity Index UW= Unit WeightPB = Pitcher Barrel DS = Direct Shear LL = Liquid Limit W = Moisture ContentCSS = Calif. Split Spoon 2.42" ID = Friction PL = Plastic Limit K = PermeabilityCPT = Cone Penetration Test C = Cohesion NP = Non-Plastic O = Organic ContentTP = Test Pit N = No. of blows per ft., sampler OC = Consolidation D = DispersiveP = Pushed, not driven Ch = Chemical RQD = Rock Quality DesignationR = Refusal N = Field SPT N = (Ncss)(0.62) RV = R - Value X = X-Ray DefractionSh = Shelby Tube 2.87" ID MD = Moisture Density HCpot = Hydro-Collapse Potential
* = Average of subsamples
32.5 - 32.6
33.9 - 34.0
33.9 - 34.2
32.3 - 32.4
32.4 - 32.5
32.3 - 32.4
Residual
22.0 - 22.5
27.3 - 28.5 H
17.4 - 17.5
20.25 - 21.5
17.2 - 17.3
DEPTH(ft)
Peak
SUMMARY OF RESULTSN.D.O.T. GEOTECHNICAL SECTION
SAMPLE STRENGTH TEST
Job Description
17.3 - 17.4
EA/Cont # 72781-1 Carson City Freeway Bypass @ Koontz Ln.
Boring No. KE1 Elevation (ft) 4733.18 Station O4' 143+57
SAMP- N DRY % SAMPLE LER BLOWS SOIL W% UW PASS LL PL PI TEST C C OTHERS
NO. TYPE ft GROUP pcf #200 % % % TYPE deg. psi deg. psi
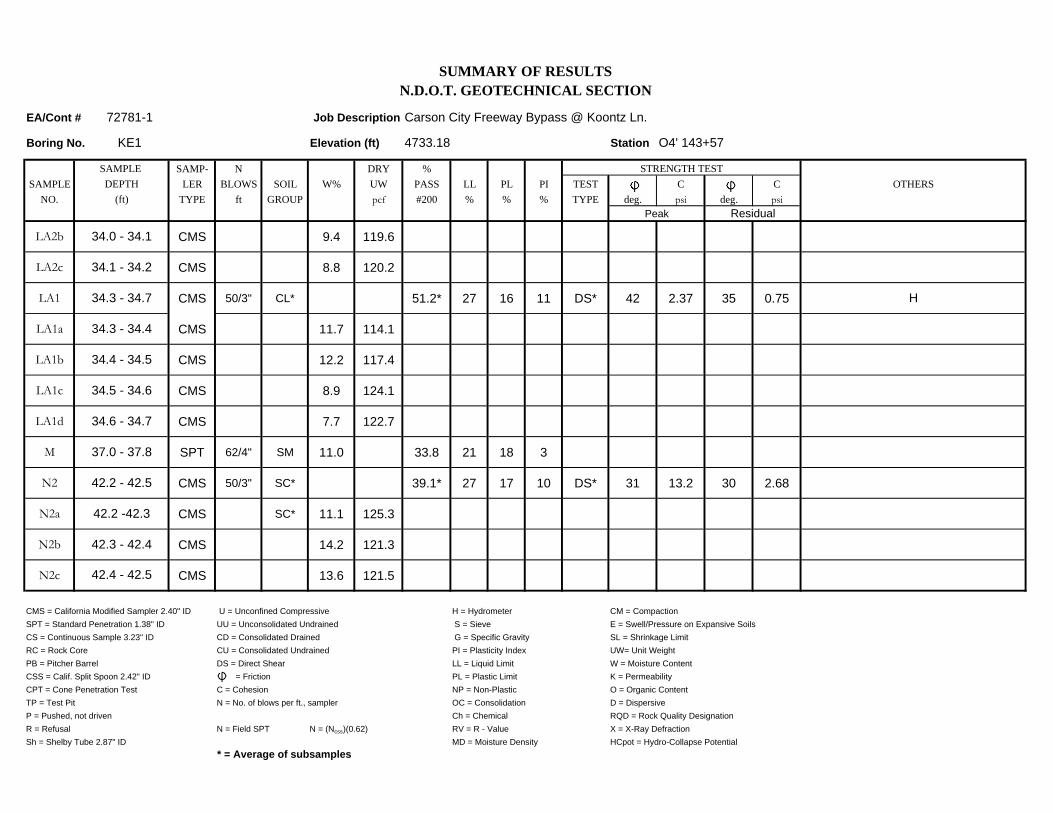
LA2b CMS 9.4 119.6
LA2c CMS 8.8 120.2
LA1 CMS 50/3" CL* 51.2* 27 16 11 DS* 42 2.37 35 0.75
LA1a CMS 11.7 114.1
LA1b CMS 12.2 117.4
LA1c CMS 8.9 124.1
LA1d CMS 7.7 122.7
M SPT 62/4" SM 11.0 33.8 21 18 3
N2 CMS 50/3" SC* 39.1* 27 17 10 DS* 31 13.2 30 2.68
N2a CMS SC* 11.1 125.3
N2b CMS 14.2 121.3
N2c CMS 13.6 121.5
CMS = California Modified Sampler 2.40" ID U = Unconfined Compressive H = Hydrometer CM = CompactionSPT = Standard Penetration 1.38" ID UU = Unconsolidated Undrained S = Sieve E = Swell/Pressure on Expansive SoilsCS = Continuous Sample 3.23" ID CD = Consolidated Drained G = Specific Gravity SL = Shrinkage LimitRC = Rock Core CU = Consolidated Undrained PI = Plasticity Index UW= Unit WeightPB = Pitcher Barrel DS = Direct Shear LL = Liquid Limit W = Moisture ContentCSS = Calif. Split Spoon 2.42" ID = Friction PL = Plastic Limit K = PermeabilityCPT = Cone Penetration Test C = Cohesion NP = Non-Plastic O = Organic ContentTP = Test Pit N = No. of blows per ft., sampler OC = Consolidation D = DispersiveP = Pushed, not driven Ch = Chemical RQD = Rock Quality DesignationR = Refusal N = Field SPT N = (Ncss)(0.62) RV = R - Value X = X-Ray DefractionSh = Shelby Tube 2.87" ID MD = Moisture Density HCpot = Hydro-Collapse Potential
42.2 - 42.5
* = Average of subsamples
42.3 - 42.4
42.4 - 42.5
Residual
37.0 - 37.8
42.2 -42.3
34.3 - 34.7
34.5 - 34.6
34.6 - 34.7
34.3 - 34.4
DEPTH(ft)
Peak
SUMMARY OF RESULTSN.D.O.T. GEOTECHNICAL SECTION
SAMPLE STRENGTH TEST
Job Description
34.4 - 34.5
34.0 - 34.1
34.1 - 34.2
H

EA/Cont # 72781-1 Carson City Freeway Bypass @ Koontz Ln.
Boring No. KE1 Elevation (ft) 4733.18 Station O4' 143+57
SAMP- N DRY % SAMPLE LER BLOWS SOIL W% UW PASS LL PL PI TEST C C OTHERS
NO. TYPE ft GROUP pcf #200 % % % TYPE deg. psi deg. psi
N1 CMS 50/3" SC* 33.2* 27 16 11 DS* 46 2.93 33 1.62
N1a CMS 11.9 119.9
N1b CMS 11.2 126.2
N1c CMS 10.7 128.4
O SPT 40/2" SC-SM 15.9 36.2 23 19 4
P SPT 119 SM 13.0 26.1 19 NP NP
Q3 CMS 104 SC* 40.3* 25 16 9 DS* 32 6.33 32 1.39
Q3a CMS 104 13.2 121.1
Q3b 13.7 118.3
Q3c 11.9 119.5
Q2 CMS 104 SC-SM* 36.4* 21 16 5 DS* 37 6.68 34 3.81
Q2a CMS 104 12.8 124.0
CMS = California Modified Sampler 2.40" ID U = Unconfined Compressive H = Hydrometer CM = CompactionSPT = Standard Penetration 1.38" ID UU = Unconsolidated Undrained S = Sieve E = Swell/Pressure on Expansive SoilsCS = Continuous Sample 3.23" ID CD = Consolidated Drained G = Specific Gravity SL = Shrinkage LimitRC = Rock Core CU = Consolidated Undrained PI = Plasticity Index UW= Unit WeightPB = Pitcher Barrel DS = Direct Shear LL = Liquid Limit W = Moisture ContentCSS = Calif. Split Spoon 2.42" ID = Friction PL = Plastic Limit K = PermeabilityCPT = Cone Penetration Test C = Cohesion NP = Non-Plastic O = Organic ContentTP = Test Pit N = No. of blows per ft., sampler OC = Consolidation D = DispersiveP = Pushed, not driven Ch = Chemical RQD = Rock Quality DesignationR = Refusal N = Field SPT N = (Ncss)(0.62) RV = R - Value X = X-Ray DefractionSh = Shelby Tube 2.87" ID MD = Moisture Density HCpot = Hydro-Collapse Potential
57.0 - 57.3
42.7 - 43.0
57.5 - 57.9
57.5 - 57.6
* = Average of subsamples
(ft)Peak Residual
57.2 - 57.3
42.9 -43.0
47.0 - 47.7
Job Description
SAMPLE STRENGTH TESTDEPTH
SUMMARY OF RESULTSN.D.O.T. GEOTECHNICAL SECTION
57.1 - 57.2
53.5 - 54.5
57.0 -57.1
42.7 - 42.8
42.8 - 42.9
H
H

EA/Cont # 72781-1 Carson City Freeway Bypass @ Koontz Ln.
Boring No. KE1 Elevation (ft) 4733.18 Station 04' 143+57
SAMP- N DRY % SAMPLE LER BLOWS SOIL W% UW PASS LL PL PI TEST C C OTHERS
NO. TYPE ft GROUP pcf #200 % % % TYPE deg. psi deg. psi
Q2b CMS 13.8 121.4
Q2c CMS 13.0 124.9
Q1 CMS 104 SC-SM* 33.1* 21 17 4 DS* 36 7.97 34 1.24
Q1a CMS 104 9.6 122.2
Q1b CMS 11.5 123.9
Q1c CMS 12.7 122.2
R SPT 50/2" SM 14.0 27.8 15 NP NP
S1 CMS 50/3" SM* 25.3* 17 NP NP DS* 42 6.55 35 0.63
S1a CMS 9.8 117.6
S1b CMS 8.7 113.5
S1c CMS 7.9 114.8
T SPT 65 SM 13.3 31.0 21 18 3
CMS = California Modified Sampler 2.40" ID U = Unconfined Compressive H = Hydrometer CM = CompactionSPT = Standard Penetration 1.38" ID UU = Unconsolidated Undrained S = Sieve E = Swell/Pressure on Expansive SoilsCS = Continuous Sample 3.23" ID CD = Consolidated Drained G = Specific Gravity SL = Shrinkage LimitRC = Rock Core CU = Consolidated Undrained PI = Plasticity Index UW= Unit WeightPB = Pitcher Barrel DS = Direct Shear LL = Liquid Limit W = Moisture ContentCSS = Calif. Split Spoon 2.42" ID = Friction PL = Plastic Limit K = PermeabilityCPT = Cone Penetration Test C = Cohesion NP = Non-Plastic O = Organic ContentTP = Test Pit N = No. of blows per ft., sampler OC = Consolidation D = DispersiveP = Pushed, not driven Ch = Chemical RQD = Rock Quality DesignationR = Refusal N = Field SPT N = (Ncss)(0.62) RV = R - Value X = X-Ray DefractionSh = Shelby Tube 2.87" ID MD = Moisture Density HCpot = Hydro-Collapse Potential
67.3 - 67.4
72.2 - 73.5
67.2 - 67.3
* = Average of subsamples
58.0 - 58.3
62.5 - 63.5
57.8 - 57.9
SAMPLE STRENGTH TESTDEPTH
(ft)
H
58.0 - 58.1
Peak
57.6 - 57.7
67.1 - 67.2
58.1 - 58.2
58.2 - 58.3
67.1 - 67.4
SUMMARY OF RESULTSN.D.O.T. GEOTECHNICAL SECTION
Job Description
Residual

EA/Cont # 72781-1 Carson City Freeway Bypass @ Koontz Ln.
Boring No. KE1 Elevation (ft) 4733.18 Station 04' 143+57
SAMP- N DRY % SAMPLE LER BLOWS SOIL W% UW PASS LL PL PI TEST C C OTHERS
NO. TYPE ft GROUP pcf #200 % % % TYPE deg. psi deg. psi
U2 CMS 50/4" SM* 39.6* 21 18 3 DS* 34 7.60 35 0.59
U2a CMS 11.6 121.0
U2b CMS 11.9 122.7
U2c CMS 12.0 122.4
U1 CMS 50/4" SC-SM* 35.8* 25 18 7 DS* 40 3.2 34 1.67
U1a CMS 15.5 118.1
U1b CMS 12.8 121.7
U1c CMS 11.4 126.0
CMS = California Modified Sampler 2.40" ID U = Unconfined Compressive H = Hydrometer CM = CompactionSPT = Standard Penetration 1.38" ID UU = Unconsolidated Undrained S = Sieve E = Swell/Pressure on Expansive SoilsCS = Continuous Sample 3.23" ID CD = Consolidated Drained G = Specific Gravity SL = Shrinkage LimitRC = Rock Core CU = Consolidated Undrained PI = Plasticity Index UW= Unit WeightPB = Pitcher Barrel DS = Direct Shear LL = Liquid Limit W = Moisture ContentCSS = Calif. Split Spoon 2.42" ID = Friction PL = Plastic Limit K = PermeabilityCPT = Cone Penetration Test C = Cohesion NP = Non-Plastic O = Organic ContentTP = Test Pit N = No. of blows per ft., sampler OC = Consolidation D = DispersiveP = Pushed, not driven Ch = Chemical RQD = Rock Quality DesignationR = Refusal N = Field SPT N = (Ncss)(0.62) RV = R - Value X = X-Ray DefractionSh = Shelby Tube 2.87" ID MD = Moisture Density HCpot = Hydro-Collapse Potential
77.7 - 78.0
77.2 - 77.5
77.4 - 77.5
SUMMARY OF RESULTSN.D.O.T. GEOTECHNICAL SECTION
* = Average of subsamples
77.9 - 78.0
77.7 - 77.8
77.8 - 77.9
DEPTH(ft)
Peak Residual
77.3 - 77.4
77.2 - 77.3
Job Description
SAMPLE STRENGTH TEST
SUMMARY OF RESULTSN.D.O.T. GEOTECHNICAL SECTION
EA/Cont # 72781-1 Job Description Carson City Freeway Bypass @ Koontz Ln.
Boring No. KE2 Elevation (ft) 4739.95 Station 04' 143+60
SAMPLE SAMP- N DRY % STRENGTH TEST SAMPLE DEPTH LER BLOWS SOIL W% UW PASS LL PL PI TEST C C OTHERS
NO. (ft) TYPE ft GROUP pcf #200 % % % TYPE deg. psi deg. psi Peak Residual
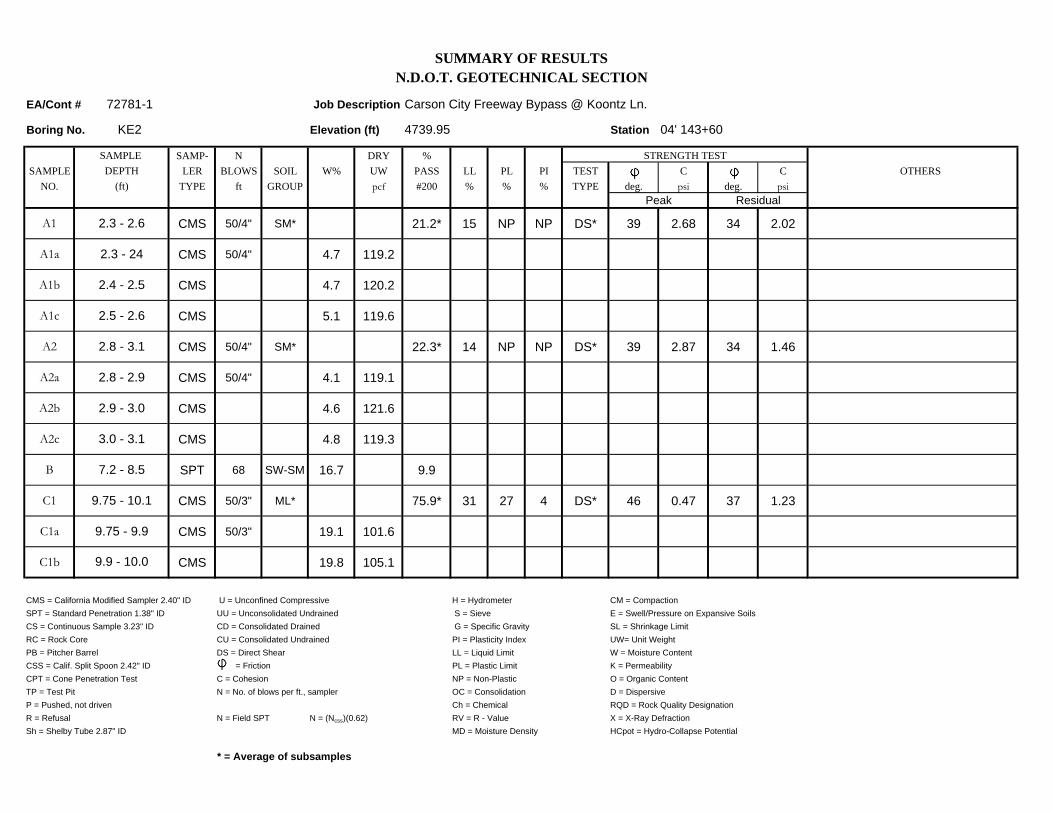
A1 2.3 - 2.6 CMS 50/4" SM* 21.2* 15 NP NP DS* 39 2.68 34 2.02
A1a 2.3 - 24 CMS 50/4" 4.7 119.2
A1b 2.4 - 2.5 CMS 4.7 120.2
A1c 2.5 - 2.6 CMS 5.1 119.6
A2 2.8 - 3.1 CMS 50/4" SM* 22.3* 14 NP NP DS* 39 2.87 34 1.46
A2a 2.8 - 2.9 CMS 50/4" 4.1 119.1
A2b 2.9 - 3.0 CMS 4.6 121.6
A2c 3.0 - 3.1 CMS 4.8 119.3
B 7.2 - 8.5 SPT 68 SW-SM 16.7 9.9
C1 9.75 - 10.1 CMS 50/3" ML* 75.9* 31 27 4 DS* 46 0.47 37 1.23
C1a 9.75 - 9.9 CMS 50/3" 19.1 101.6
C1b 9.9 - 10.0 CMS 19.8 105.1
CMS = California Modified Sampler 2.40" ID U = Unconfined Compressive H = Hydrometer CM = CompactionSPT = Standard Penetration 1.38" ID UU = Unconsolidated Undrained S = Sieve E = Swell/Pressure on Expansive SoilsCS = Continuous Sample 3.23" ID CD = Consolidated Drained G = Specific Gravity SL = Shrinkage LimitRC = Rock Core CU = Consolidated Undrained PI = Plasticity Index UW= Unit WeightPB = Pitcher Barrel DS = Direct Shear LL = Liquid Limit W = Moisture ContentCSS = Calif. Split Spoon 2.42" ID = Friction PL = Plastic Limit K = PermeabilityCPT = Cone Penetration Test C = Cohesion NP = Non-Plastic O = Organic ContentTP = Test Pit N = No. of blows per ft., sampler OC = Consolidation D = DispersiveP = Pushed, not driven Ch = Chemical RQD = Rock Quality DesignationR = Refusal N = Field SPT N = (Ncss)(0.62) RV = R - Value X = X-Ray DefractionSh = Shelby Tube 2.87" ID MD = Moisture Density HCpot = Hydro-Collapse Potential
* = Average of subsamples
SUMMARY OF RESULTSN.D.O.T. GEOTECHNICAL SECTION
EA/Cont # 72781-1 Job Description Carson City Freeway Bypass @ Koontz Ln.
Boring No. KE2 Elevation (ft) 4739.95 Station O4' 143+60
SAMPLE SAMP- N DRY % STRENGTH TEST SAMPLE DEPTH LER BLOWS SOIL W% UW PASS LL PL PI TEST C C OTHERS
NO. (ft) TYPE ft GROUP pcf #200 % % % TYPE deg. psi deg. psi Peak Residual
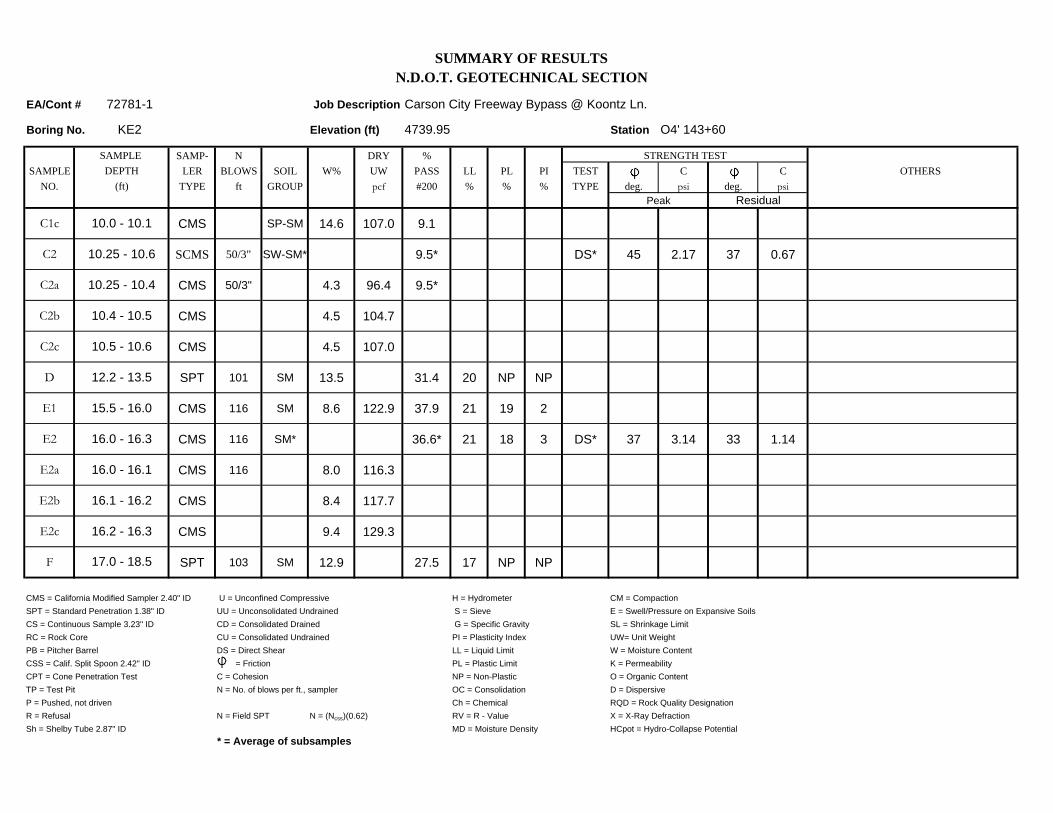
C1c 10.0 - 10.1 CMS SP-SM 14.6 107.0 9.1
C2 10.25 - 10.6 SCMS 50/3" SW-SM* 9.5* DS* 45 2.17 37 0.67
C2a 10.25 - 10.4 CMS 50/3" 4.3 96.4 9.5*
C2b 10.4 - 10.5 CMS 4.5 104.7
C2c 10.5 - 10.6 CMS 4.5 107.0
D 12.2 - 13.5 SPT 101 SM 13.5 31.4 20 NP NP
E1 15.5 - 16.0 CMS 116 SM 8.6 122.9 37.9 21 19 2
E2 16.0 - 16.3 CMS 116 SM* 36.6* 21 18 3 DS* 37 3.14 33 1.14
E2a 16.0 - 16.1 CMS 116 8.0 116.3
E2b 16.1 - 16.2 CMS 8.4 117.7
E2c 16.2 - 16.3 CMS 9.4 129.3
F 17.0 - 18.5 SPT 103 SM 12.9 27.5 17 NP NP
CMS = California Modified Sampler 2.40" ID U = Unconfined Compressive H = Hydrometer CM = CompactionSPT = Standard Penetration 1.38" ID UU = Unconsolidated Undrained S = Sieve E = Swell/Pressure on Expansive SoilsCS = Continuous Sample 3.23" ID CD = Consolidated Drained G = Specific Gravity SL = Shrinkage LimitRC = Rock Core CU = Consolidated Undrained PI = Plasticity Index UW= Unit WeightPB = Pitcher Barrel DS = Direct Shear LL = Liquid Limit W = Moisture ContentCSS = Calif. Split Spoon 2.42" ID = Friction PL = Plastic Limit K = PermeabilityCPT = Cone Penetration Test C = Cohesion NP = Non-Plastic O = Organic ContentTP = Test Pit N = No. of blows per ft., sampler OC = Consolidation D = DispersiveP = Pushed, not driven Ch = Chemical RQD = Rock Quality DesignationR = Refusal N = Field SPT N = (Ncss)(0.62) RV = R - Value X = X-Ray DefractionSh = Shelby Tube 2.87" ID
* = Average of subsamplesMD = Moisture Density HCpot = Hydro-Collapse Potential

SUMMARY OF RESULTSN.D.O.T. GEOTECHNICAL SECTION
EA/Cont # 72781-1 Job Description Carson City Freeway Bypass @ Koontz Ln.
Boring No. KE2 Elevation (ft) 4739.95 Station O4' 143+60
SAMPLE SAMP- N DRY % STRENGTH TEST SAMPLE DEPTH LER BLOWS SOIL W% UW PASS LL PL PI TEST C C OTHERS
NO. (ft) TYPE ft GROUP pcf #200 % % % TYPE deg. psi deg. psi Peak Residual
G1 20.3 - 20.6 CMS 50/3" SC-SM* 32.3* 21 16 5 DS* 43 6.96 33 2.09
G1a 20.3 - 20.4 CMS 50/3" 8.5 124.2
G1b 20.4 - 20.5 CMS 8.8 126.2
G1c 20.5 - 20.6 CMS 9.8 123.8
G2 20.8 - 20.9 CMS 50/3" SC-SM* 36.9* 21 17 4 DS* 38 9.00 37 -0.13
G2a 20.8 - 20.9 CMS 8.2 124.3
G2b 20.9 -21.0 CMS 7.7 125.2
G2c 21.0 - 21.1 CMS 7.5 125.4
H 23.5 - 24.0 SPT 64/6" SM 9.3 30.1
I1 27.5 - 27.8 CMS 87 SM* 36.4* 20 17 3 DS* 39 6.4 32 3.17
I1a 27.5 - 27.6 CMS 8.8 121.2
I1b 27.6 - 27.7 CMS 9.0 120.6
CMS = California Modified Sampler 2.40" ID U = Unconfined Compressive H = Hydrometer CM = CompactionSPT = Standard Penetration 1.38" ID UU = Unconsolidated Undrained S = Sieve E = Swell/Pressure on Expansive SoilsCS = Continuous Sample 3.23" ID CD = Consolidated Drained G = Specific Gravity SL = Shrinkage LimitRC = Rock Core CU = Consolidated Undrained PI = Plasticity Index UW= Unit WeightPB = Pitcher Barrel DS = Direct Shear LL = Liquid Limit W = Moisture ContentCSS = Calif. Split Spoon 2.42" ID = Friction PL = Plastic Limit K = PermeabilityCPT = Cone Penetration Test C = Cohesion NP = Non-Plastic O = Organic ContentTP = Test Pit N = No. of blows per ft., sampler OC = Consolidation D = DispersiveP = Pushed, not driven Ch = Chemical RQD = Rock Quality DesignationR = Refusal N = Field SPT N = (Ncss)(0.62) RV = R - Value X = X-Ray DefractionSh = Shelby Tube 2.87" ID
* = Average of subsamplesMD = Moisture Density HCpot = Hydro-Collapse Potential

SUMMARY OF RESULTSN.D.O.T. GEOTECHNICAL SECTION
EA/Cont # 72781-1 Job Description Carson City Freeway Bypass @ Koontz Ln.
Boring No. KE2 Elevation (ft) 4739.95 Station O4' 143+60
SAMPLE SAMP- N DRY % STRENGTH TEST SAMPLE DEPTH LER BLOWS SOIL W% UW PASS LL PL PI TEST C C OTHERS
NO. (ft) TYPE ft GROUP pcf #200 % % % TYPE deg. psi deg. psi Peak Residual
I1c 27.7 - 27.8 CMS 9.0 123.8
I2 28.0 - 28.3 CMS 87 DS* 33 11.87 32 1.97
I2a 28.0 - 28.1 CMS 8.9 122.1
I2b 28.1 - 28.2 CMS 9.1 124.0
I2c 28.2 - 28.3 CMS 9.3 124.8
J1 32.5 - 32.8 CMS 82 SC-SM* 36.69* 24 18 6 DS* 35 4.15 32 0.93
J1a 32.5 - 32.6 CMS 22.1 102.2
J1b 32.6 - 32.7 CMS 20.7 106.1
J1c 32.7 - 32.8 CMS 15.7 113.5
J2 33.0 - 33.3 CMS 82 SC-SM* 38.8* 22 18 4 DS* 36 8.46 32 1.39
J2a 33.0 - 33.1 CMS 11.2 120.3
J2b 33.1 - 33.2 CMS 10.8 122.3
CMS = California Modified Sampler 2.40" ID U = Unconfined Compressive H = Hydrometer CM = CompactionSPT = Standard Penetration 1.38" ID UU = Unconsolidated Undrained S = Sieve E = Swell/Pressure on Expansive SoilsCS = Continuous Sample 3.23" ID CD = Consolidated Drained G = Specific Gravity SL = Shrinkage LimitRC = Rock Core CU = Consolidated Undrained PI = Plasticity Index UW= Unit WeightPB = Pitcher Barrel DS = Direct Shear LL = Liquid Limit W = Moisture ContentCSS = Calif. Split Spoon 2.42" ID = Friction PL = Plastic Limit K = PermeabilityCPT = Cone Penetration Test C = Cohesion NP = Non-Plastic O = Organic ContentTP = Test Pit N = No. of blows per ft., sampler OC = Consolidation D = DispersiveP = Pushed, not driven Ch = Chemical RQD = Rock Quality DesignationR = Refusal N = Field SPT N = (Ncss)(0.62) RV = R - Value X = X-Ray DefractionSh = Shelby Tube 2.87" ID
* = Average of subsamplesMD = Moisture Density HCpot = Hydro-Collapse Potential

SUMMARY OF RESULTSN.D.O.T. GEOTECHNICAL SECTION
EA/Cont # 72781-1 Job Description Carson City Freeway Bypass @ Koontz Ln.
Boring No. KE2 Elevation (ft) 4739.95 Station O4' 143+60
SAMPLE SAMP- N DRY % STRENGTH TEST SAMPLE DEPTH LER BLOWS SOIL W% UW PASS LL PL PI TEST C C OTHERS
NO. (ft) TYPE ft GROUP pcf #200 % % % TYPE deg. psi deg. psi Peak Residual
J2c 33.2 - 33.3 CMS 10.1 124.4
K 37.0 - 38.2 SPT 50/4" SM 15.7 38.3 22 NP NP
L2 42.7 - 43.2 CMS 50/2" SM 10.7 122.1 41.1 20 19 1
M1 47.5 - 47.8 CMS 78 SC* 36.8* 25 17 8 DS* 41 1.66 42 -4.01
M1a 47.5 - 47.6 CMS 13.6 119.1
M1b 47.6 - 47.7 CMS 15.1 117.0
M1c 47.7 - 47.8 CMS 13.2 119.4
M2 48.0 - 48.3 CMS 78 SM* 37.4* 20 18 2 DS* 37 10.39 34 4.26
M2a 48.0 - 48.1 CMS 11.2 123.6
M2b 48.1 - 48.2 CMS 9.9 124.9
M2c 48.2 -48.3 CMS 9.9 124.8
N 52.0 - 52.25 SPT 50/3" SM 10.0 23.3
CMS = California Modified Sampler 2.40" ID U = Unconfined Compressive H = Hydrometer CM = CompactionSPT = Standard Penetration 1.38" ID UU = Unconsolidated Undrained S = Sieve E = Swell/Pressure on Expansive SoilsCS = Continuous Sample 3.23" ID CD = Consolidated Drained G = Specific Gravity SL = Shrinkage LimitRC = Rock Core CU = Consolidated Undrained PI = Plasticity Index UW= Unit WeightPB = Pitcher Barrel DS = Direct Shear LL = Liquid Limit W = Moisture ContentCSS = Calif. Split Spoon 2.42" ID = Friction PL = Plastic Limit K = PermeabilityCPT = Cone Penetration Test C = Cohesion NP = Non-Plastic O = Organic ContentTP = Test Pit N = No. of blows per ft., sampler OC = Consolidation D = DispersiveP = Pushed, not driven Ch = Chemical RQD = Rock Quality DesignationR = Refusal N = Field SPT N = (Ncss)(0.62) RV = R - Value X = X-Ray DefractionSh = Shelby Tube 2.87" ID
* = Average of subsamplesMD = Moisture Density HCpot = Hydro-Collapse Potential

SUMMARY OF RESULTSN.D.O.T. GEOTECHNICAL SECTION
EA/Cont # 72781-1 Job Description Carson City Freeway Bypass @ Koontz Ln.
Boring No. KE2 Elevation (ft) Station
SAMPLE SAMP- N DRY % STRENGTH TEST SAMPLE DEPTH LER BLOWS SOIL W% UW PASS LL PL PI TEST C C OTHERS
NO. (ft) TYPE ft GROUP pcf #200 % % % TYPE deg. psi deg. psi Peak Residual
O2 57.7 - 58.0 CMS 70/4" SM* 35.9 21 NP NP DS* 35 7.35 35 -0.26
O2a 57.7 - 57.8 CMS 6.6 113.2
O2b 57.8 - 57.9 CMS 6.5 112.0
O2c 57.9 - 58.0 CMS 8.7 110.6
P 62.2 - 63.5 SPT 105 SM 12.2 25.7 17 NP NP
Q2 67.5-67.8 CMS 65/5" SC-SM* 37.0 21 17 4 DS* 41 4.74 33 2.2
Q2a 67.5 -67.6 CMS 8.2 121.8
Q2b 67.6 - 67.7 CMS 11.1 125.0
Q2c 67.7 - 67.8 CMS 12.0 124.5
R 72.0 - 72.9 SPT 60/4" SM 11.2 29.3 19 NP NP
S2 77.0 - 77.4 CMS 60/5" ML 8.8 123.2 51.5 21 20 1
T 82.2 - 82.7 SPT 40/2" ML 14.3 58.7 21 NP NP
CMS = California Modified Sampler 2.40" ID U = Unconfined Compressive H = Hydrometer CM = CompactionSPT = Standard Penetration 1.38" ID UU = Unconsolidated Undrained S = Sieve E = Swell/Pressure on Expansive SoilsCS = Continuous Sample 3.23" ID CD = Consolidated Drained G = Specific Gravity SL = Shrinkage LimitRC = Rock Core CU = Consolidated Undrained PI = Plasticity Index UW= Unit WeightPB = Pitcher Barrel DS = Direct Shear LL = Liquid Limit W = Moisture ContentCSS = Calif. Split Spoon 2.42" ID = Friction PL = Plastic Limit K = PermeabilityCPT = Cone Penetration Test C = Cohesion NP = Non-Plastic O = Organic ContentTP = Test Pit N = No. of blows per ft., sampler OC = Consolidation D = DispersiveP = Pushed, not driven Ch = Chemical RQD = Rock Quality DesignationR = Refusal N = Field SPT N = (Ncss)(0.62) RV = R - Value X = X-Ray DefractionSh = Shelby Tube 2.87" ID
* = Average of subsamplesMD = Moisture Density HCpot = Hydro-Collapse Potential
SUMMARY OF RESULTSN.D.O.T. GEOTECHNICAL SECTION
EA/Cont # 72781-1 Job Description Carson City Freeway Bypass @ Koontz Ln.
Boring No. KE3 Elevation (ft) 4735.15 Station O4" 144+74
SAMPLE SAMP- N DRY % STRENGTH TEST SAMPLE DEPTH LER BLOWS SOIL W% UW PASS LL PL PI TEST ϕ C ϕ C OTHERS
NO. (ft) TYPE ft GROUP pcf #200 % % % TYPE deg. psi deg. psi Peak Residual
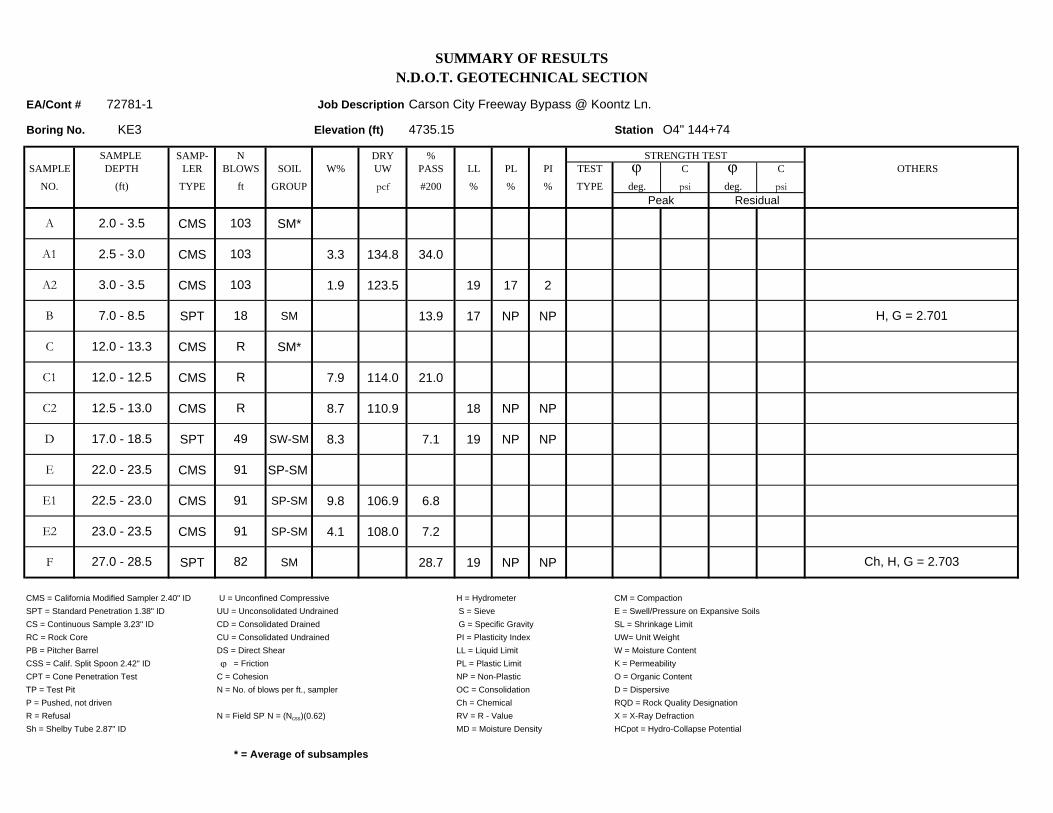
A 2.0 - 3.5 CMS 103 SM*
A1 2.5 - 3.0 CMS 103 3.3 134.8 34.0
A2 3.0 - 3.5 CMS 103 1.9 123.5 19 17 2
B 7.0 - 8.5 SPT 18 SM 13.9 17 NP NP H, G = 2.701
C 12.0 - 13.3 CMS R SM*
C1 12.0 - 12.5 CMS R 7.9 114.0 21.0
C2 12.5 - 13.0 CMS R 8.7 110.9 18 NP NP
D 17.0 - 18.5 SPT 49 SW-SM 8.3 7.1 19 NP NP
E 22.0 - 23.5 CMS 91 SP-SM
E1 22.5 - 23.0 CMS 91 SP-SM 9.8 106.9 6.8
E2 23.0 - 23.5 CMS 91 SP-SM 4.1 108.0 7.2
F 27.0 - 28.5 SPT 82 SM 28.7 19 NP NP Ch, H, G = 2.703
CMS = California Modified Sampler 2.40" ID U = Unconfined Compressive H = Hydrometer CM = CompactionSPT = Standard Penetration 1.38" ID UU = Unconsolidated Undrained S = Sieve E = Swell/Pressure on Expansive SoilsCS = Continuous Sample 3.23" ID CD = Consolidated Drained G = Specific Gravity SL = Shrinkage LimitRC = Rock Core CU = Consolidated Undrained PI = Plasticity Index UW= Unit WeightPB = Pitcher Barrel DS = Direct Shear LL = Liquid Limit W = Moisture ContentCSS = Calif. Split Spoon 2.42" ID ϕ = Friction PL = Plastic Limit K = PermeabilityCPT = Cone Penetration Test C = Cohesion NP = Non-Plastic O = Organic ContentTP = Test Pit N = No. of blows per ft., sampler OC = Consolidation D = DispersiveP = Pushed, not driven Ch = Chemical RQD = Rock Quality DesignationR = Refusal N = Field SPTN = (Ncss)(0.62) RV = R - Value X = X-Ray DefractionSh = Shelby Tube 2.87" ID MD = Moisture Density HCpot = Hydro-Collapse Potential
* = Average of subsamples

SUMMARY OF RESULTSN.D.O.T. GEOTECHNICAL SECTION
EA/Cont # 72781-1 Job Description Carson City Freeway Bypass @ Koontz Ln.
Boring No. KE3 Elevation (ft) 4735.15 Station O4' 144+74
SAMPLE SAMP- N DRY % STRENGTH TEST SAMPLE DEPTH LER BLOWS SOIL W% UW PASS LL PL PI TEST ϕ C ϕ C OTHERS
NO. (ft) TYPE ft GROUP pcf #200 % % % TYPE deg. psi deg. psi Peak Residual
G 28.5 - 30.0 CMS 114 SC*
G1 28.5 - 29.0 CMS 114 9.1 124.1 36.1
G2 29.0 - 29.5 CMS 114 7.6 129.0 25 17 8
H 31.0 - 32.5 SPT R SC-SM 35.2 23 17 6
I 33.0 - 34.5 CMS 74 SC
I1 33.5 - 34.0 CMS 74 SC 10.6 123.2 37.7 29 16 13
I2 34.0 - 34.5 CMS 74 SC 12.5 119.6 41.6 34 17 17 H, G = 2.679
J 35.0 - 36.5 SPT 67 SC 24.2 26 18 8
K 37.0 - 38.3 CMS R 6.9 128.6
L 42.0 - 43.5 SPT 107 SM 16.3 21 NP NP Ch
M 47.0 - 48.0 SPT R SM 5.8 27.5
N 52.0 - 53.0 SPT R SM 6.4 20.1
CMS = California Modified Sampler 2.40" ID U = Unconfined Compressive H = Hydrometer CM = CompactionSPT = Standard Penetration 1.38" ID UU = Unconsolidated Undrained S = Sieve E = Swell/Pressure on Expansive SoilsCS = Continuous Sample 3.23" ID CD = Consolidated Drained G = Specific Gravity SL = Shrinkage LimitRC = Rock Core CU = Consolidated Undrained PI = Plasticity Index UW= Unit WeightPB = Pitcher Barrel DS = Direct Shear LL = Liquid Limit W = Moisture ContentCSS = Calif. Split Spoon 2.42" ID ϕ = Friction PL = Plastic Limit K = PermeabilityCPT = Cone Penetration Test C = Cohesion NP = Non-Plastic O = Organic ContentTP = Test Pit N = No. of blows per ft., sampler OC = Consolidation D = DispersiveP = Pushed, not driven Ch = Chemical RQD = Rock Quality DesignationR = Refusal N = Field SPT N = (Ncss)(0.62) RV = R - Value X = X-Ray DefractionSh = Shelby Tube 2.87" ID
* = Average of subsamplesMD = Moisture Density HCpot = Hydro-Collapse Potential
SUMMARY OF RESULTSN.D.O.T. GEOTECHNICAL SECTION
EA/Cont # 72781-1 Job Description Carson City Freeway Bypass @ Koontz Ln.
Boring No. KE3 Elevation (ft) 4735.15 Station O4' 144+74
SAMPLE SAMP- N DRY % STRENGTH TEST SAMPLE DEPTH LER BLOWS SOIL W% UW PASS LL PL PI TEST ϕ C ϕ C OTHERS
NO. (ft) TYPE ft GROUP pcf #200 % % % TYPE deg. psi deg. psi Peak Residual
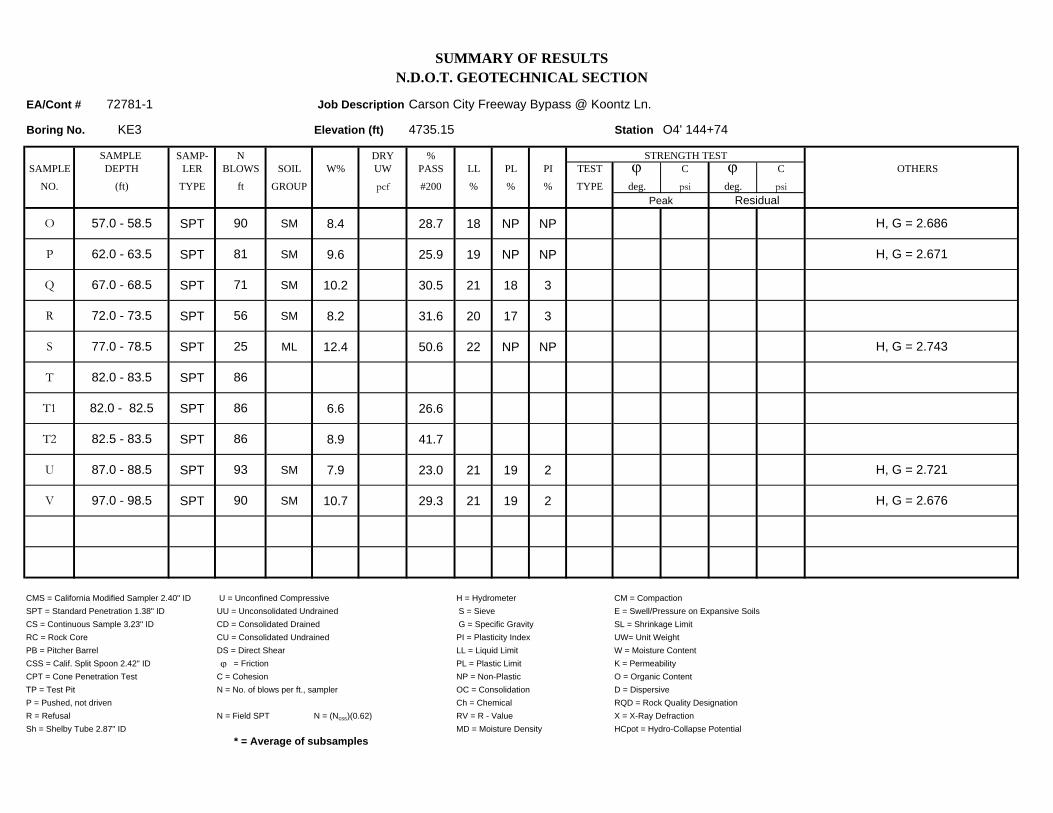
O 57.0 - 58.5 SPT 90 SM 8.4 28.7 18 NP NP H, G = 2.686
P 62.0 - 63.5 SPT 81 SM 9.6 25.9 19 NP NP H, G = 2.671
Q 67.0 - 68.5 SPT 71 SM 10.2 30.5 21 18 3
R 72.0 - 73.5 SPT 56 SM 8.2 31.6 20 17 3
S 77.0 - 78.5 SPT 25 ML 12.4 50.6 22 NP NP H, G = 2.743
T 82.0 - 83.5 SPT 86
T1 82.0 - 82.5 SPT 86 6.6 26.6
T2 82.5 - 83.5 SPT 86 8.9 41.7
U 87.0 - 88.5 SPT 93 SM 7.9 23.0 21 19 2 H, G = 2.721
V 97.0 - 98.5 SPT 90 SM 10.7 29.3 21 19 2 H, G = 2.676
CMS = California Modified Sampler 2.40" ID U = Unconfined Compressive H = Hydrometer CM = CompactionSPT = Standard Penetration 1.38" ID UU = Unconsolidated Undrained S = Sieve E = Swell/Pressure on Expansive SoilsCS = Continuous Sample 3.23" ID CD = Consolidated Drained G = Specific Gravity SL = Shrinkage LimitRC = Rock Core CU = Consolidated Undrained PI = Plasticity Index UW= Unit WeightPB = Pitcher Barrel DS = Direct Shear LL = Liquid Limit W = Moisture ContentCSS = Calif. Split Spoon 2.42" ID ϕ = Friction PL = Plastic Limit K = PermeabilityCPT = Cone Penetration Test C = Cohesion NP = Non-Plastic O = Organic ContentTP = Test Pit N = No. of blows per ft., sampler OC = Consolidation D = DispersiveP = Pushed, not driven Ch = Chemical RQD = Rock Quality DesignationR = Refusal N = Field SPT N = (Ncss)(0.62) RV = R - Value X = X-Ray DefractionSh = Shelby Tube 2.87" ID
* = Average of subsamplesMD = Moisture Density HCpot = Hydro-Collapse Potential

NEVADA DEPARTMENT OF
TRANSPORTATION
Silty sand
Silty sand
Silty sand
inches numbersize size
0.0 7.4 75.3 17.3 SM
0.0 2.2 77.5 20.3 SM NP 15
0.0 7.2 67.8 25.0 SM 17 18
13/41/23/8
100.097.5
95.8100.0
99.2100.0
95.6
#4#10#16#40#50
#100#200
92.688.985.767.856.334.217.3
97.894.791.373.261.638.820.3
92.888.584.267.357.939.325.0
0.3341 0.2869 0.3229
0.1283 0.1094 0.0972
Source of Sample: KE1 Depth: 2.5' Sample Number: A2
Source of Sample: KE1 Depth: 3.0' Sample Number: A1
Source of Sample: KE1 Depth: 5.0' Sample Number: B
CC Freeway @ Koontz Ln.
72781
+3" % GRAVEL % SAND % SILT % CLAY USCS AASHTO PL LL
SIEVE PERCENT FINER SIEVE PERCENT FINER Material Description
GRAIN SIZE REMARKS:
D60
D30
D10
COEFFICIENTS
Cc
Cu
Client:
Project:
Project No.: Figure
PE
RC
EN
T F
INE
R
0
10
20
30
40
50
60
70
80
90
100
GRAIN SIZE - mm.
0.0010.010.1110100
6 in
.
3 in
.
2 in
.
1½
in.
1 in
.
¾ in
.
½ in
.
3/8
in.
#4
#1
0
#2
0
#3
0
#4
0
#6
0
#1
00
#1
40
#2
00
Particle Size Distribution Report

NEVADA DEPARTMENT OF
TRANSPORTATION
Silty sand
Silty sand
Silty sand
inches numbersize size
0.0 0.1 78.6 21.3 SM NP 17
0.0 0.2 51.9 47.9 SM NP 25
0.0 0.1 86.2 13.7 SM NP 21
3/8 100.0 100.0 100.0 #4#10#16#40#50
#100#200
99.999.798.681.264.731.621.3
99.898.194.383.577.766.947.9
99.996.291.379.672.135.413.7
0.2745 0.1127 0.2317
0.1423 0.1327
Source of Sample: KE1 Depth: 6.5' Sample Number: C
Source of Sample: KE1 Depth: 10.5' Sample Number: D2a
Source of Sample: KE1 Depth: 10.7' Sample Number: D2 b,c,d
CC Freeway @ Koontz Ln.
72781
+3" % GRAVEL % SAND % SILT % CLAY USCS AASHTO PL LL
SIEVE PERCENT FINER SIEVE PERCENT FINER Material Description
GRAIN SIZE REMARKS:
D60
D30
D10
COEFFICIENTS
Cc
Cu
Client:
Project:
Project No.: Figure
PE
RC
EN
T F
INE
R
0
10
20
30
40
50
60
70
80
90
100
GRAIN SIZE - mm.
0.0010.010.1110100
6 in
.
3 in
.
2 in
.
1½
in.
1 in
.
¾ in
.
½ in
.
3/8
in.
#4
#1
0
#2
0
#3
0
#4
0
#6
0
#1
00
#1
40
#2
00
Particle Size Distribution Report

NEVADA DEPARTMENT OF
TRANSPORTATION
Poorly graded sand with silt
Poorly graded sand with silt
Poorly graded sand
inches numbersize size
0.0 7.4 86.6 6.0 SP-SM
0.0 1.2 92.8 6.0 SP-SM
0.0 5.2 91.9 2.9 SP
1/23/8
100.099.0 100.0 100.0
#4#10#16#40#50
#100#200
92.675.559.135.727.513.8
6.0
98.892.781.740.925.910.6
6.0
94.874.258.022.411.9
4.92.9
1.2147 0.6503 1.2567
0.3336 0.3326 0.5282
0.1119 0.1419 0.2742
0.82 1.20 0.81
10.86 4.58 4.58
Source of Sample: KE1 Depth: 11.0' Sample Number: D1
Source of Sample: KE1 Depth: 11.5' Sample Number: E
Source of Sample: KE1 Depth: 13.5' Sample Number: F2a
CC Freeway @ Koontz Ln.
72781
+3" % GRAVEL % SAND % SILT % CLAY USCS AASHTO PL LL
SIEVE PERCENT FINER SIEVE PERCENT FINER Material Description
GRAIN SIZE REMARKS:
D60
D30
D10
COEFFICIENTS
Cc
Cu
Client:
Project:
Project No.: Figure
PE
RC
EN
T F
INE
R
0
10
20
30
40
50
60
70
80
90
100
GRAIN SIZE - mm.
0.0010.010.1110100
6 in
.
3 in
.
2 in
.
1½
in.
1 in
.
¾ in
.
½ in
.
3/8
in.
#4
#1
0
#2
0
#3
0
#4
0
#6
0
#1
00
#1
40
#2
00
Particle Size Distribution Report
NEVADA DEPARTMENT OF
TRANSPORTATION
Poorly graded sand
Poorly graded sand
Silty, clayey sand
inches numbersize size
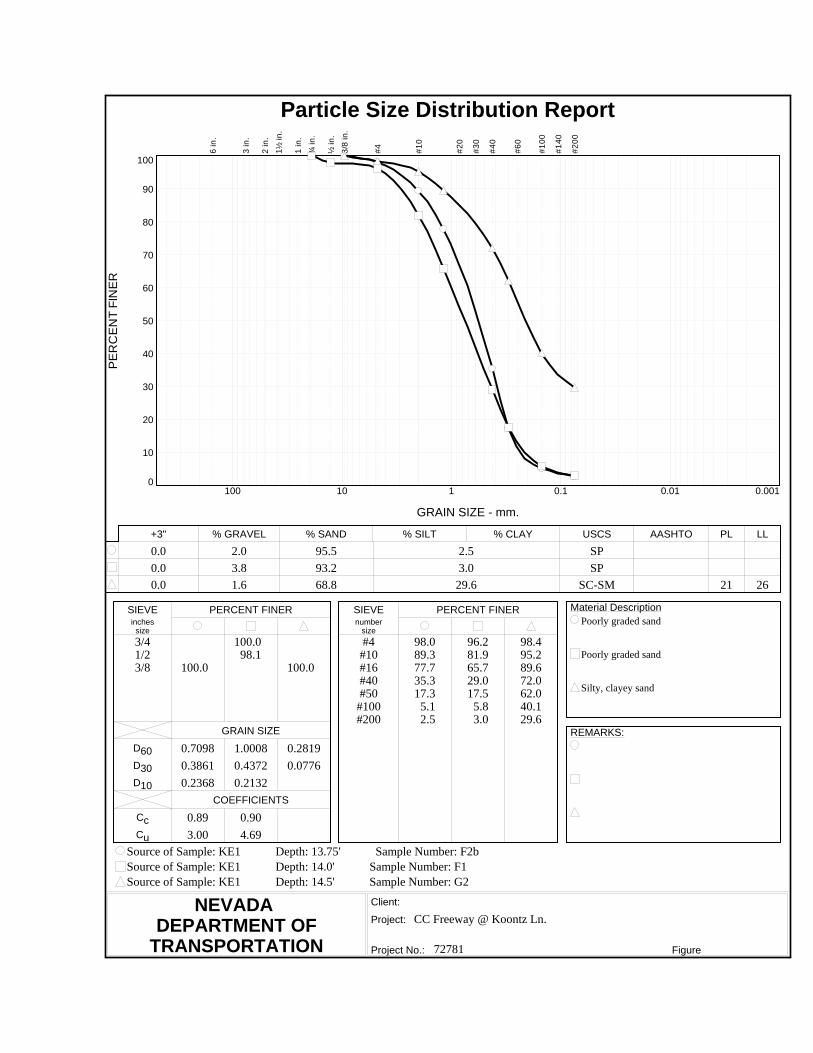
0.0 2.0 95.5 2.5 SP
0.0 3.8 93.2 3.0 SP
0.0 1.6 68.8 29.6 SC-SM 21 26
3/41/23/8 100.0
100.098.1
100.0
#4#10#16#40#50
#100#200
98.089.377.735.317.3
5.12.5
96.281.965.729.017.5
5.83.0
98.495.289.672.062.040.129.6
0.7098 1.0008 0.2819
0.3861 0.4372 0.0776
0.2368 0.2132
0.89 0.90
3.00 4.69
Source of Sample: KE1 Depth: 13.75' Sample Number: F2b
Source of Sample: KE1 Depth: 14.0' Sample Number: F1
Source of Sample: KE1 Depth: 14.5' Sample Number: G2
CC Freeway @ Koontz Ln.
72781
+3" % GRAVEL % SAND % SILT % CLAY USCS AASHTO PL LL
SIEVE PERCENT FINER SIEVE PERCENT FINER Material Description
GRAIN SIZE REMARKS:
D60
D30
D10
COEFFICIENTS
Cc
Cu
Client:
Project:
Project No.: Figure
PE
RC
EN
T F
INE
R
0
10
20
30
40
50
60
70
80
90
100
GRAIN SIZE - mm.
0.0010.010.1110100
6 in
.
3 in
.
2 in
.
1½
in.
1 in
.
¾ in
.
½ in
.
3/8
in.
#4
#1
0
#2
0
#3
0
#4
0
#6
0
#1
00
#1
40
#2
00
Particle Size Distribution Report
NEVADA DEPARTMENT OF
TRANSPORTATION
Well-graded sand with silt
Poorly graded sand
Poorly graded sand
inches numbersize size
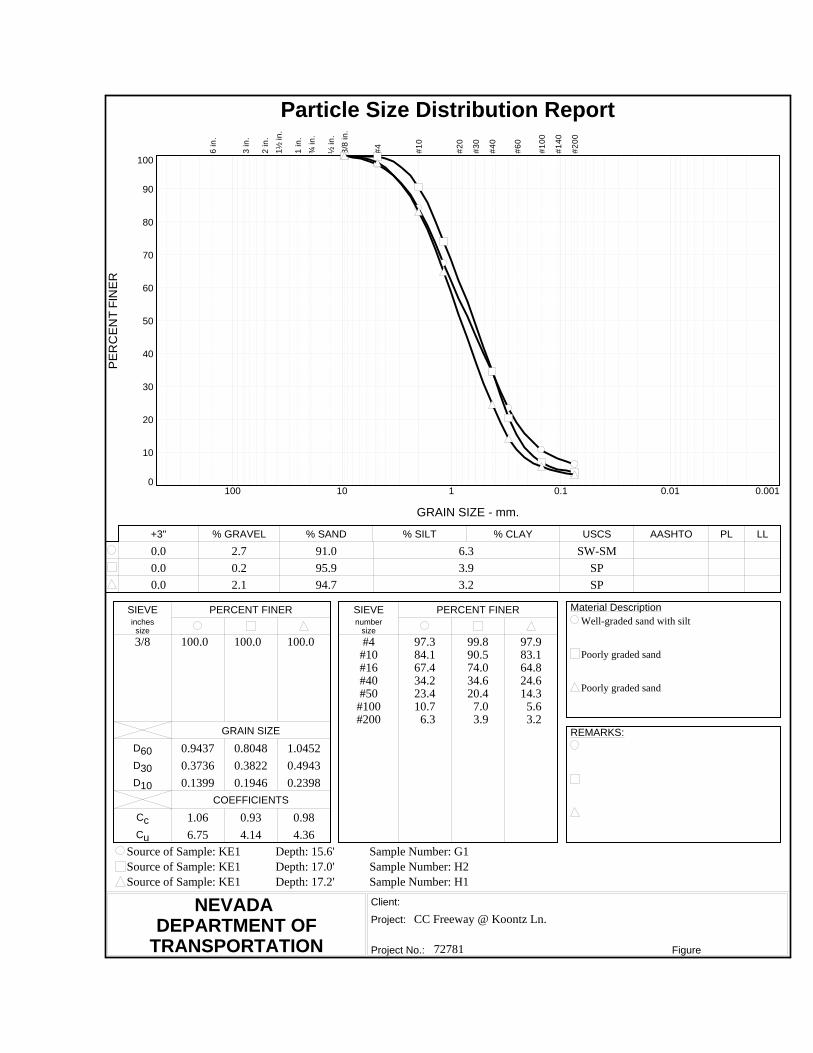
0.0 2.7 91.0 6.3 SW-SM
0.0 0.2 95.9 3.9 SP
0.0 2.1 94.7 3.2 SP
3/8 100.0 100.0 100.0 #4#10#16#40#50
#100#200
97.384.167.434.223.410.7
6.3
99.890.574.034.620.4
7.03.9
97.983.164.824.614.3
5.63.2
0.9437 0.8048 1.0452
0.3736 0.3822 0.4943
0.1399 0.1946 0.2398
1.06 0.93 0.98
6.75 4.14 4.36
Source of Sample: KE1 Depth: 15.6' Sample Number: G1
Source of Sample: KE1 Depth: 17.0' Sample Number: H2
Source of Sample: KE1 Depth: 17.2' Sample Number: H1
CC Freeway @ Koontz Ln.
72781
+3" % GRAVEL % SAND % SILT % CLAY USCS AASHTO PL LL
SIEVE PERCENT FINER SIEVE PERCENT FINER Material Description
GRAIN SIZE REMARKS:
D60
D30
D10
COEFFICIENTS
Cc
Cu
Client:
Project:
Project No.: Figure
PE
RC
EN
T F
INE
R
0
10
20
30
40
50
60
70
80
90
100
GRAIN SIZE - mm.
0.0010.010.1110100
6 in
.
3 in
.
2 in
.
1½
in.
1 in
.
¾ in
.
½ in
.
3/8
in.
#4
#1
0
#2
0
#3
0
#4
0
#6
0
#1
00
#1
40
#2
00
Particle Size Distribution Report

NEVADA DEPARTMENT OF
TRANSPORTATION
Silty sand
Silty sand
Silty sand
inches numbersize size
0.0 0.2 73.3 26.5 SM 22 26
0.0 1.1 78.6 20.3 SM 23 24
0.0 1.6 60.7 31.3 6.4 SM NP 19
3/8 100.0 100.0 100.0 #4#10#16#40#50
#100#200
99.896.591.472.362.643.426.5
98.994.788.765.553.633.620.3
98.494.6
74.5
50.437.7
0.2736 0.3610 0.2284
0.0871 0.1274 0.0491
0.0094
1.13
24.38
Source of Sample: KE1 Depth: 20.25' Sample Number: I
Source of Sample: KE1 Depth: 22.0' Sample Number: J
Source of Sample: KE1 Depth: 27.3' Sample Number: K
CC Freeway @ Koontz Ln.
72781
+3" % GRAVEL % SAND % SILT % CLAY USCS AASHTO PL LL
SIEVE PERCENT FINER SIEVE PERCENT FINER Material Description
GRAIN SIZE REMARKS:
D60
D30
D10
COEFFICIENTS
Cc
Cu
Client:
Project:
Project No.: Figure
PE
RC
EN
T F
INE
R
0
10
20
30
40
50
60
70
80
90
100
GRAIN SIZE - mm.
0.0010.010.1110100
6 in
.
3 in
.
2 in
.
1½
in.
1 in
.
¾ in
.
½ in
.
3/8
in.
#4
#1
0
#2
0
#3
0
#4
0
#6
0
#1
00
#1
40
#2
00
Particle Size Distribution Report

NEVADA DEPARTMENT OF
TRANSPORTATION
Silty sand
Silty sand
Sandy lean clay
inches numbersize size
0.0 2.0 71.2 26.8 SM NP 20
0.0 1.2 70.5 28.3 SM NP 19
0.0 0.4 48.4 37.6 13.6 CL 16 27
3/8 100.0 100.0 100.0 #4#10#16#40#50
#100#200
98.096.894.473.462.041.826.8
98.896.191.871.060.642.428.3
99.698.4
81.8
61.951.2
0.2821 0.2942 0.1325
0.0881 0.0818 0.0274
0.0015
3.86
90.38
Source of Sample: KE1 Depth: 32.2' Sample Number: L1
Source of Sample: KE1 Depth: 33.9' Sample Number: LA2
Source of Sample: KE1 Depth: 34.25' Sample Number: LA1
CC Freeway @ Koontz Ln.
72781
+3" % GRAVEL % SAND % SILT % CLAY USCS AASHTO PL LL
SIEVE PERCENT FINER SIEVE PERCENT FINER Material Description
GRAIN SIZE REMARKS:
D60
D30
D10
COEFFICIENTS
Cc
Cu
Client:
Project:
Project No.: Figure
PE
RC
EN
T F
INE
R
0
10
20
30
40
50
60
70
80
90
100
GRAIN SIZE - mm.
0.0010.010.1110100
6 in
.
3 in
.
2 in
.
1½
in.
1 in
.
¾ in
.
½ in
.
3/8
in.
#4
#1
0
#2
0
#3
0
#4
0
#6
0
#1
00
#1
40
#2
00
Particle Size Distribution Report

NEVADA DEPARTMENT OF
TRANSPORTATION
Silty sand
Clayey sand
Clayey sand
inches numbersize size
0.0 0.4 65.8 33.8 SM 18 21
0.0 0.5 60.4 39.1 SC 17 27
0.0 0.0 66.8 33.2 SC 16 27
3/8 100.0 100.0 #4#10#16#40#50
#100#200
99.697.091.870.660.845.333.8
99.598.896.678.268.151.039.1
100.097.792.271.160.743.333.2
0.2906 0.2228 0.2932
Source of Sample: KE1 Depth: 37.0' Sample Number: M
Source of Sample: KE1 Depth: 42.2' Sample Number: N2
Source of Sample: KE1 Depth: 42.7' Sample Number: N1
CC Freeway @ Koontz Ln.
72781
+3" % GRAVEL % SAND % SILT % CLAY USCS AASHTO PL LL
SIEVE PERCENT FINER SIEVE PERCENT FINER Material Description
GRAIN SIZE REMARKS:
D60
D30
D10
COEFFICIENTS
Cc
Cu
Client:
Project:
Project No.: Figure
PE
RC
EN
T F
INE
R
0
10
20
30
40
50
60
70
80
90
100
GRAIN SIZE - mm.
0.0010.010.1110100
6 in
.
3 in
.
2 in
.
1½
in.
1 in
.
¾ in
.
½ in
.
3/8
in.
#4
#1
0
#2
0
#3
0
#4
0
#6
0
#1
00
#1
40
#2
00
Particle Size Distribution Report

NEVADA DEPARTMENT OF
TRANSPORTATION
Silty, clayey sand
Silty sand
Clayey sand
inches numbersize size
0.0 8.0 55.8 27.4 8.8 SC-SM 19 23
0.0 1.4 72.5 26.1 SM NP 19
0.0 1.2 58.5 40.3 SC 16 25
1/23/8
100.096.1 100.0 100.0
#4#10#16#40#50
#100#200
92.079.3
66.2
50.036.2
98.694.790.770.760.441.226.1
98.897.094.179.771.956.240.3
0.2659 0.2964 0.1777
0.0553 0.0907
0.0065
1.78
41.01
Source of Sample: KE1 Depth: 47.0' Sample Number: O
Source of Sample: KE1 Depth: 53.5' Sample Number: P
Source of Sample: KE1 Depth: 57.0' Sample Number: Q3
CC Freeway @ Koontz Ln.
72781
+3" % GRAVEL % SAND % SILT % CLAY USCS AASHTO PL LL
SIEVE PERCENT FINER SIEVE PERCENT FINER Material Description
GRAIN SIZE REMARKS:
D60
D30
D10
COEFFICIENTS
Cc
Cu
Client:
Project:
Project No.: Figure
PE
RC
EN
T F
INE
R
0
10
20
30
40
50
60
70
80
90
100
GRAIN SIZE - mm.
0.0010.010.1110100
6 in
.
3 in
.
2 in
.
1½
in.
1 in
.
¾ in
.
½ in
.
3/8
in.
#4
#1
0
#2
0
#3
0
#4
0
#6
0
#1
00
#1
40
#2
00
Particle Size Distribution Report
NEVADA DEPARTMENT OF
TRANSPORTATION
Silty, clayey sand
Silty, clayey sand
Silty sand
inches numbersize size
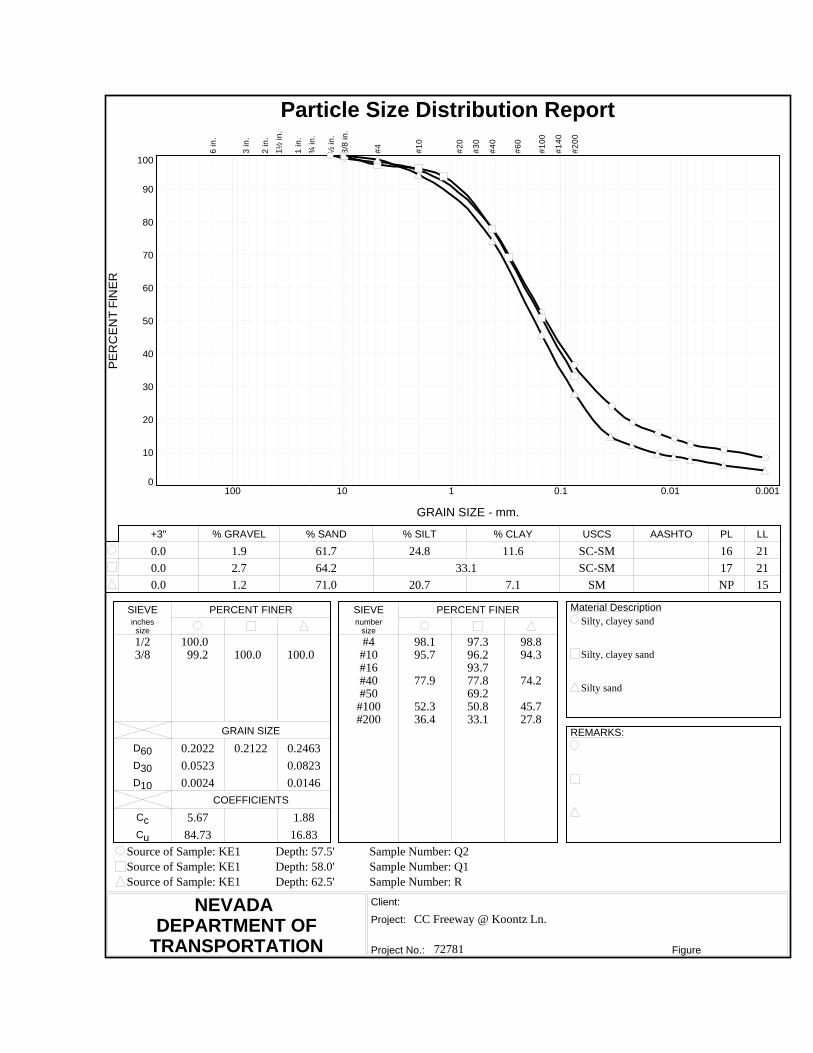
0.0 1.9 61.7 24.8 11.6 SC-SM 16 21
0.0 2.7 64.2 33.1 SC-SM 17 21
0.0 1.2 71.0 20.7 7.1 SM NP 15
1/23/8
100.099.2 100.0 100.0
#4#10#16#40#50
#100#200
98.195.7
77.9
52.336.4
97.396.293.777.869.250.833.1
98.894.3
74.2
45.727.8
0.2022 0.2122 0.2463
0.0523 0.0823
0.0024 0.0146
5.67 1.88
84.73 16.83
Source of Sample: KE1 Depth: 57.5' Sample Number: Q2
Source of Sample: KE1 Depth: 58.0' Sample Number: Q1
Source of Sample: KE1 Depth: 62.5' Sample Number: R
CC Freeway @ Koontz Ln.
72781
+3" % GRAVEL % SAND % SILT % CLAY USCS AASHTO PL LL
SIEVE PERCENT FINER SIEVE PERCENT FINER Material Description
GRAIN SIZE REMARKS:
D60
D30
D10
COEFFICIENTS
Cc
Cu
Client:
Project:
Project No.: Figure
PE
RC
EN
T F
INE
R
0
10
20
30
40
50
60
70
80
90
100
GRAIN SIZE - mm.
0.0010.010.1110100
6 in
.
3 in
.
2 in
.
1½
in.
1 in
.
¾ in
.
½ in
.
3/8
in.
#4
#1
0
#2
0
#3
0
#4
0
#6
0
#1
00
#1
40
#2
00
Particle Size Distribution Report
NEVADA DEPARTMENT OF
TRANSPORTATION
Silty sand
Silty sand
Silty sand
inches numbersize size
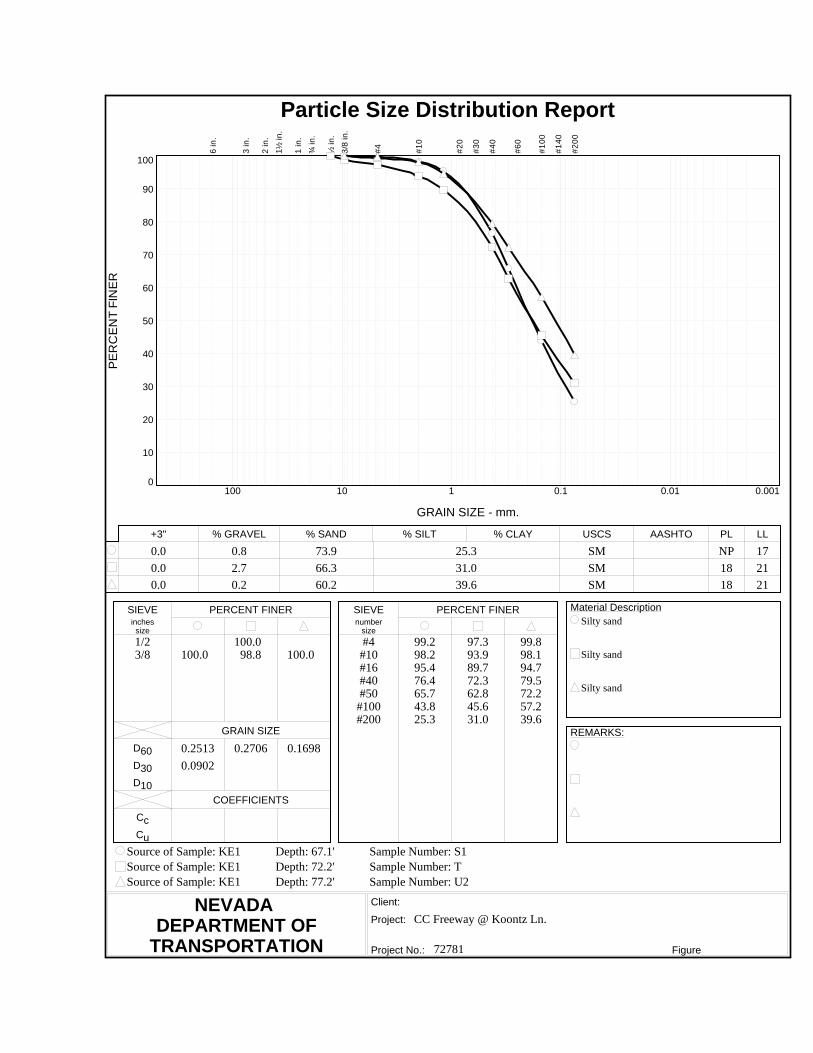
0.0 0.8 73.9 25.3 SM NP 17
0.0 2.7 66.3 31.0 SM 18 21
0.0 0.2 60.2 39.6 SM 18 21
1/23/8 100.0
100.098.8 100.0
#4#10#16#40#50
#100#200
99.298.295.476.465.743.825.3
97.393.989.772.362.845.631.0
99.898.194.779.572.257.239.6
0.2513 0.2706 0.1698
0.0902
Source of Sample: KE1 Depth: 67.1' Sample Number: S1
Source of Sample: KE1 Depth: 72.2' Sample Number: T
Source of Sample: KE1 Depth: 77.2' Sample Number: U2
CC Freeway @ Koontz Ln.
72781
+3" % GRAVEL % SAND % SILT % CLAY USCS AASHTO PL LL
SIEVE PERCENT FINER SIEVE PERCENT FINER Material Description
GRAIN SIZE REMARKS:
D60
D30
D10
COEFFICIENTS
Cc
Cu
Client:
Project:
Project No.: Figure
PE
RC
EN
T F
INE
R
0
10
20
30
40
50
60
70
80
90
100
GRAIN SIZE - mm.
0.0010.010.1110100
6 in
.
3 in
.
2 in
.
1½
in.
1 in
.
¾ in
.
½ in
.
3/8
in.
#4
#1
0
#2
0
#3
0
#4
0
#6
0
#1
00
#1
40
#2
00
Particle Size Distribution Report
NEVADA DEPARTMENT OF
TRANSPORTATION
Silty, clayey sandinches numbersize size
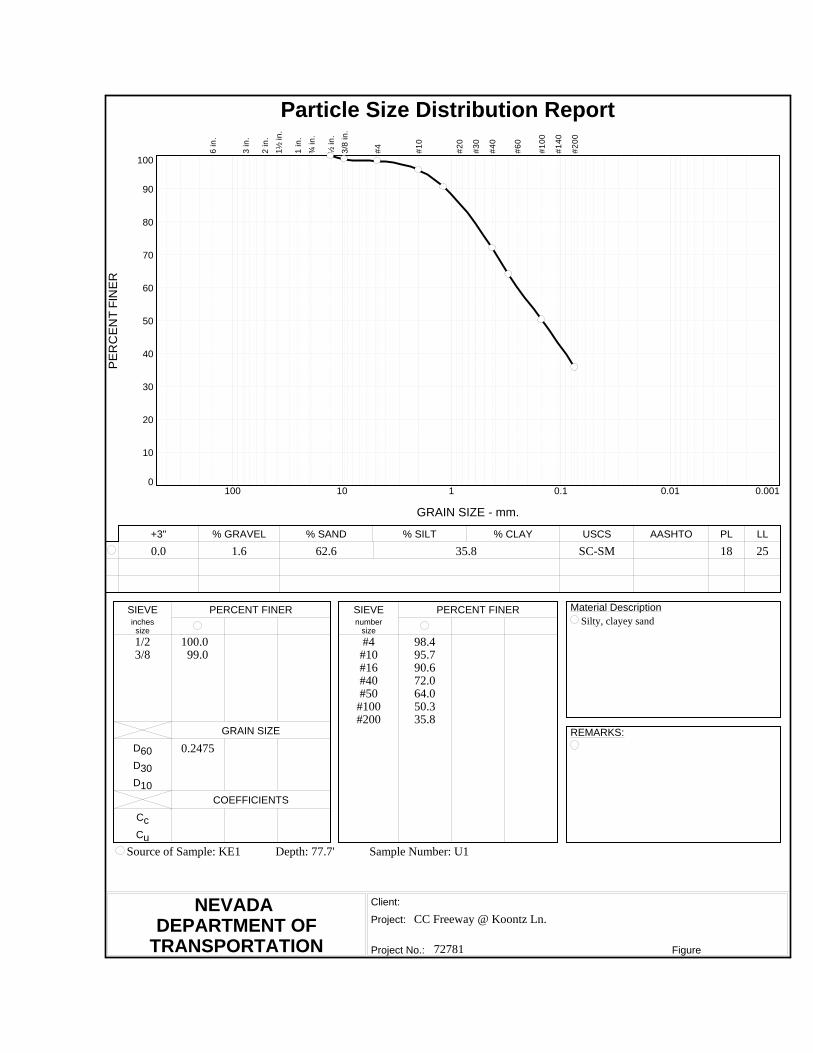
0.0 1.6 62.6 35.8 SC-SM 18 25
1/23/8
100.099.0
#4#10#16#40#50
#100#200
98.495.790.672.064.050.335.8
0.2475
Source of Sample: KE1 Depth: 77.7' Sample Number: U1
CC Freeway @ Koontz Ln.
72781
+3" % GRAVEL % SAND % SILT % CLAY USCS AASHTO PL LL
SIEVE PERCENT FINER SIEVE PERCENT FINER Material Description
GRAIN SIZE REMARKS:
D60
D30
D10
COEFFICIENTS
Cc
Cu
Client:
Project:
Project No.: Figure
PE
RC
EN
T F
INE
R
0
10
20
30
40
50
60
70
80
90
100
GRAIN SIZE - mm.
0.0010.010.1110100
6 in
.
3 in
.
2 in
.
1½
in.
1 in
.
¾ in
.
½ in
.
3/8
in.
#4
#1
0
#2
0
#3
0
#4
0
#6
0
#1
00
#1
40
#2
00
Particle Size Distribution Report

NEVADA DEPARTMENT OF
TRANSPORTATION
Silty sand
Silty sand
Well-graded sand with silt
inches numbersize size
0.0 4.6 74.2 21.2 SM NP
0.0 3.5 74.2 22.3 SM NP 14
0.0 3.0 87.1 9.9 SW-SM
3/41/23/8
100.097.596.7
100.098.1
100.0
#4#10#16#40#50
#100#200
95.492.186.766.355.235.421.2
96.593.186.763.352.233.422.3
97.085.574.546.933.715.9
9.9
0.3474 0.3826 0.6439
0.1180 0.1257 0.2698
0.0768
1.47
8.39
Source of Sample: KE2 Depth: 2.3' Sample Number: A1
Source of Sample: KE2 Depth: 2.8' Sample Number: A2
Source of Sample: KE2 Depth: 7.2' Sample Number: B
CC Freeway @ Koontz Ln.
72781
+3" % GRAVEL % SAND % SILT % CLAY USCS AASHTO PL LL
SIEVE PERCENT FINER SIEVE PERCENT FINER Material Description
GRAIN SIZE REMARKS:
D60
D30
D10
COEFFICIENTS
Cc
Cu
Client:
Project:
Project No.: Figure
PE
RC
EN
T F
INE
R
0
10
20
30
40
50
60
70
80
90
100
GRAIN SIZE - mm.
0.0010.010.1110100
6 in
.
3 in
.
2 in
.
1½
in.
1 in
.
¾ in
.
½ in
.
3/8
in.
#4
#1
0
#2
0
#3
0
#4
0
#6
0
#1
00
#1
40
#2
00
Particle Size Distribution Report

NEVADA DEPARTMENT OF
TRANSPORTATION
Silt with sand
Poorly graded sand with silt
Well-graded sand with silt
inches numbersize size
0.0 0.0 24.1 62.1 13.8 ML 27 31
0.0 0.0 90.9 9.1 SP-SM
0.0 0.1 90.4 9.5 SW-SM
3/8 100.0 #4#10#16#40#50
#100#200
100.0
98.5
92.975.9
100.096.487.950.734.114.7
9.1
99.996.585.642.527.613.8
9.5
0.0488 0.5195 0.6175
0.0163 0.2710 0.3197
0.0034 0.0902 0.0834
1.62 1.57 1.99
14.47 5.76 7.41
Source of Sample: KE2 Depth: 9.75' Sample Number: C1 a&b
Source of Sample: KE2 Depth: 10.1' Sample Number: C1 c
Source of Sample: KE2 Depth: 10.25' Sample Number: C2
CC Freeway @ Koontz Ln.
72781
+3" % GRAVEL % SAND % SILT % CLAY USCS AASHTO PL LL
SIEVE PERCENT FINER SIEVE PERCENT FINER Material Description
GRAIN SIZE REMARKS:
D60
D30
D10
COEFFICIENTS
Cc
Cu
Client:
Project:
Project No.: Figure
PE
RC
EN
T F
INE
R
0
10
20
30
40
50
60
70
80
90
100
GRAIN SIZE - mm.
0.0010.010.1110100
6 in
.
3 in
.
2 in
.
1½
in.
1 in
.
¾ in
.
½ in
.
3/8
in.
#4
#1
0
#2
0
#3
0
#4
0
#6
0
#1
00
#1
40
#2
00
Particle Size Distribution Report

NEVADA DEPARTMENT OF
TRANSPORTATION
Silty sand
Silty sand
Silty sand
inches numbersize size
0.0 1.0 67.6 31.4 SM NP 20
0.0 1.0 61.1 37.9 SM 19 21
0.0 9.0 54.4 29.4 7.2 SM 18 21
1.51
3/8 100.0 100.0
100.093.792.7
#4#10#16#40#50
#100#200
99.097.093.674.564.446.931.4
99.097.694.876.766.550.037.9
91.086.9
70.1
47.936.6
0.2557 0.2351 0.2640
0.0506
0.0093
1.04
28.41
Source of Sample: KE2 Depth: 12.2' Sample Number: D
Source of Sample: KE2 Depth: 15.5' Sample Number: E1
Source of Sample: KE2 Depth: 16.0' Sample Number: E2
CC Freeway @ Koontz Ln.
72781
+3" % GRAVEL % SAND % SILT % CLAY USCS AASHTO PL LL
SIEVE PERCENT FINER SIEVE PERCENT FINER Material Description
GRAIN SIZE REMARKS:
D60
D30
D10
COEFFICIENTS
Cc
Cu
Client:
Project:
Project No.: Figure
PE
RC
EN
T F
INE
R
0
10
20
30
40
50
60
70
80
90
100
GRAIN SIZE - mm.
0.0010.010.1110100
6 in
.
3 in
.
2 in
.
1½
in.
1 in
.
¾ in
.
½ in
.
3/8
in.
#4
#1
0
#2
0
#3
0
#4
0
#6
0
#1
00
#1
40
#2
00
Particle Size Distribution Report
NEVADA DEPARTMENT OF
TRANSPORTATION
Silty sand
Silty, clayey sand
Silty, clayey sand
inches numbersize size
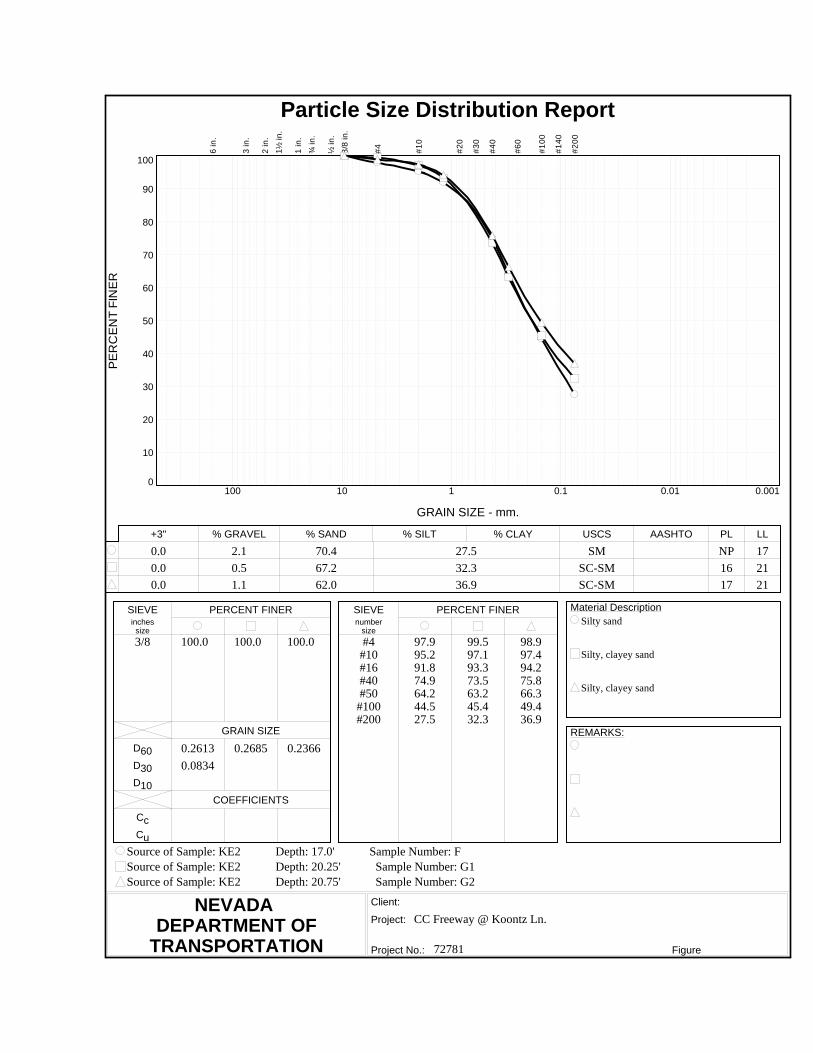
0.0 2.1 70.4 27.5 SM NP 17
0.0 0.5 67.2 32.3 SC-SM 16 21
0.0 1.1 62.0 36.9 SC-SM 17 21
3/8 100.0 100.0 100.0 #4#10#16#40#50
#100#200
97.995.291.874.964.244.527.5
99.597.193.373.563.245.432.3
98.997.494.275.866.349.436.9
0.2613 0.2685 0.2366
0.0834
Source of Sample: KE2 Depth: 17.0' Sample Number: F
Source of Sample: KE2 Depth: 20.25' Sample Number: G1
Source of Sample: KE2 Depth: 20.75' Sample Number: G2
CC Freeway @ Koontz Ln.
72781
+3" % GRAVEL % SAND % SILT % CLAY USCS AASHTO PL LL
SIEVE PERCENT FINER SIEVE PERCENT FINER Material Description
GRAIN SIZE REMARKS:
D60
D30
D10
COEFFICIENTS
Cc
Cu
Client:
Project:
Project No.: Figure
PE
RC
EN
T F
INE
R
0
10
20
30
40
50
60
70
80
90
100
GRAIN SIZE - mm.
0.0010.010.1110100
6 in
.
3 in
.
2 in
.
1½
in.
1 in
.
¾ in
.
½ in
.
3/8
in.
#4
#1
0
#2
0
#3
0
#4
0
#6
0
#1
00
#1
40
#2
00
Particle Size Distribution Report

NEVADA DEPARTMENT OF
TRANSPORTATION
Silty sand
Silty sand
Silty, clayey sand
inches numbersize size
0.0 3.2 66.7 30.1 SM
0.0 0.9 62.7 36.4 SM 17 20
0.0 0.2 62.9 36.9 SC-SM 18 24
3/8 100.0 100.0 100.0 #4#10#16#40#50
#100#200
96.890.886.067.658.141.330.1
99.197.693.474.464.949.036.4
99.898.996.978.668.952.036.9
0.3215 0.2476 0.2119
Source of Sample: KE2 Depth: 23.5' Sample Number: H
Source of Sample: KE2 Depth: 27.5' Sample Number: I1
Source of Sample: KE2 Depth: 32.5' Sample Number: J1
CC Freeway @ Koontz Ln.
72781
+3" % GRAVEL % SAND % SILT % CLAY USCS AASHTO PL LL
SIEVE PERCENT FINER SIEVE PERCENT FINER Material Description
GRAIN SIZE REMARKS:
D60
D30
D10
COEFFICIENTS
Cc
Cu
Client:
Project:
Project No.: Figure
PE
RC
EN
T F
INE
R
0
10
20
30
40
50
60
70
80
90
100
GRAIN SIZE - mm.
0.0010.010.1110100
6 in
.
3 in
.
2 in
.
1½
in.
1 in
.
¾ in
.
½ in
.
3/8
in.
#4
#1
0
#2
0
#3
0
#4
0
#6
0
#1
00
#1
40
#2
00
Particle Size Distribution Report

NEVADA DEPARTMENT OF
TRANSPORTATION
Silty, clayey sand
Silty sand
Silty sand
inches numbersize size
0.0 0.5 60.7 38.8 SC-SM 18 22
0.0 0.5 61.2 33.2 5.1 SM NP 22
0.0 4.2 54.7 41.1 SM 19 20
3/8 100.0 100.0 100.0 #4#10#16#40#50
#100#200
99.598.896.877.967.751.738.8
99.598.2
82.9
60.838.3
95.892.289.077.971.857.341.1
0.2214 0.1462 0.1692
0.0560
0.0127
1.68
11.47
Source of Sample: KE2 Depth: 33.0' Sample Number: J2
Source of Sample: KE2 Depth: 37.0' Sample Number: K
Source of Sample: KE2 Depth: 42.7' Sample Number: L2
CC Freeway @ Koontz Ln.
72781
+3" % GRAVEL % SAND % SILT % CLAY USCS AASHTO PL LL
SIEVE PERCENT FINER SIEVE PERCENT FINER Material Description
GRAIN SIZE REMARKS:
D60
D30
D10
COEFFICIENTS
Cc
Cu
Client:
Project:
Project No.: Figure
PE
RC
EN
T F
INE
R
0
10
20
30
40
50
60
70
80
90
100
GRAIN SIZE - mm.
0.0010.010.1110100
6 in
.
3 in
.
2 in
.
1½
in.
1 in
.
¾ in
.
½ in
.
3/8
in.
#4
#1
0
#2
0
#3
0
#4
0
#6
0
#1
00
#1
40
#2
00
Particle Size Distribution Report

NEVADA DEPARTMENT OF
TRANSPORTATION
Clayey sand
Silty sand
Silty sand
inches numbersize size
0.0 8.8 54.4 36.8 SC 17 25
0.0 1.3 64.0 34.7 SM 18 20
0.0 1.6 75.1 23.3 SM
1.51
3/8
100.092.6
100.0 100.0
#4#10#16#40#50
#100#200
91.290.188.476.568.952.136.8
98.797.194.880.671.451.134.7
98.496.092.374.263.742.723.3
0.2078 0.2048 0.2665
0.0956
Source of Sample: KE2 Depth: 47.5' Sample Number: M1
Source of Sample: KE2 Depth: 48.0' Sample Number: M2
Source of Sample: KE2 Depth: 52.0' Sample Number: N
CC Freeway @ Koontz Ln.
72781
+3" % GRAVEL % SAND % SILT % CLAY USCS AASHTO PL LL
SIEVE PERCENT FINER SIEVE PERCENT FINER Material Description
GRAIN SIZE REMARKS:
D60
D30
D10
COEFFICIENTS
Cc
Cu
Client:
Project:
Project No.: Figure
PE
RC
EN
T F
INE
R
0
10
20
30
40
50
60
70
80
90
100
GRAIN SIZE - mm.
0.0010.010.1110100
6 in
.
3 in
.
2 in
.
1½
in.
1 in
.
¾ in
.
½ in
.
3/8
in.
#4
#1
0
#2
0
#3
0
#4
0
#6
0
#1
00
#1
40
#2
00
Particle Size Distribution Report

NEVADA DEPARTMENT OF
TRANSPORTATION
Silty sand
Silty sand
Silty, clayey sand
inches numbersize size
0.0 0.2 63.9 35.9 SM NP 21
0.0 8.9 65.4 25.7 SM NP 17
0.0 2.1 60.9 37.0 SC-SM 17 21
3/41/23/8 100.0
100.095.193.8 100.0
#4#10#16#40#50
#100#200
99.899.497.886.680.963.935.9
91.188.184.467.257.740.325.7
97.996.393.877.167.950.937.0
0.1339 0.3258 0.2211
0.0927
Source of Sample: KE2 Depth: 57.7' Sample Number: O2
Source of Sample: KE2 Depth: 62.2' Sample Number: P
Source of Sample: KE2 Depth: 67.4' Sample Number: Q2
CC Freeway @ Koontz Ln.
72781
+3" % GRAVEL % SAND % SILT % CLAY USCS AASHTO PL LL
SIEVE PERCENT FINER SIEVE PERCENT FINER Material Description
GRAIN SIZE REMARKS:
D60
D30
D10
COEFFICIENTS
Cc
Cu
Client:
Project:
Project No.: Figure
PE
RC
EN
T F
INE
R
0
10
20
30
40
50
60
70
80
90
100
GRAIN SIZE - mm.
0.0010.010.1110100
6 in
.
3 in
.
2 in
.
1½
in.
1 in
.
¾ in
.
½ in
.
3/8
in.
#4
#1
0
#2
0
#3
0
#4
0
#6
0
#1
00
#1
40
#2
00
Particle Size Distribution Report

NEVADA DEPARTMENT OF
TRANSPORTATION
Silty sand
Sandy silt
Sandy silt
inches numbersize size
0.0 0.5 70.2 29.3 SM NP 19
0.0 1.5 47.0 51.5 ML 20 21
0.0 0.0 41.3 53.1 5.6 ML NP 21
3/8 100.0 100.0 #4#10#16#40#50
#100#200
99.595.989.066.958.143.929.3
98.596.493.479.774.063.751.5
100.098.3
88.2
74.258.7
0.3249 0.1197 0.0785
0.0775 0.0322
0.0095
1.39
8.25
Source of Sample: KE2 Depth: 72.0' Sample Number: R
Source of Sample: KE2 Depth: 77.0' Sample Number: S2
Source of Sample: KE2 Depth: 82.2' Sample Number: T
CC Freeway @ Koontz Ln.
72781
+3" % GRAVEL % SAND % SILT % CLAY USCS AASHTO PL LL
SIEVE PERCENT FINER SIEVE PERCENT FINER Material Description
GRAIN SIZE REMARKS:
D60
D30
D10
COEFFICIENTS
Cc
Cu
Client:
Project:
Project No.: Figure
PE
RC
EN
T F
INE
R
0
10
20
30
40
50
60
70
80
90
100
GRAIN SIZE - mm.
0.0010.010.1110100
6 in
.
3 in
.
2 in
.
1½
in.
1 in
.
¾ in
.
½ in
.
3/8
in.
#4
#1
0
#2
0
#3
0
#4
0
#6
0
#1
00
#1
40
#2
00
Particle Size Distribution Report

NEVADA DEPARTMENT OF
TRANSPORTATION
Silty sand with gravel
Silty sand
Silty sand
PI-LL information taken from sample A2.
PI-LL information taken from sample C2.
inches numbersize size
0.0 20.0 46.0 34.0 SM 17 19
0.0 1.3 84.8 11.4 2.5 SM NP 17
0.0 1.5 77.5 21.0 SM NP 18
13/41/23/8
100.094.887.086.2
100.099.8 100.0
#4#10#16#40#50
#100#200
80.076.172.960.353.741.634.0
98.796.1
66.2
28.313.9
98.595.793.274.662.538.021.0
0.4175 0.3576 0.2807
0.1589 0.1116
0.0546
1.29
6.55
Source of Sample: KE3 Depth: 2.5' Sample Number: A1
Source of Sample: KE3 Depth: 7.0' Sample Number: B
Source of Sample: KE3 Depth: 12.5' Sample Number: C1
CC Freeway @ Koontz Ln.
72781
+3" % GRAVEL % SAND % SILT % CLAY USCS AASHTO PL LL
SIEVE PERCENT FINER SIEVE PERCENT FINER Material Description
GRAIN SIZE REMARKS:
D60
D30
D10
COEFFICIENTS
Cc
Cu
Client:
Project:
Project No.: Figure
PE
RC
EN
T F
INE
R
0
10
20
30
40
50
60
70
80
90
100
GRAIN SIZE - mm.
0.0010.010.1110100
6 in
.
3 in
.
2 in
.
1½
in.
1 in
.
¾ in
.
½ in
.
3/8
in.
#4
#1
0
#2
0
#3
0
#4
0
#6
0
#1
00
#1
40
#2
00
Particle Size Distribution Report

NEVADA DEPARTMENT OF
TRANSPORTATION
Well-graded sand with silt
Poorly graded sand with silt
Poorly graded sand with silt
inches numbersize size
0.0 3.5 89.4 7.1 SW-SM NP 19
0.0 0.0 93.2 6.8 SP-SM
0.0 0.0 92.8 7.2 SP-SM
3/8 100.0 #4#10#16#40#50
#100#200
96.581.966.630.920.910.7
7.1
100.098.792.946.227.511.6
6.8
100.098.391.255.436.213.6
7.2
0.9724 0.5412 0.4643
0.4136 0.3164 0.2628
0.1369 0.1260 0.1145
1.29 1.47 1.30
7.10 4.30 4.05
Source of Sample: KE3 Depth: 17.0' Sample Number: D
Source of Sample: KE3 Depth: 22.5' Sample Number: E1
Source of Sample: KE3 Depth: 23.0' Sample Number: E2
CC Freeway @ Koontz Ln.
72781
+3" % GRAVEL % SAND % SILT % CLAY USCS AASHTO PL LL
SIEVE PERCENT FINER SIEVE PERCENT FINER Material Description
GRAIN SIZE REMARKS:
D60
D30
D10
COEFFICIENTS
Cc
Cu
Client:
Project:
Project No.: Figure
PE
RC
EN
T F
INE
R
0
10
20
30
40
50
60
70
80
90
100
GRAIN SIZE - mm.
0.0010.010.1110100
6 in
.
3 in
.
2 in
.
1½
in.
1 in
.
¾ in
.
½ in
.
3/8
in.
#4
#1
0
#2
0
#3
0
#4
0
#6
0
#1
00
#1
40
#2
00
Particle Size Distribution Report
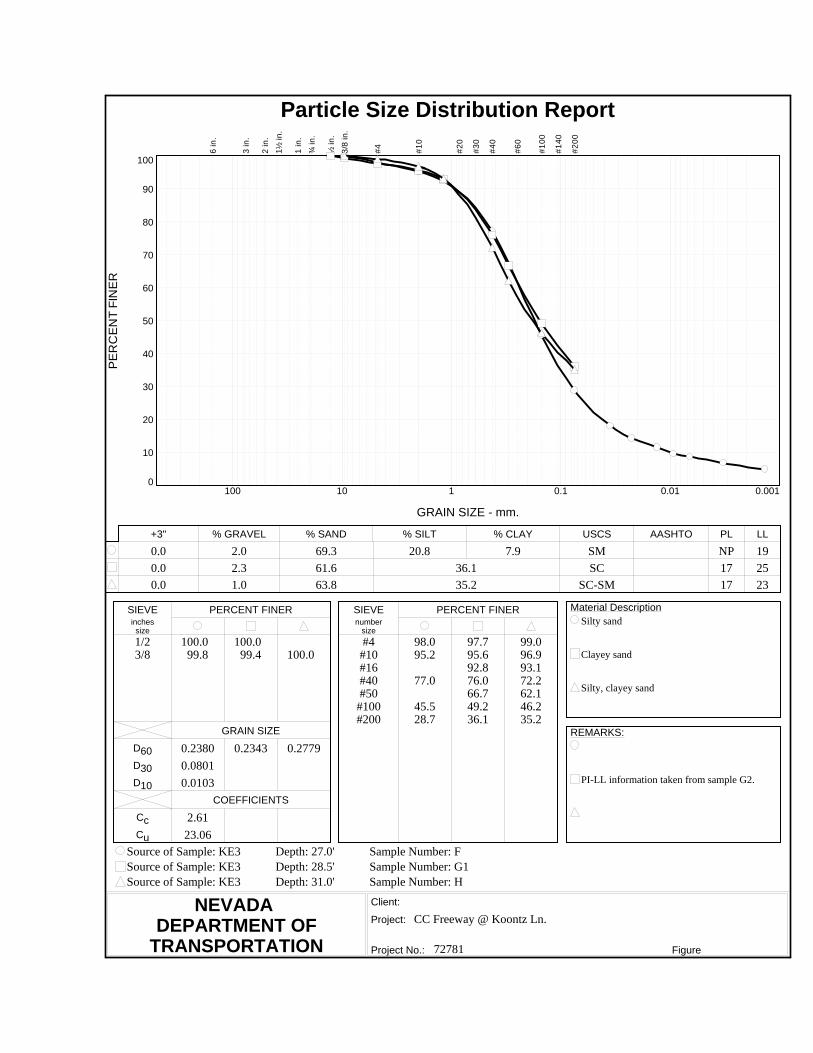
NEVADA DEPARTMENT OF
TRANSPORTATION
Silty sand
Clayey sand
Silty, clayey sand
PI-LL information taken from sample G2.
inches numbersize size
0.0 2.0 69.3 20.8 7.9 SM NP 19
0.0 2.3 61.6 36.1 SC 17 25
0.0 1.0 63.8 35.2 SC-SM 17 23
1/23/8
100.099.8
100.099.4 100.0
#4#10#16#40#50
#100#200
98.095.2
77.0
45.528.7
97.795.692.876.066.749.236.1
99.096.993.172.262.146.235.2
0.2380 0.2343 0.2779
0.0801
0.0103
2.61
23.06
Source of Sample: KE3 Depth: 27.0' Sample Number: F
Source of Sample: KE3 Depth: 28.5' Sample Number: G1
Source of Sample: KE3 Depth: 31.0' Sample Number: H
CC Freeway @ Koontz Ln.
72781
+3" % GRAVEL % SAND % SILT % CLAY USCS AASHTO PL LL
SIEVE PERCENT FINER SIEVE PERCENT FINER Material Description
GRAIN SIZE REMARKS:
D60
D30
D10
COEFFICIENTS
Cc
Cu
Client:
Project:
Project No.: Figure
PE
RC
EN
T F
INE
R
0
10
20
30
40
50
60
70
80
90
100
GRAIN SIZE - mm.
0.0010.010.1110100
6 in
.
3 in
.
2 in
.
1½
in.
1 in
.
¾ in
.
½ in
.
3/8
in.
#4
#1
0
#2
0
#3
0
#4
0
#6
0
#1
00
#1
40
#2
00
Particle Size Distribution Report

NEVADA DEPARTMENT OF
TRANSPORTATION
Clayey sand
Clayey sand
Clayey sand
inches numbersize size
0.0 0.6 61.7 37.7 SC 16 29
0.0 0.2 58.2 27.7 13.9 SC 17 34
0.0 2.3 73.5 24.2 SC 18 26
3/8 100.0 100.0 100.0 #4#10#16#40#50
#100#200
99.496.491.370.661.847.737.7
99.896.9
70.8
50.841.6
97.789.080.259.051.532.624.2
0.2783 0.2508 0.4474
0.0280 0.1307
0.0025
1.26
101.04
Source of Sample: KE3 Depth: 33.5' Sample Number: I1
Source of Sample: KE3 Depth: 34.0' Sample Number: I2
Source of Sample: KE3 Depth: 35.0' Sample Number: J
CC Freeway @ Koontz Ln.
72781
+3" % GRAVEL % SAND % SILT % CLAY USCS AASHTO PL LL
SIEVE PERCENT FINER SIEVE PERCENT FINER Material Description
GRAIN SIZE REMARKS:
D60
D30
D10
COEFFICIENTS
Cc
Cu
Client:
Project:
Project No.: Figure
PE
RC
EN
T F
INE
R
0
10
20
30
40
50
60
70
80
90
100
GRAIN SIZE - mm.
0.0010.010.1110100
6 in
.
3 in
.
2 in
.
1½
in.
1 in
.
¾ in
.
½ in
.
3/8
in.
#4
#1
0
#2
0
#3
0
#4
0
#6
0
#1
00
#1
40
#2
00
Particle Size Distribution Report

NEVADA DEPARTMENT OF
TRANSPORTATION
Silty sand
Silty sand
Silty sand with gravel
inches numbersize size
0.0 0.0 83.7 16.3 SM NP 21
0.0 12.7 59.8 27.5 SM
0.0 22.9 57.0 20.1 SM
13/41/23/8
100.098.395.1
100.095.389.586.4
#4#10#16#40#50
#100#200
100.097.091.462.148.628.916.3
87.379.374.462.656.742.927.5
77.168.863.848.240.728.120.1
0.4030 0.3619 0.8604
0.1575 0.0839 0.1696
Source of Sample: KE3 Depth: 42.0' Sample Number: L
Source of Sample: KE3 Depth: 47.0' Sample Number: M
Source of Sample: KE3 Depth: 52.0' Sample Number: N
CC Freeway @ Koontz Ln.
72781
+3" % GRAVEL % SAND % SILT % CLAY USCS AASHTO PL LL
SIEVE PERCENT FINER SIEVE PERCENT FINER Material Description
GRAIN SIZE REMARKS:
D60
D30
D10
COEFFICIENTS
Cc
Cu
Client:
Project:
Project No.: Figure
PE
RC
EN
T F
INE
R
0
10
20
30
40
50
60
70
80
90
100
GRAIN SIZE - mm.
0.0010.010.1110100
6 in
.
3 in
.
2 in
.
1½
in.
1 in
.
¾ in
.
½ in
.
3/8
in.
#4
#1
0
#2
0
#3
0
#4
0
#6
0
#1
00
#1
40
#2
00
Particle Size Distribution Report

NEVADA DEPARTMENT OF
TRANSPORTATION
Silty sand
Silty sand
Silty sand
inches numbersize size
0.0 0.8 70.5 18.5 10.2 SM NP 18
0.0 0.1 74.0 17.2 8.7 SM NP 19
0.0 2.7 66.8 30.5 SM 18 21
1/23/8
100.099.8 100.0 100.0
#4#10#16#40#50
#100#200
99.297.9
78.0
46.628.7
99.999.2
73.0
44.325.9
97.394.790.972.463.145.730.5
0.2275 0.2582 0.2666
0.0813 0.0913
0.0046 0.0075
6.28 4.31
49.16 34.49
Source of Sample: KE3 Depth: 57.0' Sample Number: O
Source of Sample: KE3 Depth: 62.0' Sample Number: P
Source of Sample: KE3 Depth: 67.0' Sample Number: Q
CC Freeway @ Koontz Ln.
72781
+3" % GRAVEL % SAND % SILT % CLAY USCS AASHTO PL LL
SIEVE PERCENT FINER SIEVE PERCENT FINER Material Description
GRAIN SIZE REMARKS:
D60
D30
D10
COEFFICIENTS
Cc
Cu
Client:
Project:
Project No.: Figure
PE
RC
EN
T F
INE
R
0
10
20
30
40
50
60
70
80
90
100
GRAIN SIZE - mm.
0.0010.010.1110100
6 in
.
3 in
.
2 in
.
1½
in.
1 in
.
¾ in
.
½ in
.
3/8
in.
#4
#1
0
#2
0
#3
0
#4
0
#6
0
#1
00
#1
40
#2
00
Particle Size Distribution Report
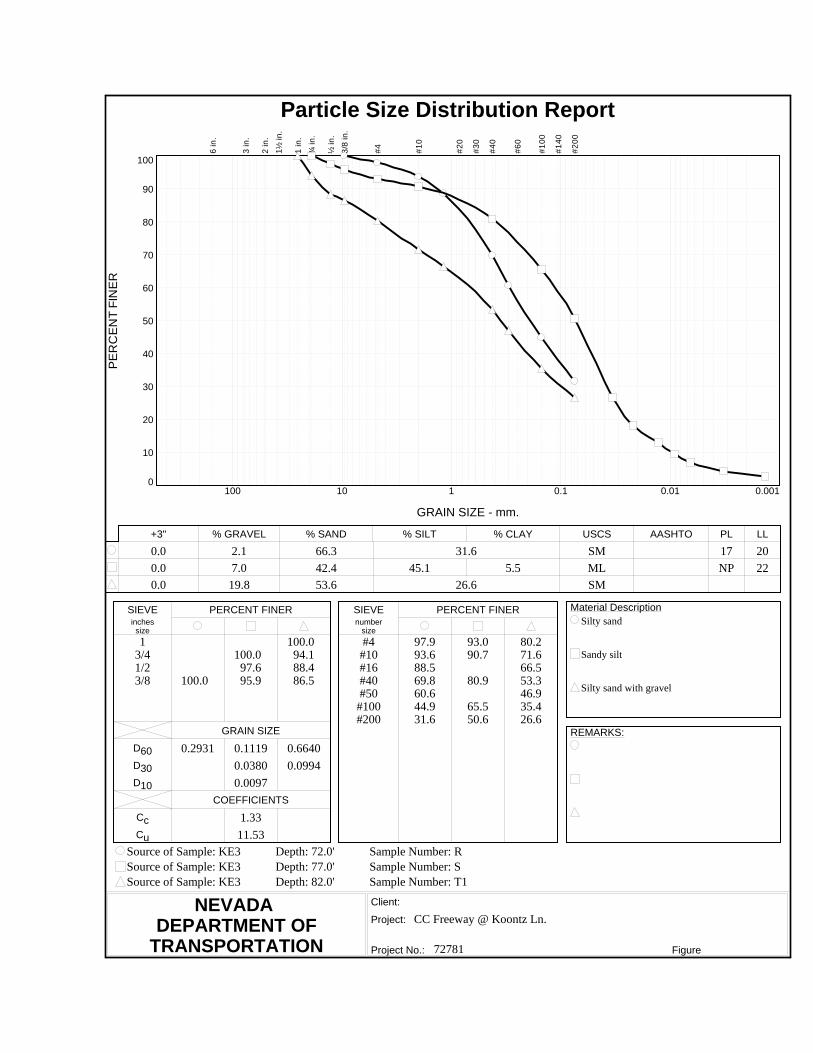
NEVADA DEPARTMENT OF
TRANSPORTATION
Silty sand
Sandy silt
Silty sand with gravel
inches numbersize size
0.0 2.1 66.3 31.6 SM 17 20
0.0 7.0 42.4 45.1 5.5 ML NP 22
0.0 19.8 53.6 26.6 SM
13/41/23/8 100.0
100.097.695.9
100.094.188.486.5
#4#10#16#40#50
#100#200
97.993.688.569.860.644.931.6
93.090.7
80.9
65.550.6
80.271.666.553.346.935.426.6
0.2931 0.1119 0.6640
0.0380 0.0994
0.0097
1.33
11.53
Source of Sample: KE3 Depth: 72.0' Sample Number: R
Source of Sample: KE3 Depth: 77.0' Sample Number: S
Source of Sample: KE3 Depth: 82.0' Sample Number: T1
CC Freeway @ Koontz Ln.
72781
+3" % GRAVEL % SAND % SILT % CLAY USCS AASHTO PL LL
SIEVE PERCENT FINER SIEVE PERCENT FINER Material Description
GRAIN SIZE REMARKS:
D60
D30
D10
COEFFICIENTS
Cc
Cu
Client:
Project:
Project No.: Figure
PE
RC
EN
T F
INE
R
0
10
20
30
40
50
60
70
80
90
100
GRAIN SIZE - mm.
0.0010.010.1110100
6 in
.
3 in
.
2 in
.
1½
in.
1 in
.
¾ in
.
½ in
.
3/8
in.
#4
#1
0
#2
0
#3
0
#4
0
#6
0
#1
00
#1
40
#2
00
Particle Size Distribution Report

NEVADA DEPARTMENT OF
TRANSPORTATION
Silty sand
Silty sand with gravel
Silty sand
inches numbersize size
0.0 3.6 54.7 41.7 SM
0.0 21.1 56.0 18.1 4.8 SM 19 21
0.0 1.3 69.4 21.5 7.8 SM 19 21
13/41/23/8 100.0
100.096.290.987.1 100.0
#4#10#16#40#50
#100#200
96.493.088.886.976.857.041.7
78.970.9
50.0
30.422.9
98.796.7
74.8
45.529.3
0.1686 0.7844 0.2486
0.1454 0.0778
0.0235 0.0109
1.15 2.24
33.38 22.84
Source of Sample: KE3 Depth: 82.5' Sample Number: T2
Source of Sample: KE3 Depth: 87.0' Sample Number: U
Source of Sample: KE3 Depth: 97.0' Sample Number: V
CC Freeway @ Koontz Ln.
72781
+3" % GRAVEL % SAND % SILT % CLAY USCS AASHTO PL LL
SIEVE PERCENT FINER SIEVE PERCENT FINER Material Description
GRAIN SIZE REMARKS:
D60
D30
D10
COEFFICIENTS
Cc
Cu
Client:
Project:
Project No.: Figure
PE
RC
EN
T F
INE
R
0
10
20
30
40
50
60
70
80
90
100
GRAIN SIZE - mm.
0.0010.010.1110100
6 in
.
3 in
.
2 in
.
1½
in.
1 in
.
¾ in
.
½ in
.
3/8
in.
#4
#1
0
#2
0
#3
0
#4
0
#6
0
#1
00
#1
40
#2
00
Particle Size Distribution Report
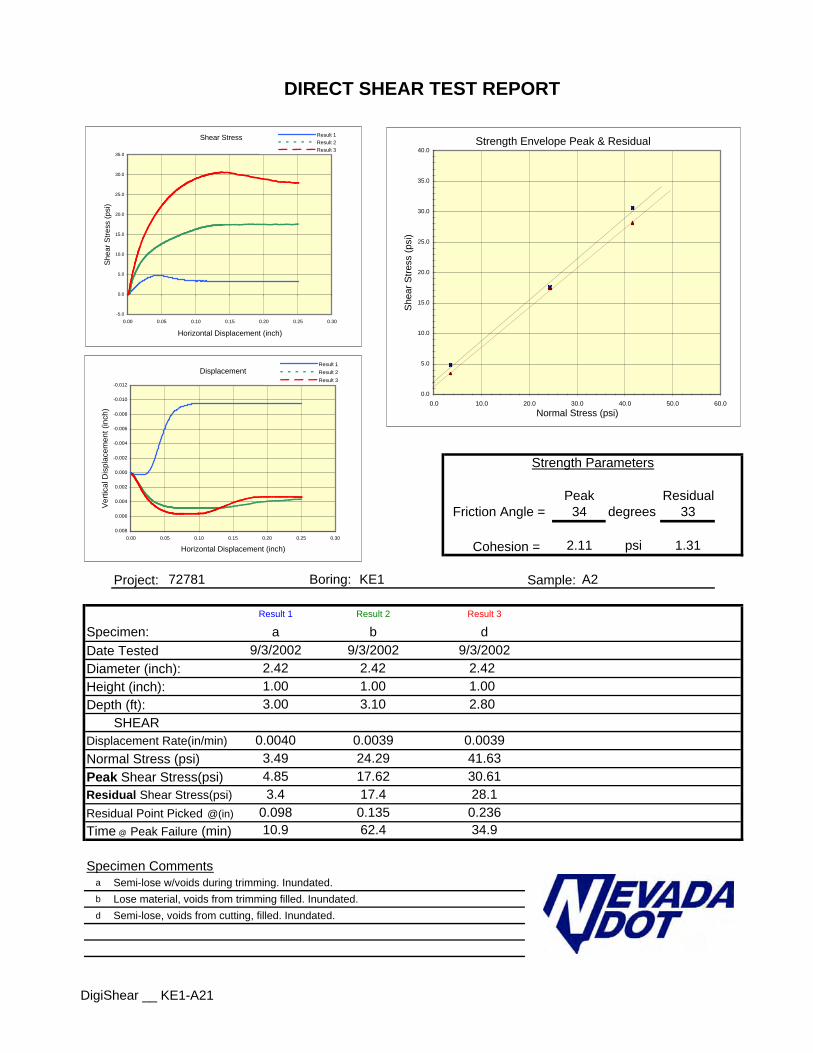
Residual Friction Angle = degrees
Cohesion =
Project: Sample:
Specimen:Date TestedDiameter (inch):Height (inch):Depth (ft):
SHEARDisplacement Rate(in/min)Normal Stress (psi)Peak Shear Stress(psi)Residual Shear Stress(psi)Residual Point Picked @(in)
Time @ Peak Failure (min)
Specimen Commentsa Semi-lose w/voids during trimming. Inundated.b Lose material, voids from trimming filled. Inundated.d Semi-lose, voids from cutting, filled. Inundated.
1.00 1.00
3.49 41.63
2.803.10
0.0039
10.9 62.4
4.85 17.62
0.098 0.13534.9
30.61
0.236
DIRECT SHEAR TEST REPORT
9/3/2002 9/3/2002b d
A2KE1Boring:
9/3/2002
3.001.002.42
72781
aResult 1 Result 2
Peak34 33
2.11 psi 1.31
Strength Parameters
3.4 17.4 28.1
0.0040 0.003924.29
Result 3
2.42 2.42
Shear Stress
-5.0
0.0
5.0
10.0
15.0
20.0
25.0
30.0
35.0
0.00 0.05 0.10 0.15 0.20 0.25 0.30
Horizontal Displacement (inch)
She
ar S
tress
(psi
)
Result 1Result 2Result 3
Displacement
-0.012
-0.010
-0.008
-0.006
-0.004
-0.002
0.000
0.002
0.004
0.006
0.0080.00 0.05 0.10 0.15 0.20 0.25 0.30
Horizontal Displacement (inch)
Verti
cal D
ispl
acem
ent (
inch
)
Result 1Result 2Result 3
Strength Envelope Peak & Residual
0.0
5.0
10.0
15.0
20.0
25.0
30.0
35.0
40.0
0.0 10.0 20.0 30.0 40.0 50.0 60.0Normal Stress (psi)
She
ar S
tress
(psi
)
DigiShear __ KE1-A21

Residual Friction Angle = degrees
Cohesion =
Project: Sample:
Specimen:Date TestedDiameter (inch):Height (inch):Depth (ft):
SHEARDisplacement Rate(in/min)Normal Stress (psi)Peak Shear Stress(psi)Residual Shear Stress(psi)Residual Point Picked @(in)
Time @ Peak Failure (min)
Specimen Commentsb Silty sand, inundated.c Same, finer. Inundated.d Coarse sand, inundated.
Result 3
2.42 2.42
0.0 0.0 0.0
Strength Parameters
Peak24 0
10.41 psi 0.00
72781
bResult 1 Result 2
9/4/2002
10.501.002.42
DIRECT SHEAR TEST REPORT
9/4/2002 9/4/2002c d
D2KE1Boring:
17.5
23.77
0.00014.4 12.6
15.20 14.19
0.000 0.000
0.0040 0.004013.896.95 27.77
1.00 1.0010.9010.80
0.0040
Shear Stress
-5.0
0.0
5.0
10.0
15.0
20.0
25.0
0.00 0.05 0.10 0.15 0.20 0.25 0.30
Horizontal Displacement (inch)
She
ar S
tress
(psi
)
Result 1Result 2Result 3
Displacement
-0.030
-0.025
-0.020
-0.015
-0.010
-0.005
0.000
0.0050.00 0.05 0.10 0.15 0.20 0.25 0.30
Horizontal Displacement (inch)
Verti
cal D
ispl
acem
ent (
inch
)
Result 1Result 2Result 3
Strength Envelope Peak & Residual
0.0
5.0
10.0
15.0
20.0
25.0
30.0
0.0 5.0 10.0 15.0 20.0 25.0 30.0 35.0 40.0
Normal Stress (psi)S
hear
Stre
ss (p
si)
DigiShear __ KE1-D22

Residual Friction Angle = degrees
Cohesion =
Project: Sample:
Specimen:Date TestedDiameter (inch):Height (inch):Depth (ft):
SHEARDisplacement Rate(in/min)Normal Stress (psi)Peak Shear Stress(psi)Residual Shear Stress(psi)Residual Point Picked @(in)
Time @ Peak Failure (min)
Specimen Commentsa Slightly coarse sand, inundated.b Slightly coarse sand with some large granules, inundated.c Sand w/ some coarse, inundated.
Result 3
2.42 2.42
3.9 20.5 37.8
Strength Parameters
Peak45 37
3.26 psi 1.66
72781
aResult 1 Result 2
9/5/2002
14.001.002.42
DIRECT SHEAR TEST REPORT
9/5/2002 9/5/2002b c
F1KE1Boring:
28.4
50.38
0.25211.5 23.4
5.74 29.01
0.187 0.235
0.0039 0.004024.273.48 48.56
1.00 1.0014.2014.10
0.0039
Shear Stress
-10.0
0.0
10.0
20.0
30.0
40.0
50.0
60.0
0.00 0.05 0.10 0.15 0.20 0.25 0.30
Horizontal Displacement (inch)
She
ar S
tress
(psi
)
Result 1Result 2Result 3
Displacement
-0.045
-0.040
-0.035
-0.030
-0.025
-0.020
-0.015
-0.010
-0.005
0.000
0.005
0.0100.00 0.05 0.10 0.15 0.20 0.25 0.30
Horizontal Displacement (inch)
Verti
cal D
ispl
acem
ent (
inch
)
Result 1Result 2Result 3
Strength Envelope Peak & Residual
0.0
10.0
20.0
30.0
40.0
50.0
60.0
0.0 10.0 20.0 30.0 40.0 50.0 60.0
Normal Stress (psi)S
hear
Stre
ss (p
si)
DigiShear __ KE1-F13

Residual Friction Angle = degrees
Cohesion =
Project: Sample:
Specimen:Date TestedDiameter (inch):Height (inch):Depth (ft):
SHEARDisplacement Rate(in/min)Normal Stress (psi)Peak Shear Stress(psi)Residual Shear Stress(psi)Residual Point Picked @(in)
Time @ Peak Failure (min)
Specimen Commentsa Coarse sand, inundated.b Coarse sand, inundated.c Coarse sand, inundated.
Peak42 34
6.08 psi
Geotechnical Section
Strength Parameters
72781
aResult 1 Result 2
2.07
KE1Boring:
10/16/2002
17.201.002.42 2.42 2.42
Result 3
33.7
DIRECT SHEAR TEST REPORT
10/16/2002 10/16/2002b c
H1
19.5
17.3
48.20
0.252
24.296.96 48.59
12.5 17.2
10.99 29.70
0.252 0.2525.9
0.0049 0.0050 0.0050
17.4017.301.00 1.00
Shear Stress
0.0
10.0
20.0
30.0
40.0
50.0
60.0
0.00 0.05 0.10 0.15 0.20 0.25 0.30
Horizontal Displacement (inch)
She
ar S
tress
(psi
)
Result 1Result 2Result 3
Displacement
-0.045
-0.040
-0.035
-0.030
-0.025
-0.020
-0.015
-0.010
-0.005
0.000
0.005
0.0100.00 0.05 0.10 0.15 0.20 0.25 0.30
Horizontal Displacement (inch)
Verti
cal D
ispl
acem
ent (
inch
)
Result 1Result 2Result 3
Strength Envelope Peak & Residual
0.0
10.0
20.0
30.0
40.0
50.0
60.0
0.0 10.0 20.0 30.0 40.0 50.0 60.0
Normal Stress (psi)S
hear
Stre
ss (p
si)
DigiShear Report v4 __ KE1-H14

Residual Friction Angle = degrees
Cohesion =
Project: Sample:
Specimen:Date TestedDiameter (inch):Height (inch):Depth (ft):
SHEARDisplacement Rate(in/min)Normal Stress (psi)Peak Shear Stress(psi)Residual Shear Stress(psi)Residual Point Picked @(in)
Time @ Peak Failure (min)
Specimen Commentsb Clayey sand w/some gravel, inundated.c Clayey sand w/some gravel, inundated.d Clayey sand w/some gravel, inundated.
Peak41 38
4.92 psi
Geotechnical Section
Strength Parameters
72781
bResult 1 Result 2
0.61
KE1Boring:
10/17/2002
32.201.002.42 2.42 2.42
Result 3
39.4
DIRECT SHEAR TEST REPORT
10/17/2002 10/17/2002c d
L1
17.4
22.2
46.65
0.251
24.306.95 48.61
14.3 12.4
10.15 27.49
0.251 0.2517.3
0.0039 0.0040 0.0040
32.5032.401.00 1.00
Shear Stress
-10.0
0.0
10.0
20.0
30.0
40.0
50.0
0.00 0.05 0.10 0.15 0.20 0.25 0.30
Horizontal Displacement (inch)
She
ar S
tress
(psi
)
Result 1Result 2Result 3
Displacement
-0.025
-0.020
-0.015
-0.010
-0.005
0.000
0.0050.00 0.05 0.10 0.15 0.20 0.25 0.30
Horizontal Displacement (inch)
Verti
cal D
ispl
acem
ent (
inch
)
Result 1Result 2Result 3
Strength Envelope Peak & Residual
0.0
10.0
20.0
30.0
40.0
50.0
60.0
0.0 10.0 20.0 30.0 40.0 50.0 60.0
Normal Stress (psi)S
hear
Stre
ss (p
si)
DigiShear Report v4 __ KE1-L15

Residual Friction Angle = degrees
Cohesion =
Project: Sample:
Specimen:Date TestedDiameter (inch):Height (inch):Depth (ft):
SHEARDisplacement Rate(in/min)Normal Stress (psi)Peak Shear Stress(psi)Residual Shear Stress(psi)Residual Point Picked @(in)
Time @ Peak Failure (min)
Specimen Commentsa Coarse sand w/clayey silt, inundated. d Coarse sand w/clayey silt, 1/8" rocks, inundated.c Coarse sand w/clayey silt, inundated
1.00 1.00
13.87 55.56
40.1034.60
0.0040
16.4 13.8
14.40 33.73
0.206 0.21516.3
51.38
0.227
DIRECT SHEAR TEST REPORT
9/17/2002 9/16/2002d c
LA1KE1Boring:
9/16/2002
31.901.002.42
72781
aResult 1 Result 2
Peak42 35
2.37 psi 0.75
Strength Parameters
9.9 25.9 39.0
0.0040 0.004034.73
Result 3
2.42 2.42
Shear Stress
-10.0
0.0
10.0
20.0
30.0
40.0
50.0
60.0
0.00 0.05 0.10 0.15 0.20 0.25 0.30
Horizontal Displacement (inch)
She
ar S
tress
(psi
)
Result 1Result 2Result 3
Displacement
-0.018
-0.016
-0.014
-0.012
-0.010
-0.008
-0.006
-0.004
-0.002
0.000
0.0020.00 0.05 0.10 0.15 0.20 0.25 0.30
Horizontal Displacement (inch)
Verti
cal D
ispl
acem
ent (
inch
)
Result 1Result 2Result 3
Strength Envelope Peak & Residual
0.0
10.0
20.0
30.0
40.0
50.0
60.0
0.0 10.0 20.0 30.0 40.0 50.0 60.0 70.0
Normal Stress (psi)S
hear
Stre
ss (p
si)
DigiShear __ KE1-LA16

Residual Friction Angle = degrees
Cohesion =
Project: Sample:
Specimen:Date TestedDiameter (inch):Height (inch):Depth (ft):
SHEARDisplacement Rate(in/min)Normal Stress (psi)Peak Shear Stress(psi)Residual Shear Stress(psi)Residual Point Picked @(in)
Time @ Peak Failure (min)
Specimen Commentsa Clayey silty sand, inundated.b Same as "a" with some large sand granules, inundated.c Same as sample "b", inundated.
Result 3
2.42 2.42
10.9 24.9 38.0
Strength Parameters
Peak40 33
5.53 psi 1.97
72781
aResult 1 Result 2
9/13/2002
34.301.002.42
DIRECT SHEAR TEST REPORT
9/13/2002 9/13/2002b c
LA2KE1Boring:
17.4
53.11
0.25211.8 13.7
17.68 34.40
0.223 0.167
0.0039 0.003934.7213.91 55.56
1.00 1.0034.5034.40
0.0039
Shear Stress
-10.0
0.0
10.0
20.0
30.0
40.0
50.0
60.0
0.00 0.05 0.10 0.15 0.20 0.25 0.30
Horizontal Displacement (inch)
She
ar S
tress
(psi
)
Result 1Result 2Result 3
Displacement
-0.018
-0.016
-0.014
-0.012
-0.010
-0.008
-0.006
-0.004
-0.002
0.000
0.0020.00 0.05 0.10 0.15 0.20 0.25 0.30
Horizontal Displacement (inch)
Verti
cal D
ispl
acem
ent (
inch
)
Result 1Result 2Result 3
Strength Envelope Peak & Residual
0.0
10.0
20.0
30.0
40.0
50.0
60.0
70.0
0.0 10.0 20.0 30.0 40.0 50.0 60.0 70.0
Normal Stress (psi)S
hear
Stre
ss (p
si)
DigiShear __ KE1-LA27

Residual Friction Angle = degrees
Cohesion =
Project: Sample:
Specimen:Date TestedDiameter (inch):Height (inch):Depth (ft):
SHEARDisplacement Rate(in/min)Normal Stress (psi)Peak Shear Stress(psi)Residual Shear Stress(psi)Residual Point Picked @(in)
Time @ Peak Failure (min)
Specimen Commentsa Clayey sand w/some coarse granules, inundated.b Clayey sand w/some coarse granules, inundated.c Clayey sand w/course granules, inundated.
Result 3
2.42 2.42
10.5 24.3 37.5
Strength Parameters
Peak46 33
2.93 psi 1.62
72781
aResult 1 Result 2
9/18/2002
42.801.002.42
DIRECT SHEAR TEST REPORT
9/18/2002 9/18/2002b c
N1KE!Boring:
26.5
59.12
0.24920.6 20.1
16.51 39.71
0.231 0.241
0.0030 0.003034.7313.89 55.54
1.00 1.0043.0042.90
0.0030
Shear Stress
0.0
10.0
20.0
30.0
40.0
50.0
60.0
70.0
0.00 0.05 0.10 0.15 0.20 0.25 0.30
Horizontal Displacement (inch)
She
ar S
tress
(psi
)
Result 1Result 2Result 3
Displacement
-0.018
-0.016
-0.014
-0.012
-0.010
-0.008
-0.006
-0.004
-0.002
0.000
0.0020.00 0.05 0.10 0.15 0.20 0.25 0.30
Horizontal Displacement (inch)
Verti
cal D
ispl
acem
ent (
inch
)
Result 1Result 2Result 3
Strength Envelope Peak & Residual
0.0
10.0
20.0
30.0
40.0
50.0
60.0
70.0
0.0 10.0 20.0 30.0 40.0 50.0 60.0 70.0
Normal Stress (psi)S
hear
Stre
ss (p
si)
DigiShear __ KE1-N18

Residual Friction Angle = degrees
Cohesion =
Project: Sample:
Specimen:Date TestedDiameter (inch):Height (inch):Depth (ft):
SHEARDisplacement Rate(in/min)Normal Stress (psi)Peak Shear Stress(psi)Residual Shear Stress(psi)Residual Point Picked @(in)
Time @ Peak Failure (min)
Specimen Commentsa Clayey sand w/some coarse, inundated.b Clayey sand w/some coarse sand granules, inundated.c Clayey sand w/some coarse sand granules, inundated.
Result 3
2.42 2.42
10.9 22.5 35.1
Strength Parameters
Peak31 30
13.20 psi 2.68
72781
aResult 1 Result 2
9/17/2002
42.201.002.42
DIRECT SHEAR TEST REPORT
9/17/2002 9/18/2002b c
N2KE1Boring:
23.5
47.80
0.22719.5 22.9
22.30 33.26
0.222 0.224
0.0030 0.003034.7313.89 55.56
1.00 1.0042.4042.30
0.0030
Shear Stress
-10.0
0.0
10.0
20.0
30.0
40.0
50.0
60.0
0.00 0.05 0.10 0.15 0.20 0.25 0.30
Horizontal Displacement (inch)
She
ar S
tress
(psi
)
Result 1Result 2Result 3
Displacement
-0.025
-0.020
-0.015
-0.010
-0.005
0.000
0.0050.00 0.05 0.10 0.15 0.20 0.25 0.30
Horizontal Displacement (inch)
Verti
cal D
ispl
acem
ent (
inch
)
Result 1Result 2Result 3
Strength Envelope Peak & Residual
0.0
10.0
20.0
30.0
40.0
50.0
60.0
0.0 10.0 20.0 30.0 40.0 50.0 60.0 70.0
Normal Stress (psi)S
hear
Stre
ss (p
si)
DigiShear __ KE1-N29

Residual Friction Angle = degrees
Cohesion =
Project: Sample:
Specimen:Date TestedDiameter (inch):Height (inch):Depth (ft):
SHEARDisplacement Rate(in/min)Normal Stress (psi)Peak Shear Stress(psi)Residual Shear Stress(psi)Residual Point Picked @(in)
Time @ Peak Failure (min)
Specimen Commentsa Clayey sand w/some gravel sized rock, inundated.b Clayey sand w/some gravel sized rock, inundated.c Clayey sand w/some gravel sized rock, inundated.
Peak36 34
7.97 psi
Geotechnical Section
Strength Parameters
72781
aResult 1 Result 2
1.24
KE1Boring:
10/23/2002
56.001.002.42 2.42 2.42
Result 3
38.8
DIRECT SHEAR TEST REPORT
10/23/2002 10/24/2002b c
Q1
24.3
22.2
48.88
0.252
34.7213.89 55.53
13.2 19.3
18.30 33.21
0.251 0.25110.8
0.0039 0.0040 0.0040
56.2056.101.00 1.00
Shear Stress
0.0
10.0
20.0
30.0
40.0
50.0
60.0
0.00 0.05 0.10 0.15 0.20 0.25 0.30
Horizontal Displacement (inch)
She
ar S
tress
(psi
)
Result 1Result 2Result 3
Displacement
-0.018
-0.016
-0.014
-0.012
-0.010
-0.008
-0.006
-0.004
-0.002
0.000
0.002
0.0040.00 0.05 0.10 0.15 0.20 0.25 0.30
Horizontal Displacement (inch)
Verti
cal D
ispl
acem
ent (
inch
)
Result 1Result 2Result 3
Strength Envelope Peak & Residual
0.0
10.0
20.0
30.0
40.0
50.0
60.0
0.0 10.0 20.0 30.0 40.0 50.0 60.0 70.0
Normal Stress (psi)S
hear
Stre
ss (p
si)
DigiShear Report v4 __ KE1-Q110

Residual Friction Angle = degrees
Cohesion =
Project: Sample:
Specimen:Date TestedDiameter (inch):Height (inch):Depth (ft):
SHEARDisplacement Rate(in/min)Normal Stress (psi)Peak Shear Stress(psi)Residual Shear Stress(psi)Residual Point Picked @(in)
Time @ Peak Failure (min)
Specimen Commentsa CLayey sand w/coarse & some large granules, inundated.b Clayey sand with coarse granules. Becoming more clayey, inundated.c Clayey sand w/coarse granules & small sized rocks, inundated.
Result 3
2.42 2.42
11.2 31.2 39.3
Strength Parameters
Peak37 34
6.68 psi 3.81
727781
aResult 1 Result 2
9/19/2002
57.601.002.42
DIRECT SHEAR TEST REPORT
9/19/2002 9/19/2002b c
Q2KE1Boring:
35.7
48.42
0.23523.6 29.8
16.75 34.11
0.199 0.212
0.0030 0.003034.7213.90 55.55
1.00 1.0057.8057.70
0.0030
Shear Stress
-10.0
0.0
10.0
20.0
30.0
40.0
50.0
60.0
0.00 0.05 0.10 0.15 0.20 0.25 0.30
Horizontal Displacement (inch)
She
ar S
tress
(psi
)
Result 1Result 2Result 3
Displacement
-0.018
-0.016
-0.014
-0.012
-0.010
-0.008
-0.006
-0.004
-0.002
0.000
0.002
0.0040.00 0.05 0.10 0.15 0.20 0.25 0.30
Horizontal Displacement (inch)
Verti
cal D
ispl
acem
ent (
inch
)
Result 1Result 2Result 3
Strength Envelope Peak & Residual
0.0
10.0
20.0
30.0
40.0
50.0
60.0
0.0 10.0 20.0 30.0 40.0 50.0 60.0 70.0
Normal Stress (psi)S
hear
Stre
ss (p
si)
DigiShear __ KE1-Q211
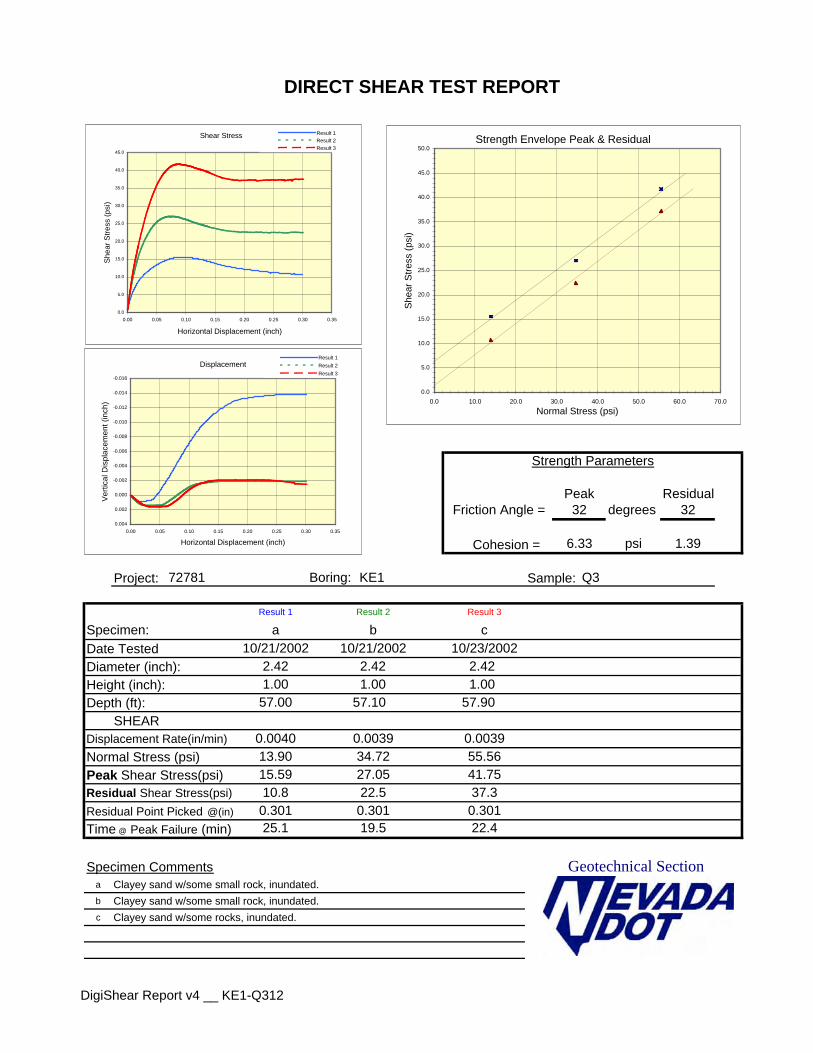
Residual Friction Angle = degrees
Cohesion =
Project: Sample:
Specimen:Date TestedDiameter (inch):Height (inch):Depth (ft):
SHEARDisplacement Rate(in/min)Normal Stress (psi)Peak Shear Stress(psi)Residual Shear Stress(psi)Residual Point Picked @(in)
Time @ Peak Failure (min)
Specimen Commentsa Clayey sand w/some small rock, inundated.b Clayey sand w/some small rock, inundated.c Clayey sand w/some rocks, inundated.
Peak32 32
6.33 psi
Geotechnical Section
Strength Parameters
72781
aResult 1 Result 2
1.39
KE1Boring:
10/21/2002
57.001.002.42 2.42 2.42
Result 3
37.3
DIRECT SHEAR TEST REPORT
10/21/2002 10/23/2002b c
Q3
22.5
22.4
41.75
0.301
34.7213.90 55.56
25.1 19.5
15.59 27.05
0.301 0.30110.8
0.0040 0.0039 0.0039
57.9057.101.00 1.00
Shear Stress
0.0
5.0
10.0
15.0
20.0
25.0
30.0
35.0
40.0
45.0
0.00 0.05 0.10 0.15 0.20 0.25 0.30 0.35
Horizontal Displacement (inch)
She
ar S
tress
(psi
)
Result 1Result 2Result 3
Displacement
-0.016
-0.014
-0.012
-0.010
-0.008
-0.006
-0.004
-0.002
0.000
0.002
0.0040.00 0.05 0.10 0.15 0.20 0.25 0.30 0.35
Horizontal Displacement (inch)
Verti
cal D
ispl
acem
ent (
inch
)
Result 1Result 2Result 3
Strength Envelope Peak & Residual
0.0
5.0
10.0
15.0
20.0
25.0
30.0
35.0
40.0
45.0
50.0
0.0 10.0 20.0 30.0 40.0 50.0 60.0 70.0
Normal Stress (psi)S
hear
Stre
ss (p
si)
DigiShear Report v4 __ KE1-Q312

Residual Friction Angle = degrees
Cohesion =
Project: Sample:
Specimen:Date TestedDiameter (inch):Height (inch):Depth (ft):
SHEARDisplacement Rate(in/min)Normal Stress (psi)Peak Shear Stress(psi)Residual Shear Stress(psi)Residual Point Picked @(in)
Time @ Peak Failure (min)
Specimen Commentsa Silty sand w/ some pea gravel, inundated.b Silty sand w/some pea gravel, inundated.c Silty sand w/pea gravel, inundated.
Result 3
2.42 2.42
10.9 20.8 39.4
Strength Parameters
Peak42 35
6.55 psi 0.63
72781
aResult 1 Result 2
9/20/2002
67.101.002.42
DIRECT SHEAR TEST REPORT
9/20/2002 9/20/2002b c
S1KE1Boring:
16.5
56.13
0.25215.9 16.9
19.43 33.21
0.172 0.213
0.0039 0.004031.2213.89 55.53
1.00 1.0067.3067.20
0.0039
Shear Stress
-10.0
0.0
10.0
20.0
30.0
40.0
50.0
60.0
0.00 0.05 0.10 0.15 0.20 0.25 0.30
Horizontal Displacement (inch)
She
ar S
tress
(psi
)
Result 1Result 2Result 3
Displacement
-0.020
-0.015
-0.010
-0.005
0.000
0.0050.00 0.05 0.10 0.15 0.20 0.25 0.30
Horizontal Displacement (inch)
Verti
cal D
ispl
acem
ent (
inch
)
Result 1Result 2Result 3
Strength Envelope Peak & Residual
0.0
10.0
20.0
30.0
40.0
50.0
60.0
70.0
0.0 10.0 20.0 30.0 40.0 50.0 60.0 70.0
Normal Stress (psi)S
hear
Stre
ss (p
si)
DigiShear __ KE1-S113

Residual Friction Angle = degrees
Cohesion =
Project: Sample:
Specimen:Date TestedDiameter (inch):Height (inch):Depth (ft):
SHEARDisplacement Rate(in/min)Normal Stress (psi)Peak Shear Stress(psi)Residual Shear Stress(psi)Residual Point Picked @(in)
Time @ Peak Failure (min)
Specimen Commentsa Clayey sand w/some large granules, inundated.b Clayey sand w/some large granules, inundated.c Clayey sand w/some large granules, inundated.
Result 3
2.42 2.42
10.5 25.9 38.5
Strength Parameters
Peak40 34
3.20 psi 1.67
72781
aResult 1 Result 2
9/23/2002
77.801.002.42
DIRECT SHEAR TEST REPORT
9/23/2002 9/23/2002b c
U1KE1Boring:
17.4
50.35
0.17910.0 15.1
15.30 31.60
0.154 0.167
0.0040 0.004034.7213.90 55.55
1.00 1.0078.0077.90
0.0040
Shear Stress
-10.0
0.0
10.0
20.0
30.0
40.0
50.0
60.0
0.00 0.05 0.10 0.15 0.20 0.25 0.30
Horizontal Displacement (inch)
She
ar S
tress
(psi
)
Result 1Result 2Result 3
Displacement
-0.009
-0.008
-0.007
-0.006
-0.005
-0.004
-0.003
-0.002
-0.001
0.000
0.001
0.0020.00 0.05 0.10 0.15 0.20 0.25 0.30
Horizontal Displacement (inch)
Verti
cal D
ispl
acem
ent (
inch
)
Result 1Result 2Result 3
Strength Envelope Peak & Residual
0.0
10.0
20.0
30.0
40.0
50.0
60.0
0.0 10.0 20.0 30.0 40.0 50.0 60.0 70.0
Normal Stress (psi)S
hear
Stre
ss (p
si)
DigiShear __ KE1-U114
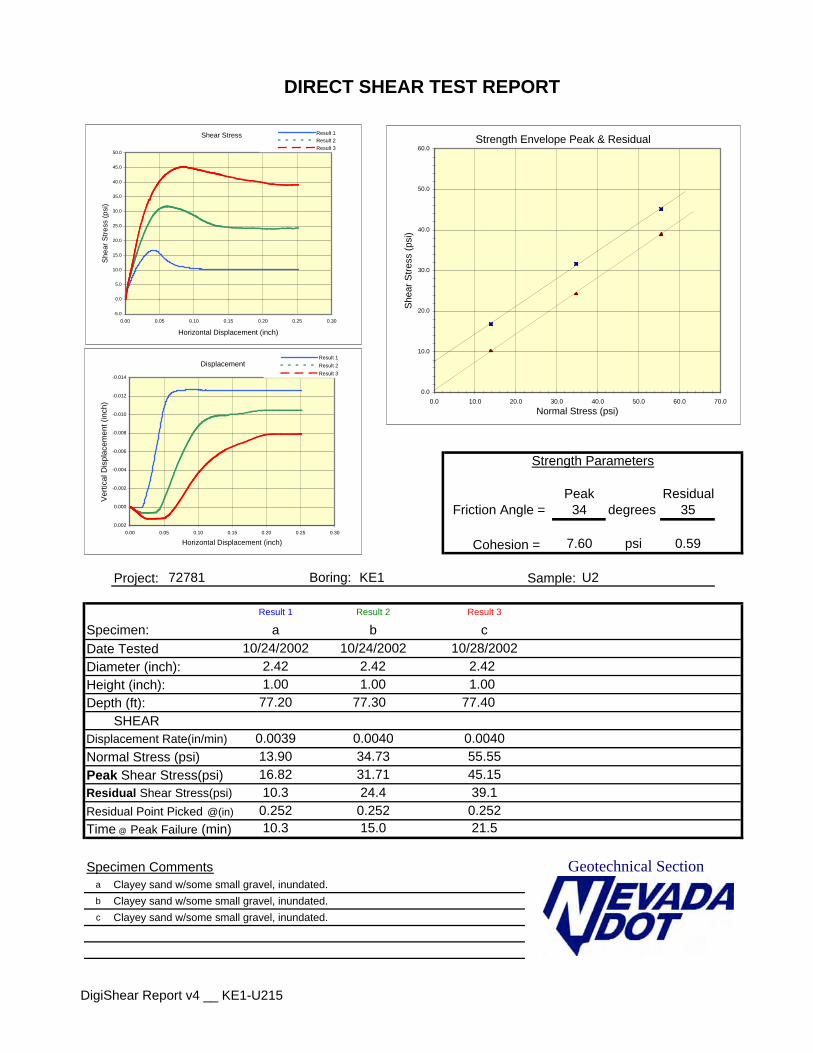
Residual Friction Angle = degrees
Cohesion =
Project: Sample:
Specimen:Date TestedDiameter (inch):Height (inch):Depth (ft):
SHEARDisplacement Rate(in/min)Normal Stress (psi)Peak Shear Stress(psi)Residual Shear Stress(psi)Residual Point Picked @(in)
Time @ Peak Failure (min)
Specimen Commentsa Clayey sand w/some small gravel, inundated.b Clayey sand w/some small gravel, inundated.c Clayey sand w/some small gravel, inundated.
Peak34 35
7.60 psi
Geotechnical Section
Strength Parameters
72781
aResult 1 Result 2
0.59
KE1Boring:
10/24/2002
77.201.002.42 2.42 2.42
Result 3
39.1
DIRECT SHEAR TEST REPORT
10/24/2002 10/28/2002b c
U2
24.4
21.5
45.15
0.252
34.7313.90 55.55
10.3 15.0
16.82 31.71
0.252 0.25210.3
0.0039 0.0040 0.0040
77.4077.301.00 1.00
Shear Stress
-5.0
0.0
5.0
10.0
15.0
20.0
25.0
30.0
35.0
40.0
45.0
50.0
0.00 0.05 0.10 0.15 0.20 0.25 0.30
Horizontal Displacement (inch)
She
ar S
tress
(psi
)
Result 1Result 2Result 3
Displacement
-0.014
-0.012
-0.010
-0.008
-0.006
-0.004
-0.002
0.000
0.0020.00 0.05 0.10 0.15 0.20 0.25 0.30
Horizontal Displacement (inch)
Verti
cal D
ispl
acem
ent (
inch
)
Result 1Result 2Result 3
Strength Envelope Peak & Residual
0.0
10.0
20.0
30.0
40.0
50.0
60.0
0.0 10.0 20.0 30.0 40.0 50.0 60.0 70.0
Normal Stress (psi)S
hear
Stre
ss (p
si)
DigiShear Report v4 __ KE1-U215

Residual Friction Angle = degrees
Cohesion =
Project: Sample:
Specimen:Date TestedDiameter (inch):Height (inch):Depth (ft):
SHEARDisplacement Rate(in/min)Normal Stress (psi)Peak Shear Stress(psi)Residual Shear Stress(psi)Residual Point Picked @(in)
Time @ Peak Failure (min)
Specimen Commentsa Clayey-silty sand w/some gravel, inundated.b Clayey-silty sand w/less gravel, inundated.c Clayey silt w/sand and some large granules, inundated.
Result 3
2.42 2.42
3.5 20.1 34.1
Strength Parameters
Peak39 34
2.68 psi 2.02
72781
aResult 1 Result 2
9/24/2002
2.401.002.42
DIRECT SHEAR TEST REPORT
9/24/2002 9/24/2002b c
A1KE2Boring:
27.3
41.76
0.2529.6 19.3
4.91 23.68
0.251 0.238
0.0039 0.004024.313.51 48.58
1.00 1.002.602.50
0.0039
Shear Stress
0.0
5.0
10.0
15.0
20.0
25.0
30.0
35.0
40.0
45.0
0.00 0.05 0.10 0.15 0.20 0.25 0.30
Horizontal Displacement (inch)
She
ar S
tress
(psi
)
Result 1Result 2Result 3
Displacement
-0.020
-0.015
-0.010
-0.005
0.000
0.0050.00 0.05 0.10 0.15 0.20 0.25 0.30
Horizontal Displacement (inch)
Verti
cal D
ispl
acem
ent (
inch
)
Result 1Result 2Result 3
Strength Envelope Peak & Residual
0.0
5.0
10.0
15.0
20.0
25.0
30.0
35.0
40.0
45.0
50.0
0.0 10.0 20.0 30.0 40.0 50.0 60.0
Normal Stress (psi)S
hear
Stre
ss (p
si)
DigiShear __ KE2-A116
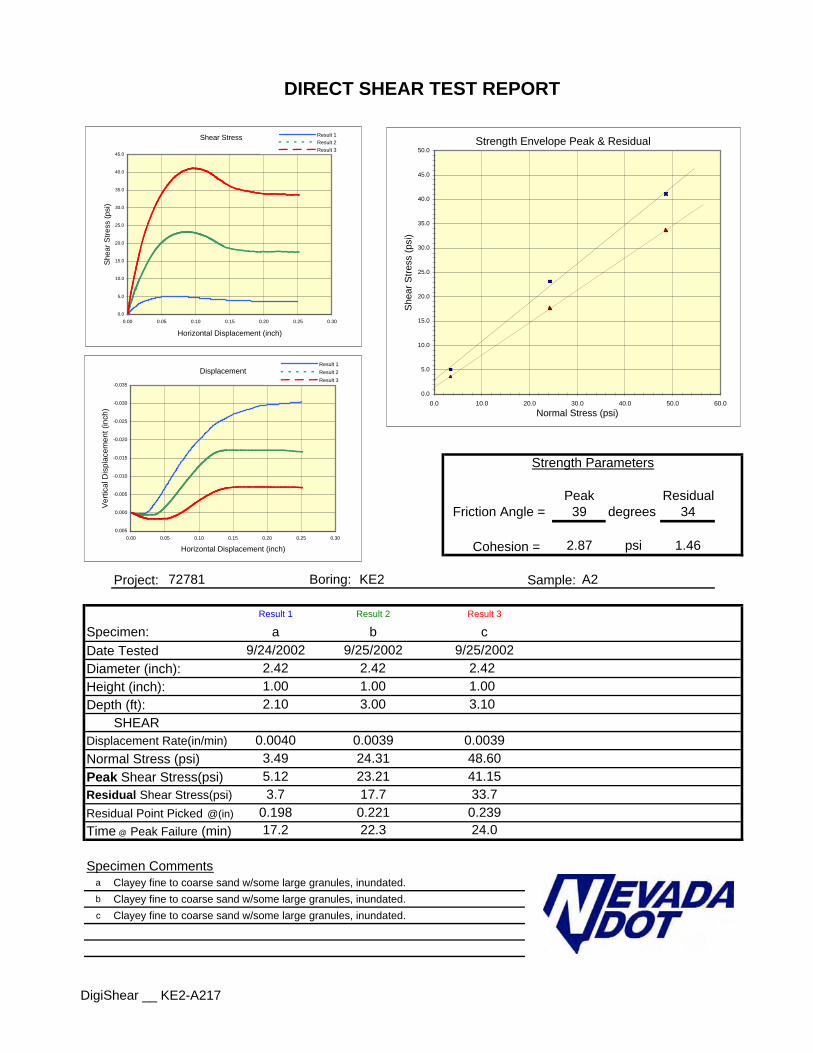
Residual Friction Angle = degrees
Cohesion =
Project: Sample:
Specimen:Date TestedDiameter (inch):Height (inch):Depth (ft):
SHEARDisplacement Rate(in/min)Normal Stress (psi)Peak Shear Stress(psi)Residual Shear Stress(psi)Residual Point Picked @(in)
Time @ Peak Failure (min)
Specimen Commentsa Clayey fine to coarse sand w/some large granules, inundated.b Clayey fine to coarse sand w/some large granules, inundated.c Clayey fine to coarse sand w/some large granules, inundated.
Result 3
2.42 2.42
3.7 17.7 33.7
Strength Parameters
Peak39 34
2.87 psi 1.46
72781
aResult 1 Result 2
9/24/2002
2.101.002.42
DIRECT SHEAR TEST REPORT
9/25/2002 9/25/2002b c
A2KE2Boring:
24.0
41.15
0.23917.2 22.3
5.12 23.21
0.198 0.221
0.0040 0.003924.313.49 48.60
1.00 1.003.103.00
0.0039
Shear Stress
0.0
5.0
10.0
15.0
20.0
25.0
30.0
35.0
40.0
45.0
0.00 0.05 0.10 0.15 0.20 0.25 0.30
Horizontal Displacement (inch)
She
ar S
tress
(psi
)
Result 1Result 2Result 3
Displacement
-0.035
-0.030
-0.025
-0.020
-0.015
-0.010
-0.005
0.000
0.0050.00 0.05 0.10 0.15 0.20 0.25 0.30
Horizontal Displacement (inch)
Verti
cal D
ispl
acem
ent (
inch
)
Result 1Result 2Result 3
Strength Envelope Peak & Residual
0.0
5.0
10.0
15.0
20.0
25.0
30.0
35.0
40.0
45.0
50.0
0.0 10.0 20.0 30.0 40.0 50.0 60.0
Normal Stress (psi)S
hear
Stre
ss (p
si)
DigiShear __ KE2-A217

Residual Friction Angle = degrees
Cohesion =
Project: Sample:
Specimen:Date TestedDiameter (inch):Height (inch):Depth (ft):
SHEARDisplacement Rate(in/min)Normal Stress (psi)Peak Shear Stress(psi)Residual Shear Stress(psi)Residual Point Picked @(in)
Time @ Peak Failure (min)
Specimen Commentsa Silty fine sand, inundated.b Clayey, silty fine sand, inundated.c Clayey silty sand changing to coarse sand, inundated.
Result 3
2.42 2.42
4.1 18.7 37.5
Strength Parameters
Peak46 37
0.47 psi 1.23
72781
aResult 1 Result 2
9/26/2002
9.901.002.42
DIRECT SHEAR TEST REPORT
9/26/2002 9/26/2002b c
C1KE2Boring:
15.5
52.59
0.2316.3 8.0
5.26 23.99
0.186 0.207
0.0039 0.004024.313.48 48.61
1.00 1.0010.1010.00
0.0040
Shear Stress
0.0
10.0
20.0
30.0
40.0
50.0
60.0
0.00 0.05 0.10 0.15 0.20 0.25 0.30
Horizontal Displacement (inch)
She
ar S
tress
(psi
)
Result 1Result 2Result 3
Displacement
-0.040
-0.035
-0.030
-0.025
-0.020
-0.015
-0.010
-0.005
0.000
0.0050.00 0.05 0.10 0.15 0.20 0.25 0.30
Horizontal Displacement (inch)
Verti
cal D
ispl
acem
ent (
inch
)
Result 1Result 2Result 3
Strength Envelope Peak & Residual
0.0
10.0
20.0
30.0
40.0
50.0
60.0
70.0
0.0 10.0 20.0 30.0 40.0 50.0 60.0
Normal Stress (psi)S
hear
Stre
ss (p
si)
DigiShear __ KE2-C118

Residual Friction Angle = degrees
Cohesion =
Project: Sample:
Specimen:Date TestedDiameter (inch):Height (inch):Depth (ft):
SHEARDisplacement Rate(in/min)Normal Stress (psi)Peak Shear Stress(psi)Residual Shear Stress(psi)Residual Point Picked @(in)
Time @ Peak Failure (min)
Specimen Commentsa Fine to coarse sand, inundated.b Fine to coarse sand, inundated.c Fine to coarse sand, inundated.
Result 3
2.42 2.42
3.4 18.8 37.3
Strength Parameters
Peak45 37
2.17 psi 0.67
72781
aResult 1 Result 2
9/27/2002
10.301.002.42
DIRECT SHEAR TEST REPORT
9/27/2002 9/27/2002b c
C2KE2Boring:
21.7
51.44
0.25320.0 23.5
5.86 26.45
0.252 0.250
0.0039 0.004024.303.50 48.61
1.00 1.0010.5010.40
0.0040
Shear Stress
-10.0
0.0
10.0
20.0
30.0
40.0
50.0
60.0
0.00 0.05 0.10 0.15 0.20 0.25 0.30 0.35
Horizontal Displacement (inch)
She
ar S
tress
(psi
)
Result 1Result 2Result 3
Displacement
-0.035
-0.030
-0.025
-0.020
-0.015
-0.010
-0.005
0.000
0.0050.00 0.05 0.10 0.15 0.20 0.25 0.30 0.35
Horizontal Displacement (inch)
Verti
cal D
ispl
acem
ent (
inch
)
Result 1Result 2Result 3
Strength Envelope Peak & Residual
0.0
10.0
20.0
30.0
40.0
50.0
60.0
70.0
0.0 10.0 20.0 30.0 40.0 50.0 60.0
Normal Stress (psi)S
hear
Stre
ss (p
si)
DigiShear __ KE2-C219

Residual Friction Angle = degrees
Cohesion =
Project: Sample:
Specimen:Date TestedDiameter (inch):Height (inch):Depth (ft):
SHEARDisplacement Rate(in/min)Normal Stress (psi)Peak Shear Stress(psi)Residual Shear Stress(psi)Residual Point Picked @(in)
Time @ Peak Failure (min)
Specimen Commentsa Sand w/coarse ans some rocks, inundated.b Sand w/coarse and some small rock, inundated.c Sand w/ coarse and some small rocks, inundated.
Result 3
2.42 2.42
3.3 17.7 32.2
Strength Parameters
Peak37 33
3.14 psi 1.41
72781
aResult 1 Result 2
9/30/2002
16.001.002.42
DIRECT SHEAR TEST REPORT
9/30/2002 9/30/2002b c
E2KE2Boring:
17.2
39.18
0.25118.0 17.5
5.13 22.62
0.252 0.251
0.0039 0.003924.293.50 48.60
1.00 1.0016.2016.10
0.0040
Shear Stress
0.0
5.0
10.0
15.0
20.0
25.0
30.0
35.0
40.0
45.0
0.00 0.05 0.10 0.15 0.20 0.25 0.30
Horizontal Displacement (inch)
She
ar S
tress
(psi
)
Result 1Result 2Result 3
Displacement
-0.020
-0.015
-0.010
-0.005
0.000
0.0050.00 0.05 0.10 0.15 0.20 0.25 0.30
Horizontal Displacement (inch)
Verti
cal D
ispl
acem
ent (
inch
)
Result 1Result 2Result 3
Strength Envelope Peak & Residual
0.0
5.0
10.0
15.0
20.0
25.0
30.0
35.0
40.0
45.0
50.0
0.0 10.0 20.0 30.0 40.0 50.0 60.0
Normal Stress (psi)S
hear
Stre
ss (p
si)
DigiShear __ KE2-E220
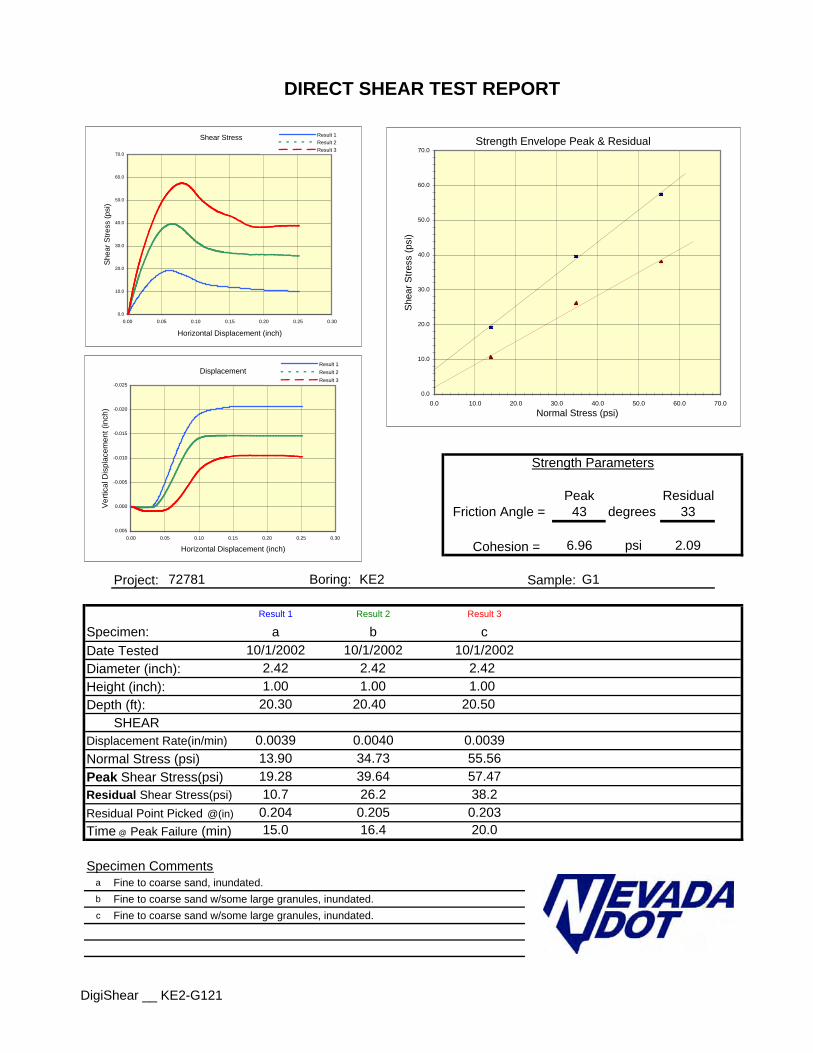
Residual Friction Angle = degrees
Cohesion =
Project: Sample:
Specimen:Date TestedDiameter (inch):Height (inch):Depth (ft):
SHEARDisplacement Rate(in/min)Normal Stress (psi)Peak Shear Stress(psi)Residual Shear Stress(psi)Residual Point Picked @(in)
Time @ Peak Failure (min)
Specimen Commentsa Fine to coarse sand, inundated.b Fine to coarse sand w/some large granules, inundated.c Fine to coarse sand w/some large granules, inundated.
Result 3
2.42 2.42
10.7 26.2 38.2
Strength Parameters
Peak43 33
6.96 psi 2.09
72781
aResult 1 Result 2
10/1/2002
20.301.002.42
DIRECT SHEAR TEST REPORT
10/1/2002 10/1/2002b c
G1KE2Boring:
20.0
57.47
0.20315.0 16.4
19.28 39.64
0.204 0.205
0.0039 0.003934.7313.90 55.56
1.00 1.0020.5020.40
0.0040
Shear Stress
0.0
10.0
20.0
30.0
40.0
50.0
60.0
70.0
0.00 0.05 0.10 0.15 0.20 0.25 0.30
Horizontal Displacement (inch)
She
ar S
tress
(psi
)
Result 1Result 2Result 3
Displacement
-0.025
-0.020
-0.015
-0.010
-0.005
0.000
0.0050.00 0.05 0.10 0.15 0.20 0.25 0.30
Horizontal Displacement (inch)
Verti
cal D
ispl
acem
ent (
inch
)
Result 1Result 2Result 3
Strength Envelope Peak & Residual
0.0
10.0
20.0
30.0
40.0
50.0
60.0
70.0
0.0 10.0 20.0 30.0 40.0 50.0 60.0 70.0
Normal Stress (psi)S
hear
Stre
ss (p
si)
DigiShear __ KE2-G121

Residual Friction Angle = degrees
Cohesion =
Project: Sample:
Specimen:Date TestedDiameter (inch):Height (inch):Depth (ft):
SHEARDisplacement Rate(in/min)Normal Stress (psi)Peak Shear Stress(psi)Residual Shear Stress(psi)Residual Point Picked @(in)
Time @ Peak Failure (min)
Specimen Commentsa Fine to coarse sand w/some large granules, inundated.b Fine to coarse sand w/ some large granules, inundated.c Fine to coarse sand w/some large granules, inundated.
Result 3
2.42 2.42
10.8 25.7 42.6
Strength Parameters
Peak38 37
9.00 psi -0.13
72781
aResult 1 Result 2
10/2/2002
20.901.002.42
DIRECT SHEAR TEST REPORT
10/2/2002 10/2/2002b c
G2KE2Boring:
22.7
51.97
0.25212.5 14.5
19.93 35.24
0.156 0.205
0.0040 0.004034.7413.90 55.55
1.00 1.0021.1021.00
0.0039
Shear Stress
0.0
10.0
20.0
30.0
40.0
50.0
60.0
0.00 0.05 0.10 0.15 0.20 0.25 0.30
Horizontal Displacement (inch)
She
ar S
tress
(psi
)
Result 1Result 2Result 3
Displacement
-0.025
-0.020
-0.015
-0.010
-0.005
0.000
0.0050.00 0.05 0.10 0.15 0.20 0.25 0.30
Horizontal Displacement (inch)
Verti
cal D
ispl
acem
ent (
inch
)
Result 1Result 2Result 3
Strength Envelope Peak & Residual
0.0
10.0
20.0
30.0
40.0
50.0
60.0
0.0 10.0 20.0 30.0 40.0 50.0 60.0 70.0
Normal Stress (psi)S
hear
Stre
ss (p
si)
DigiShear __ KE2-G222

Residual Friction Angle = degrees
Cohesion =
Project: Sample:
Specimen:Date TestedDiameter (inch):Height (inch):Depth (ft):
SHEARDisplacement Rate(in/min)Normal Stress (psi)Peak Shear Stress(psi)Residual Shear Stress(psi)Residual Point Picked @(in)
Time @ Peak Failure (min)
Specimen Commentsa Clayey sand w/some small gravel, inundated.b Clayey sand w/some small gravel, inundated.c Clayey sand w/some small gravel, inundated.
Result 3
2.42 2.42
11.7 25.3 37.8
Strength Parameters
Peak39 32
6.40 psi 3.17
72781
aResult 1 Result 2
10/8/2002
27.601.002.42
DIRECT SHEAR TEST REPORT
10/8/2002 10/9/2002b c
I1KE2Boring:
18.5
50.50
0.25111.4 15.1
17.12 35.06
0.251 0.251
0.0040 0.004034.7313.90 55.56
1.00 1.0027.8027.70
0.0040
Shear Stress
0.0
10.0
20.0
30.0
40.0
50.0
60.0
0.00 0.05 0.10 0.15 0.20 0.25 0.30
Horizontal Displacement (inch)
She
ar S
tress
(psi
)
Result 1Result 2Result 3
Displacement
-0.016
-0.014
-0.012
-0.010
-0.008
-0.006
-0.004
-0.002
0.000
0.0020.00 0.05 0.10 0.15 0.20 0.25 0.30
Horizontal Displacement (inch)
Verti
cal D
ispl
acem
ent (
inch
)
Result 1Result 2Result 3
Strength Envelope Peak & Residual
0.0
10.0
20.0
30.0
40.0
50.0
60.0
0.0 10.0 20.0 30.0 40.0 50.0 60.0 70.0
Normal Stress (psi)S
hear
Stre
ss (p
si)
DigiShear __ KE2-I123
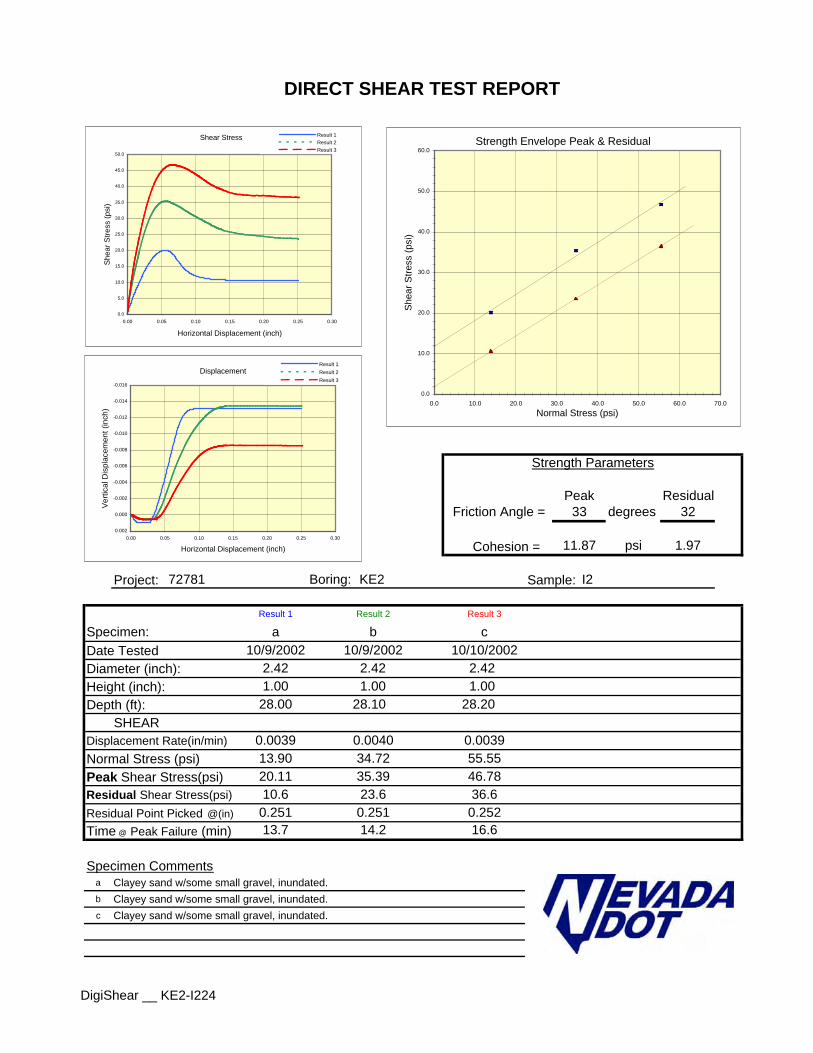
Residual Friction Angle = degrees
Cohesion =
Project: Sample:
Specimen:Date TestedDiameter (inch):Height (inch):Depth (ft):
SHEARDisplacement Rate(in/min)Normal Stress (psi)Peak Shear Stress(psi)Residual Shear Stress(psi)Residual Point Picked @(in)
Time @ Peak Failure (min)
Specimen Commentsa Clayey sand w/some small gravel, inundated.b Clayey sand w/some small gravel, inundated.c Clayey sand w/some small gravel, inundated.
Result 3
2.42 2.42
10.6 23.6 36.6
Strength Parameters
Peak33 32
11.87 psi 1.97
72781
aResult 1 Result 2
10/9/2002
28.001.002.42
DIRECT SHEAR TEST REPORT
10/9/2002 10/10/2002b c
I2KE2Boring:
16.6
46.78
0.25213.7 14.2
20.11 35.39
0.251 0.251
0.0039 0.003934.7213.90 55.55
1.00 1.0028.2028.10
0.0040
Shear Stress
0.0
5.0
10.0
15.0
20.0
25.0
30.0
35.0
40.0
45.0
50.0
0.00 0.05 0.10 0.15 0.20 0.25 0.30
Horizontal Displacement (inch)
She
ar S
tress
(psi
)
Result 1Result 2Result 3
Displacement
-0.016
-0.014
-0.012
-0.010
-0.008
-0.006
-0.004
-0.002
0.000
0.0020.00 0.05 0.10 0.15 0.20 0.25 0.30
Horizontal Displacement (inch)
Verti
cal D
ispl
acem
ent (
inch
)
Result 1Result 2Result 3
Strength Envelope Peak & Residual
0.0
10.0
20.0
30.0
40.0
50.0
60.0
0.0 10.0 20.0 30.0 40.0 50.0 60.0 70.0
Normal Stress (psi)S
hear
Stre
ss (p
si)
DigiShear __ KE2-I224
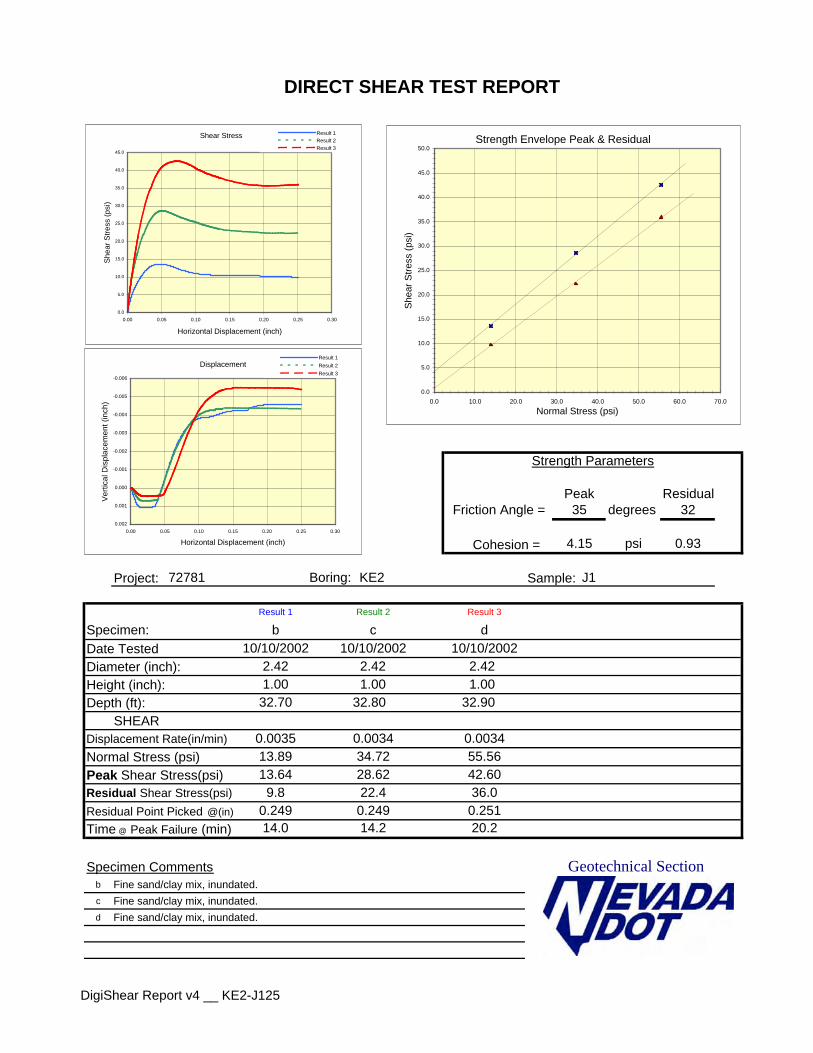
Residual Friction Angle = degrees
Cohesion =
Project: Sample:
Specimen:Date TestedDiameter (inch):Height (inch):Depth (ft):
SHEARDisplacement Rate(in/min)Normal Stress (psi)Peak Shear Stress(psi)Residual Shear Stress(psi)Residual Point Picked @(in)
Time @ Peak Failure (min)
Specimen Commentsb Fine sand/clay mix, inundated.c Fine sand/clay mix, inundated.d Fine sand/clay mix, inundated.
Peak35 32
4.15 psi
Geotechnical Section
Strength Parameters
72781
bResult 1 Result 2
0.93
KE2Boring:
10/10/2002
32.701.002.42 2.42 2.42
Result 3
36.0
DIRECT SHEAR TEST REPORT
10/10/2002 10/10/2002c d
J1
22.4
20.2
42.60
0.251
34.7213.89 55.56
14.0 14.2
13.64 28.62
0.249 0.2499.8
0.0035 0.0034 0.0034
32.9032.801.00 1.00
Shear Stress
0.0
5.0
10.0
15.0
20.0
25.0
30.0
35.0
40.0
45.0
0.00 0.05 0.10 0.15 0.20 0.25 0.30
Horizontal Displacement (inch)
She
ar S
tress
(psi
)
Result 1Result 2Result 3
Displacement
-0.006
-0.005
-0.004
-0.003
-0.002
-0.001
0.000
0.001
0.0020.00 0.05 0.10 0.15 0.20 0.25 0.30
Horizontal Displacement (inch)
Verti
cal D
ispl
acem
ent (
inch
)
Result 1Result 2Result 3
Strength Envelope Peak & Residual
0.0
5.0
10.0
15.0
20.0
25.0
30.0
35.0
40.0
45.0
50.0
0.0 10.0 20.0 30.0 40.0 50.0 60.0 70.0
Normal Stress (psi)S
hear
Stre
ss (p
si)
DigiShear Report v4 __ KE2-J125

Residual Friction Angle = degrees
Cohesion =
Project: Sample:
Specimen:Date TestedDiameter (inch):Height (inch):Depth (ft):
SHEARDisplacement Rate(in/min)Normal Stress (psi)Peak Shear Stress(psi)Residual Shear Stress(psi)Residual Point Picked @(in)
Time @ Peak Failure (min)
Specimen Commentsa Clayey sand, inundated.b Clayey sand, inundated.c Clayey sand, inundated.
Peak36 32
8.46 psi
Geotechnical Section
Strength Parameters
72781
aResult 1 Result 2
1.39
KE2Boring:
10/11/2002
33.001.002.42 2.42 2.42
Result 3
36.8
DIRECT SHEAR TEST REPORT
10/11/2002 10/11/2002b c
J2
23.5
17.0
47.42
0.193
34.7213.90 55.56
10.6 14.4
17.60 34.95
0.193 0.19310.3
0.0035 0.0035 0.0035
33.2033.101.00 1.00
Shear Stress
0.0
5.0
10.0
15.0
20.0
25.0
30.0
35.0
40.0
45.0
50.0
0.00 0.05 0.10 0.15 0.20 0.25 0.30
Horizontal Displacement (inch)
She
ar S
tress
(psi
)
Result 1Result 2Result 3
Displacement
-0.014
-0.012
-0.010
-0.008
-0.006
-0.004
-0.002
0.000
0.0020.00 0.05 0.10 0.15 0.20 0.25 0.30
Horizontal Displacement (inch)
Verti
cal D
ispl
acem
ent (
inch
)
Result 1Result 2Result 3
Strength Envelope Peak & Residual
0.0
10.0
20.0
30.0
40.0
50.0
60.0
0.0 10.0 20.0 30.0 40.0 50.0 60.0 70.0
Normal Stress (psi)S
hear
Stre
ss (p
si)
DigiShear Report v4 __ KE2-J226

Residual Friction Angle = degrees
Cohesion =
Project: Sample:
Specimen:Date TestedDiameter (inch):Height (inch):Depth (ft):
SHEARDisplacement Rate(in/min)Normal Stress (psi)Peak Shear Stress(psi)Residual Shear Stress(psi)Residual Point Picked @(in)
Time @ Peak Failure (min)
Specimen Commentsa Slightly clayey sand w/some small rock, inundated.b Slightly clayey sand w/some small rock, inundated.c Slightly clayey sand w/some small rock, inundated.
Peak41 42
1.66 psi
Geotechnical Section
Strength Parameters
72781
aResult 1 Result 2
-4.01
KE2Boring:
10/14/2002
47.601.002.42 2.42 2.42
Result 3
48.4
DIRECT SHEAR TEST REPORT
10/14/2002 10/14/2002b c
M1
22.7
30.0
51.57
0.251
34.7113.89 55.52
17.5 24.9
15.49 28.17
0.251 0.25110.8
0.0039 0.0039 0.0039
47.8047.701.00 1.00
Shear Stress
0.0
10.0
20.0
30.0
40.0
50.0
60.0
0.00 0.05 0.10 0.15 0.20 0.25 0.30
Horizontal Displacement (inch)
She
ar S
tress
(psi
)
Result 1Result 2Result 3
Displacement
-0.014
-0.012
-0.010
-0.008
-0.006
-0.004
-0.002
0.000
0.002
0.0040.00 0.05 0.10 0.15 0.20 0.25 0.30
Horizontal Displacement (inch)
Verti
cal D
ispl
acem
ent (
inch
)
Result 1Result 2Result 3
Strength Envelope Peak & Residual
0.0
10.0
20.0
30.0
40.0
50.0
60.0
0.0 10.0 20.0 30.0 40.0 50.0 60.0 70.0
Normal Stress (psi)S
hear
Stre
ss (p
si)
DigiShear Report v4 __ KE2-M127

Residual Friction Angle = degrees
Cohesion =
Project: Sample:
Specimen:Date TestedDiameter (inch):Height (inch):Depth (ft):
SHEARDisplacement Rate(in/min)Normal Stress (psi)Peak Shear Stress(psi)Residual Shear Stress(psi)Residual Point Picked @(in)
Time @ Peak Failure (min)
Specimen Commentsa Slightly calayey sand w/some small rock, inundated.b Slightly clayey sand w/some small rock, inundated.c Slightly clayey sand w/some small rock, inundated.
Peak37 34
10.39 psi
Geotechnical Section
Strength Parameters
72781
aResult 1 Result 2
4.26
KE2Boring:
10/15/2002
48.001.002.42 2.42 2.42
Result 3
39.3
DIRECT SHEAR TEST REPORT
10/15/2002 10/15/2002b c
M2
31.6
17.7
51.33
0.251
34.7213.89 55.54
13.7 16.8
20.14 37.69
0.251 0.25111.5
0.0039 0.0039 0.0039
48.2048.101.00 1.00
Shear Stress
-10.0
0.0
10.0
20.0
30.0
40.0
50.0
60.0
0.00 0.05 0.10 0.15 0.20 0.25 0.30
Horizontal Displacement (inch)
She
ar S
tress
(psi
)
Result 1Result 2Result 3
Displacement
-0.025
-0.020
-0.015
-0.010
-0.005
0.000
0.0050.00 0.05 0.10 0.15 0.20 0.25 0.30
Horizontal Displacement (inch)
Verti
cal D
ispl
acem
ent (
inch
)
Result 1Result 2Result 3
Strength Envelope Peak & Residual
0.0
10.0
20.0
30.0
40.0
50.0
60.0
0.0 10.0 20.0 30.0 40.0 50.0 60.0 70.0
Normal Stress (psi)S
hear
Stre
ss (p
si)
DigiShear Report v4 __ KE2-M228
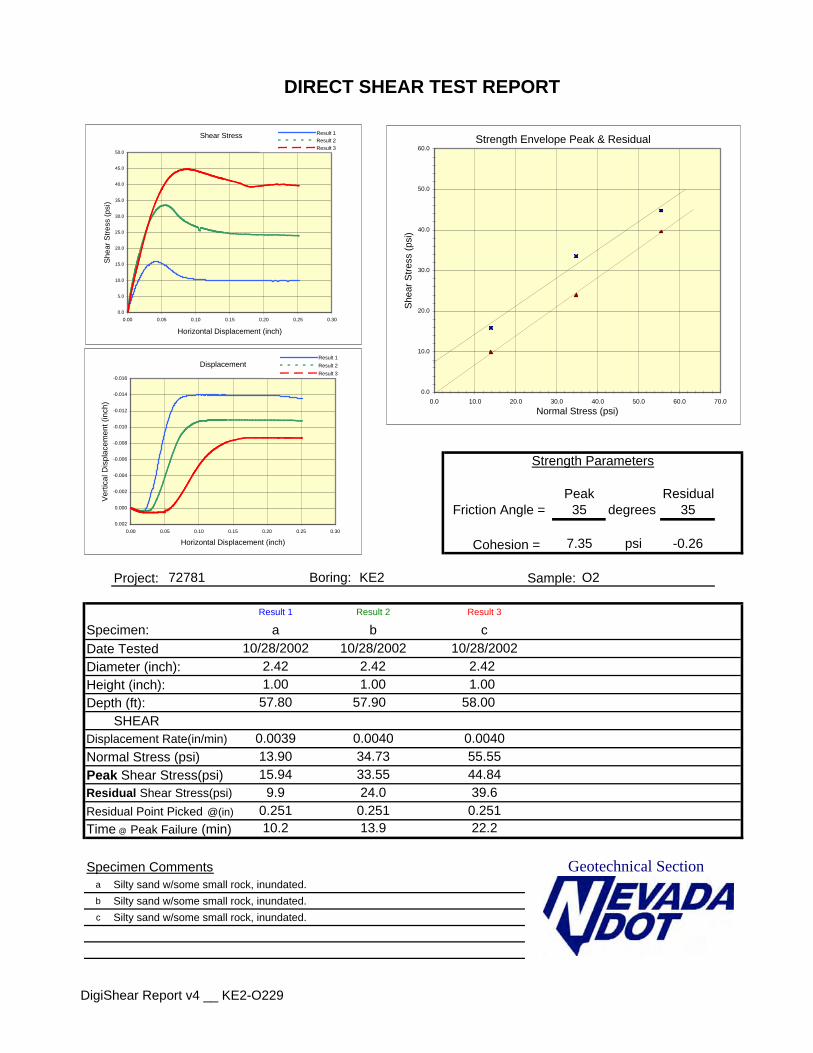
Residual Friction Angle = degrees
Cohesion =
Project: Sample:
Specimen:Date TestedDiameter (inch):Height (inch):Depth (ft):
SHEARDisplacement Rate(in/min)Normal Stress (psi)Peak Shear Stress(psi)Residual Shear Stress(psi)Residual Point Picked @(in)
Time @ Peak Failure (min)
Specimen Commentsa Silty sand w/some small rock, inundated.b Silty sand w/some small rock, inundated.c Silty sand w/some small rock, inundated.
Peak35 35
7.35 psi
Geotechnical Section
Strength Parameters
72781
aResult 1 Result 2
-0.26
KE2Boring:
10/28/2002
57.801.002.42 2.42 2.42
Result 3
39.6
DIRECT SHEAR TEST REPORT
10/28/2002 10/28/2002b c
O2
24.0
22.2
44.84
0.251
34.7313.90 55.55
10.2 13.9
15.94 33.55
0.251 0.2519.9
0.0039 0.0040 0.0040
58.0057.901.00 1.00
Shear Stress
0.0
5.0
10.0
15.0
20.0
25.0
30.0
35.0
40.0
45.0
50.0
0.00 0.05 0.10 0.15 0.20 0.25 0.30
Horizontal Displacement (inch)
She
ar S
tress
(psi
)
Result 1Result 2Result 3
Displacement
-0.016
-0.014
-0.012
-0.010
-0.008
-0.006
-0.004
-0.002
0.000
0.0020.00 0.05 0.10 0.15 0.20 0.25 0.30
Horizontal Displacement (inch)
Verti
cal D
ispl
acem
ent (
inch
)
Result 1Result 2Result 3
Strength Envelope Peak & Residual
0.0
10.0
20.0
30.0
40.0
50.0
60.0
0.0 10.0 20.0 30.0 40.0 50.0 60.0 70.0
Normal Stress (psi)S
hear
Stre
ss (p
si)
DigiShear Report v4 __ KE2-O229

Residual Friction Angle = degrees
Cohesion =
Project: Sample:
Specimen:Date TestedDiameter (inch):Height (inch):Depth (ft):
SHEARDisplacement Rate(in/min)Normal Stress (psi)Peak Shear Stress(psi)Residual Shear Stress(psi)Residual Point Picked @(in)
Time @ Peak Failure (min)
Specimen Commentsa Silty to coarse sand w/gravel, inundatedb Becoming more clayey, some gravel, inundated.c Clayey sand w/some gravel, inundated.
Peak41 33
4.74 psi
Geotechnical Section
Strength Parameters
72781
aResult 1 Result 2
2.20
KE2Boring:
10/29/2002
67.501.002.42 2.42 2.42
Result 3
38.6
DIRECT SHEAR TEST REPORT
10/29/2002 10/29/2002b c
Q2
23.4
19.3
53.32
0.250
34.7213.90 55.55
13.9 18.3
16.72 35.75
0.250 0.25011.7
0.0040 0.0039 0.0040
67.7067.601.00 1.00
Shear Stress
-10.0
0.0
10.0
20.0
30.0
40.0
50.0
60.0
0.00 0.05 0.10 0.15 0.20 0.25 0.30
Horizontal Displacement (inch)
She
ar S
tress
(psi
)
Result 1Result 2Result 3
Displacement
-0.025
-0.020
-0.015
-0.010
-0.005
0.000
0.0050.00 0.05 0.10 0.15 0.20 0.25 0.30
Horizontal Displacement (inch)
Verti
cal D
ispl
acem
ent (
inch
)
Result 1Result 2Result 3
Strength Envelope Peak & Residual
0.0
10.0
20.0
30.0
40.0
50.0
60.0
70.0
0.0 10.0 20.0 30.0 40.0 50.0 60.0 70.0
Normal Stress (psi)S
hear
Stre
ss (p
si)
DigiShear Report v4 __ KE2-Q230
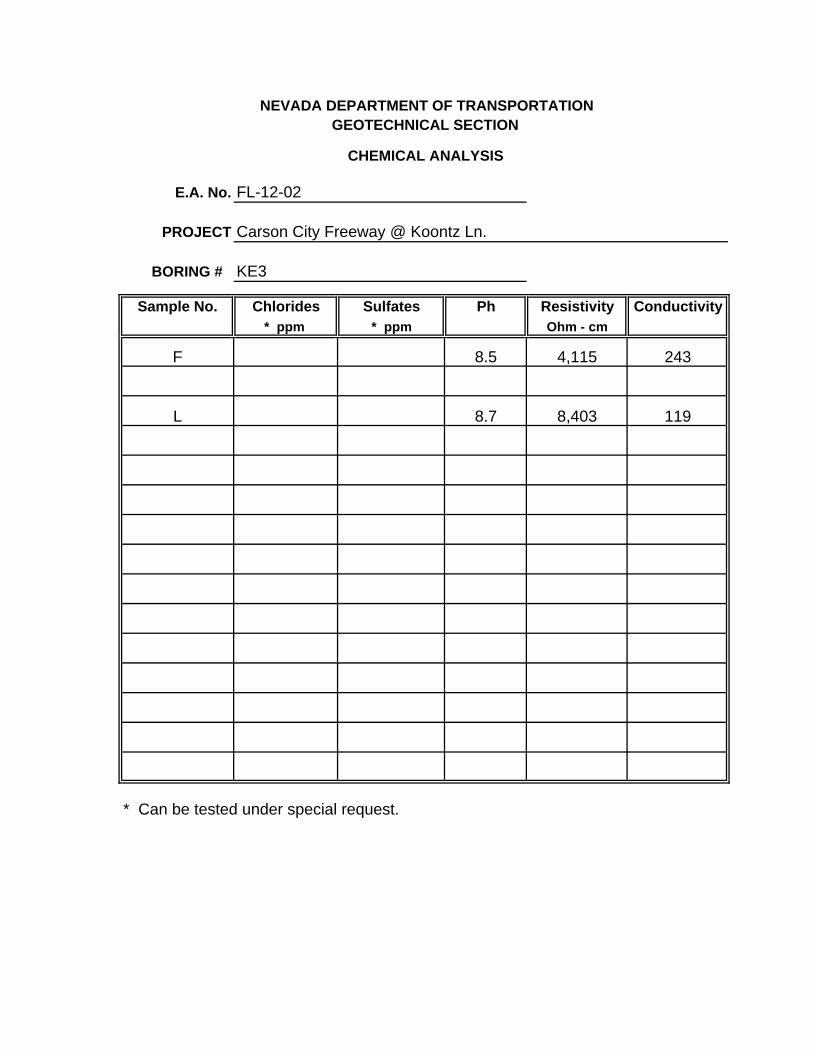
E.A. No. FL-12-02
PROJECT Carson City Freeway @ Koontz Ln.
BORING # KE3
Sample No. Chlorides Sulfates Ph Resistivity Conductivity * ppm * ppm Ohm - cm
F 8.5 4,115 243
L 8.7 8,403 119
* Can be tested under special request.
NEVADA DEPARTMENT OF TRANSPORTATIONGEOTECHNICAL SECTION
CHEMICAL ANALYSIS