grade 9 math unit 4: linear relations sec 4.1: writing ... · grade 9 math unit 4: linear relations...
TRANSCRIPT
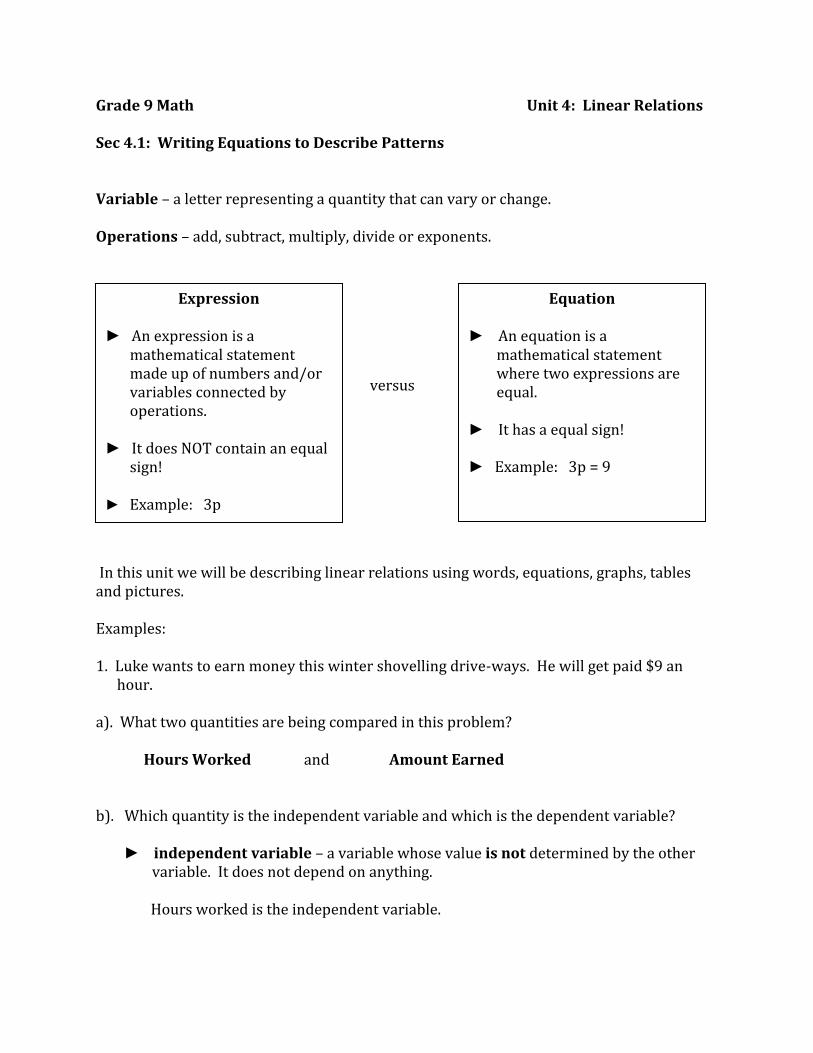
Grade 9 Math Unit 4: Linear Relations Sec 4.1: Writing Equations to Describe Patterns Variable – a letter representing a quantity that can vary or change. Operations – add, subtract, multiply, divide or exponents.
versus In this unit we will be describing linear relations using words, equations, graphs, tables and pictures. Examples: 1. Luke wants to earn money this winter shovelling drive-ways. He will get paid $9 an hour. a). What two quantities are being compared in this problem? Hours Worked and Amount Earned b). Which quantity is the independent variable and which is the dependent variable? ► independent variable – a variable whose value is not determined by the other variable. It does not depend on anything. Hours worked is the independent variable.
Expression
► An expression is a mathematical statement made up of numbers and/or variables connected by operations. ► It does NOT contain an equal sign! ► Example: 3p
Equation
► An equation is a mathematical statement where two expressions are equal. ► It has a equal sign! ► Example: 3p = 9

► dependent variable – a variable whose value is determined by the other variable. It always depends on the independent variable. Since the amount earned depends on the hours worked then, amount earned in the dependent variable. When trying to figure out which quantity is the independent and which is the dependent variable, complete the following sentence. _________________________________________ depends on ________________________________________ Dependent Independent “ The amount earned depends on the hours worked .” c). Complete the table of values. Independent Dependent Variable Variable d). Write an expression to represent the amount Luke earns per hour? or 9h e). Write an equation to represent the amount Luke will earn? h
Number of hours worked, h
Amount Earned, A
1 9 2 18 3 27 4 36 5 45

► whenever the independent variable increases by the 1, you can use the following strategy to find the equation. Find the difference in the dependent variable ► the number that the dependent variable increases by should be the same! ► use this number to multiply the independent variable by. Does YES Does YES etc Therefore, the equation is: h f). Use the equation to determine how much Luke will make shovelling 11 hours in one week? h He will earn $99 with 11hours of shovelling A = $99 g). Use the equation to determine how many hours will Luke will need to shovel to earn $72? h 72 It will take him 8 hours to earn $72. h = 8
Number of hours worked, h
Amount Earned, A
1 9 2 18 3 27 4 36 5 45
Increased by 9
9
9
9
Number of hours worked,
h
Amount Earned, A
1 9 2 18 3 27 4 36 5 45
9
9
9
9
X9
X9
X9
X9
X9

More Examples 2. A banquet hall has small square tables that seat 1 person on each side. The tables can be pushed together to form longer tables, as shown below. 1 table 2 tables 3 tables a). Sketch the next two table arrangements in the pattern. 4 tables 5 tables b). What stays the same in each table arrangement? ► the first table stays the same and there’s always the original four people. Description in words. What changes? ► for every new table added, two more people are added. c). What are the independent and dependent variables? _________________________________________ depends on ________________________________________ Dependent Independent “ The number of people sitting depends on the number of tables .”

d). Complete the table of values. e). Write an equation, using the variable, t, for number of tables and p, for the number of people, for this problem. Does NO Does NO etc Therefore, we need to adjust our workings. 2 etc The missing number is 2 We need to multiply the number of tables by 2, then add 2, and that will equal our number of people. Equation: or it can be written as f). What expression can be used to represent the number of people? Expression:
Number of Tables
Number of People
1 4 2 6 3 8 4 10 5 12
Number of Tables, t
Number of People, p
1 4 2 6 3 8 4 10 5 12
2
2
2
2
x2
x2
x2
x2
x2
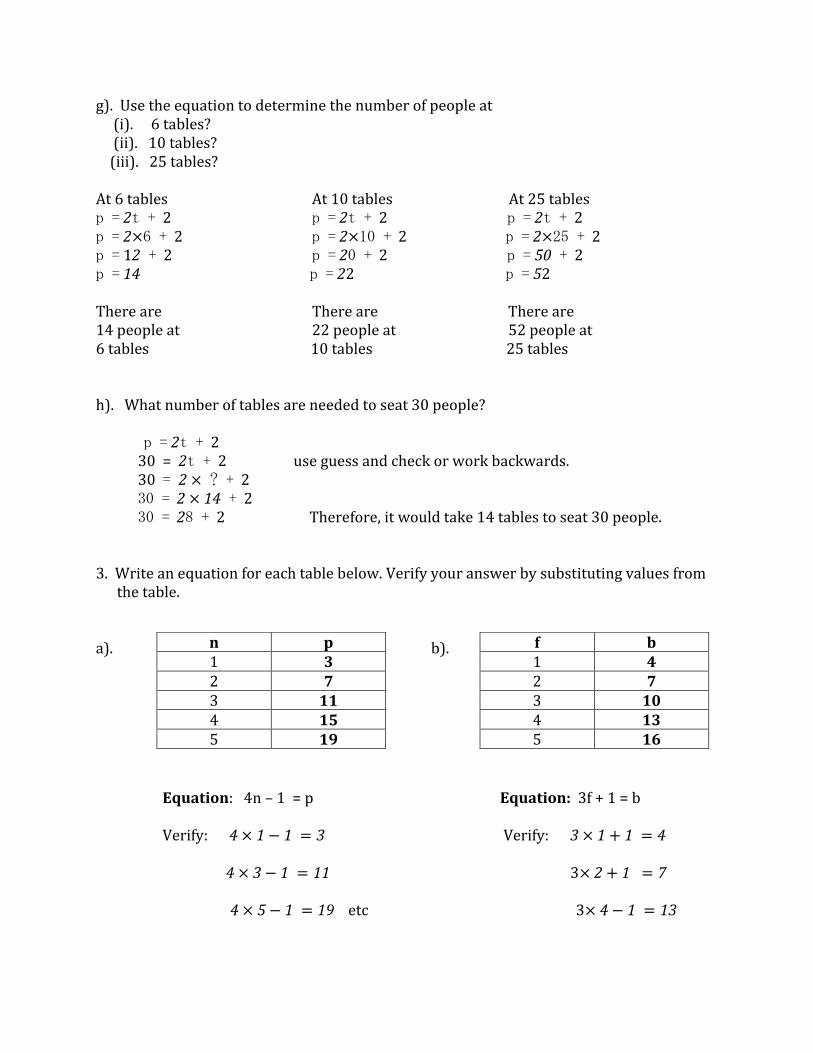
g). Use the equation to determine the number of people at (i). 6 tables? (ii). 10 tables? (iii). 25 tables? At 6 tables At 10 tables At 25 tables There are There are There are 14 people at 22 people at 52 people at 6 tables 10 tables 25 tables h). What number of tables are needed to seat 30 people? 30 = use guess and check or work backwards. 30 Therefore, it would take 14 tables to seat 30 people. 3. Write an equation for each table below. Verify your answer by substituting values from the table. a). b). Equation: 4n – 1 = p Equation: 3f + 1 = b Verify: Verify: 3 etc 3
n p 1 3 2 7 3 11 4 15 5 19
f b 1 4 2 7 3 10 4 13 5 16
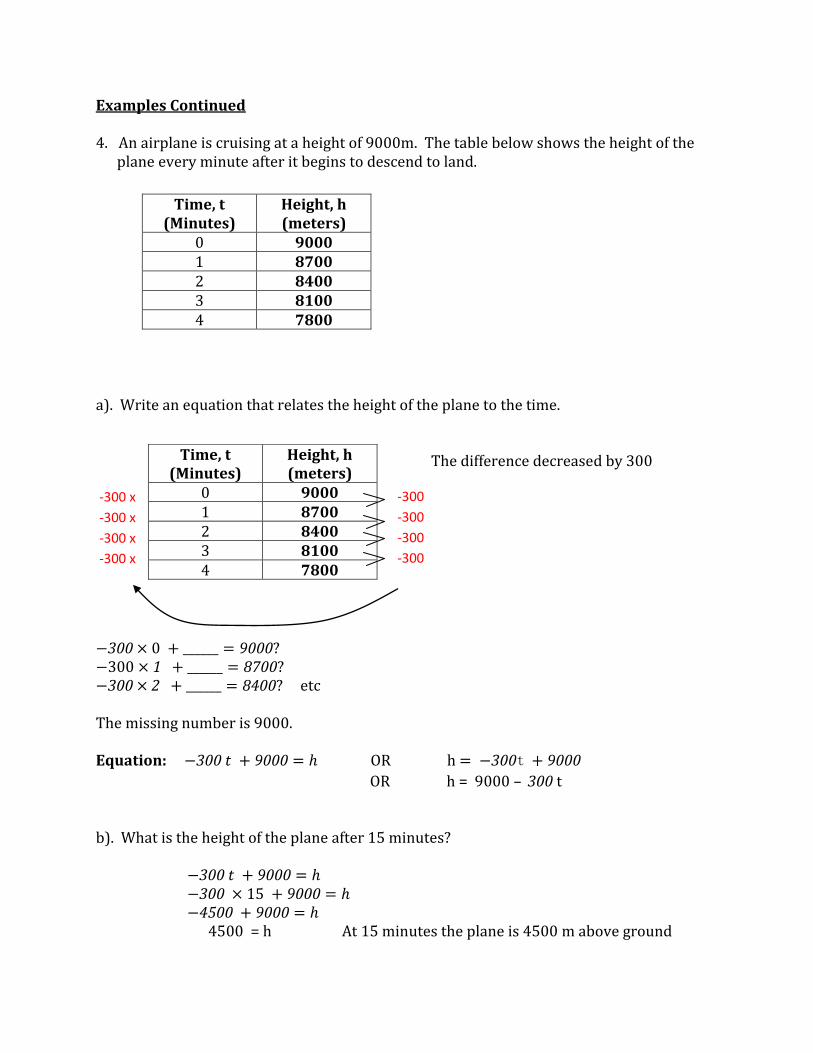
Examples Continued 4. An airplane is cruising at a height of 9000m. The table below shows the height of the plane every minute after it begins to descend to land. a). Write an equation that relates the height of the plane to the time. The difference decreased by 300 300 etc The missing number is 9000. Equation: OR h
OR h = 9000 – t b). What is the height of the plane after 15 minutes? 4500 = h At 15 minutes the plane is 4500 m above ground
Time, t (Minutes)
Height, h (meters)
0 9000 1 8700 2 8400 3 8100 4 7800
Time, t (Minutes)
Height, h (meters)
0 9000 1 8700 2 8400 3 8100 4 7800
-300
-300
-300
-300
-300 x
-300 x
-300 x
-300 x

c). How long after the plane begins its decent does the plane land? ► when the plane lands the height is 0, so find the time when h = 0. At 30 minutes the plane will have landed. 5. Jiffy Cabs charges a fixed rate of $3.60 plus $1.50 per kilometre driven. a). Write an expression for the cost of a ride in the cab. ► 3.60 + 1.50k b). Write an equation for the total cost of a cab ride. ► C = 3.60 + 1.50k c). What is the cost of a 12 km cab ride? ► C = 3.60 + 1.50k C = 3.60 + 1.50 The cost of a 12 km cab ride is $21.60 C = 3.60 + 18 C = 21.6
300 ? = 9000
300 30 = 9000

Introduction to Sec 4.2: Linear Relations Notes: The graph we use to plot points is called the Cartesian Coordinate System. It consists of:
x-axis, which goes horizontal (across)
y-axis, which goes vertical (up/down)
origin , the point where the x and y axes meet. It’s coordinates are (0,0).
4 quadrants.
y
2nd Quadrant 1st Quadrant x origin
3rd Quadrant 4th Quadrant
A point consists of two coordinates: ( x, y )
The first number represents x, it’s the distance to move in the horizontal direction.
Negative # – move left Positive # - move right
The second number represents y, it’s the distance to move in the vertical direction. Negative # – move down Positive # - move up
X always goes first!
Remember each point consists of two numbers which are directions to get you to
one point.

y
x
1
1
2
2
3
3
4
4
5
5
6
6
7
7
8
8
– 1
– 1
– 2
– 2
– 3
– 3
– 4
– 4
– 5
– 5
– 6
– 6
– 7
– 7
– 8
– 8
1
1
2
2
3
3
4
4
5
5
6
6
7
7
8
8
– 1
– 1
– 2
– 2
– 3
– 3
– 4
– 4
– 5
– 5
– 6
– 6
– 7
– 7
– 8
– 8
Example 1: Plot the following points on the coordinate grid below.
A(-2, 5) B(2, 3) C(5, -3) D(0, 3) E(-5, -4) F(-6, 0)
Answers: When creating a graph for a particular problem, for examples hours worked and amount earned, or distance travelled over time, or figure number and number of squares, etc. Remember these important things about graphing:
Increase by the same amount on each axis. For example, the x-axis could increase by 1 and the y-axis could increase by 10, but be consistent on each axis.
Label each axis.
Title the graph
Independent variable goes on the x-axis, dependent variable goes on the y-axis.
A
● B
●
C
●
D ●
E
●
F
●

Sec 4.2: Linear Relations Linear Relation – when the relationship between the independent and dependent variables can be represented in a straight line graph. – a constant change in one variable produces a constant change in the other variable. Examples: 1. Which graph(s) represents a linear relation? Linear Relation Linear Relation Nonlinear Relation 2. Refer to each table below. A). Does it represent a linear relation? B). If the relation is linear, describe it and write an equation. C). If the relation is not linear, how do you know? (i) a). There is a constant change in the dependent variable – so it’s linear. b). The independent variable increases by 1, and the dependent variable increases by 2. Equation: B = 2n + 2 (ii) a). There is a constant change in the dependent Variable – so it’s linear. b). The independent increases by 1 while the dependent increases by 3. Equation: C = 3h – 2
Dep
end
ent
Dep
end
ent
Dep
end
ent
Independent Independent Independent
n B
1 4
2 6
3 8
4 10
5 12
2 2 2 2
h C
1 1
2 4
3 7
4 10
5 13
3 3 3 3
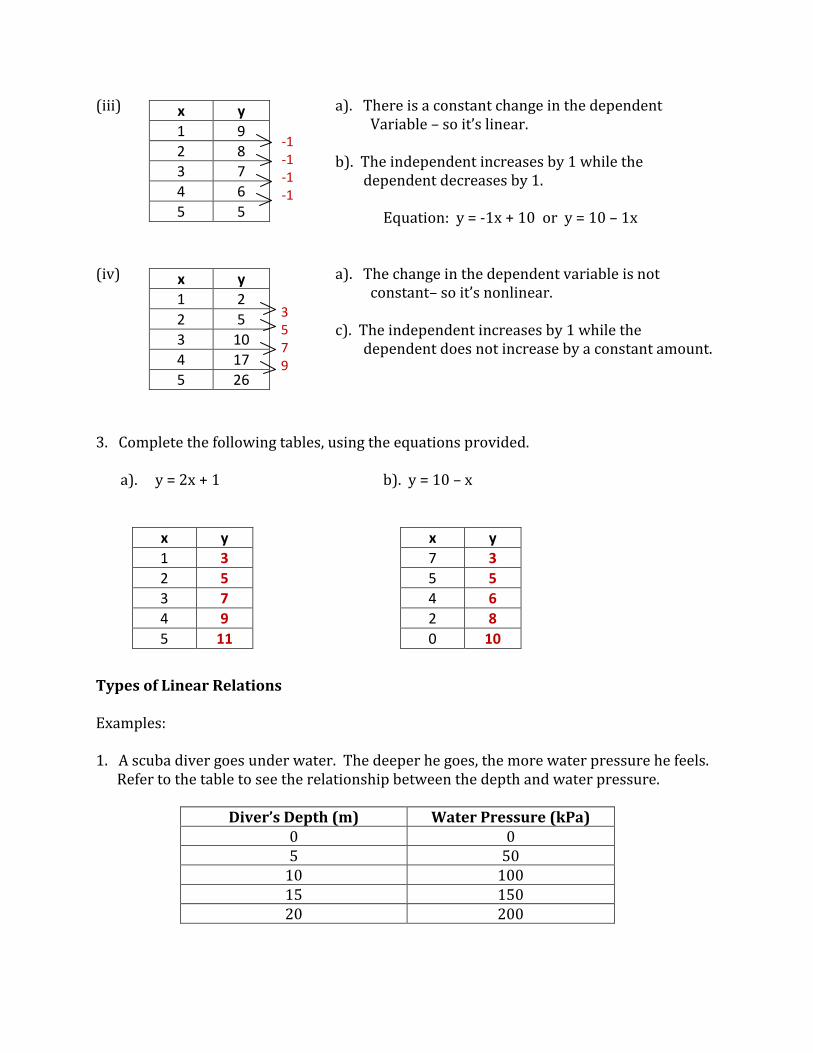
(iii) a). There is a constant change in the dependent Variable – so it’s linear. b). The independent increases by 1 while the dependent decreases by 1. Equation: y = -1x + 10 or y = 10 – 1x (iv) a). The change in the dependent variable is not constant– so it’s nonlinear. c). The independent increases by 1 while the dependent does not increase by a constant amount. 3. Complete the following tables, using the equations provided. a). y = 2x + 1 b). y = 10 – x Types of Linear Relations Examples: 1. A scuba diver goes under water. The deeper he goes, the more water pressure he feels. Refer to the table to see the relationship between the depth and water pressure.
Diver’s Depth (m) Water Pressure (kPa) 0 0 5 50
10 100 15 150 20 200
x y
1 9
2 8
3 7
4 6
5 5
-1 -1 -1 -1
x y
1 2
2 5
3 10
4 17
5 26
3 5 7 9
x y
1 3
2 5
3 7
4 9
5 11
x y
7 3
5 5
4 6
2 8
0 10

). Describe the relationship between the diver’s depth and water pressure....
(i) In words For every 5 meters the diver goes down in the water, the water pressure increases 50 kilopascals. Therefore, for a 1 meter descend, the pressure would increase 10 kilopascals.
(ii) In a Graph
Since there are no negative values in this problem, we only need quadrant 1.
Water pressure depends on diver’s depth .
Dependent (y-axis) independent (x-axis)
Water Pressure on Diver
Increased by 5 on the x-axis. Increased by 50 on the y-axis. Labelled each axes and titled the graph. Connected the points. WHY?????
With any graph ask yourself the question: “Does it make sense to connect the points?” ► In this example, it is possible to find out the water pressure if the diver was 16.5 m below the surface. That makes sense! Therefore, since we can find values between plotted points, we draw the line. ► this type of graph – where it makes sense to connect points – is called continuous.
250
200
150
100
50
0
Wat
er
Pre
ssu
re (
kPa)
Diver’s Depth (m)
5 10 15 20 25 30 ●
● ●
●
●

(iii) In an Equation. Refer back to the table and description in words. If the diver’s depth increased by 1 m the water pressure increased by 10 kPa. d – diver’s depth p – water pressure P = 10d
3. Suppose the following pattern is continued. A). Describe the relationship between the shaded squares and the white squares....
(i) In a picture
Draw the next three diagrams.
(ii) In words ► for each new diagram, one shaded squares is added with two white squares.
(iii) In a table
Complete the table for the first 6 diagrams in this pattern.
(iv) In an equation
s = shaded squares w = white squares W = 2s + 3
Number of Shaded Squares 1 2 3 4 5 6 Number of White Squares 5 7 9 11 13 15

(v) In a graph
Since there are no negative values in this problem, we only need quadrant 1.
White squares depends on shaded squares .
Dependent (y-axis) independent (x-axis)
Square Pattern
Increased by 1 on the x-axis. Increased by 3 on the y-axis. Labelled each axes and titled the graph. Did NOT connect the points. WHY?????
“Does it make sense to connect the points?” ► In this example, it is NOT possible to find out the number of white squares if there are 1.5 shaded squares. You cannot have half a square, it does not make sense! Since we CANNOT find values between plotted points, we DO NOT draw the line. ► this type of graph – where it does not make sense to connect points – is called discrete.
15
12
9
6
3
0
Wh
ite
Sq
uar
es
(w)
Shaded squares (s)
1 2 3 4 5 6
●
● ●
● ●
●

Find the Missing Variable From Equation: Using an equation of any linear relation, you should be able to find a missing variable when given the second variable. Examples: For each equation, find the missing value. 1). Using the linear relation y = 2x + 5 a). What is the value of y if x = 3? Answer: y = 2x + 5 y = 2 × 3 + 5 y = 6 + 5 y = 11 b). What does this mean ….. when x 3 , then y Answer: This is a point, an ordered pair, (3, ) … remember the x coordinate goes first in a point. If we were going to graph the line y = 2x + 5 , (3, 11) would be a point on the line. c). What is the value of x if y = 25? Answer: y = 2x + 5 25 = 2x + 5 use guess and check or work backwards 25 – 5 = 2x + 5 – 5 20 = 2x 10 = x d). What does this mean ….. when y 25 , then x 0 Answer: This is a point, an ordered pair, ( 0, 25) … again x goes first. If we were going to graph the line y = 2x + 5 , (10, 25) would be another point on the line.

2. Using the linear relation y = 3x – 4, what is the value of x if y = 23? Answer: y = 3x – 4 23 = 3x – 4 23 + 4 = 3x – 4 + 4 27 = 3x 9 = x Point ( 9, 23 ) 3. Using the linear relation y = 2x – 1, what is the value of y if x = -2? Answer: y = 2x – 1 y = 2×(-2) – 1 y = -4 – 1 y = -5 Point ( -2, -5 )
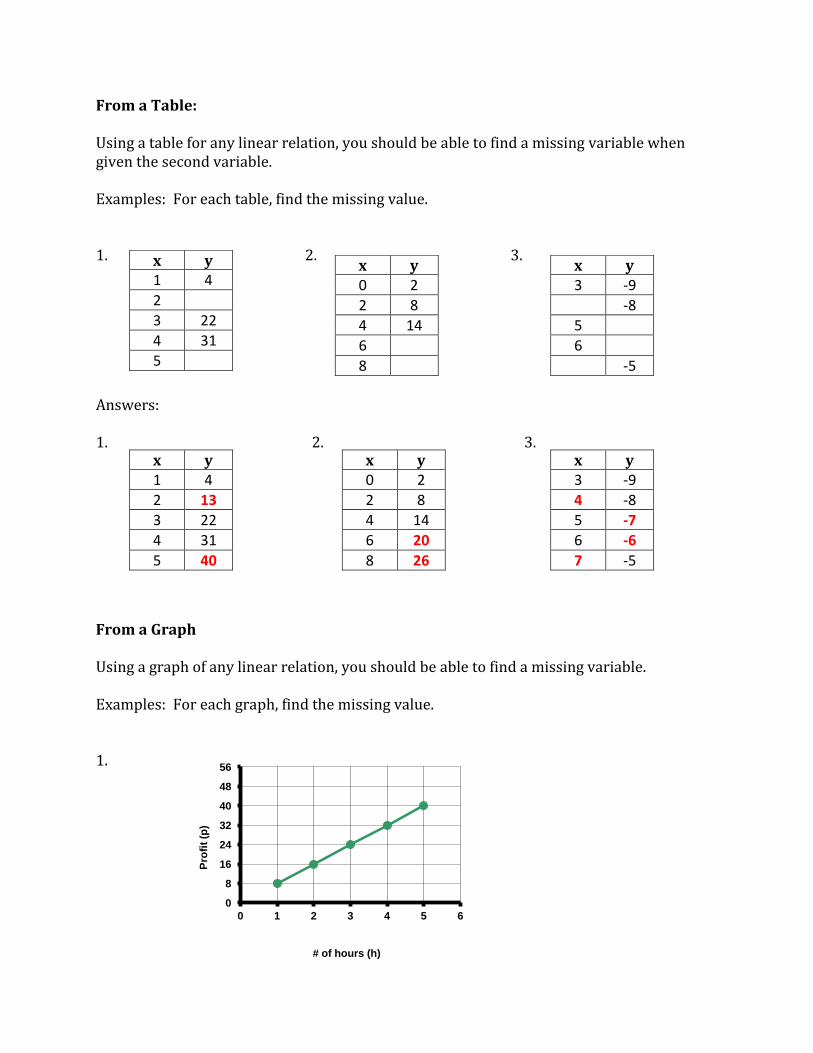
From a Table: Using a table for any linear relation, you should be able to find a missing variable when given the second variable. Examples: For each table, find the missing value. 1. 2. 3. Answers: 1. 2. 3. From a Graph Using a graph of any linear relation, you should be able to find a missing variable. Examples: For each graph, find the missing value. 1.
x y 1 4
2
3 22
4 31
5
x y 0 2
2 8
4 14
6
8
x y 3 -9
-8
5
6
-5
x y 1 4
2 13
3 22
4 31
5 40
x y 0 2
2 8
4 14
6 20
8 26
x y 3 -9
4 -8
5 -7
6 -6
7 -5
0
8
16
24
32
40
48
56
0 1 2 3 4 5 6
Pro
fit
(p)
# of hours (h)

a). What is the Profit for working 2.5 hours?
● From the graph we can estimate that the Profit will be $20 for 2.5 hours worked. This is called interpolating. To interpolate means to estimate a value between two plotted points.
b). What is the Profit for working 6 hours?
● From the graph we can estimate that the Profit will be $48 for 6 hours worked. This is called extrapolating. To extrapolate means to estimate a value that lies beyond the plotted points. We need to extend our graph to find the answer.
0
8
16
24
32
40
48
56
0 1 2 3 4 5 6
Pro
fit
(p)
# of hours (h)
0
8
16
24
32
40
48
56
0 1 2 3 4 5 6
Pro
fit
(p)
# of hours (h)
y
x
1
1
2
2
3
3
4
4
5
5
6
6
7
7
8
8
– 1
– 1
– 2
– 2
– 3
– 3
– 4
– 4
– 5
– 5
– 6
– 6
– 7
– 7
– 8
– 8
1
1
2
2
3
3
4
4
5
5
6
6
7
7
8
8
– 1
– 1
– 2
– 2
– 3
– 3
– 4
– 4
– 5
– 5
– 6
– 6
– 7
– 7
– 8
– 8
y
x
1
1
2
2
3
3
4
4
5
5
6
6
7
7
8
8
– 1
– 1
– 2
– 2
– 3
– 3
– 4
– 4
– 5
– 5
– 6
– 6
– 7
– 7
– 8
– 8
1
1
2
2
3
3
4
4
5
5
6
6
7
7
8
8
– 1
– 1
– 2
– 2
– 3
– 3
– 4
– 4
– 5
– 5
– 6
– 6
– 7
– 7
– 8
– 8
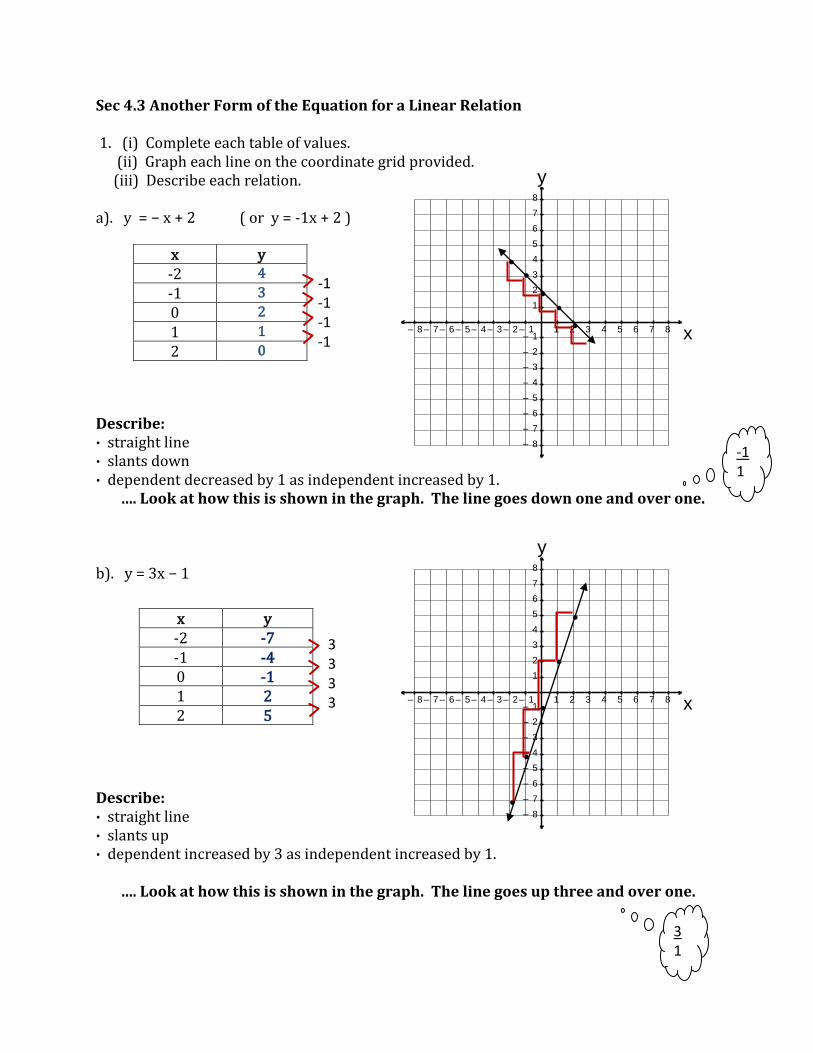
Sec 4.3 Another Form of the Equation for a Linear Relation 1. (i) Complete each table of values. (ii) Graph each line on the coordinate grid provided. (iii) Describe each relation. a). y − x + 2 ( or y = -1x + 2 )
Describe: ∙ straight line ∙ slants down ∙ dependent decreased by 1 as independent increased by 1. …. Look at how this is shown in the graph. The line goes down one and over one. b). y 3x − Describe: ∙ straight line ∙ slants up ∙ dependent increased by 3 as independent increased by 1. …. Look at how this is shown in the graph. The line goes up three and over one.
x y -2 4
-1 3
0 2
1 1
2 0
x y -2 -7 -1 -4 0 -1 1 2 2 5
• •
• •
•
-1 -1 -1 -1
3 3 3 3
•
•
•
•
•
3 1
-1 1

• These lines are called oblique lines. This means they are slanted. • They can slant in either direction and can have different steepness. • They will always contain two variables. • When the independent increases by ….. And the dependent decreases the line will slant down. This is represented in the equation y = -1 x + 2, with the negative number in front of x. • When the independent increases by ….. And the dependent increases the line will slant up. This is represented in the equation y = 3 x - 1, with the positive number in front of x. Which of these lines is steeper? The line y = 3x – 1 is steeper. You can also determine this from the equation because 3 > 1. Notice these two lines are in the same form. y = ax + b ( ex: y = 2x + 3 or y = -3x – 1) We can also represent lines in other forms. Refer to the following examples.
y
x
1
1
2
2
3
3
4
4
5
5
6
6
7
7
8
8
– 1
– 1
– 2
– 2
– 3
– 3
– 4
– 4
– 5
– 5
– 6
– 6
– 7
– 7
– 8
– 8
1
1
2
2
3
3
4
4
5
5
6
6
7
7
8
8
– 1
– 1
– 2
– 2
– 3
– 3
– 4
– 4
– 5
– 5
– 6
– 6
– 7
– 7
– 8
– 8
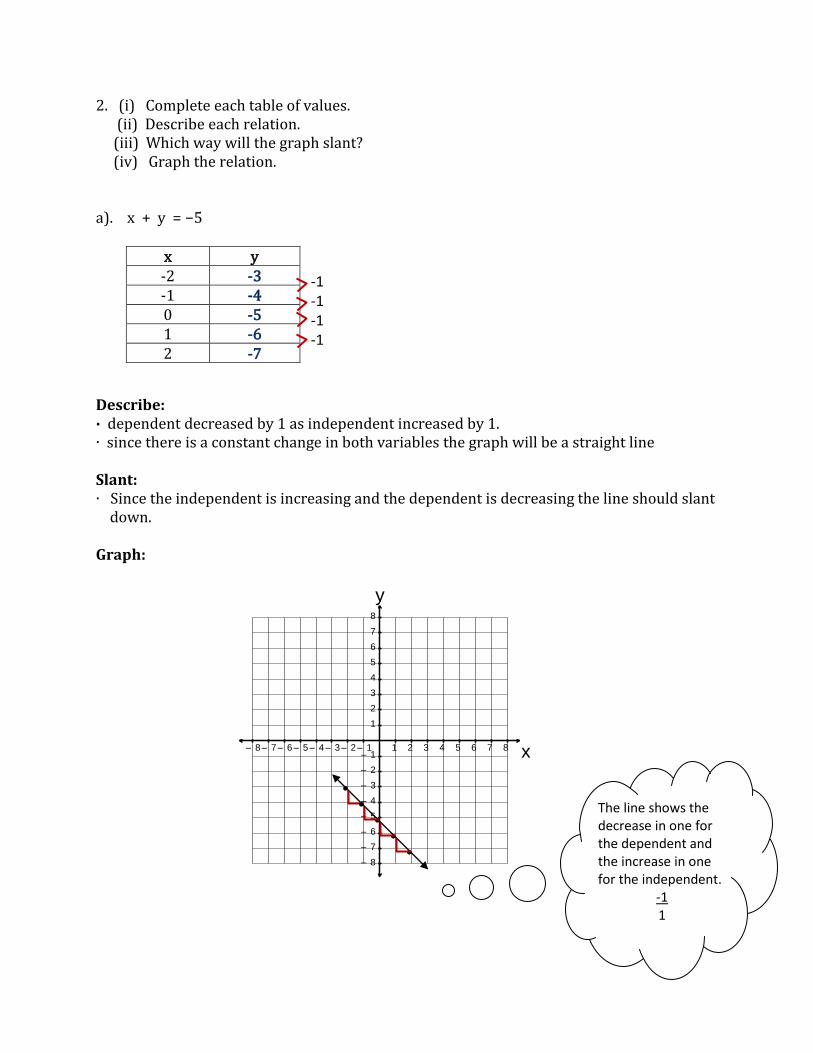
2. (i) Complete each table of values. (ii) Describe each relation. (iii) Which way will the graph slant? (iv) Graph the relation. a). x + y −5 Describe: ∙ dependent decreased by 1 as independent increased by 1. ∙ since there is a constant change in both variables the graph will be a straight line Slant: ∙ Since the independent is increasing and the dependent is decreasing the line should slant down. Graph:
x y -2 -3 -1 -4 0 -5 1 -6 2 -7
-1 -1 -1 -1
•
• •
•
• The line shows the decrease in one for the dependent and the increase in one for the independent.
-1 1

y
x
1
1
2
2
3
3
4
4
5
5
6
6
7
7
8
8
– 1
– 1
– 2
– 2
– 3
– 3
– 4
– 4
– 5
– 5
– 6
– 6
– 7
– 7
– 8
– 8
1
1
2
2
3
3
4
4
5
5
6
6
7
7
8
8
– 1
– 1
– 2
– 2
– 3
– 3
– 4
– 4
– 5
– 5
– 6
– 6
– 7
– 7
– 8
– 8
b). 3x − 2y 6 Describe: ∙ dependent increased by 4 as independent increased by 6. ∙ since there is a constant change in both variables the graph will be a straight line. Slant: ∙ Since the independent is increasing and the dependent is increasing the line should slant up. Graph: These equations were in a different form ax + by = c (ex: 3x – 2y = 6 , x + y = 5), when we looked at the constant change in the variables and graphed the lines, it was still a straight oblique line. The equation still contained two variables.
x y -4 -9
0 -3
4 3
6 6 6
•
•
•
The line shows the
increase in 6 for the
dependent and the
increase in 4 for the
independent.
6
4

y
x
1
1
2
2
3
3
4
4
5
5
6
6
7
7
8
8
– 1
– 1
– 2
– 2
– 3
– 3
– 4
– 4
– 5
– 5
– 6
– 6
– 7
– 7
– 8
– 8
1
1
2
2
3
3
4
4
5
5
6
6
7
7
8
8
– 1
– 1
– 2
– 2
– 3
– 3
– 4
– 4
– 5
– 5
– 6
– 6
– 7
– 7
– 8
– 8
Special Cases for an Equation of a Line 1. Graph each line and describe the line. a). Describe: ∙ This is a straight horizontal line. ∙ The line is parallel to the x-axis and perpendicular to the y-axis. ∙ The y-coordinate of every point is 3. (-2,3) (-1, 3) (0,3) (1, 3) (2,3) b). Can you write an equation for this relation? ● This line is a special case and its equation will contain only ONE variable. ● The line is horizontal and perpendicular to the y-axis. ● The y-coordinate of every point stayed constant at 3. ● Therefore, the equation of this line is y = 3
x y -2 3
-1 3
0 3
1 3
2 3
• • • • •
Perpendicular means meets
at a 900 angle. Parallel means
they will never touch.

y
x
1
1
2
2
3
3
4
4
5
5
6
6
7
7
8
8
– 1
– 1
– 2
– 2
– 3
– 3
– 4
– 4
– 5
– 5
– 6
– 6
– 7
– 7
– 8
– 8
1
1
2
2
3
3
4
4
5
5
6
6
7
7
8
8
– 1
– 1
– 2
– 2
– 3
– 3
– 4
– 4
– 5
– 5
– 6
– 6
– 7
– 7
– 8
– 8
2). Describe: ∙ This is a straight vertical line. ∙ The line is parallel to the y-axis and perpendicular to the x-axis. ∙ The x-coordinate of every point is 4. (4,-2) (4, -1) (4,0) (4, 1) (4,2) b). Can you write an equation for this relation? ● This line is a special case and its equation will contain only ONE variable. ● The line is vertical and perpendicular to the x-axis. ● The x-coordinate of every point stayed constant at 4. ● Therefore, the equation of this line is x = 4
NOTE:
Horizontal Lines ⇒ Perpendicular to y-axis ⇒ Equation: y = # Vertical Lines ⇒ Perpendicular to x-axis ⇒ Equation: x = #
x y 4 -2
4 -1
4 0
4 1
4 2
• •
• • •
The # is whatever the constant
number is in each point.

Section 4.4 Matching Equations and Graphs
Investigation: Bruce, Monica and Sari participate in a 5km walk for charity. Each student
has a different plan to raise money from his/her sponsors. The following graphs show how
the amount of money a sponsor owes is related to the distance walked.
Sari
x1 2 3 4 5
y
5
10
15
20
Distance (km) Monica
x1 2 3 4 5
y
2
4
6
8
10
12
Distance (km)
Describe how Sari is
collecting money
from her sponsors?
d m 0 0 1 4 2 8 3 12 4 16
Sari is collecting $4
for every km she
walks.
M
o
n
e
y
$
M
o
n
e
y
$
Describe how Monica is
collecting money from
her sponsors?
d m 0 3 1 5 2 7 3 9 4 11
Monica was given $3 at
the start of the walk
and an additional $2 for
every km she walked
after that.

Bruce
x1 2 3 4 5
y
2
4
6
8
10
12
Distance (km)
Match each graph with its equation:
M = 2d + 3 Monica
M = 4d Sari
M = d + 5 Bruce
Explain how you know?
● you can refer to the table of values and find the equation
● you can look back at the description in words to find the equation.
M
o
n
e
y
$
Describe how Bruce is
collecting money from
his sponsors?
d m 0 5 1 6 2 7 3 8 4 9
Bruce was given $5 at
the start of the walk
and an additional $1 for
every km he walked
after that.
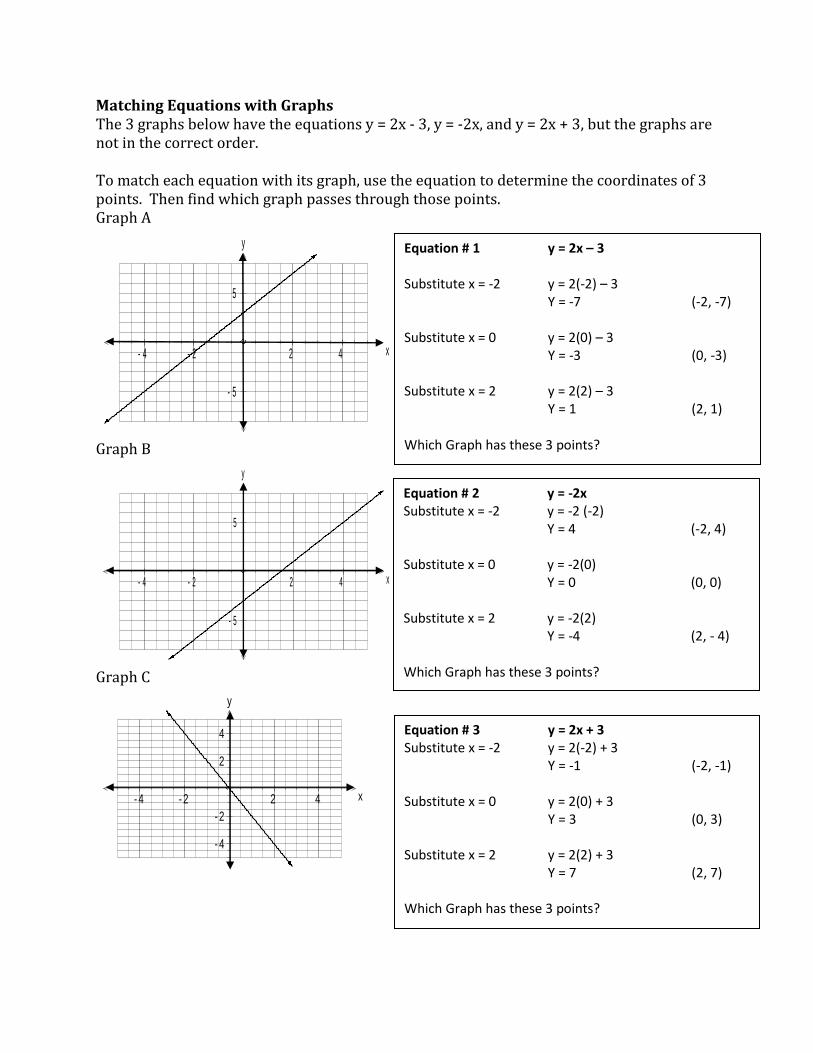
Matching Equations with Graphs The 3 graphs below have the equations y = 2x - 3, y = -2x, and y = 2x + 3, but the graphs are not in the correct order. To match each equation with its graph, use the equation to determine the coordinates of 3 points. Then find which graph passes through those points. Graph A
x- 4 - 2 2 4
y
- 5
5
Graph B
x- 4 - 2 2 4
y
- 5
5
Graph C
x- 4 - 2 2 4
y
- 4
- 2
2
4
Equation # 1 y = 2x – 3 Substitute x = -2 y = 2(-2) – 3 Y = -7 (-2, -7) Substitute x = 0 y = 2(0) – 3 Y = -3 (0, -3) Substitute x = 2 y = 2(2) – 3 Y = 1 (2, 1) Which Graph has these 3 points?
Equation # 2 y = -2x Substitute x = -2 y = -2 (-2) Y = 4 (-2, 4) Substitute x = 0 y = -2(0) Y = 0 (0, 0) Substitute x = 2 y = -2(2) Y = -4 (2, - 4) Which Graph has these 3 points?
Equation # 3 y = 2x + 3 Substitute x = -2 y = 2(-2) + 3 Y = -1 (-2, -1) Substitute x = 0 y = 2(0) + 3 Y = 3 (0, 3) Substitute x = 2 y = 2(2) + 3 Y = 7 (2, 7) Which Graph has these 3 points?
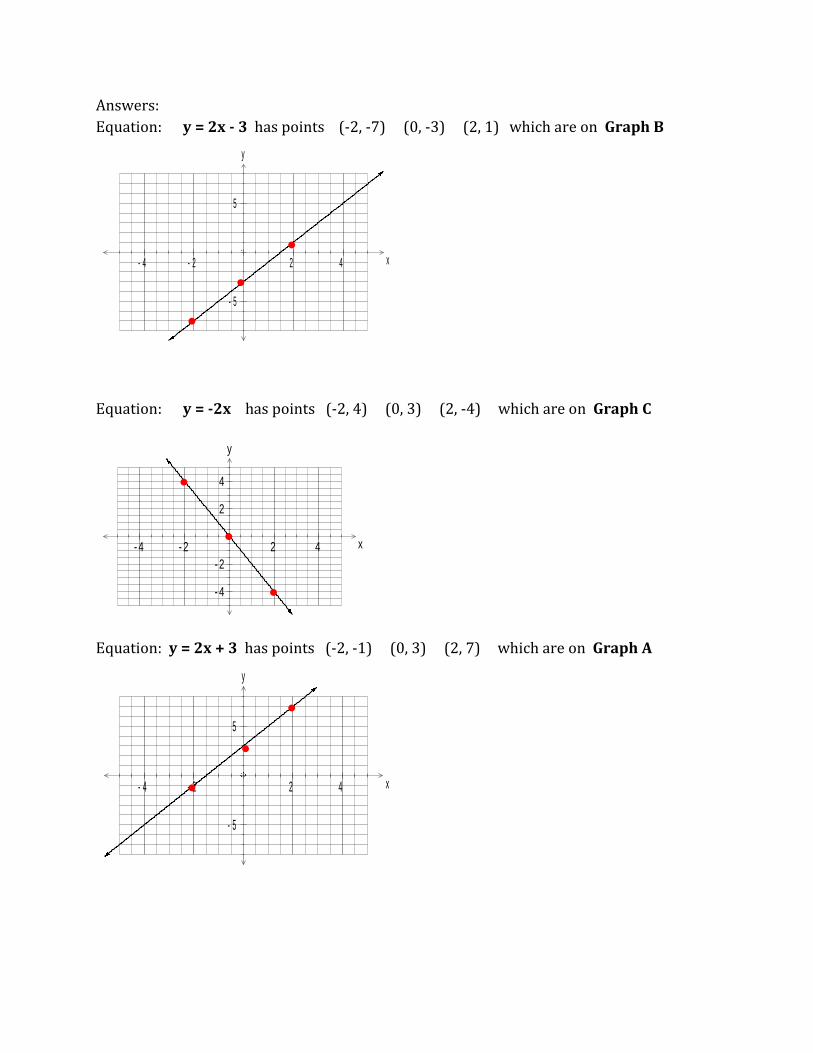
Answers:
Equation: y = 2x - 3 has points (-2, -7) (0, -3) (2, 1) which are on Graph B
x- 4 - 2 2 4
y
- 5
5
Equation: y = -2x has points (-2, 4) (0, 3) (2, -4) which are on Graph C
x- 4 - 2 2 4
y
- 4
- 2
2
4
Equation: y = 2x + 3 has points (-2, -1) (0, 3) (2, 7) which are on Graph A
x- 4 - 2 2 4
y
- 5
5
●
●
●
●
●
●
●
●
●

Section 4.5 Using Graphs to Estimate Values Interpolation: to estimate a value that lies between 2 data points on a graph Bobbie’s Family Trip
x1 2 3 4 5 6
y
100
200
300
400
Time (h)
How long did it take Bobbie’s family to travel 320km
Locate the point on the y axis that represents 320km. (How much is each block worth on this graph? 20 km )
Draw a horizontal line to the graph Then draw a vertical line from the graph to the x-axis Read the value where the vertical line meets the x-axis 4 h It took about 4 h to travel 320km.
Extrapolation: to estimate a value that lies beyond data points on a graph How long will it take Bobbie’s family to travel 640km
Distance
(km)

Since the relation appears to be linear, we can extend the graph
x2 4 6 8
y
100
200
300
400
500
600
Locate the point on the y-axis that represents 640km Draw a horizontal line to the graph Then draw a vertical line from the graph to the x-axis Read the value where the vertical line meets the x-axis.
It will take about 8 h to travel 640km. Determining Values from a Graph
x- 4 - 2 2 4
y
- 4
- 2
2
4
Determine the value of y when x = -2.
Begin at -2 on the x-axis Draw a vertical line up to the graph Then draw a horizontal line across to the y-axis Read the value where the horizontal line meets the y-axis
When x = -2, then y = 2
Distance
(km)
Time (h)
•
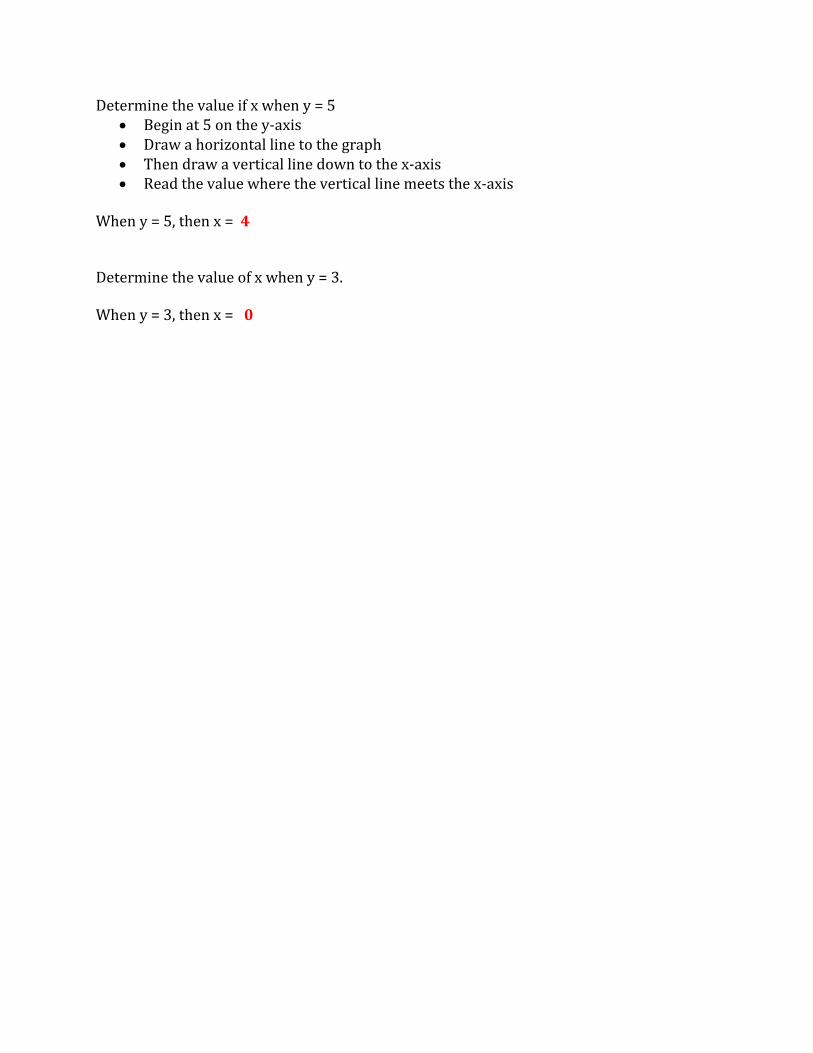
Determine the value if x when y = 5 Begin at 5 on the y-axis Draw a horizontal line to the graph Then draw a vertical line down to the x-axis Read the value where the vertical line meets the x-axis
When y = 5, then x = 4 Determine the value of x when y = 3. When y = 3, then x = 0