grade 9 assessment of mathematics, 2016– 2017 teacher
TRANSCRIPT

Provincial Results
Grade 9 Assessment of Mathematics, 2016– 2017
Teacher Questionnaire: Applied Course Provincial Results
About Your School Province*
Number of Respondents 1 378 # %†
1. How often did you meet with other staff members at your school for the following reasons this past semester or year? Consider both formal and informal meetings. a. To discuss general school issues
Never or hardly ever 25 2% A few times 181 13% Once a month 586 43% Once every 2 weeks 154 11% At least once a week 419 30% No response/ambiguous response 13 1%
b. To reflect on school-level data (e.g., EQAO, diagnostic tests) for planning purposes
Never or hardly ever 129 9% A few times 725 53% Once a month 286 21% Once every 2 weeks 129 9% At least once a week 99 7% No response/ambiguous response 10 1%
c. To participate in school-based professional learning activities (e.g., PLCs, school growth teams)
Never or hardly ever 53 4% A few times 488 35% Once a month 621 45% Once every 2 weeks 138 10% At least once a week 69 5% No response/ambiguous response 9 1%
* Numbers and percentages are based on the total number of teachers who completed the questionnaire. † Percentages may not add up to 100, due to rounding.
Results as of August 14, 2017 1 of 31

Provincial Results
Grade 9 Assessment of Mathematics, 2016– 2017
Teacher Questionnaire: Applied Course
About Your School Province*
Number of Respondents 1 378 # %†
d. To reflect on the delivery of the mathematics curriculum (e.g., to plan lessons, discuss instructional strategies and materials)
Never or hardly ever 85 6% A few times 399 29% Once a month 274 20% Once every 2 weeks 179 13% At least once a week 434 31% No response/ambiguous response 7 1%
e. To coordinate mathematics instruction among teachers Never or hardly ever 144 10% A few times 367 27% Once a month 185 13% Once every 2 weeks 187 14% At least once a week 481 35% No response/ambiguous response 14 1%
* Numbers and percentages are based on the total number of teachers who completed the questionnaire. † Percentages may not add up to 100, due to rounding.
Results as of August 14, 2017 2 of 31

Provincial Results
Grade 9 Assessment of Mathematics, 2016– 2017
Teacher Questionnaire: Applied Course
About Your School Province*
Number of Respondents 1 378 # %†
2. To what extent do you agree or disagree with the following statements about your school’s improvement goals in mathematics this year? a. The school’s improvement goals have been communicated to me.
Strongly disagree or disagree 67 5% Neither agree nor disagree 133 10% Agree or strongly agree 1 167 85% No response/ambiguous response 11 1%
b. The school’s improvement goals were clear to me. Strongly disagree or disagree 81 6% Neither agree nor disagree 187 14% Agree or strongly agree 1 098 80% No response/ambiguous response 12 1%
c. I had the support of other staff members at the school to help me work toward the improvement goals.
Strongly disagree or disagree 76 6% Neither agree nor disagree 221 16% Agree or strongly agree 1 069 78% No response/ambiguous response 12 1%
d. The school provided me with materials to help me work toward the improvement goals.
Strongly disagree or disagree 102 7% Neither agree nor disagree 267 19% Agree or strongly agree 996 72% No response/ambiguous response 13 1%
* Numbers and percentages are based on the total number of teachers who completed the questionnaire. † Percentages may not add up to 100, due to rounding.
Results as of August 14, 2017 3 of 31

Provincial Results
Grade 9 Assessment of Mathematics, 2016– 2017
Teacher Questionnaire: Applied Course
About Your School Province*
Number of Respondents 1 378 # %†
e. The school has taken steps to meet its improvement goals. Strongly disagree or disagree 65 5%
Neither agree nor disagree 237 17% Agree or strongly agree 1 060 77%
No response/ambiguous response 16 1% f. I had the opportunity to participate in decisions about the
school’s improvement goals. Strongly disagree or disagree 213 15%
Neither agree nor disagree 303 22% Agree or strongly agree 846 61%
No response/ambiguous response 16 1%
* Numbers and percentages are based on the total number of teachers who completed the questionnaire. † Percentages may not add up to 100, due to rounding.
Results as of August 14, 2017 4 of 31

Provincial Results
Grade 9 Assessment of Mathematics, 2016– 2017
Teacher Questionnaire: Applied Course
About Your School Province*
Number of Respondents 1 378 # %†
3. To what extent do you agree or disagree with the following statements about your school? a. Students take pride in this school.
Strongly disagree or disagree 91 7% Neither agree nor disagree 258 19% Agree or strongly agree 1 022 74% No response/ambiguous response 7 1%
b. Teachers take pride in this school. Strongly disagree or disagree 37 3% Neither agree nor disagree 156 11% Agree or strongly agree 1 177 85% No response/ambiguous response 8 1%
c. There is strong school spirit in this school. Strongly disagree or disagree 151 11% Neither agree nor disagree 347 25% Agree or strongly agree 867 63% No response/ambiguous response 13 1%
d. Students at this school respect one another. Strongly disagree or disagree 70 5% Neither agree nor disagree 265 19% Agree or strongly agree 1 032 75% No response/ambiguous response 11 1%
e. There is co-operation at this school among students. Strongly disagree or disagree 40 3% Neither agree nor disagree 208 15% Agree or strongly agree 1 119 81% No response/ambiguous response 11 1%
* Numbers and percentages are based on the total number of teachers who completed the questionnaire. † Percentages may not add up to 100, due to rounding.
Results as of August 14, 2017 5 of 31

Provincial Results
Grade 9 Assessment of Mathematics, 2016– 2017
Teacher Questionnaire: Applied Course
About Your School Province*
Number of Respondents 1 378 # %†
f. There is co-operation at this school among teachers. Strongly disagree or disagree 38 3% Neither agree nor disagree 137 10% Agree or strongly agree 1 193 87% No response/ambiguous response 10 1%
g. There is co-operation at this school among all staff members. Strongly disagree or disagree 114 8% Neither agree nor disagree 224 16% Agree or strongly agree 1 027 75% No response/ambiguous response 13 1%
h. There is co-operation at this school between students and teachers.
Strongly disagree or disagree 26 2% Neither agree nor disagree 160 12% Agree or strongly agree 1 174 85% No response/ambiguous response 18 1%
i. There is co-operation at this school between teachers and parents or guardians.
Strongly disagree or disagree 71 5% Neither agree nor disagree 302 22% Agree or strongly agree 992 72% No response/ambiguous response 13 1%
j. There is respect for diversity (e.g., cultural, ethnic, special needs) at this school.
Strongly disagree or disagree 35 3% Neither agree nor disagree 111 8% Agree or strongly agree 1 223 89% No response/ambiguous response 9 1%
* Numbers and percentages are based on the total number of teachers who completed the questionnaire. † Percentages may not add up to 100, due to rounding.
Results as of August 14, 2017 6 of 31

Provincial Results
Grade 9 Assessment of Mathematics, 2016– 2017
Teacher Questionnaire: Applied Course
About Your School Province*
Number of Respondents
%† # 4. This question is not reported. Currently under field-testing.
* Numbers and percentages are based on the total number of teachers who completed the questionnaire. † Percentages may not add up to 100, due to rounding.
Results as of August 14, 2017 7 of 31

Provincial Results
Grade 9 Assessment of Mathematics, 2016– 2017
Teacher Questionnaire: Applied Course
About Your School Province*
Number of Respondents 1 378 # %†
5a. For which mathematics course are you answering questions 5 to 12? Fill in only one circle.
Grade 9 applied 1 378 100% Grade 9 academic 0 0%
No response/ambiguous response 0 0% 5b. This course is offered over
a semester. 1 274 92% a year. 84 6%
No response/ambiguous response 20 1%
* Numbers and percentages are based on the total number of teachers who completed the questionnaire. † Percentages may not add up to 100, due to rounding.
Results as of August 14, 2017 8 of 31

Provincial Results
Grade 9 Assessment of Mathematics, 2016– 2017
Teacher Questionnaire: Applied Course
Use of EQAO Resources Province*
Number of Respondents 1 378 # %
6. How have you used the EQAO sample student assessments and scoring guides this year? Fill in all that apply. Independently
a. To show samples of student responses to students 1 032 75% b. To help students understand how questions and tasks relate to curriculum expectations 989 72%
c. To communicate with parents and guardians about curriculum expectations 424 31%
d. As a model for designing assessments 981 71% e. To inform classroom instruction 1 058 77% f. In ways other than those listed above 433 31% g. Did not use 70 5%
With a school team h. As a model for designing assessments 518 38% i. To inform classroom instruction 503 37% j. In ways other than those listed above 193 14% k. Did not use 35 3%
* Numbers and percentages are based on the total number of teachers who completed the questionnaire.
Results as of August 14, 2017 9 of 31

Provincial Results
Grade 9 Assessment of Mathematics, 2016– 2017
Teacher Questionnaire: Applied Course
Use of EQAO Resources Province*
Number of Respondents 1 378 # %
7. How have you used EQAO data (demographic data, assessment and questionnaire results) this year? Fill in all that apply. Independently
a. To identify how well students are meeting curriculum expectations 521 38%
b. To communicate with parents and guardians about student achievement 270 20%
c. To learn more about students at the school (e.g., attitudes, activities outside school) 378 27%
d. To identify areas of strength and areas for improvement in Grade 9 mathematics instructional programs 592 43%
e. To inform planning of your Grade 9 mathematics instructional programs 650 47%
f. To guide school improvement initiatives for mathematics 394 29% g. In ways other than those listed above 153 11% h. Did not use 192 14%
With a school team i. To identify how well students are meeting curriculum expectations 781 57%
j. To communicate with parents and guardians about student achievement 245 18%
k. To learn more about students at the school (e.g., attitudes, activities outside school) 483 35%
l. To identify areas of strength and areas for improvement in Grade 9 mathematics instructional programs 815 59%
m. To inform planning of your Grade 9 mathematics instructional programs 700 51%
n. To guide school improvement initiatives for mathematics 757 55% o. In ways other than those listed above 132 10% p. Did not use 59 4%
* Numbers and percentages are based on the total number of teachers who completed the questionnaire.
Results as of August 14, 2017 10 of 31

Provincial Results
Grade 9 Assessment of Mathematics, 2016– 2017
Teacher Questionnaire: Applied Course
Use of Instructional Resources in Your Classroom Province*
Number of Respondents 1 378 # %†
8. I. How often did you have the majority of your students use each of the following in class this past semester or year? a. Calculator
Never 3 <1% Seldom 11 1% Sometimes 84 6% Frequently 1 264 92% No response/ambiguous response 16 1%
b. Graphing calculator Never 605 44% Seldom 399 29% Sometimes 230 17% Frequently 112 8% No response/ambiguous response 32 2%
c. Computer software (e.g., spreadsheet, statistical, dynamic geometry or graphing software)
Never 287 21% Seldom 479 35% Sometimes 454 33% Frequently 139 10% No response/ambiguous response 19 1%
d. The Internet (e.g., to access statistics or other sources of mathematical information)
Never 205 15% Seldom 414 30% Sometimes 517 38% Frequently 227 16% No response/ambiguous response 15 1%
* Numbers and percentages are based on the total number of teachers who completed the questionnaire. † Percentages may not add up to 100, due to rounding.
Results as of August 14, 2017 11 of 31

Provincial Results
Grade 9 Assessment of Mathematics, 2016– 2017
Teacher Questionnaire: Applied Course
Use of Instructional Resources in Your Classroom Province*
Number of Respondents 1 378 # %†
e. Concrete manipulative (e.g., geoboard, algebra tiles, connecting cubes)
Never 128 9% Seldom 381 28% Sometimes 603 44% Frequently 250 18% No response/ambiguous response 16 1%
f. Measuring device (e.g., ruler, metre stick, protractor) Never 17 1% Seldom 182 13% Sometimes 652 47% Frequently 513 37% No response/ambiguous response 14 1%
g. Presentation technology (e.g., interactive white board, LCD projector)
Never 82 6% Seldom 82 6% Sometimes 189 14% Frequently 1 011 73% No response/ambiguous response 14 1%
* Numbers and percentages are based on the total number of teachers who completed the questionnaire. † Percentages may not add up to 100, due to rounding.
Results as of August 14, 2017 12 of 31

Provincial Results
Grade 9 Assessment of Mathematics, 2016– 2017
Teacher Questionnaire: Applied Course
Use of Instructional Resources in Your Classroom Province*
Number of Respondents 1 378 # %†
8. II. How accessible were each of the following for use in class this past semester or year? a. Calculator
Not accessible 6 <1% Difficult to access 60 4% Easy to access 1 234 90% No response/ambiguous response 78 6%
b. Graphing calculator Not accessible 97 7% Difficult to access 237 17% Easy to access 924 67% No response/ambiguous response 120 9%
c. Computer software (e.g., spreadsheet, statistical, dynamic geometry or graphing software)
Not accessible 43 3% Difficult to access 335 24% Easy to access 902 65% No response/ambiguous response 98 7%
d. The Internet (e.g., to access statistics or other sources of mathematical information)
Not accessible 17 1% Difficult to access 176 13% Easy to access 1 091 79% No response/ambiguous response 94 7%
e. Concrete manipulative (e.g., geoboard, algebra tiles, connecting cubes)
Not accessible 27 2% Difficult to access 132 10% Easy to access 1 127 82% No response/ambiguous response 92 7%
* Numbers and percentages are based on the total number of teachers who completed the questionnaire. † Percentages may not add up to 100, due to rounding.
Results as of August 14, 2017 13 of 31
Provincial Results
Grade 9 Assessment of Mathematics, 2016– 2017
Teacher Questionnaire: Applied Course
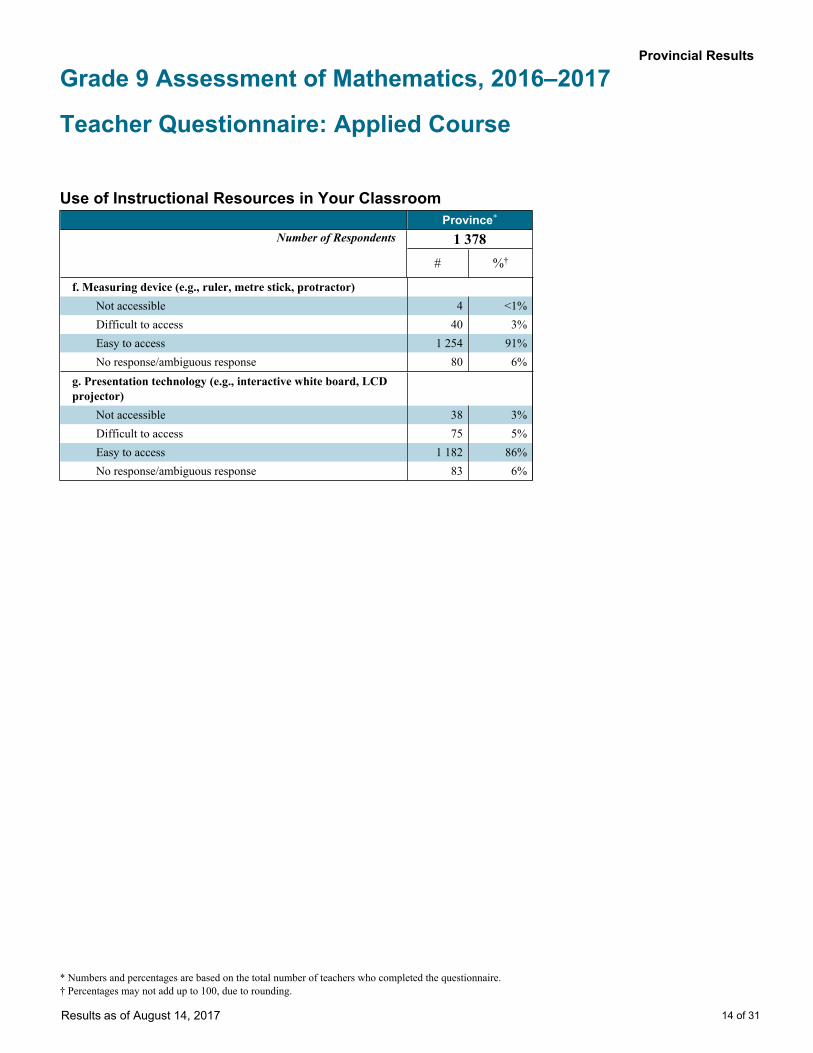
Use of Instructional Resources in Your Classroom Province*
Number of Respondents 1 378 # %†
f. Measuring device (e.g., ruler, metre stick, protractor) Not accessible 4 <1%
Difficult to access 40 3% Easy to access 1 254 91%
No response/ambiguous response 80 6% g. Presentation technology (e.g., interactive white board, LCD
projector) Not accessible 38 3%
Difficult to access 75 5% Easy to access 1 182 86%
No response/ambiguous response 83 6%
* Numbers and percentages are based on the total number of teachers who completed the questionnaire. † Percentages may not add up to 100, due to rounding.
Results as of August 14, 2017 14 of 31

Provincial Results
Grade 9 Assessment of Mathematics, 2016– 2017
Teacher Questionnaire: Applied Course
Some Teaching Practices Province*
Number of Respondents 1 378 # %†
9. How often did you ask your students to do each of the following during mathematics class this past semester or year? a. Discuss and use problem-solving strategies for finding answers (e.g., work backward, use a chart, make a model)
Never 9 1% Seldom 62 4% Sometimes 482 35% Frequently 804 58% No response/ambiguous response 21 2%
b. Solve open-ended problems Never 19 1% Seldom 136 10% Sometimes 634 46% Frequently 567 41% No response/ambiguous response 22 2%
c. Work collaboratively to solve problems Never 12 1% Seldom 68 5% Sometimes 471 34% Frequently 804 58% No response/ambiguous response 23 2%
* Numbers and percentages are based on the total number of teachers who completed the questionnaire. † Percentages may not add up to 100, due to rounding.
Results as of August 14, 2017 15 of 31

Provincial Results
Grade 9 Assessment of Mathematics, 2016– 2017
Teacher Questionnaire: Applied Course
Some Teaching Practices Province*
Number of Respondents 1 378 # %†
d. Discuss mathematical ideas and relationships Never 9 1% Seldom 61 4% Sometimes 451 33% Frequently 833 60% No response/ambiguous response 24 2%
e. Conduct mathematical investigations (e.g., to demonstrate the inquiry process)
Never 27 2% Seldom 232 17% Sometimes 690 50% Frequently 408 30% No response/ambiguous response 21 2%
f. Explain the reasoning behind their answers Never 3 <1% Seldom 20 1% Sometimes 298 22% Frequently 1 032 75% No response/ambiguous response 25 2%
g. Write solutions using mathematical language and symbols Never 4 <1% Seldom 11 1% Sometimes 185 13% Frequently 1 154 84% No response/ambiguous response 24 2%
* Numbers and percentages are based on the total number of teachers who completed the questionnaire. † Percentages may not add up to 100, due to rounding.
Results as of August 14, 2017 16 of 31

Provincial Results
Grade 9 Assessment of Mathematics, 2016– 2017
Teacher Questionnaire: Applied Course
Some Teaching Practices Province*
Number of Respondents 1 378 # %†
10a. How often did you assign homework in your mathematics course this past semester or year?
Never 123 9% Occasionally 489 35%
Most classes 449 33% Every class 292 21%
No response/ambiguous response 25 2% 10b. If you assign homework, how much time would you expect
an average student to spend on a typical homework assignment?‡
30 minutes or less 975 79% Between 31 and 45 minutes 221 18%
More than 45 minutes 17 1% No response/ambiguous response 17 1%
* Numbers and percentages are based on the total number of teachers who completed the questionnaire. † Percentages may not add up to 100, due to rounding. ‡ Numbers and percentages are based on the number of teachers who answered “Occasionally,” “Most classes” or “Every class” to Question 10a.
Results as of August 14, 2017 17 of 31
Grade 9 Assessment of Mathematics, 2016– 2017
Provincial Results
Teacher Questionnaire: Applied Course
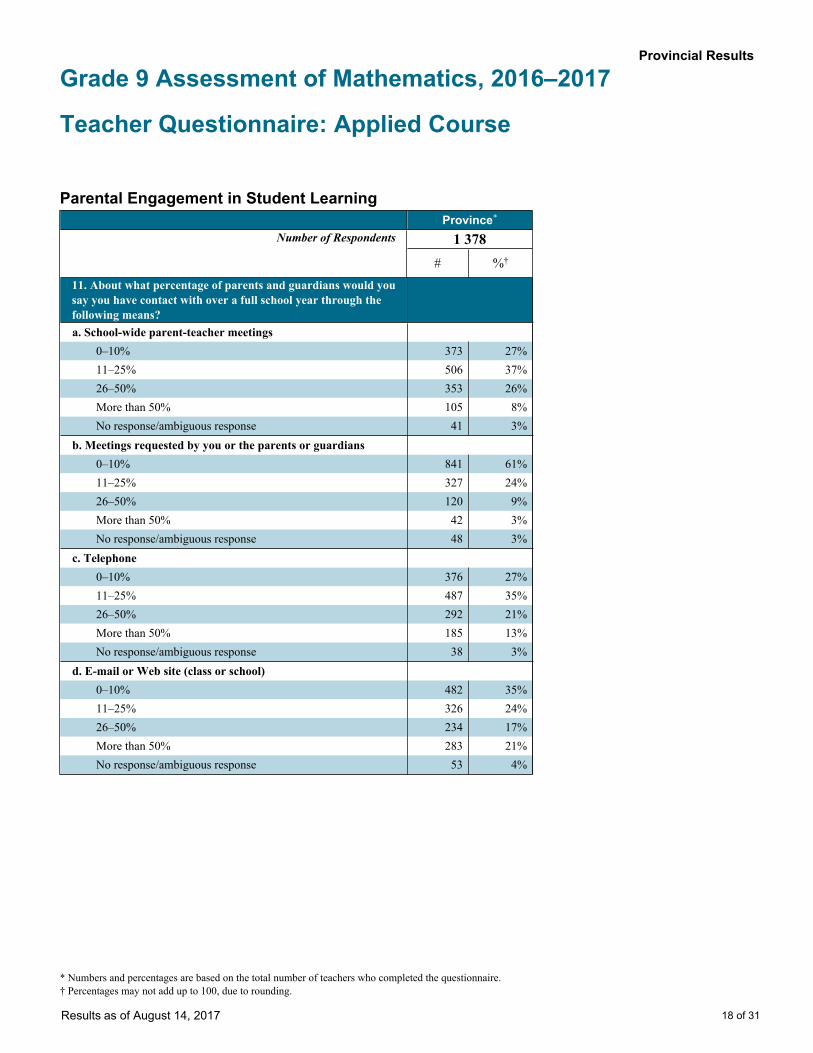
Parental Engagement in Student Learning Province*
Number of Respondents 1 378 # %†
11. About what percentage of parents and guardians would you say you have contact with over a full school year through the following means? a. School-wide parent-teacher meetings
0–10% 373 27% 11–25% 506 37% 26–50% 353 26% More than 50% 105 8% No response/ambiguous response 41 3%
b. Meetings requested by you or the parents or guardians 0–10% 841 61% 11–25% 327 24% 26–50% 120 9% More than 50% 42 3% No response/ambiguous response 48 3%
c. Telephone 0–10% 376 27% 11–25% 487 35% 26–50% 292 21% More than 50% 185 13% No response/ambiguous response 38 3%
d. E-mail or Web site (class or school) 0–10% 482 35% 11–25% 326 24% 26–50% 234 17% More than 50% 283 21% No response/ambiguous response 53 4%
* Numbers and percentages are based on the total number of teachers who completed the questionnaire. † Percentages may not add up to 100, due to rounding.
Results as of August 14, 2017 18 of 31

Provincial Results
Grade 9 Assessment of Mathematics, 2016– 2017
Teacher Questionnaire: Applied Course
Parental Engagement in Student Learning Province*
Number of Respondents 1 378 # %†
e. Other means 0–10% 547 40% 11–25% 57 4% 26–50% 36 3% More than 50% 62 4% No response/ambiguous response 676 49%
* Numbers and percentages are based on the total number of teachers who completed the questionnaire. † Percentages may not add up to 100, due to rounding.
Results as of August 14, 2017 19 of 31

Provincial Results
Grade 9 Assessment of Mathematics, 2016– 2017
Teacher Questionnaire: Applied Course
Parental Engagement in Student Learning Province*
Number of Respondents 1 378 # %†
12. About what percentage of parents and guardians would you say you have contact with over a full school year for the following reasons? a. To discuss the link between EQAO assessments and The Ontario Curriculum
0% 796 58% 1–10% 353 26% 11–25% 79 6% 26–50% 57 4% More than 50% 51 4% No response/ambiguous response 42 3%
b. To discuss the link between EQAO assessments and instructional or assessment strategies
0% 730 53% 1–10% 370 27% 11–25% 97 7% 26–50% 72 5% More than 50% 61 4% No response/ambiguous response 48 3%
c. To discuss their child’s learning progress 0% 13 1% 1–10% 200 15% 11–25% 370 27% 26–50% 362 26% More than 50% 391 28% No response/ambiguous response 42 3%
* Numbers and percentages are based on the total number of teachers who completed the questionnaire. † Percentages may not add up to 100, due to rounding.
Results as of August 14, 2017 20 of 31

Provincial Results
Grade 9 Assessment of Mathematics, 2016– 2017
Teacher Questionnaire: Applied Course
Parental Engagement in Student Learning Province*
Number of Respondents 1 378 # %†
d. To discuss their child’s behaviour 0% 99 7% 1–10% 503 37% 11–25% 341 25% 26–50% 257 19% More than 50% 138 10% No response/ambiguous response 40 3%
e. To provide suggestions about how to support learning at home 0% 81 6% 1–10% 388 28% 11–25% 376 27% 26–50% 280 20% More than 50% 211 15% No response/ambiguous response 42 3%
f. For other reasons 0% 246 18% 1–10% 298 22% 11–25% 101 7% 26–50% 76 6% More than 50% 91 7% No response/ambiguous response 566 41%
* Numbers and percentages are based on the total number of teachers who completed the questionnaire. † Percentages may not add up to 100, due to rounding.
Results as of August 14, 2017 21 of 31

Provincial Results
Grade 9 Assessment of Mathematics, 2016– 2017
Teacher Questionnaire: Applied Course
Background and Professional Development Province*
Number of Respondents 1 378 # %†
13. What is your gender? Female 766 56% Male 543 39% No response/ambiguous response 69 5%
14. Including this year, for how many years have you been teaching? a. In total
2 years or less 35 3% 3–5 years 106 8% 6–10 years 323 23% 11 years or more 880 64% No response/ambiguous response 34 2%
b. Mathematics at the secondary level 2 years or less 127 9% 3–5 years 185 13% 6–10 years 328 24% 11 years or more 698 51% No response/ambiguous response 40 3%
c. Grade 9 mathematics 2 years or less 246 18% 3–5 years 224 16% 6–10 years 347 25% 11 years or more 524 38% No response/ambiguous response 37 3%
* Numbers and percentages are based on the total number of teachers who completed the questionnaire. † Percentages may not add up to 100, due to rounding.
Results as of August 14, 2017 22 of 31

Provincial Results
Grade 9 Assessment of Mathematics, 2016– 2017
Teacher Questionnaire: Applied Course
Background and Professional Development Province*
Number of Respondents 1 378 # %†
15. What best describes your area of study during your post- secondary education? Fill in only one circle.
Mathematics major or specialist 508 37% Mathematics-related major or specialist (e.g., business, science,
engineering, computer science) 453 33%
Other major with a mathematics minor 148 11% Other major with a mathematics-related minor 71 5%
Area of study unrelated to mathematics 160 12% No response/ambiguous response 38 3%
* Numbers and percentages are based on the total number of teachers who completed the questionnaire. † Percentages may not add up to 100, due to rounding.
Results as of August 14, 2017 23 of 31
Provincial Results
Grade 9 Assessment of Mathematics, 2016– 2017
Teacher Questionnaire: Applied Course
Background and Professional Development Province*
Number of Respondents 1 378 #
%
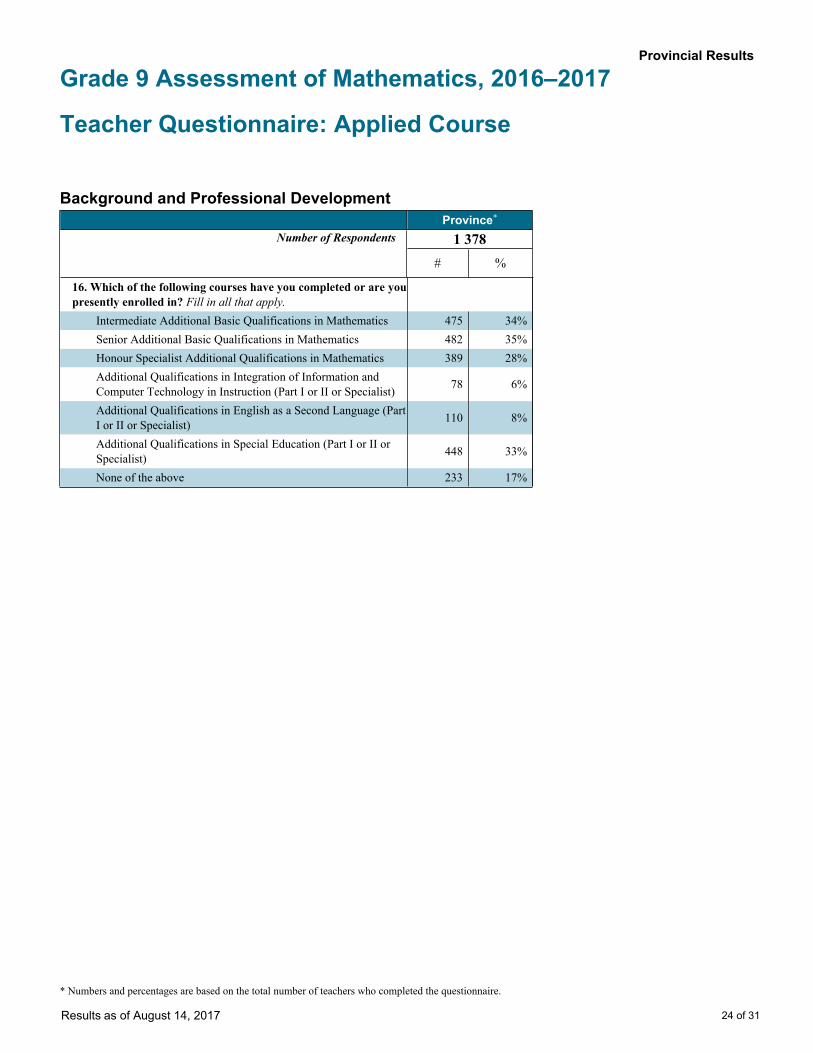
16. Which of the following courses have you completed or are you presently enrolled in? Fill in all that apply.
Intermediate Additional Basic Qualifications in Mathematics 475 34% Senior Additional Basic Qualifications in Mathematics 482 35% Honour Specialist Additional Qualifications in Mathematics 389 28%
Additional Qualifications in Integration of Information and Computer Technology in Instruction (Part I or II or Specialist) 78 6%
Additional Qualifications in English as a Second Language (Part I or II or Specialist) 110 8%
Additional Qualifications in Special Education (Part I or II or Specialist) 448 33%
None of the above 233 17%
* Numbers and percentages are based on the total number of teachers who completed the questionnaire.
Results as of August 14, 2017 24 of 31

Provincial Results
Grade 9 Assessment of Mathematics, 2016– 2017
Teacher Questionnaire: Applied Course
Background and Professional Development Province*
Number of Respondents 1 378 # %†
17. In the past two years, have you participated in professional development activities (e.g., courses, workshops, conferences, PLCs) related to any of the following topics? a. Mathematics pedagogy or instruction
Yes 1 210 88% No 137 10% No response/ambiguous response 31 2%
b. Integration of information and computer technology into mathematics instruction
Yes 973 71% No 359 26% No response/ambiguous response 46 3%
c. Developing students’ critical thinking or problem-solving skills in mathematics
Yes 1 102 80% No 234 17% No response/ambiguous response 42 3%
d. Instructional strategies for differentiated instruction (in any subject)
Yes 1 106 80% No 228 17% No response/ambiguous response 44 3%
e. Teaching students with special needs Yes 688 50% No 612 44% No response/ambiguous response 78 6%
* Numbers and percentages are based on the total number of teachers who completed the questionnaire. † Percentages may not add up to 100, due to rounding.
Results as of August 14, 2017 25 of 31
Provincial Results
Grade 9 Assessment of Mathematics, 2016– 2017
Teacher Questionnaire: Applied Course
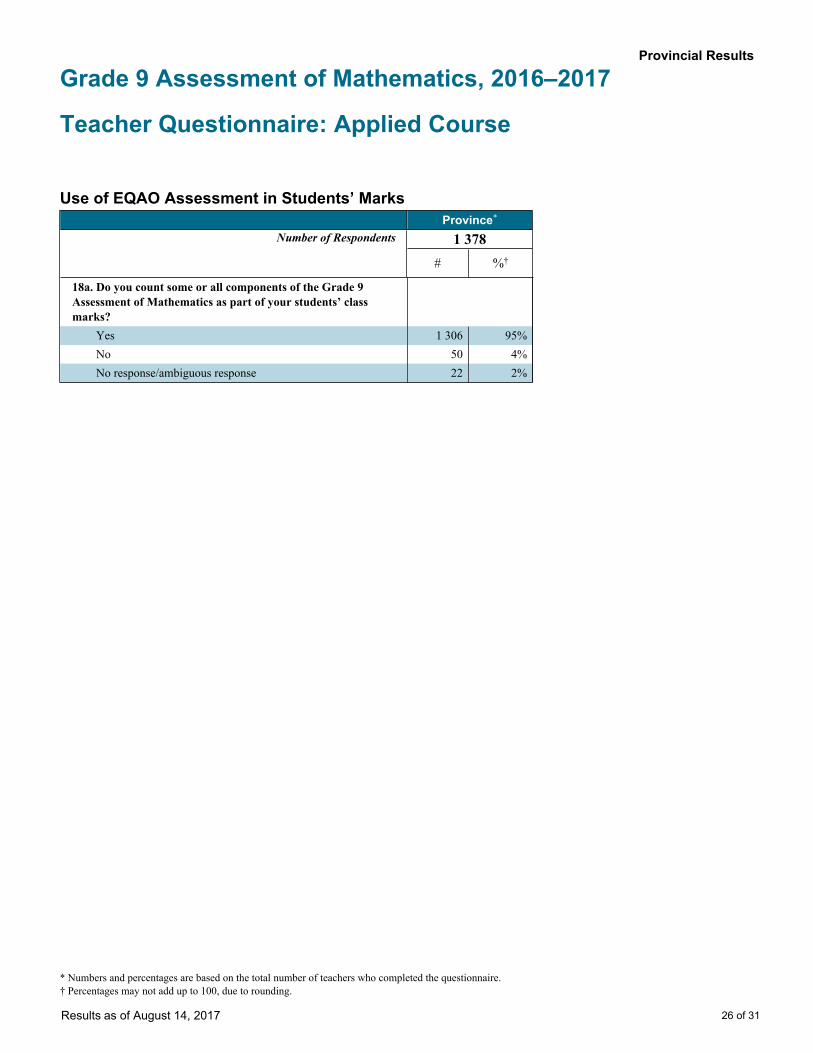
Use of EQAO Assessment in Students’ Marks Province*
Number of Respondents 1 378 # %†
18a. Do you count some or all components of the Grade 9 Assessment of Mathematics as part of your students’ class
marks? Yes 1 306 95% No 50 4%
No response/ambiguous response 22 2%
* Numbers and percentages are based on the total number of teachers who completed the questionnaire. † Percentages may not add up to 100, due to rounding.
Results as of August 14, 2017 26 of 31

Provincial Results
Grade 9 Assessment of Mathematics, 2016– 2017
Teacher Questionnaire: Applied Course
Use of EQAO Assessment in Students’ Marks Province*
Number of Respondents 1 306 # %†
18b. If yes, for how much do they count?‡
1–5% 325 25% 6–10% 609 47% 11–15% 243 19% 16–20% 41 3% 21–25% 10 1% 26–30% 31 2% Other 25 2% No response/ambiguous response 22 2%
19. Before writing the Grade 9 Assessment of Mathematics, were students informed about the weight it would be given in the calculation of their class mark (e.g., 5%, 10%)?‡
Yes 1 282 98% No 19 1% No response/ambiguous response 5 <1%
20. In your opinion, does counting some or all components of the Grade 9 Assessment of Mathematics as part of class marks motivate students to take the assessment more seriously?‡
Yes 1 141 87% No 61 5% Undecided 99 8% No response/ambiguous response 5 <1%
* Numbers and percentages for this section apply to Questions 18b-23. † Percentages may not add up to 100, due to rounding. ‡ Numbers and percentages are based on the number of teachers who answered "yes" to Question 18a.
Results as of August 14, 2017 27 of 31

Provincial Results
Grade 9 Assessment of Mathematics, 2016– 2017
Teacher Questionnaire: Applied Course
Use of EQAO Assessment in Students’ Marks Province*
Number of Respondents 1 306 # %
21. Who decides if some or all components of the Grade 9 Assessment of Mathematics count as part of your students’ class marks? Fill in all circles that apply.‡
School-board staff 344 26% Mathematics department 892 68% School principal or vice-principal 250 19% Individual Grade 9 mathematics teachers 215 16% Grade 9 mathematics teachers as a group 433 33% Don’t know 53 4% Other 8 1%
22. Who decides which questions count as part of your students’ class marks? Fill in all circles that apply.‡
School-board staff 91 7% Mathematics department 636 49% School principal or vice-principal 87 7% Individual Grade 9 mathematics teachers 399 31% Grade 9 mathematics teachers as a group 521 40% Don’t know 31 2% Other 3 <1%
* Numbers and percentages for this section apply to Questions 18b-23. ‡ Numbers and percentages are based on the number of teachers who answered "yes" to Question 18a.
Results as of August 14, 2017 28 of 31

Provincial Results
Grade 9 Assessment of Mathematics, 2016– 2017
Teacher Questionnaire: Applied Course
Use of EQAO Assessment in Students’ Marks Province*
Number of Respondents 1 306 # %†
23. Which types of questions count as part of your students’ class marks?‡
a. Open-response questions All questions 524 40%
Some questions 487 37% No questions 232 18% No response/ambiguous response 63 5%
b. Multiple-choice questions All questions 1 045 80%
Some questions 221 17% No questions 18 1% No response/ambiguous response 22 2%
* Numbers and percentages for this section apply to Questions 18b-23. † Percentages may not add up to 100, due to rounding. ‡ Numbers and percentages are based on the number of teachers who answered "yes" to Question 18a.
Results as of August 14, 2017 29 of 31

Provincial Results
Grade 9 Assessment of Mathematics, 2016– 2017
Teacher Questionnaire: Applied Course
Use of EQAO Assessment in Students’ Marks Province*
Number of Respondents 808 # %†
24. Which strands count as part of your students’ class marks?‡
a. Number Sense and Algebra All questions 246 30%
Some questions 471 58% No questions 3 <1% No response/ambiguous response 88 11%
b. Linear Relations All questions 249 31%
Some questions 475 59% No questions 2 <1% No response/ambiguous response 82 10%
c. Measurement and Geometry All questions 243 30%
Some questions 479 59% No questions 3 <1% No response/ambiguous response 83 10%
d. Analytic Geometry (academic only) This question is not applicable to the applied course.
* Numbers and percentages for this section apply to Question 24. † Percentages may not add up to 100, due to rounding. ‡ Numbers and percentages are based on the number of teachers who answered "yes" to Question 18a, less those who answered "all questions" for 23a and 23b.
Results as of August 14, 2017 30 of 31

Provincial Results
Grade 9 Assessment of Mathematics, 2016– 2017
Teacher Questionnaire: Applied Course
Other Province*
Number of Respondents 1 378 # %†
25. Do you believe that the time allotted this year to complete the Grade 9 Assessment of Mathematics was sufficient?
Yes 1 164 84% No 122 9%
No response/ambiguous response 92 7% 26. I would prefer to answer this questionnaire online (through the Internet).
Strongly disagree or disagree 346 25% Neither agree nor disagree 414 30%
Agree or strongly agree 565 41% No response/ambiguous response 53 4%
* Numbers and percentages are based on the total number of teachers who completed the questionnaire. † Percentages may not add up to 100, due to rounding.
Results as of August 14, 2017 31 of 31