gps sounding of the ionosphere onboard champ gps sounding of the ionosphere onboard champ ......
TRANSCRIPT

RTO-MP-IST-056 26 - 1
UNCLASSIFIED/UNLIMITED
UNCLASSIFIED/UNLIMITED
GPS Sounding of the Ionosphere Onboard CHAMP
N. Jakowski, C. Mayer, V. Wilken Deutsches Zentrum für Luft- und Raumfahrt (DLR) / Institut für Kommunikation und Navigation
Kalkhorstweg 53 Neustrelitz
GERMANY
[email protected] / [email protected] / [email protected]
ABSTRACT Space based GPS measurements onboard Low Earth Orbiting (LEO) satellites provide a unique possibility for exploring the ionosphere on a global scale. Both the radio occultation measurements in the limb sounding mode and the navigation measurements using a zenith viewing GPS antenna provide the Total Electron Content (TEC) along numerous ray paths. TEC may effectively be used for reconstructing the spatial and temporal distribution of the electron density in the ionosphere and plasmasphere.
Reported are results obtained from radio occultation measurements on CHAMP which have provided more than 200,000 vertical electron density profiles so far. These observations contribute to a better understanding of the regular behaviour of the global ionosphere. Furthermore, the radio occultation measurements indicate irregular and/or wavelike structures in the ionosphere which may have severe impact on the functionality of radio systems.
A three-dimensional imaging of the electron density distribution near the CHAMP orbit plane between CHAMP and GPS orbit height is performed by using link related TEC data derived from dual frequency navigation measurements (zenith antenna) onboard CHAMP. This type of measurements provides a good measure of the interaction of the solar wind with the global Earth’s atmosphere, thus providing a good opportunity for studying this interaction via the magnetosphere.
Key words: GPS, Ionosphere, Plasmasphere, Radio Occultation, CHAMP
1. INTRODUCTION The capability of sounding the ionosphere by GPS measurements onboard Low Earth Orbiting (LEO) satellites has been demonstrated by several LEO satellite missions such as Microlab-1 with the GPS/MET experiment (e.g. Hajj and Romans, 1998, Schreiner et al., 1999), Ørstedt, and CHAMP (Jakowski et al., 2002, Garcia-Fernandez et al., 2003).
This paper deals with results of the ionosphere monitoring obtained by means of GPS measurements onboard the current geo-research satellite mission CHAMP (Reigber et al., 2000). The German CHAMP (CHAllenging Minisatellite Payload) satellite was successfully launched on 15 July 2000 into a near polar orbit (inclination 87°, altitude 450 km).The satellite is equipped with a dual frequency «Black Jack» GPS receiver which enables not only the use of GPS radio occultation measurements in the limb sounding mode, but also the analysis of the 0.1 Hz sampled navigation data.
The GPS data measured onboard CHAMP are received at the DLR Remote Sensing Data Center in Neustrelitz and subsequently processed at DLR by an operational data processing system (Wehrenpfennig et al., 2001).
Jakowski, N.; Mayer, C.; Wilken, V. (2006) GPS Sounding of the Ionosphere Onboard CHAMP. In Characterising the Ionosphere (pp. 26-1 – 26-16). Meeting Proceedings RTO-MP-IST-056, Paper 26. Neuilly-sur-Seine, France: RTO. Available from: http://www.rto.nato.int/abstracts.asp.

Report Documentation Page Form ApprovedOMB No. 0704-0188
Public reporting burden for the collection of information is estimated to average 1 hour per response, including the time for reviewing instructions, searching existing data sources, gathering andmaintaining the data needed, and completing and reviewing the collection of information. Send comments regarding this burden estimate or any other aspect of this collection of information,including suggestions for reducing this burden, to Washington Headquarters Services, Directorate for Information Operations and Reports, 1215 Jefferson Davis Highway, Suite 1204, ArlingtonVA 22202-4302. Respondents should be aware that notwithstanding any other provision of law, no person shall be subject to a penalty for failing to comply with a collection of information if itdoes not display a currently valid OMB control number.
1. REPORT DATE 01 JUN 2006
2. REPORT TYPE N/A
3. DATES COVERED -
4. TITLE AND SUBTITLE GPS Sounding of the Ionosphere Onboard CHAMP
5a. CONTRACT NUMBER
5b. GRANT NUMBER
5c. PROGRAM ELEMENT NUMBER
6. AUTHOR(S) 5d. PROJECT NUMBER
5e. TASK NUMBER
5f. WORK UNIT NUMBER
7. PERFORMING ORGANIZATION NAME(S) AND ADDRESS(ES) Deutsches Zentrum für Luft- und Raumfahrt (DLR) / Institut fürKommunikation und Navigation Kalkhorstweg 53 Neustrelitz GERMANY
8. PERFORMING ORGANIZATIONREPORT NUMBER
9. SPONSORING/MONITORING AGENCY NAME(S) AND ADDRESS(ES) 10. SPONSOR/MONITOR’S ACRONYM(S)
11. SPONSOR/MONITOR’S REPORT NUMBER(S)
12. DISTRIBUTION/AVAILABILITY STATEMENT Approved for public release, distribution unlimited
13. SUPPLEMENTARY NOTES See also ADM002065., The original document contains color images.
14. ABSTRACT
15. SUBJECT TERMS
16. SECURITY CLASSIFICATION OF: 17. LIMITATION OF ABSTRACT
UU
18. NUMBEROF PAGES
52
19a. NAME OFRESPONSIBLE PERSON
a. REPORT unclassified
b. ABSTRACT unclassified
c. THIS PAGE unclassified
Standard Form 298 (Rev. 8-98) Prescribed by ANSI Std Z39-18

GPS Sounding of the Ionosphere Onboard CHAMP
26 - 2 RTO-MP-IST-056
UNCLASSIFIED/UNLIMITED
UNCLASSIFIED/UNLIMITED
Fig. 1: Illustration of GPS measurement techniques used onboard CHAMP for sounding the ionosphere. (1): Ionospheric radio occultation (IRO) measurements in the limb sounding mode. (2): Use of 0.1 Hz sampled GPS navigation data from the zenith viewing antenna.
Fig. 1 illustrates the two different GPS measurement techniques which are used for ionosphere sounding. The Ionospheric Radio Occultation (IRO) experiment onboard CHAMP (1) provides up to 150 globally distributed vertical electron density profiles per day on a routine basis (Fig. 2). In addition to the IRO measurements, the 0.1 Hz sampled navigation data, measured with the zenith viewing antenna, can effectively be used for probing the topside ionosphere (Heise et al., 2002). Both, the IRO measurements as well as the topside data are operationally processed allowing fast access to global ionospheric information which can be used in near-real-time space weather monitoring.
2. GPS MEASUREMENT TECHNIQUES
Ionospheric Radio Occultation measurements The GPS receiver onboard CHAMP measures carrier phases in the radio occultation or limb sounding mode starting at CHAMP orbit tangential heights down to the Earth surface with a sampling rate of 1 Hz. The measured GPS data are automatically checked and pre-processed by a highly flexible operational processing system (Wehrenpfennig et al., 2001). The processing flexibility is achieved thanks to the modular structure of the processing system in which the retrieval modules can be replaced and upgraded in the course of the CHAMP satellite mission. The original radio occultation measurements of the GPS satellites carried out with a sampling rate of 1 Hz include dual frequency L1/L2 carrier phase as well as code phase measurements.

GPS Sounding of the Ionosphere Onboard CHAMP
RTO-MP-IST-056 26 - 3
UNCLASSIFIED/UNLIMITED
UNCLASSIFIED/UNLIMITED
Oppositely to the radio occultation sounding of the neutral atmosphere, the Ionospheric Radio Occultation (IRO) measurements can take benefit of the dispersive nature of the ionosphere. Thus, differential GPS phases derived from dual frequency GPS measurements can effectively be used for computing the integral of the electron density (TEC) along the ray path traversing the ionosphere.
The applied IRO retrieval method uses only the carrier phase measurements at L1 and L2 GPS frequencies which are described by the observation equation:
ελρφ +++++−−+= NdQdqdddTdtc MPI)( (1)
where ρ is the true geometrical range between GPS satellite and receiver, c is the vacuum speed of light, dt and dT are the satellite and receiver clock errors, dI is the ionospheric delay along the ray path s, dMP is the multipath error, dq and dQ are the instrumental satellite and receiver biases, λ is the radio wave length, N is the phase ambiguity number (integer) and ε is the residual error. The space weather sensitive ionospheric propagation term dI is a function of the refraction index and can be written in a first order approximation by:
dsnfKd
R
S eI ∫= 2 (2)
with K= 40.3 m3s-2.
Here the integral of the local electron density ne along the ray path between satellite S and receiver R is the Total Electron Content already mentioned above. Ignoring the multipath term, instrumental delays and integer ambiguities N in eq. (1), the differential carrier phase ∆φ = φ1− φ2 computed from carrier phases measured at L1 and L2 frequencies provides low noise TEC values. The method neglects dispersive ray path bending effects because these effects are small compared with the first-order-effects (Schreiner et al., 1999). The 1 Hz sampled relative TEC is measured along the radio occultation ray path which has a length in the order of 1000 km in the ionosphere and continuously approaches to the Earth surface measured by the tangential height.
The subsequent measurements form a set of equations which are successively solved from top to bottom, providing the electron density in the assumed spherical shells (Jakowski et al., 2002, 2004).
Since CHAMP has a rather low orbit height of less than 450 km, which decreases with mission time, the upper boundary condition is ill posed because of considerable ionization above the occultation entry. To overcome this upper boundary problem, a specific model assisted technique has been developed for the CHAMP IRO data analysis. The solution starts with the first measurement at the greatest tangential height by using an adaptive model for the topside ionosphere and plasmasphere above the CHAMP orbit height. This adaptive model consists of a Chapman layer whose topside part is extended by a slowly decaying exponential term with a fixed scale height value of 10,000 km. Key model parameters such as the plasma scale height at the upper boundary are determined in a few iterations in order to ensure a smooth transition between model values and measurements. It has been found that the crucial element for improving the solution of the upper boundary problem is the topside scale height (Stankov and Jakowski, 2006).

GPS Sounding of the Ionosphere Onboard CHAMP
26 - 4 RTO-MP-IST-056
UNCLASSIFIED/UNLIMITED
UNCLASSIFIED/UNLIMITED
Fig. 2 Number of IRO measurements and retrieved vertical electron density profiles from 11 April 2001 until end of April 2006.
To fulfill space weather monitoring requirements, i.e. to come up with retrieval products within a latency of less than 3 hours as it is required by the traditional weather service, no further data are included in the retrieval procedure and for reasons of simplicity a spherically layered ionosphere is assumed (Abel inversion assumption). The retrieval can be improved if additional information, e.g. on horizontal gradients or local densities, as may be provided by TEC maps (http://www.kn.nz.dlr.de/swaci/). On average, from about 200 IRO measurements per day, about 150 electron density profiles (EDP) are successfully retrieved (Fig. 2) now adding up to the huge number of more than 200,000 profiles.
Because the processing system works automatically, the occurrence of outliers in the derived profiles cannot be avoided; however, the number of such outliers is less than 1%.

GPS Sounding of the Ionosphere Onboard CHAMP
RTO-MP-IST-056 26 - 5
UNCLASSIFIED/UNLIMITED
UNCLASSIFIED/UNLIMITED
Fig. 3 Locations of retrieved radio occultation profiles during two months (October – November 2004).
As Fig. 3 shows, the measurements are uniformly distributed over the globe thus providing global information on the actual state of the ionosphere. Due to the nearly sun-synchronized orbit of CHAMP the local time sector is slowly shifting from day to day within a repetition period of 132 days (Fig. 4). Within this period the IRO measurements cover all local times. The local time constraint of IRO measurements is less restricted at high latitudes, indicated by the occurrence of measurements between the pronounced LT- bands in Fig. 4.
Fig. 4 Local time sector of ionospheric radio occultation measurements during months August – December 2003.

GPS Sounding of the Ionosphere Onboard CHAMP
26 - 6 RTO-MP-IST-056
UNCLASSIFIED/UNLIMITED
UNCLASSIFIED/UNLIMITED
A typical product sample obtained after automatic retrieval of IRO measurements onboard CHAMP at 48.93 °S; 128.76°E over the Indian Ocean around local noon is shown in Fig. 5. The corresponding data files can be downloaded via the DLR space weather service (http://www.kn.nz.dlr.de/swaci/). The quality label of the data products (0 - 9) provides a rough estimation of the reliability of the retrieval (0 marks the highest level). All analyses presented here were made with the quality label 0 or 1.
To estimate the quality of the derived electron density profiles, a number of validation efforts were undertaken including ionosonde data from the European vertical sounding stations Juliusruh (54.6°N; 13.4°E), Athens (38.0°N; 23.5°E), Rome (41.9°N; 12.5°E), Tortosa (40.8°N; 0.5°E) and Dourbes (50.1°N; 4.6°E) (Jakowski et al., 2005a).
Fig. 5 Data product sample showing the IRO retrieval of the SWACI service.
To give an impression of the achieved accuracy, the validation with ionograms of the Juliusruh ionosonde station has indicated a bias of up to 0.5 MHz and a RMS error of about
1 MHz in the plasma frequency (Jakowski et al., 2004, 2005a). More validation work is required in particular for low latitude data.
Principally, it has to be stated that the IRO derived electron density profiles provide a unique measure describing the mean vertical electron density structure in comparably large areas with characteristic lengths of about 1000 km.
GPS Sounding of the Ionosphere Onboard CHAMP
RTO-MP-IST-056 26 - 7
UNCLASSIFIED/UNLIMITED
UNCLASSIFIED/UNLIMITED
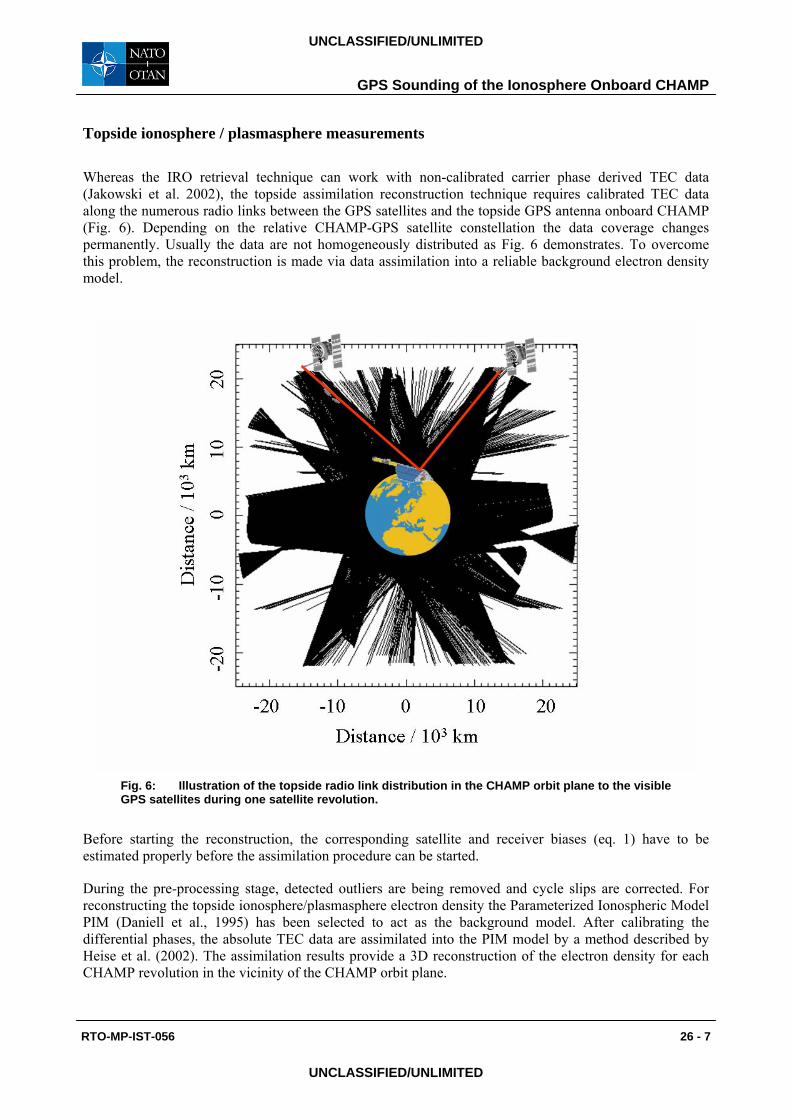
Topside ionosphere / plasmasphere measurements Whereas the IRO retrieval technique can work with non-calibrated carrier phase derived TEC data (Jakowski et al. 2002), the topside assimilation reconstruction technique requires calibrated TEC data along the numerous radio links between the GPS satellites and the topside GPS antenna onboard CHAMP (Fig. 6). Depending on the relative CHAMP-GPS satellite constellation the data coverage changes permanently. Usually the data are not homogeneously distributed as Fig. 6 demonstrates. To overcome this problem, the reconstruction is made via data assimilation into a reliable background electron density model.
Fig. 6: Illustration of the topside radio link distribution in the CHAMP orbit plane to the visible GPS satellites during one satellite revolution.
Before starting the reconstruction, the corresponding satellite and receiver biases (eq. 1) have to be estimated properly before the assimilation procedure can be started.
During the pre-processing stage, detected outliers are being removed and cycle slips are corrected. For reconstructing the topside ionosphere/plasmasphere electron density the Parameterized Ionospheric Model PIM (Daniell et al., 1995) has been selected to act as the background model. After calibrating the differential phases, the absolute TEC data are assimilated into the PIM model by a method described by Heise et al. (2002). The assimilation results provide a 3D reconstruction of the electron density for each CHAMP revolution in the vicinity of the CHAMP orbit plane.

GPS Sounding of the Ionosphere Onboard CHAMP
26 - 8 RTO-MP-IST-056
UNCLASSIFIED/UNLIMITED
UNCLASSIFIED/UNLIMITED
Validation of the derived electron density distribution was made with in situ plasma density measurements of the Planar Langmuir Probe installed onboard CHAMP and incoherent scatter measurements at different sites.
As shown by Heise et al., 2002, the assimilation results have no significant bias and agree with the Langmuir Probe in situ data with a standard deviation of 2x10¹¹m-3. Reasonable agreement was also found with topside profiles deduced from incoherent scatter measurements.
Fig. 7: Reconstruction of the electron density distribution of the topside ionosphere based on GPS data received onboard CHAMP. The reconstruction is based on medians obtained for 21:00 UT over 10 consecutive days in August 2005. Thus, the right side shows the ionosphere/plasmasphere shortly after midnight whereas the left side represents ionosphere shortly after noon.
As Fig. 7 demonstrates, the global view on the Earth’s plasma environment enables the study of magnetospheric-ionospheric coupling processes. Here, the compression of the plasmasphere at the day-side and the enlarged extension of the plasmasphere at the night-side are clearly visible. Thus, it becomes evident that this type of space based GPS measurements can provide essential contributions to a space weather monitoring of the ionosphere.
3. OBSERVATION RESULTS AND DISCUSSION
Global data coverage and the huge amount of more than 200000 electron density profiles allow efficiently studying global large scale ionospheric processes. Because the first data were obtained in 2001 under

GPS Sounding of the Ionosphere Onboard CHAMP
RTO-MP-IST-056 26 - 9
UNCLASSIFIED/UNLIMITED
UNCLASSIFIED/UNLIMITED
rather high solar activity conditions, the observations enable conclusions about the solar activity dependence of key ionospheric parameters.
Since the ionospheric ionization is essentially produced by solar radiation of wavelengths shorter than 130 nm, there is a strong solar cycle variation of the ionospheric peak density and other parameters related to the structure of the thermosphere/ionosphere. The solar activity control of the ionization level, well-known from TEC-measurements (e.g. Jakowski et al., 1991) is clearly visible in the level of the peak electron density derived from IRO measurements onboard CHAMP (Fig. 8).
Fig. 8: Latitudinal dependency of the day-time (08:00-16:00 LT) F2 layer peak electron density NmF2 as seen in the CHAMP IRO data at three years 2002-2004 for all longitudes. The corresponding standard deviation σ is given at the bottom of the figure.
Fig. 8 shows that the F2 layer ionization reduces up to 30 % at daytime from 2002 to 2004, when the average solar radio flux F10.7 cm decreases from about 180 down to 107 by about 40%.
It is obvious that the solar radiation induced photo ionization of the Earth’s atmosphere depends on the incidence angle of the irradiation. Thus, the general behavior of the latitudinal variation of the total ionization in Figs. 8 and 9 can easily be explained.

GPS Sounding of the Ionosphere Onboard CHAMP
26 - 10 RTO-MP-IST-056
UNCLASSIFIED/UNLIMITED
UNCLASSIFIED/UNLIMITED
Fig. 9: Latitudinal dependence of the peak electron density NmF2 summarizing all measurements obtained in 2004 in the first and second half years at daytime (08:00 -16:00 LT) for all longitudes. The crest locations are marked at about ±15° magnetic latitude and the standard deviation σ is given at the bottom of the figure.
However, since the plasma motion is strongly influenced by magnetic und electric fields, the latitudinal dependence of the peak electron density demonstrates a more complex relationship with the solar activity. The well-known equatorial anomaly, characterized by enhanced ionization at about 15° at both sides of the geomagnetic equator is due to electric fields generated near the geomagnetic equator. The ionospheric plasma is uplifted at the geomagnetic equator via E x B drift and, while returning back, enhances the topside electron density at both sides of the geomagnetic equator, thus forming the so-called equatorial crest.
This can nicely be seen also in the latitudinal dependence of the day-time peak density height hmF2 in Fig. 9 where hmF2 reaches an absolute maximum of about 375 km near the geomagnetic equator. The northward shift of the maximum is due to seasonal effects because the northern summer hemisphere is stronger heated than the southern winter hemisphere. If high latitudes > 65° are excluded, the general behavior indicates positive linear trends directed to the warmer summer hemisphere for hmF2, the scale height Hs and the bottomside equivalent slab thickness τ b as well. The following gradients may roughly be estimated:
The peak density height hmF2 and the scale height Hs grow up from winter to summer by about 140 m/deg whereas the bottomside slab thickness grows up in the average by a rate of approximately 410 m /deg.
Enhanced thermospheric heating during summer leads to an expansion of the thermospheric density distribution resulting in an increased peak density height and increased shape parameters slab thickness and topside scale height of the electron density profiles. This explanation is also confirmed when looking to the solar cycle dependence of these parameters showing biggest values at high solar activity conditions.
Compared with 2001, the peak density height decreases in average by about 75 km throughout all latitudes within in 2004.

GPS Sounding of the Ionosphere Onboard CHAMP
RTO-MP-IST-056 26 - 11
UNCLASSIFIED/UNLIMITED
UNCLASSIFIED/UNLIMITED
Fig. 10: Latitudinal dependence of the peak density height hmF2 and shape parameters such as bottomside slab thickness τb and the topside scale height Hs at 425 km height measured at daytime in Northern summer. The corresponding standard deviation σ of all three parameters is given at the bottom of the figure.
Fig. 11: Imaging of the average vertical ionization structure constructed from all IRO profiles obtained during the first 13 days in October 2003 between 21:00 and 05:00 LT. Marked are geomagnetic latitudes at 70° and at 0°.

GPS Sounding of the Ionosphere Onboard CHAMP
26 - 12 RTO-MP-IST-056
UNCLASSIFIED/UNLIMITED
UNCLASSIFIED/UNLIMITED
The observed high latitude enhancement of all three parameters at the winter hemisphere is probably due to thermospheric heating as a consequence of particle precipitation and the action of the auroral electrojet. During night-time the polar ionosphere is separated from the mid-latitude ionosphere by the so-called trough region which is characterized by very low electron densities. As Fig. 11 shows, IRO profiles reflect this phenomenon very well in their average plot.
Although the limb sounding mode principally leads to a strong averaging of the observational data, the IRO measurements document the existence of numerous irregularities in the ionosphere (Tsybulya and Jakowski, 2005).
Fig. 12: Global distribution of the occurrence of ionospheric irregularities (characteristic scale length about 15-30 km) detected in IRO CHAMP data from March 2002 – February 2006. Geomagnetic poles are marked by asterisks, the magnetic equator by a full line.
As Fig. 12 shows, the perturbation level is clearly pronounced in the Polar Regions, in particular around the geomagnetic poles. Although upward propagation of atmospheric gravity waves cannot be excluded it is assumed that these perturbations are more likely related to thermospheric/ionospheric interaction processes (Tsybulya and Jakowski, 2005). Furthermore, the IRO data from CHAMP have clearly shown that the TID activity is more pronounced in winter nights.
Severe space weather events modify the magnetosphere/ionosphere and thermosphere systems at quite different spatial and temporal scales. The GNSS measurements onboard CHAMP are well suited to monitor in particular large scale effects in time and space. Thus, storm induced changes of the ionospheric plasma developing at characteristic times of a few days and scale lengths of up to several thousand kilometers can be monitored effectively by analyzing the topside electron density reconstructions (e.g. Jakowski et al., 2005b).
GPS Sounding of the Ionosphere Onboard CHAMP
RTO-MP-IST-056 26 - 13
UNCLASSIFIED/UNLIMITED
UNCLASSIFIED/UNLIMITED
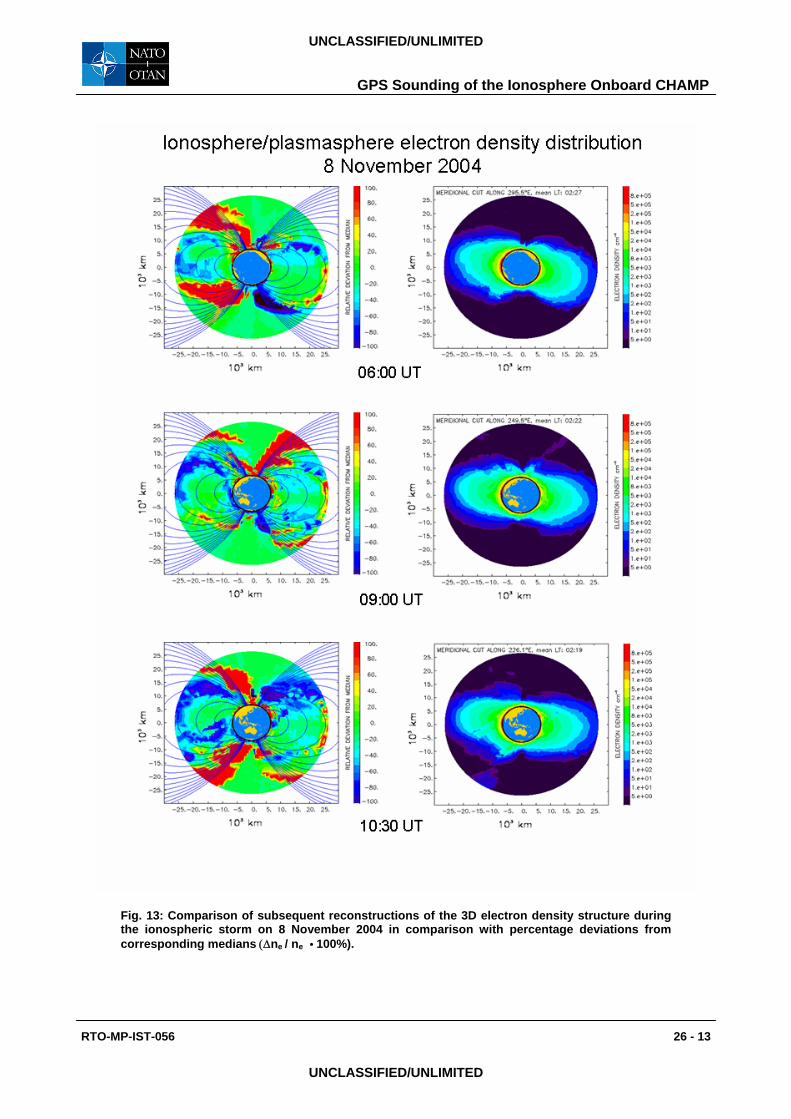
Fig. 13: Comparison of subsequent reconstructions of the 3D electron density structure during the ionospheric storm on 8 November 2004 in comparison with percentage deviations from corresponding medians (∆ne / ne • 100%).

GPS Sounding of the Ionosphere Onboard CHAMP
26 - 14 RTO-MP-IST-056
UNCLASSIFIED/UNLIMITED
UNCLASSIFIED/UNLIMITED
During the storm on 7/8 November 2004 the electron density reconstructions in the CHAMP orbit plane indicate strong irregular behavior in particular close to the plasma pause region. The time period covered by the plots in Fig. 13 corresponds with the time of Dst minimum value at 08:00 UT on November 8, 2004. Strong enhancements of the electron density are seen at high latitudes indicating plasma upflow in the auroral ionosphere at both hemispheres. Whereas such a plasma flow is more pronounced at the day-time polar zones at 6:00 UT and 10:30 UT, the outflow is focused at the northern pole around 9:00 UT. We are aware of the fact that the reconstructions are derived from a limited TEC data base and simplified assumptions. Nevertheless, the analysis of several storms indicates strong enhancements and also suppressions of the electron density. To avoid misinterpretation, we have counted only strong perturbation induced electron density deviations which exceed corresponding median values by 50% or are less than half of the median. The result, obtained for the storm on 20/21 November 2003, is shown in Fig. 14.
Fig. 14: Comparison of positive and negative deviation counts of the electron density values that exceed a certain threshold value (|∆ne| > 50%) from corresponding means with the geomagnetic Dst index (http://swdcdb.kugi.kyoto-u.ac.jp/dstdir/).
It is interesting to see that the topside ionosphere/plasmasphere considerably blows up in the growing phase of the storm whereas it reduces in the recovery phase. This behavior even repeats during a sub-storm starting around 12 UT on 22 November confirming the conclusion. Although we are aware of some

GPS Sounding of the Ionosphere Onboard CHAMP
RTO-MP-IST-056 26 - 15
UNCLASSIFIED/UNLIMITED
UNCLASSIFIED/UNLIMITED
remaining constraints of the reconstruction technique, e.g. due to incomplete data coverage, we believe that the basic observation results are correct.
Conclusions on the principal behavior of the plasmaspheric dynamics during geomagnetic storms are more reliable if several storms are superposed. Corresponding studies are planned.
4. SUMMARY AND CONCLUSIONS
The large data base of IRO-derived electron density profiles and reconstructions of the topside ionosphere/plasmasphere electron density distribution is a valuable data source for the international scientific community. The obtained space based GPS measurements contribute to a better understanding of solar-terrestrial relationships, and are valuable for developing and improving global ionospheric models. Due to the near-real-time processing of the satellite data the CHAMP satellite provides operational space weather information. To make this information available as fast as possible, DLR has established a permanent space weather service under http://www.kn.nz.dlr.de/swaci which provides both ground as well as space based GPS measurements and corresponding ionospheric data products.
To fulfill the user requirements for a space weather service, robust and sufficiently accurate retrieval techniques are needed. The CHAMP automatic processing system is able to provide ionospheric data products within 3 hours after scientific data dump in Neustrelitz.
Validation of IRO data has revealed that the F2 layer peak electron density f0F2 and the corresponding height hmF2 agree quite well within 20% deviation.
The standard deviation of vertical sounding derived electron density profiles is in the order of 1 MHz plasma frequency throughout the entire IRO profile.
Although the good agreement between IRO measurement data and other types of independent measurements has proved the quality of the IRO retrieval technique, the validation process is planned to be continued. Further validation is also required for the topside reconstruction data which we have shown to image large scale structures of severe ionospheric perturbations.
To enhance the resolution of 3D reconstruction of the global ionospheric electron density distribution, space based GNSS sounding should be combined with ground based GNSS measurements.
The launch of new occultation satellites such as COSMIC, SWARM or TerraSAR-X offers great promise for modeling and monitoring the electron concentration in the near-Earth-space for scientific studies and continuous space weather monitoring.
Acknowledgements
This work has been financially supported by the German State Government of Mecklenburg-Vorpommern under Grant V230-630-08-TIFA-334. The authors thank K. Tsybulya for his help in preparing the paper. The authors are grateful to the international CHAMP team for maintaining the operation of the CHAMP satellite since 2000.
References
[1] Daniell, R.E, Brown, L.D., Anderson, D.N., Fox, M.W., Doherty, P.H., Decker, D.T., Sojka, J.J., Schunk, R. W., Parameterized ionospheric model: a global ionospheric parameterization based on first principles models. Radio Sci., 30, 1499-1510, 1995.

GPS Sounding of the Ionosphere Onboard CHAMP
26 - 16 RTO-MP-IST-056
UNCLASSIFIED/UNLIMITED
UNCLASSIFIED/UNLIMITED
[2] Garcia-Fernandez, M., M. Hernandez-Pajares, J.M. Juan, J. Sanz, Improvement of ionospheric electron density estimation with GPSMET occultations using Abel inversion and VTEC information, J. Geophys. Res., 108(A9), 1338, doi: 10.1029/2003JA009952, 2003
[3] Hajj, G.A., Romans, L.J., Ionospheric electron density profiles obtained with the Global Positioning System: Results from the GPS/MET experiment, Radio Sci., 33(1), 175-190, 1998.
[4] Heise, S., N. Jakowski, A. Wehrenpfennig, Ch. Reigber, H. Luehr, Sounding of the Topside Ionosphere/Plasmasphere Based on GPS Measurements from CHAMP: Initial Results, Geophysical Research Letters, 29, No. 14, 10.1029/2002GL014738, 2002
[5] Jakowski N., B. Fichtelmann, and A. Jungstand, Solar activity control of ionospheric and thermospheric processes, J. Atmos. Terr. Phys., 53, 1125-1130, 1991
[6] Jakowski, N., Wehrenpfennig, A., Heise, S., Reigber, C., Luehr, H., Grunwaldt, L, Meehan, T., GPS radio occultation measurements of the ionosphere from CHAMP: Early results. Geophys. Res. Lett. 29(10), doi: 10.1029/2001GL014364, 2002.
[7] Jakowski, N., Leitinger, R., Angling, M., Radio Occultation technique for probing the ionosphere, Annals of Geophysics, 47(2/3), 1049-1066, 2004.
[8] Jakowski, N., Tsybulya, K., Mielich, J., Belehaki, A., Altadill, D., Jodogne, J.C., Zolesi, B., Validation of GPS Ionospheric Radio Occultation results onboard CHAMP by Vertical Sounding Observations in Europe, in: Ch. Reigber, H. Luehr, P. Schwintzer, J. Wickert (Eds.): Earth Observation with CHAMP, Results from Three Years in Orbit, Springer, Berlin, 447 - 452, 2005a.
[9] Jakowski, N., Wilken, V., Schlueter, S., Stankov , S.M., Heise, S. Ionospheric space weather effects monitored by simultaneous ground and space based GNSS signals, JASTP, 67, 1074–1084, 2005b.
[10] Reigber, C., Luehr, H., Schwintzer, P., CHAMP mission status and perspectives, EOS Transactions - American Geophysical Union, 81 (Suppl. to No.48 ), F307, 2000
[11] Schreiner, W. S., S.V. Sokolovskiy, C. Rocken, Analysis and validation of GPS/MET radio occultation data in the ionosphere, Radio Sci., 34, 949-966, 1999.
[12] Stankov, S.M., Jakowski, N., Topside ionospheric scale height analysis and modeling based on radio occultation measurements, J. Atmos. Solar-Terr. Phys. 68, 134-162, 2006
[13] Tsybulya, K. and Jakowski, N., Medium- and small-scale ionospheric irregularities detected by GPS radio occultation method, Geophys. Res. Lett., 32, L09103, doi:10.1029/2005GL022420, 2005
[14] Wehrenpfennig, A., Jakowski, N., Wickert, J., A dynamically configurable system for operational processing of Space Weather Data. Physics and Chemistry of the Earth (C), 26(8), 601-604, 2001.

IST056, Characterising the Ionosphere Institute of Communications and Navigation Page 112-16 June 2006, Fairbanks, Alaska
GPS Sounding of the Ionosphere Onboard CHAMPN. Jakowski, C. Mayer, V. Wilken
German Aerospace Center (DLR), Institute of Communications and Navigation, Neustrelitz, Germany

IST056, Characterising the Ionosphere Institute of Communications and Navigation Page 212-16 June 2006, Fairbanks, Alaska
Outline
The CHAMP SatelliteIonospheric Radio Occultation (IRO) Measurements
Retrieval technique and validationObservations
Electron Density Topside ReconstructionReconstruction technique and validationObservations
Summary & Conclusions

IST056, Characterising the Ionosphere Institute of Communications and Navigation Page 312-16 June 2006, Fairbanks, Alaska
CHAMP Satellite
OBJECTIVESGravity and magnetic field,atmosphere and ionosphere GPS sounding
Launch15 July 2000Circular polar Orbiti = 87°Apogee: 440 – 360 kmPerigee: 410 – 340 kmScience data reception inDLR Neustrelitz
IST056, Characterising the Ionosphere Institute of Communications and Navigation Page 412-16 June 2006, Fairbanks, Alaska
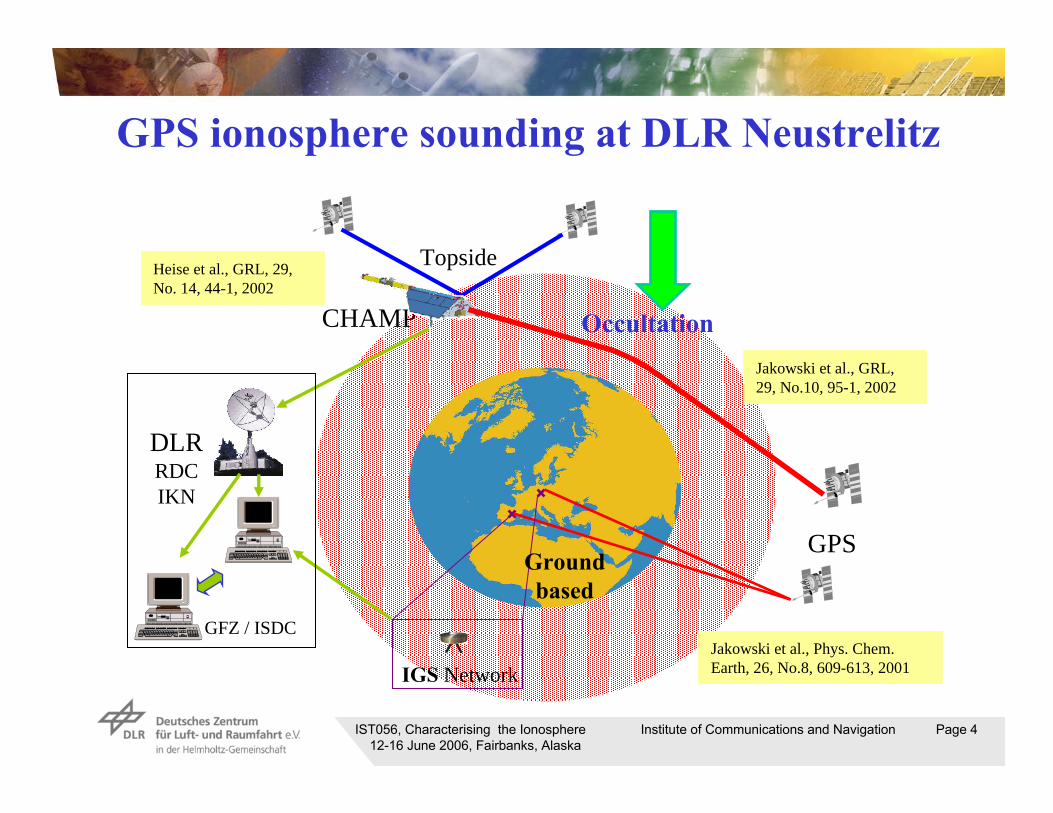
GPS ionosphere sounding at DLR Neustrelitz
GFZ / ISDC
DLRRDCIKN
Topside
GPSGroundbased
IGS Network
OccultationCHAMP
Jakowski et al., GRL, 29, No.10, 95-1, 2002
Heise et al., GRL, 29, No. 14, 44-1, 2002
Jakowski et al., Phys. Chem. Earth, 26, No.8, 609-613, 2001

IST056, Characterising the Ionosphere Institute of Communications and Navigation Page 512-16 June 2006, Fairbanks, Alaska
Observation Equations
The space based GPS ionosphere sounding utilizes measurements of L1/L2 carrier phases and pseudoranges P1/P2
withρ true range between GPS satellite and receiver along ray path sc velocity of lightdt satellite clock errordT receiver clock errordI ionospheric phase delay along sdMP error due to multipathdq instrumental bias of the satellitedQ instrumental bias of the receiverλ wave length of radiowaveN phase ambiguity number (integer)ε residual error
LNdQdqdddTdtcLMPI
ελρ +++++−−+= )(pdQdqdddTdtcP
MPIερ +++++−+= )(

IST056, Characterising the Ionosphere Institute of Communications and Navigation Page 612-16 June 2006, Fairbanks, Alaska
GPS Satellite
CHAMP Satellite
CHAMP Orbit
Radio Signal
GPS
GPS Ionospheric Radio Occultation - IRO
CHAMP: Launch 15 July 2000, i = 87°, h = 450 km → 340 km

IST056, Characterising the Ionosphere Institute of Communications and Navigation Page 712-16 June 2006, Fairbanks, Alaska
Retrieval of electron density profiles
Refractive Index
22 1
fnKn e−≈
ne(h)dsnTEC e∫=
offTECffffKLL ε+
−=Φ−Φ=ΔΦ 2
22
1
22
21
21 )()(
Differential phase
Inversion

IST056, Characterising the Ionosphere Institute of Communications and Navigation Page 812-16 June 2006, Fairbanks, Alaska
Ionospheric profiling since 11 April 2001
Automatic retrieval of electron density profiles ( > 70% successfully)
IST056, Characterising the Ionosphere Institute of Communications and Navigation Page 912-16 June 2006, Fairbanks, Alaska
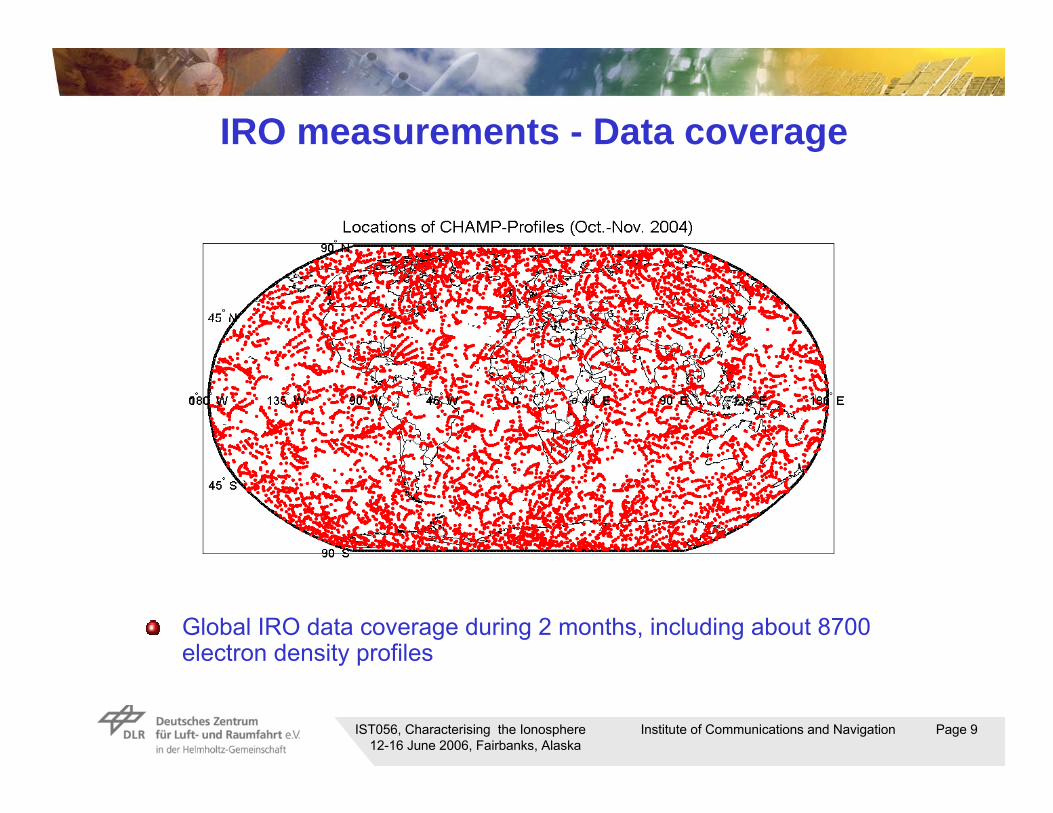
IRO measurements - Data coverage
Global IRO data coverage during 2 months, including about 8700 electron density profiles

IST056, Characterising the Ionosphere Institute of Communications and Navigation Page 1012-16 June 2006, Fairbanks, Alaska
Local Time sectors of CHAMP IRO measurements
Full 12 hourscycle within 132 daysAt high latitudesthe local time constraint is lesssharp

IST056, Characterising the Ionosphere Institute of Communications and Navigation Page 1112-16 June 2006, Fairbanks, Alaska
Comparison of IRO retrievals with EISCAT
Comparison with EISCAT data shows reasonableagreementResidual errors may be due to the fact that thehigh latitude ionosphere is often irregular
Stolle et al., Ann. Geophysicae, 22, 2015-2022, 2004
IST056, Characterising the Ionosphere Institute of Communications and Navigation Page 1212-16 June 2006, Fairbanks, Alaska
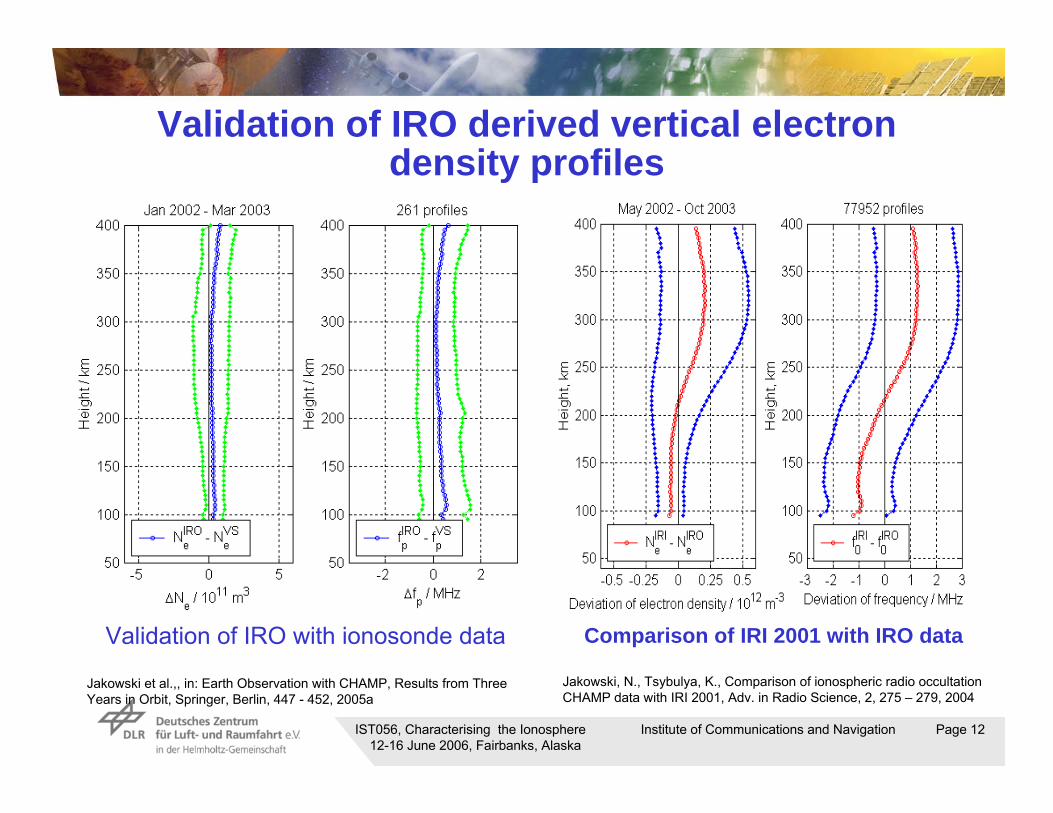
Validation of IRO derived vertical electrondensity profiles
Validation of IRO with ionosonde data
Jakowski et al.,, in: Earth Observation with CHAMP, Results from Three Years in Orbit, Springer, Berlin, 447 - 452, 2005a
Comparison of IRI 2001 with IRO data
Jakowski, N., Tsybulya, K., Comparison of ionospheric radio occultation CHAMP data with IRI 2001, Adv. in Radio Science, 2, 275 – 279, 2004

IST056, Characterising the Ionosphere Institute of Communications and Navigation Page 1312-16 June 2006, Fairbanks, Alaska
Latitudinal dependency of NmF2 peak density
Latitudinal variation of day-timeNmF2 (08-16 LT) fromJanuary – June in years2002 -2004,
The corresponding standarddeviations σ are plotted at the bottom of the figure.
The NmF2 peak density showsclearly the crest at bothhemispheres and furthermore, the closerelationship to the solar activity level whichdecreases from 2002-2004.Density ratio NmF2crest / NmF2pole ≤ 6

IST056, Characterising the Ionosphere Institute of Communications and Navigation Page 1412-16 June 2006, Fairbanks, Alaska
Latitudinal dependency of hmF2 and shapeparameters τb and Hs
Latitudinal variation of thepeak density height hmF2 and shape parametersbottomside slab thickness τband the topside scale heightHs at 425 km height from1 May -10 August 2002
The corresponding standarddeviations σ are plotted at thebottom of the figure.The peak density heighthmF2 and shape parametersshow a linear increase fromthe winter towards thesummer hemisphere, exceptionally at the polar and geomagnetic anomalyregions.
IST056, Characterising the Ionosphere Institute of Communications and Navigation Page 1512-16 June 2006, Fairbanks, Alaska
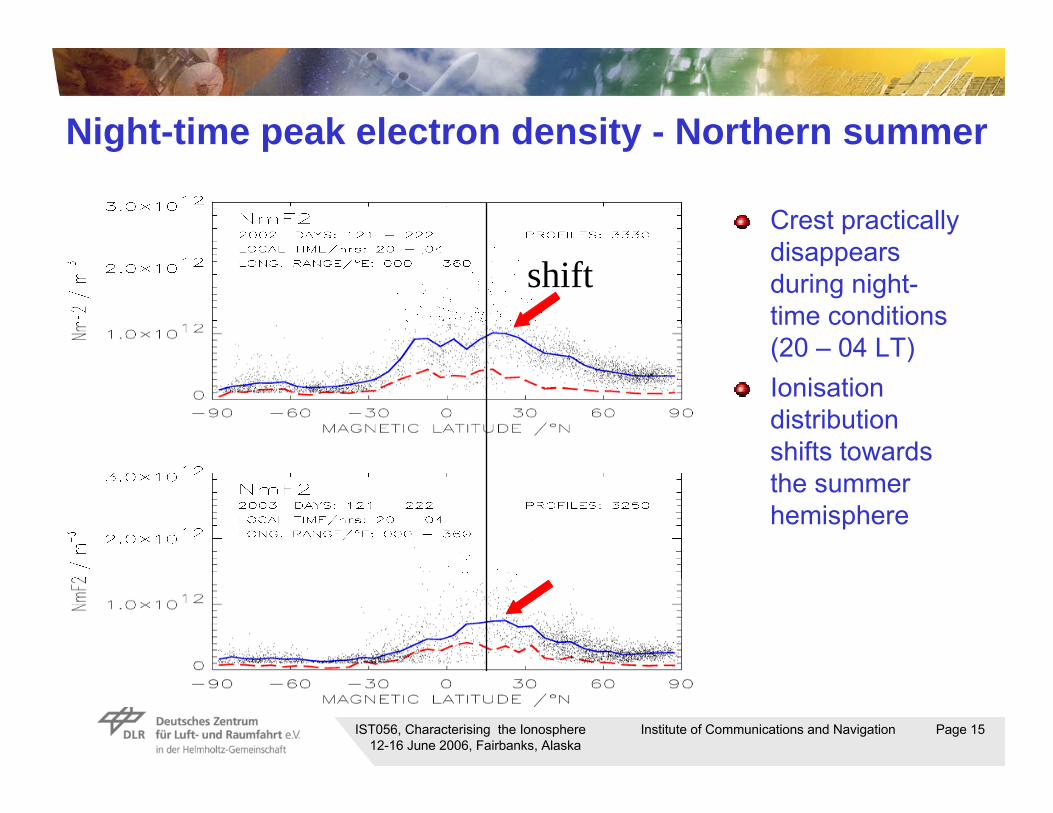
Night-time peak electron density - Northern summer
Crest practicallydisappearsduring night-time conditions(20 – 04 LT)Ionisation distributionshifts towardsthe summerhemisphere
shift

IST056, Characterising the Ionosphere Institute of Communications and Navigation Page 1612-16 June 2006, Fairbanks, Alaska
Alti
tude
/ km
Magnetic Latitude
IRO IRO ProfilesProfiles 1 1 --13 13 OctoberOctober 2003 08:30 2003 08:30 –– 16: 30 LT16: 30 LT
Regular ionosphere: Daytime Equatorial Crest
Clearindication of the equatorialanomaly at day-time

IST056, Characterising the Ionosphere Institute of Communications and Navigation Page 1712-16 June 2006, Fairbanks, Alaska
Averaged IRO profilesduring 1 -13 October2003 representingnight-time conditions(21:00 – 05:00 LT)
The night-timeionosphere showswell pronuncedtroughs at bothhemispheres around70° geomagneticlatitude
IRO IRO ProfilesProfiles 1 1 --13 13 OctoberOctober 2003 21:00 2003 21:00 –– 05:00 LT05:00 LT
Regular ionosphere: Nighttime high latitude trough

IST056, Characterising the Ionosphere Institute of Communications and Navigation Page 1812-16 June 2006, Fairbanks, Alaska
GPS radio occultation derived electron densityprofiles during the storm in August 2003
Storm onset:5 August 2003, 05:00 UT
Latitude range: 55 - 70°NLongitude range: -20°– 40°E
Deformation of profile shapeprobably due to winds on first day(positive phase)Enhanced plasma loss probablydue to composition changeson third day (negative phase)
75

IST056, Characterising the Ionosphere Institute of Communications and Navigation Page 1912-16 June 2006, Fairbanks, Alaska
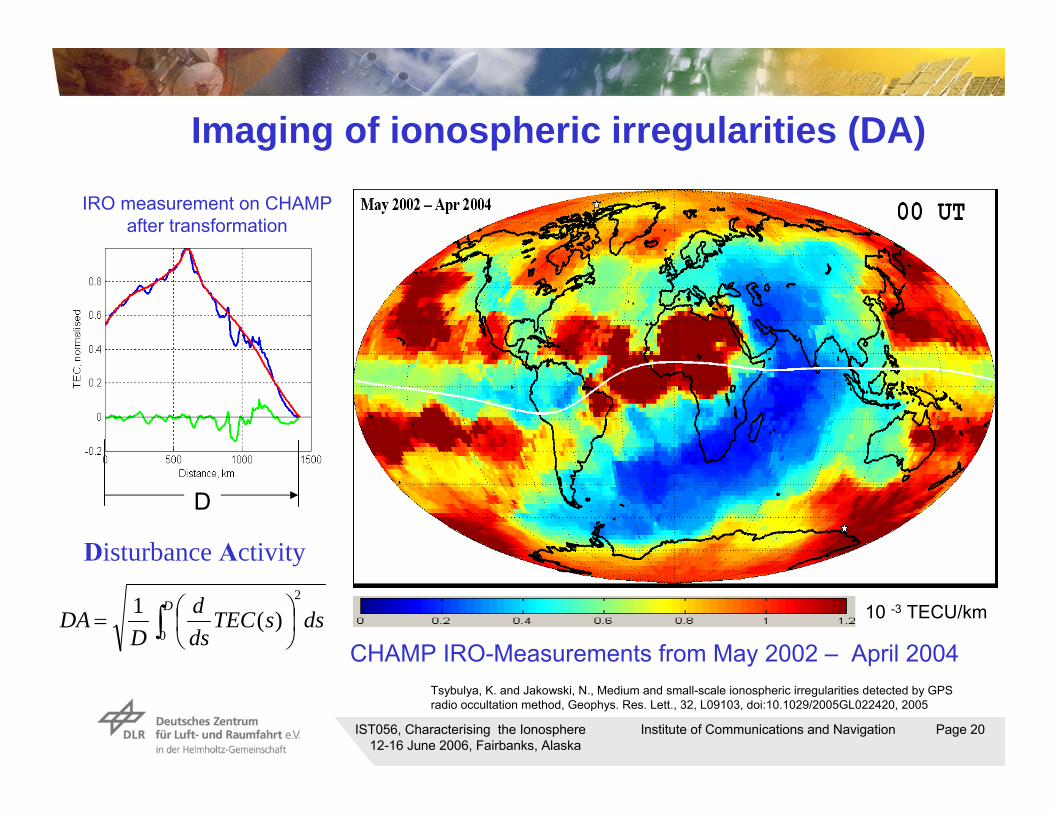
IRO - TEC data transformation
To estimate thesize of theirregularities theoccultation dataare related to thetrace of themoving tangential point through theionosphereObtained is TEC as a function of the distance between CHAMP and the movingtangential point
Satellite Orbit
Tangent Point
Rays to GPS
IST056, Characterising the Ionosphere Institute of Communications and Navigation Page 2012-16 June 2006, Fairbanks, Alaska
Imaging of ionospheric irregularities (DA)
CHAMP IRO-Measurements from May 2002 – April 2004
.
∫ ⎟⎠⎞
⎜⎝⎛=
DdssTEC
dsd
DDA
0
2
)(1
Disturbance Activity
Tsybulya, K. and Jakowski, N., Medium and small-scale ionospheric irregularities detected by GPS radio occultation method, Geophys. Res. Lett., 32, L09103, doi:10.1029/2005GL022420, 2005
D
10 -3 TECU/km
IRO measurement on CHAMP after transformation

IST056, Characterising the Ionosphere Institute of Communications and Navigation Page 2112-16 June 2006, Fairbanks, Alaska
Fourier Transform and Spectral Density Estimation
Observation samplesof Fouriertransformand Spectral DensityEstimation (SDE)
The observations aresubdivided into twogroups withcharacteristic scalelengths of 15 - 30 km and 80 -150 km.
50.7 8.8 346.7 19.5 TECU x kmSDE:
Small
15-30 km
Medium
80-150 km

IST056, Characterising the Ionosphere Institute of Communications and Navigation Page 2212-16 June 2006, Fairbanks, Alaska
Global distribution of ionospheric irregularities
Spectral densityof ionosphericirregularitiesaveraged overscale lengthsλ ≈15-30 km250,000 occultations fromMarch 2002 –March 2006Irregularities arerelated to thegeomagnetic fieldstructure
IST056, Characterising the Ionosphere Institute of Communications and Navigation Page 2312-16 June 2006, Fairbanks, Alaska
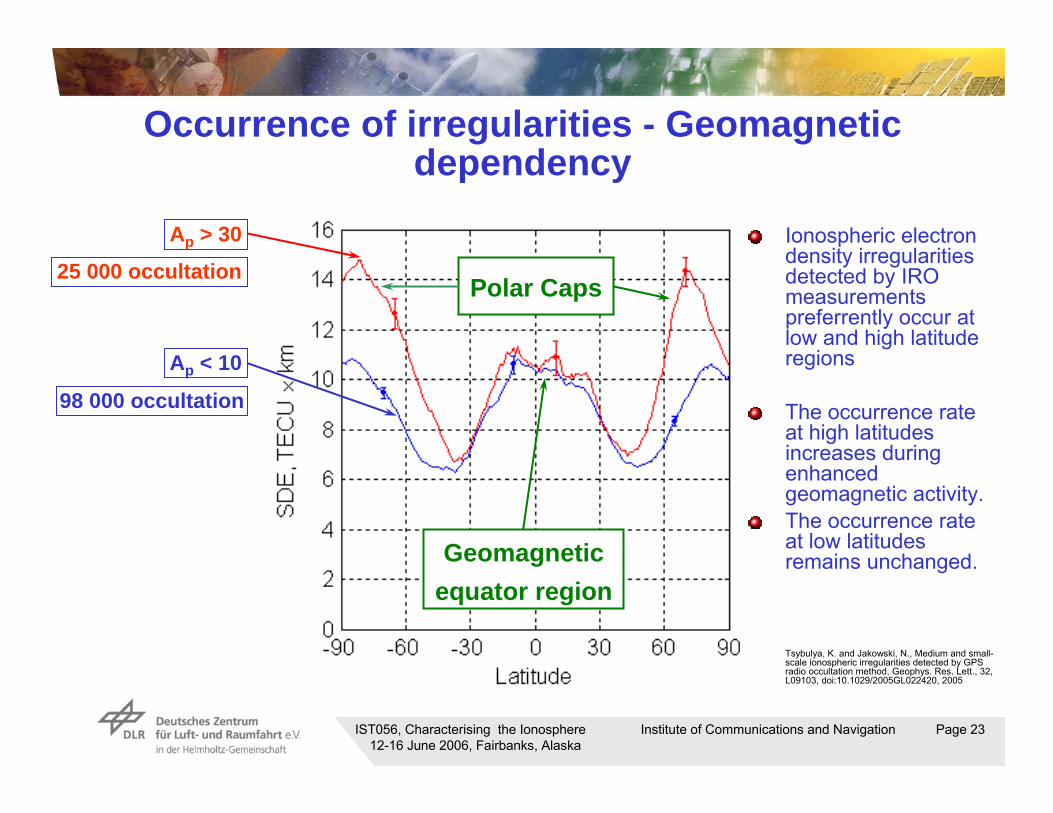
Occurrence of irregularities - Geomagneticdependency
Ionospheric electrondensity irregularitiesdetected by IRO measurementspreferrently occur at low and high latituderegions
The occurrence rate at high latitudesincreases duringenhancedgeomagnetic activity.The occurrence rate at low latitudesremains unchanged.
Tsybulya, K. and Jakowski, N., Medium and small-scale ionospheric irregularities detected by GPS radio occultation method, Geophys. Res. Lett., 32, L09103, doi:10.1029/2005GL022420, 2005
98 000 occultation
Ap > 30
25 000 occultation
Ap < 10
Polar Caps
Geomagnetic equator region

IST056, Characterising the Ionosphere Institute of Communications and Navigation Page 2412-16 June 2006, Fairbanks, Alaska
GPS ionosphere sounding
GFZ / ISDC
DLRRDCIKN
Topside
GPSGroundbased
IGS Network
OccultationCHAMPJakowski et al., GRL, 29, No.10, 95-1, 2002
Heise et al., GRL, 29, No. 14, 44-1, 2002
Jakowski et al., Phys. Chem. Earth, 26, No.8, 609-613, 2001
IST056, Characterising the Ionosphere Institute of Communications and Navigation Page 2512-16 June 2006, Fairbanks, Alaska
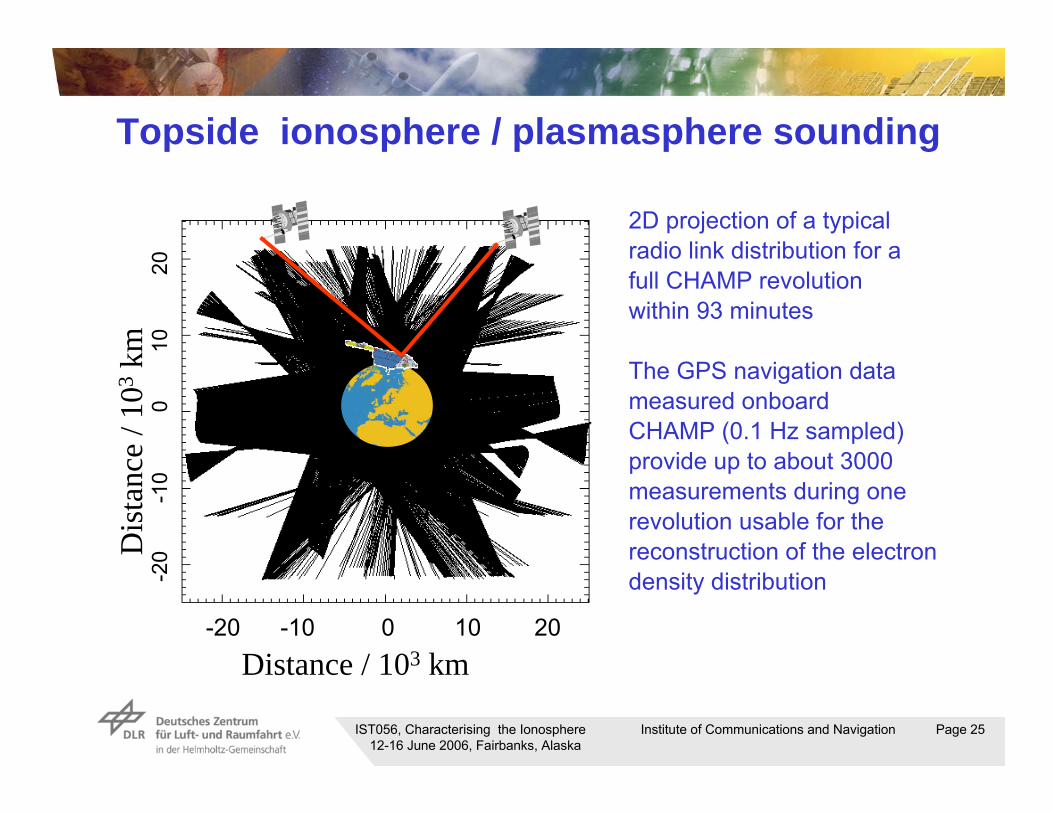
Topside ionosphere / plasmasphere sounding
2D projection of a typicalradio link distribution for a full CHAMP revolutionwithin 93 minutes
The GPS navigation datameasured onboardCHAMP (0.1 Hz sampled)provide up to about 3000measurements during onerevolution usable for thereconstruction of the electrondensity distribution
Distance / 103 km-20 -10 0 10 20
-20
-10
0
10
20
Dis
tanc
e / 1
03km

IST056, Characterising the Ionosphere Institute of Communications and Navigation Page 2612-16 June 2006, Fairbanks, Alaska
Upper Ionosphere/Plasmasphere – DataAssimilation
Voxel structure for data assimilation
Discretization for ray path j:TEC
j n dsei ijij= ∑
Electron densitydistribution
TEC = D*X&
PIM
j
Dataassimilation
S. Heise, N. Jakowski, A. Wehrenpfennig, Ch. Reigber, H. Lühr, Sounding of the Topside Ionosphere/Plasmasphere Based on GPS Measurements from CHAMP: Initial Results, Geophysical Research Letters, 29, No. 14, 10.1029/2002GL014738, 2002

IST056, Characterising the Ionosphere Institute of Communications and Navigation Page 2712-16 June 2006, Fairbanks, Alaska
Validation using Langmuir Probe Measurements
Scatter plots of initial model (PIM) data and assimilation results versusLangmuir Probe derived electron densities for 2001, days 113 - 118
before after assimilation
S. Heise, N. Jakowski, A. Wehrenpfennig, Ch. Reigber, H. Lühr, Sounding of the Topside Ionosphere/Plasmasphere Based on GPS Measurements from CHAMP: Initial Results, Geophysical Research Letters, 29, No. 14, 10.1029/2002GL014738, 2002

IST056, Characterising the Ionosphere Institute of Communications and Navigation Page 2812-16 June 2006, Fairbanks, Alaska
Plasmasphere data assimilation – reconstructionresult
Electron Density in theCHAMP revolution plane
15-16 3D maps/day
Operational since
June 10th 2005
Plots: SWACI websitenight day
29/10/2003

IST056, Characterising the Ionosphere Institute of Communications and Navigation Page 2912-16 June 2006, Fairbanks, Alaska
Averaged plasmasphere electron density distribution
Number of assimilations: 9Time interval:08/14/2005 until08/23/2005
Day-night asymmetry of theplasmasphere visible
110 210 310
Electron Density in cm
410 510
-3
nightday
01:17 LT
IST056, Characterising the Ionosphere Institute of Communications and Navigation Page 3012-16 June 2006, Fairbanks, Alaska
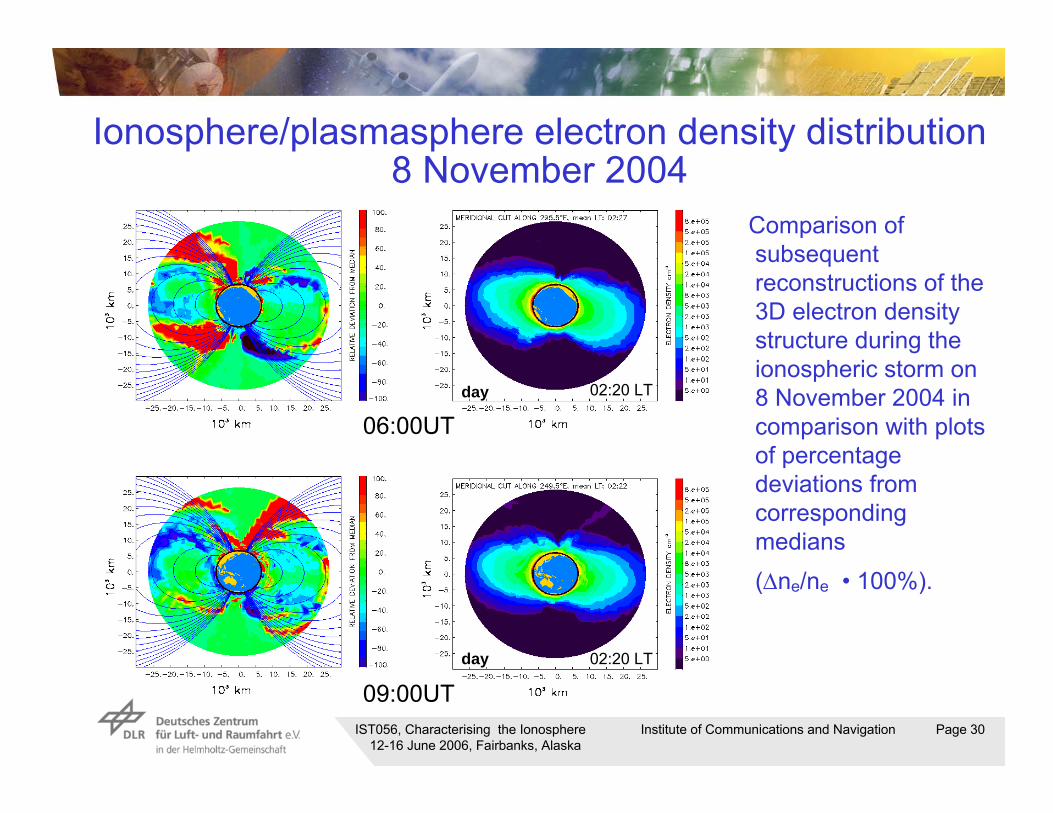
Comparison of subsequent reconstructions of the 3D electron density structure during the ionospheric storm on 8 November 2004 in comparison with plots of percentage deviations from corresponding medians (Δne/ne • 100%).
06:00UT
09:00UT
Ionosphere/plasmasphere electron density distribution8 November 2004
02:20 LT
02:20 LT
day
day

IST056, Characterising the Ionosphere Institute of Communications and Navigation Page 3112-16 June 2006, Fairbanks, Alaska
Positive deviation of the electron densityexceedingΔne/ne > 50%
Negative deviation of the electron densityexceeding| Δne/ne | > 50%
Storm in the topsideionosphere / plasmasphere startswith a positive phasefollowed by a negative phase
Response of the topside ionosphere/plasmasphereon the storm on 20/21 November 2003

IST056, Characterising the Ionosphere Institute of Communications and Navigation Page 3212-16 June 2006, Fairbanks, Alaska
Ionospheric Storm on 29 October 2003
Left panelGround basedTEC maps overNorth and South pole areas from18:00 – 23:00 UT
Right panelTopside electrondensityreconstructions at 20:13 UT
Ground Based GPS Space Based GPS
20:13 UT
North
South

IST056, Characterising the Ionosphere Institute of Communications and Navigation Page 3312-16 June 2006, Fairbanks, Alaska
Ionospheric Storm on 29 October 2003
Enhanced particle precipitation at Southern pole area indicated byvertical electron density profiles fromIRO Measurements onboard CHAMP
Inversion
CHAMP IRO data- 52.82°N; 164.73°E, 12:30 UT
20:10 UT
21:50 UT12:30 UT

IST056, Characterising the Ionosphere Institute of Communications and Navigation Page 3412-16 June 2006, Fairbanks, Alaska
SWACI Website – Data products access
Ground based dataWarningsMaps of
TEC Temporal gradientsLatitudinalgradientsLongitudinal gradients
Forecasts
Space Based dataElectron density
ProfilesTopsideReconstructions
http://www.kn.nz.dlr.de/swaci/

IST056, Characterising the Ionosphere Institute of Communications and Navigation Page 3512-16 June 2006, Fairbanks, Alaska
Summary & ConclusionsGPS sounding onboard LEO satellites is a powerful toolfor studying and modelling the ionosphere on global scaleThe CHAMP mission has produced a large data base:
since April 2001, ≈ 200,000 IRO profilessince July 2002, ≈ 21,000 Ionosphere/plasmasphere maps
Validation of IRO data continuesBasic ionospheric features are well reproduced in GPS soundingdata from CHAMPFuture developments shall include topside reconstructions + IRO Profiles + ground-based GPS data (TEC maps)Operational CHAMP ionosphere sounding data of both types areavailable via the internet by the SWACI service:http://www.kn.nz.dlr.de/swaci/

IST056, Characterising the Ionosphere Institute of Communications and Navigation Page 3612-16 June 2006, Fairbanks, Alaska
Acknowledgement
This work has been financially supported by the German State Government of Mecklenburg-Vorpommern under Grant V230-630-08-TIFA-334. We thank K. Tsybulya / IZMIRAN, Moscow and S. Heise/GFZ Potsdam for their help in preparing the presentation. The authors are grateful to the international CHAMP team for maintaining the operation and reception of the CHAMP satellite since 2000.